Article

Load Effect Analysis Method of Cable-Stayed Bridge for Long-Span Track Based on Adaptive Filtering Method

1
School of Civil Engineering and Architecture, Chongqing University of Science & Technology, Chongqing 400074, China
2
T. Y. Lin International Engineering Consulting (China) Co., Ltd., Chongqing 401121, China
3
Chongqing Key Laboratory of Energy Engineering Mechanics & Disaster Prevention and Mitigation, Chongqing University of Science & Technology, Chongqing 400074, China
*
Author to whom correspondence should be addressed.
Appl. Sci. 2024, 14(16), 7057; https://doi.org/10.3390/app14167057 (registering DOI)
Submission received: 30 June 2024 / Revised: 8 August 2024 / Accepted: 9 August 2024 / Published: 12 August 2024

Abstract

:
Aiming at the problems of large capacity, narrow transverse width, large excitation, high safety level, and difficulty in accurately grasping the working state of the cable-stayed bridge for the long-span track, this research obtains the structural response data in real time by establishing a health monitoring system. The adaptive filtering method was employed to separate the train load response and the temperature load response. Then, a train load effect analysis method based on the influence line and a temperature load effect analysis method based on the correlation were proposed to assess the operational status of the bridge in real time and objectively. The Chongqing Nanjimen Railway Track Bridge (hereinafter Chongqing Nanjimen track bridge) project was utilized as a case study to demonstrate the application of these methods. The results show that the adaptive filtering method can effectively separate the response of train and temperature loads. The normalized cross-correlation (NCC) results of the measured train load response and the influence line’s finite element calculation show a high degree of fit between the measured values and the theory, proving that no significant anomalies are found in the bridge. There is a strong correlation between the ambient temperature difference and the Pearson correlation coefficient of structural response, which indicates that the Chongqing Nanjimen track bridge is currently in normal working condition.

1. Introduction

As urbanization progresses, rail transit is undergoing a period of rapid development, with the construction of rail bridges in full swing. Cable-stayed bridges are becoming increasingly prevalent due to their distinctive shape, robust span capacity, and well-established construction technology.
The time-varying coupling of material property parameters, environmental factors, load action, and other factors makes the time-varying characteristics of the operation and maintenance state of the long-span track special bridge extremely complicated. Because of the characteristics of large traffic volume, narrow transverse width, large excitation, and high safety level, the working state of rail bridges is difficult to accurately control, especially for statically indeterminate rail cable-stayed bridges [1]. Meanwhile, the temperature of the bridge structure is not only subject to temporal fluctuations but also exhibits temperature disparities at all points within the structure. However, the temperature field is markedly uneven and a pronounced hysteresis phenomenon is evident. It is imperative to distinguish between load effects when evaluating the performance state of the bridge structure [2,3]. Therefore, it is important to figure out how to rely on a large amount of bridge measurement data, accurately perceive the changes in bridge performance after separating temperature effects, and quickly and accurately evaluate the working status of large-span bridges, ensuring the safety of the bridge during its service stage. It is an urgent and difficult issue that the engineering community needs to overcome [4].
Scholars at home and abroad have made useful explorations in analyzing bridge structural performance and load effect. Chen Fang et al. [5] proposed a web-based and design-oriented structural health assessment system (SHES) for long-span bridges equipped with long-term structural health monitoring systems. Mosbeh R. Kaloop et al. [6] investigated using output-only structural health monitoring (SHM) to evaluate the reliability and safety of highway steel plate beams of Yuanxiao Bridge. Displacement, strain, and acceleration measurements are used to assess the behavior of the bridge under designed static, semi-static, and dynamic truck load effects. Chuang Chen et al. [7] designed and installed a long-term structural health monitoring system to monitor the behavior of the bridge during the huge fluctuations in temperature between summer and winter. X.Y.Li et al. [8] analyzed the data recorded by the suspension bridge structural health monitoring system (SHM) and developed a series of indicators for evaluating future changes in the structure’s health status. Bjørn T. Svendsen et al. [9] proposed a data-based damage detection method for steel bridges, which obtained data from real bridges under different structural conditions and applied an unsupervised machine learning algorithm to evaluate the most detectable damage types. Ju Hanwen et al. [10] proposed a calculation method for vehicle-mounted impact parameters based on the deflection influence line. A correlation model of vehicle-mounted impact parameters, ambient temperature, and bridge deflection was established based on the GRU neural network. Li Xiaogang et al. [11] analyzed domestic and foreign norms and standards and proposed evaluation criteria for the service performance of long-span track bridges. Chenyu Zhou et al. [12] introduced an FE(finite element)-based adaptive enhanced Kalman filter (AAKF) B-WIM framework and adopted a new adaptive noise filter optimized by a genetic algorithm to realize accurate load recognition by combining finite element (FE) model update and bridge motion weighing (B-WIM). Premjeet Singh et al. [13] proposed a bridge state assessment technology, which used the vibration data collected by sensors, combined natural excitation technology (NExT) and empirical Fourier decomposition (EFD), and adopted a hybrid method to analyze the environmental vibration data of bridges and identify the bridge state for assessment. To separate vehicle-induced strain components from strain monitoring signals mixed with various loads, Danhui Dan et al. [14] proposed an online recursive sliding variational mode decomposition method. T. Hielscher et al. [15] proposed a robust end-to-end optical fiber sensor (FOS) monitoring prototype based on deep neural networks to convert FOS strain output into an interactive digital twin (DT) visualization in response to the scale of structural deterioration worldwide and the ineffectiveness of existing non-destructive assessment techniques. Xun Liu et al. [16] proposed a new method of real-time time-varying cable force identification. The method updates the cable vibration signal by sliding the window and uses adaptive chirped mode decomposition (ACMD) to identify the instantaneous frequency of the cable. Xiang Xu et al. [17] proposed a probabilistic anomaly detection method considering the uncertainty model, aiming at the multi-stage uncertainty modeling problem in the anomaly detection process of long-span bridges. To provide researchers with a clear perspective on the field of health monitoring, Anis Shafiqah Azhar et al. [18] reviewed the methods previously studied in the vibration characterization of SHM bridges. The future potential of the vibration-based approach as a structural characterization solution is significant, providing state-of-the-art data-driven measures for damage detection. The increased robustness of SHM also provides room for progress in the precise quantification and interpretation of vibration-based techniques, providing a way for future research to extend the vibration-based frontier. To sum up, scholars at home and abroad have conducted in-depth studies in the fields of bridge health monitoring systems and bridge condition evaluation, with fruitful results. However, there is little research on the load effect analysis of large-span dedicated track bridges based on health monitoring systems.
In view of this, this paper proposes the establishment of a dedicated track bridge health monitoring system with the objective of acquiring structural response data in real time. To address the specific characteristics of high frequency, large response, and periodicity of the train load effect, an adaptive filtering method is put forth to differentiate between train load and temperature load. The proposed system is validated through a real bridge test conducted on the Chongqing Nanjimen track bridge. The vertical displacement of the main beam, the longitudinal displacement of the main tower, and the stress of the main beam under the action of the train are studied and compared with the numerical simulation results. Meanwhile, the influence of ambient temperature on the aforementioned variables is analyzed. A linear regression equation was fitted by the least squares method, and the correlation strength and direction were determined by the Pearson correlation coefficient. Finally, the load effect analysis of the bridge was completed, providing scientific and technical support for the maintenance of the bridge in a healthy manner.

2. Project and Finite Element

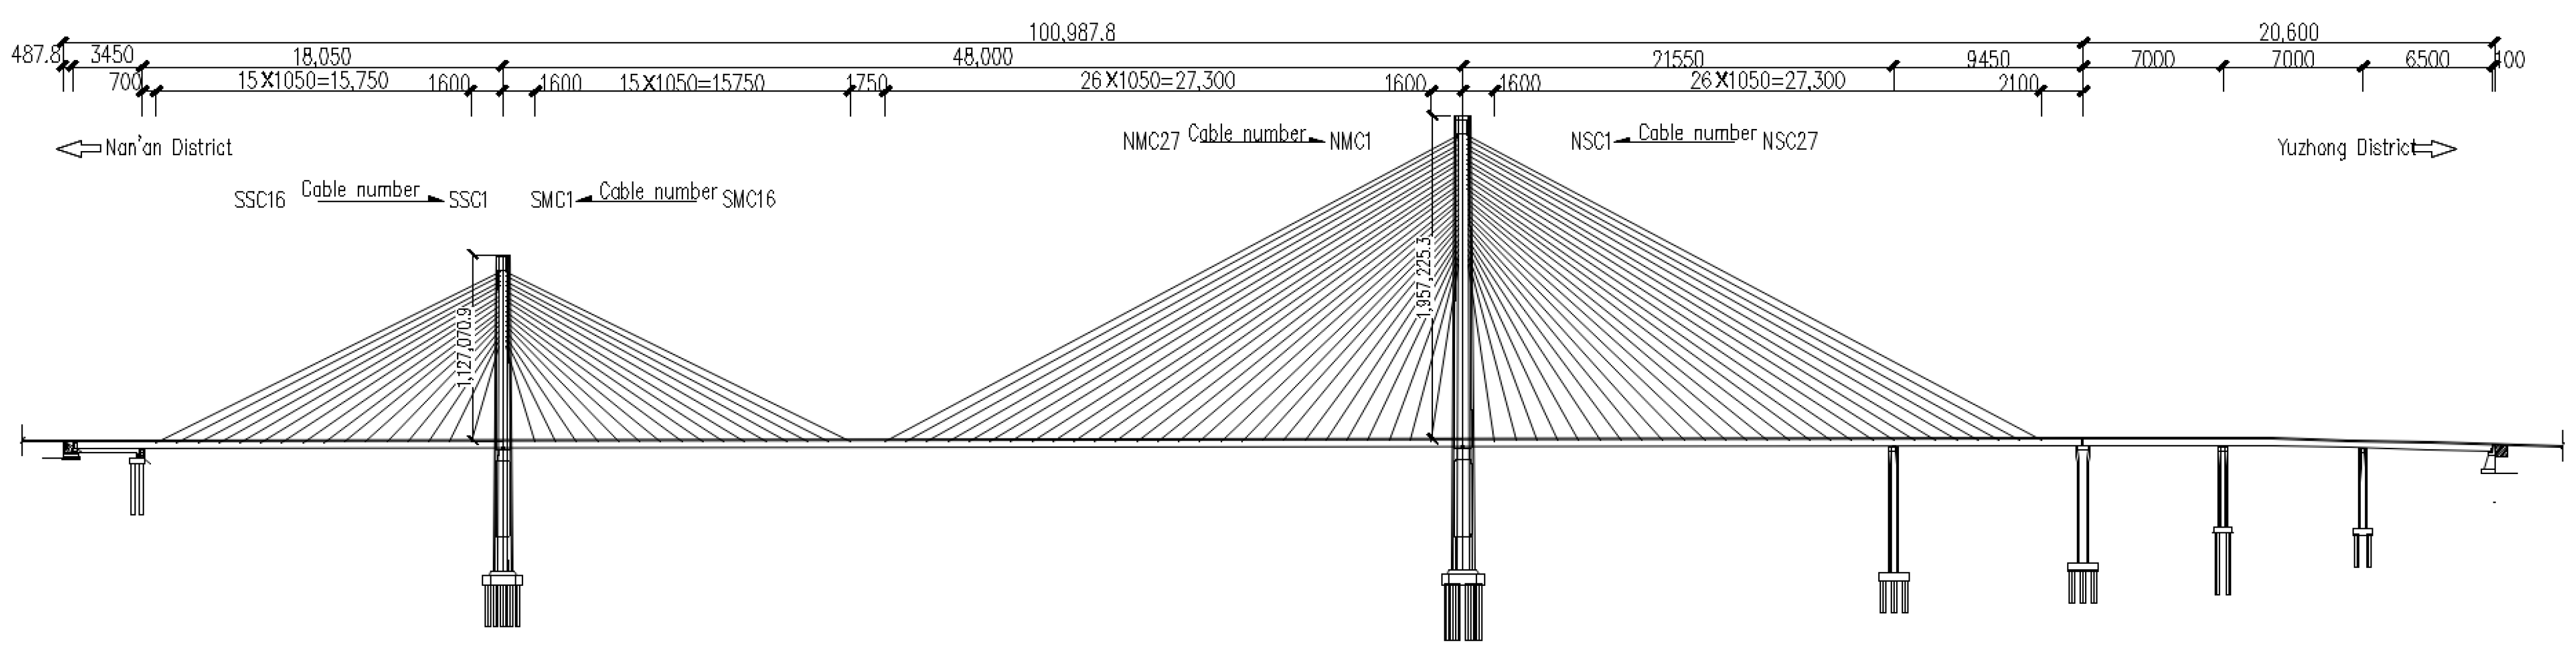
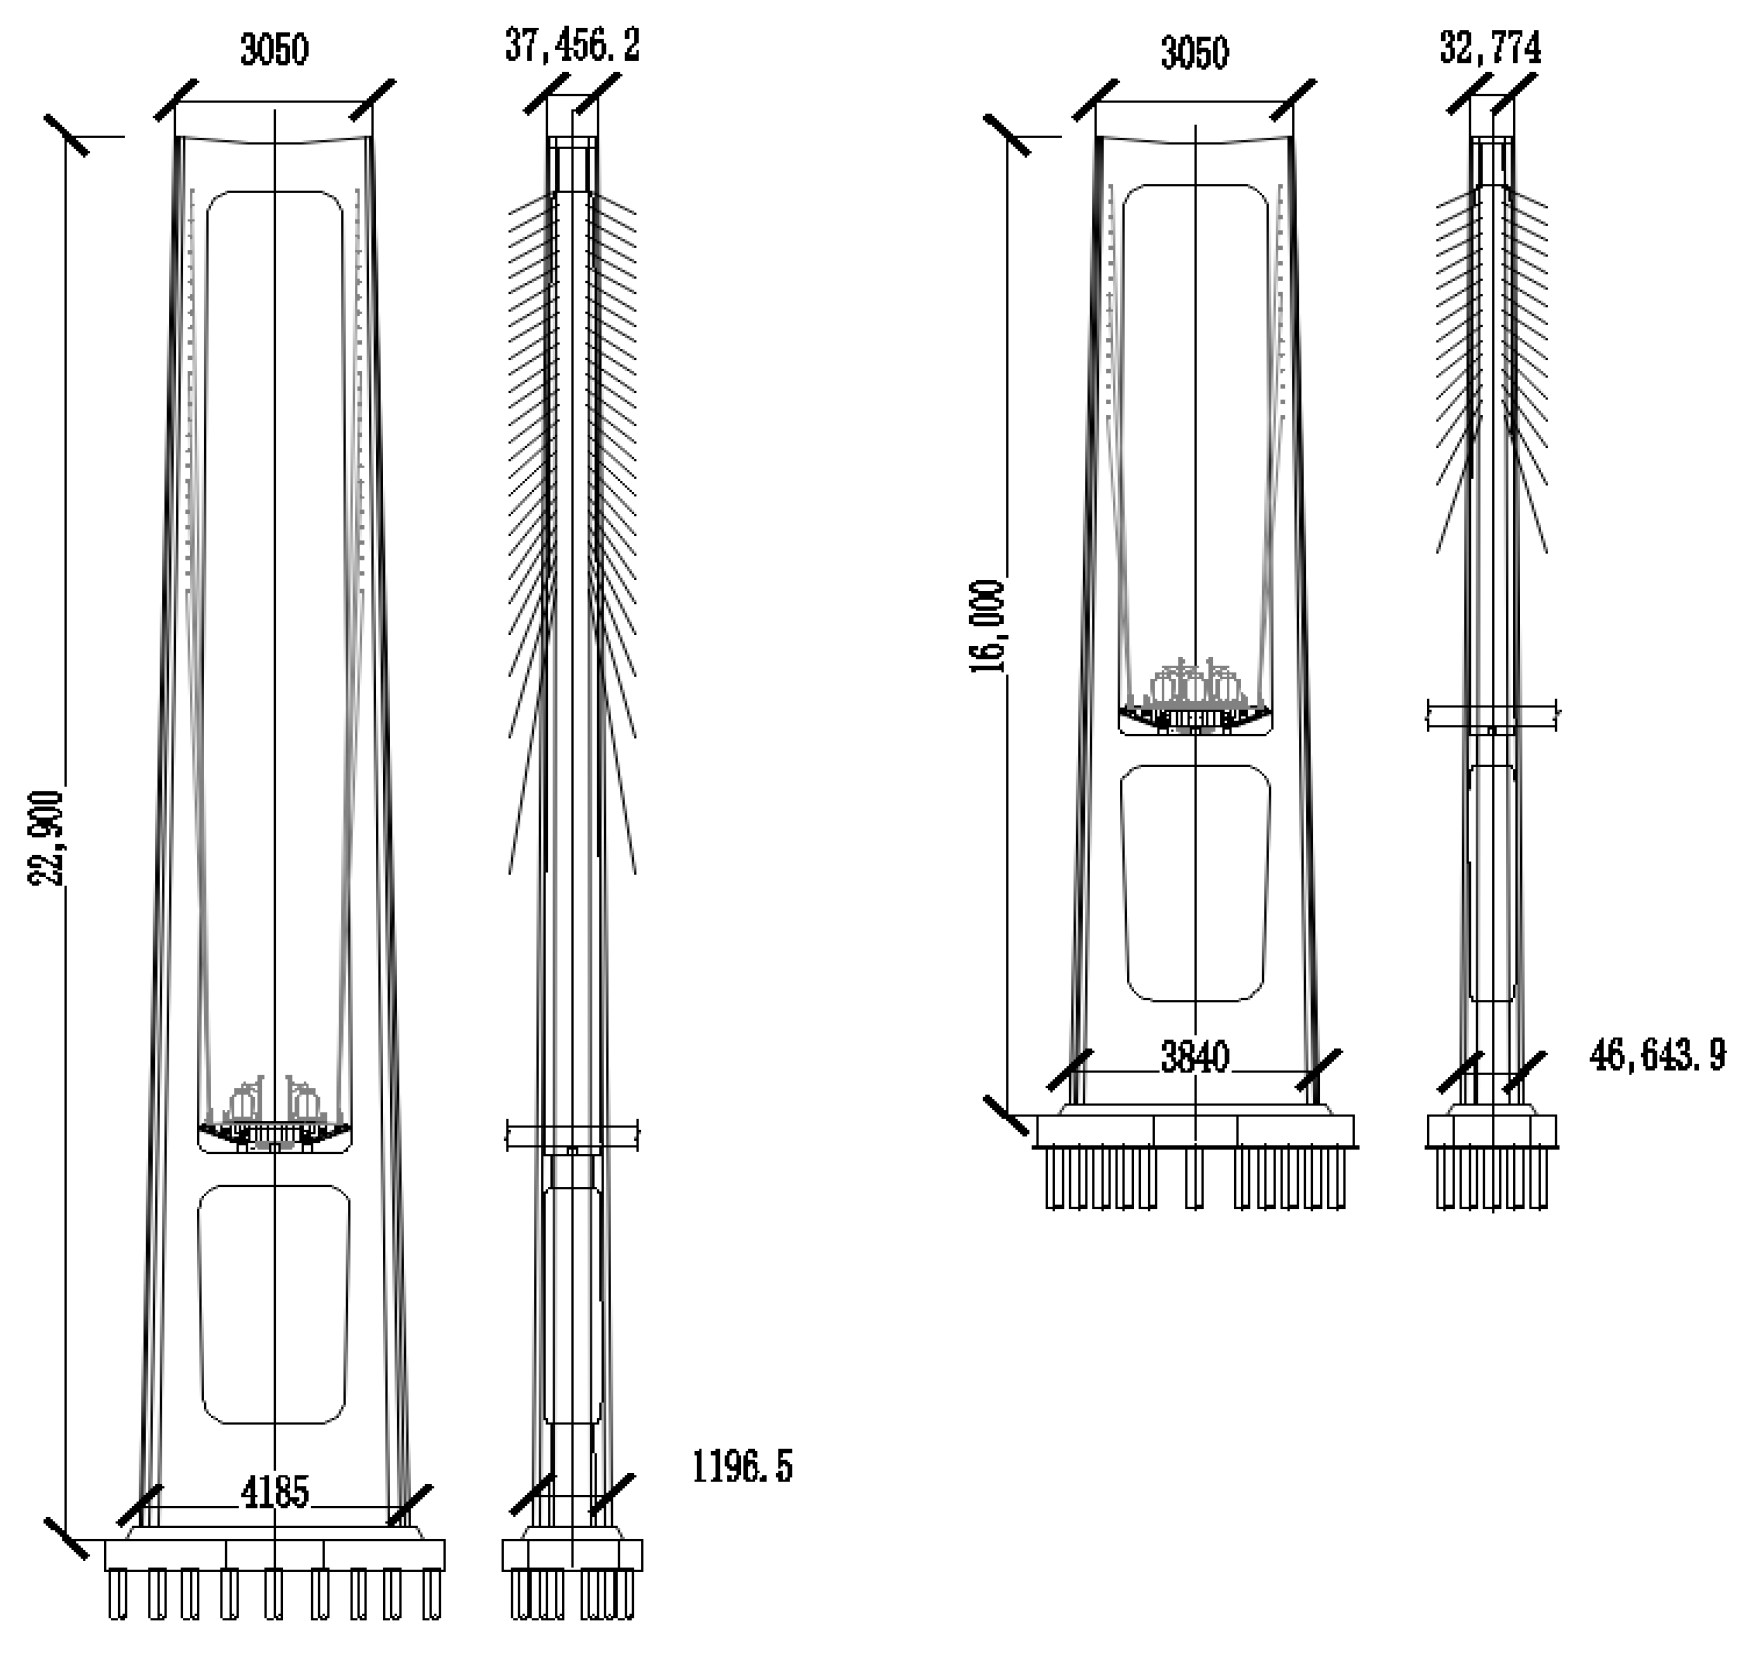
2.1. Project Overview

The Chongqing Nanjimen track bridge is the key control engineering of the second phase of Chongqing Rail Transit Line 10, and it is the world’s largest span railway special cable-stayed bridge. The main bridge adopts a five-span high–low tower double-cable-plane semi-floating system cable-stayed bridge. The longitudinal arrangement is 34.5 + 180.5 + 480 + 215.5 + 94.5 = 1005.0 m, and the cross-sectional arrangement is 2.8 m (cable area and access road) + 16.2 m (track zone) + 2.8 m (cable area and access road) = 21.8 m (without air nozzles). The main beam is of a steel-hybrid type, with a height of 3.3 m. The main structure of the steel beam is of the Q345qD variety, while the prefabricated bridge panel is of the C60 concrete variety. The main tower is constructed using a door frame structure comprising upper, middle, and lower beams. The P2 tower is 158 m tall, while the P3 tower is 227 m tall. The material used for the construction of these towers is C50 concrete. There are 16 pairs of cable-stayed cables at the P2 tower side and 27 pairs of cable-stayed cables at the P3 tower side. The cable-stayed cables are HDPE-sheathed with Φ7.0 mm galvanized high-strength and low-relaxation parallel steel wire. The tensile strength is not less than 1770 Mpa, and the tensile elastic modulus is not less than 195 GPa. Figure 1, Figure 2 and Figure 3 show the overall layout of the bridge. The design of the special bridge for Chongqing Nanjimen track bridge adopts a train, with 6 sections in the near term and 7 sections in the long term. The axle weight is 150 kN, and the train loading is shown in Figure 4.

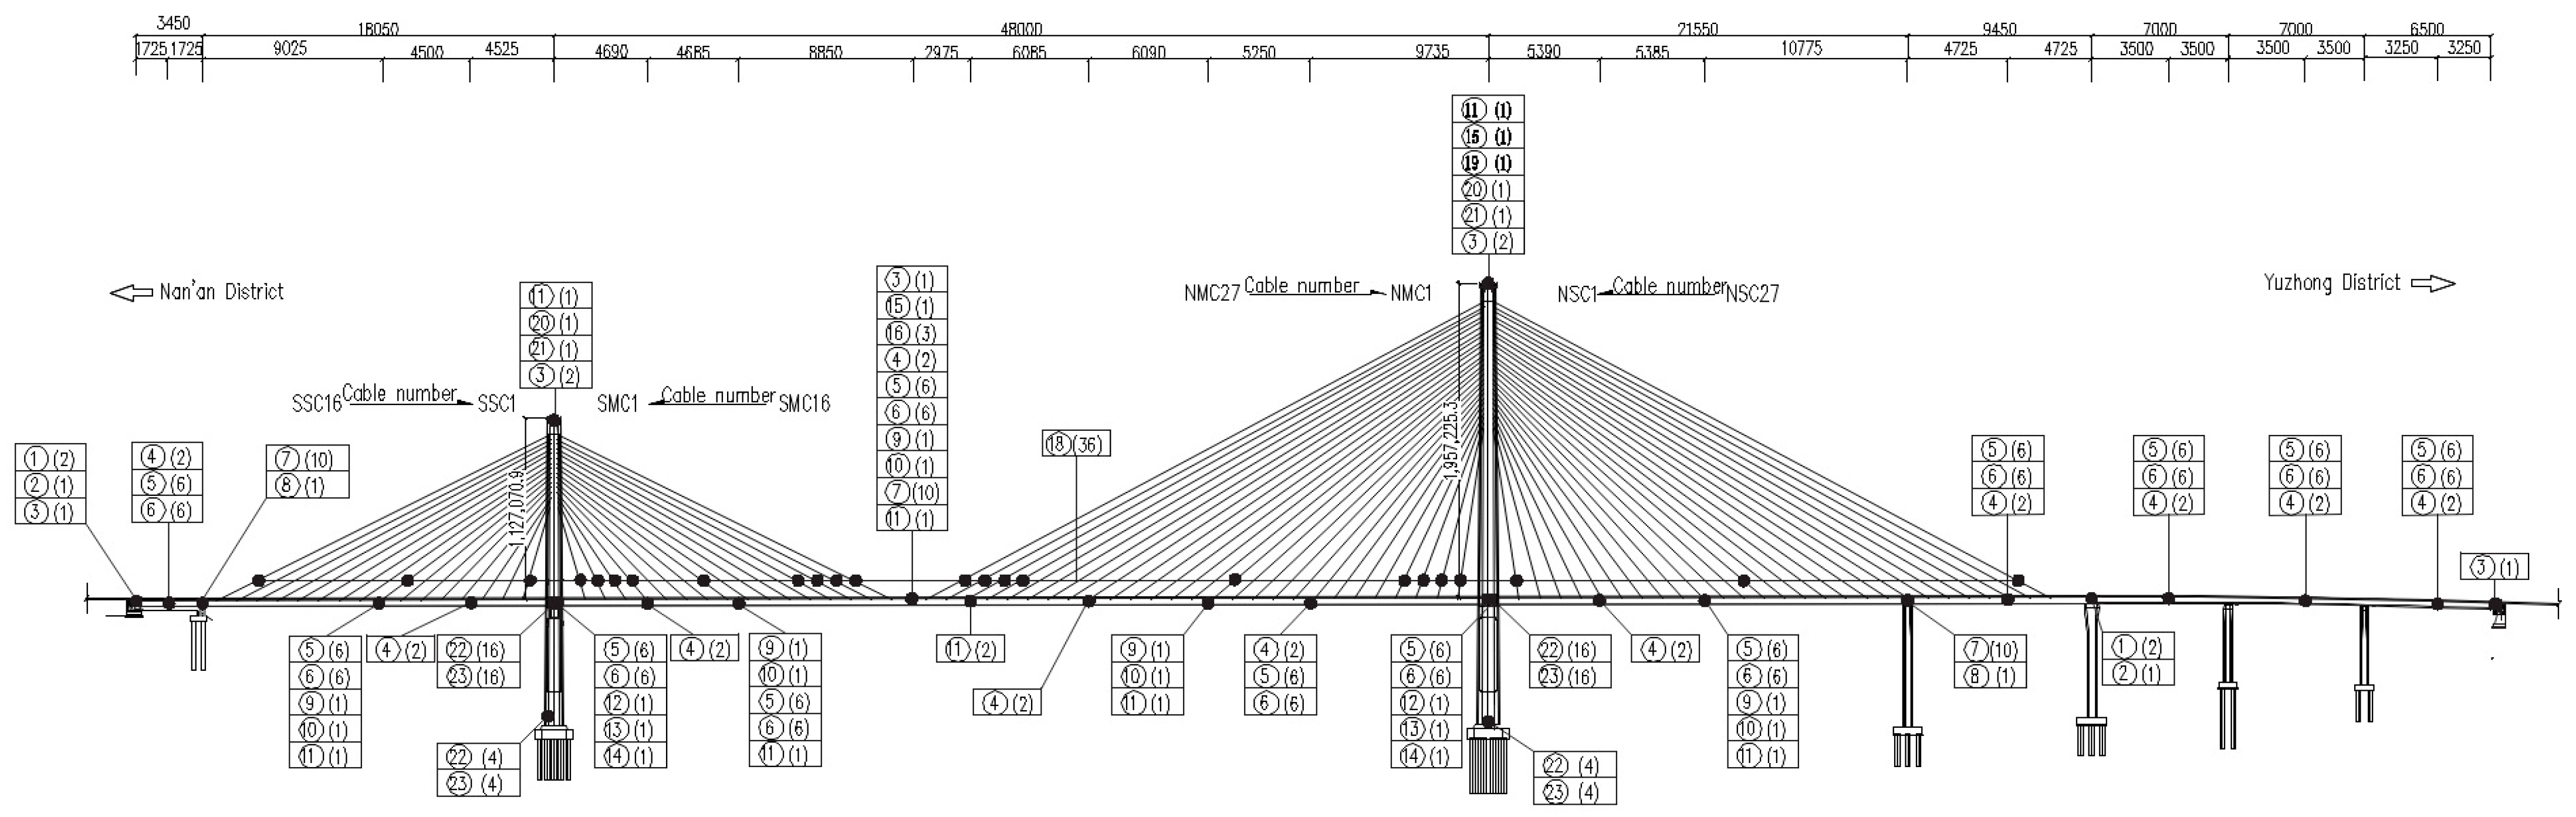
2.2. Health Monitoring System

The health monitoring system of the Chongqing Nanjimen track bridge structure is composed of five parts: 1. sensor module, 2. application module, 3. data analysis module, 4. data processing and management module, 5. data acquisition and transmission module. The overall distributed architecture (SOA) is the main one, and each component (subsystem) supports cluster deployment [19,20,21]. The system takes load and environment, overall static and dynamic response of the structure, and local response of the structure as the main monitoring categories, including temperature and humidity, wind speed and direction, vibration, deformation (displacement), angle, stress, cable force, and other monitoring items. The specific layout is shown in Figure 5 and details of the device of Figure 5 are shown in Table 1.

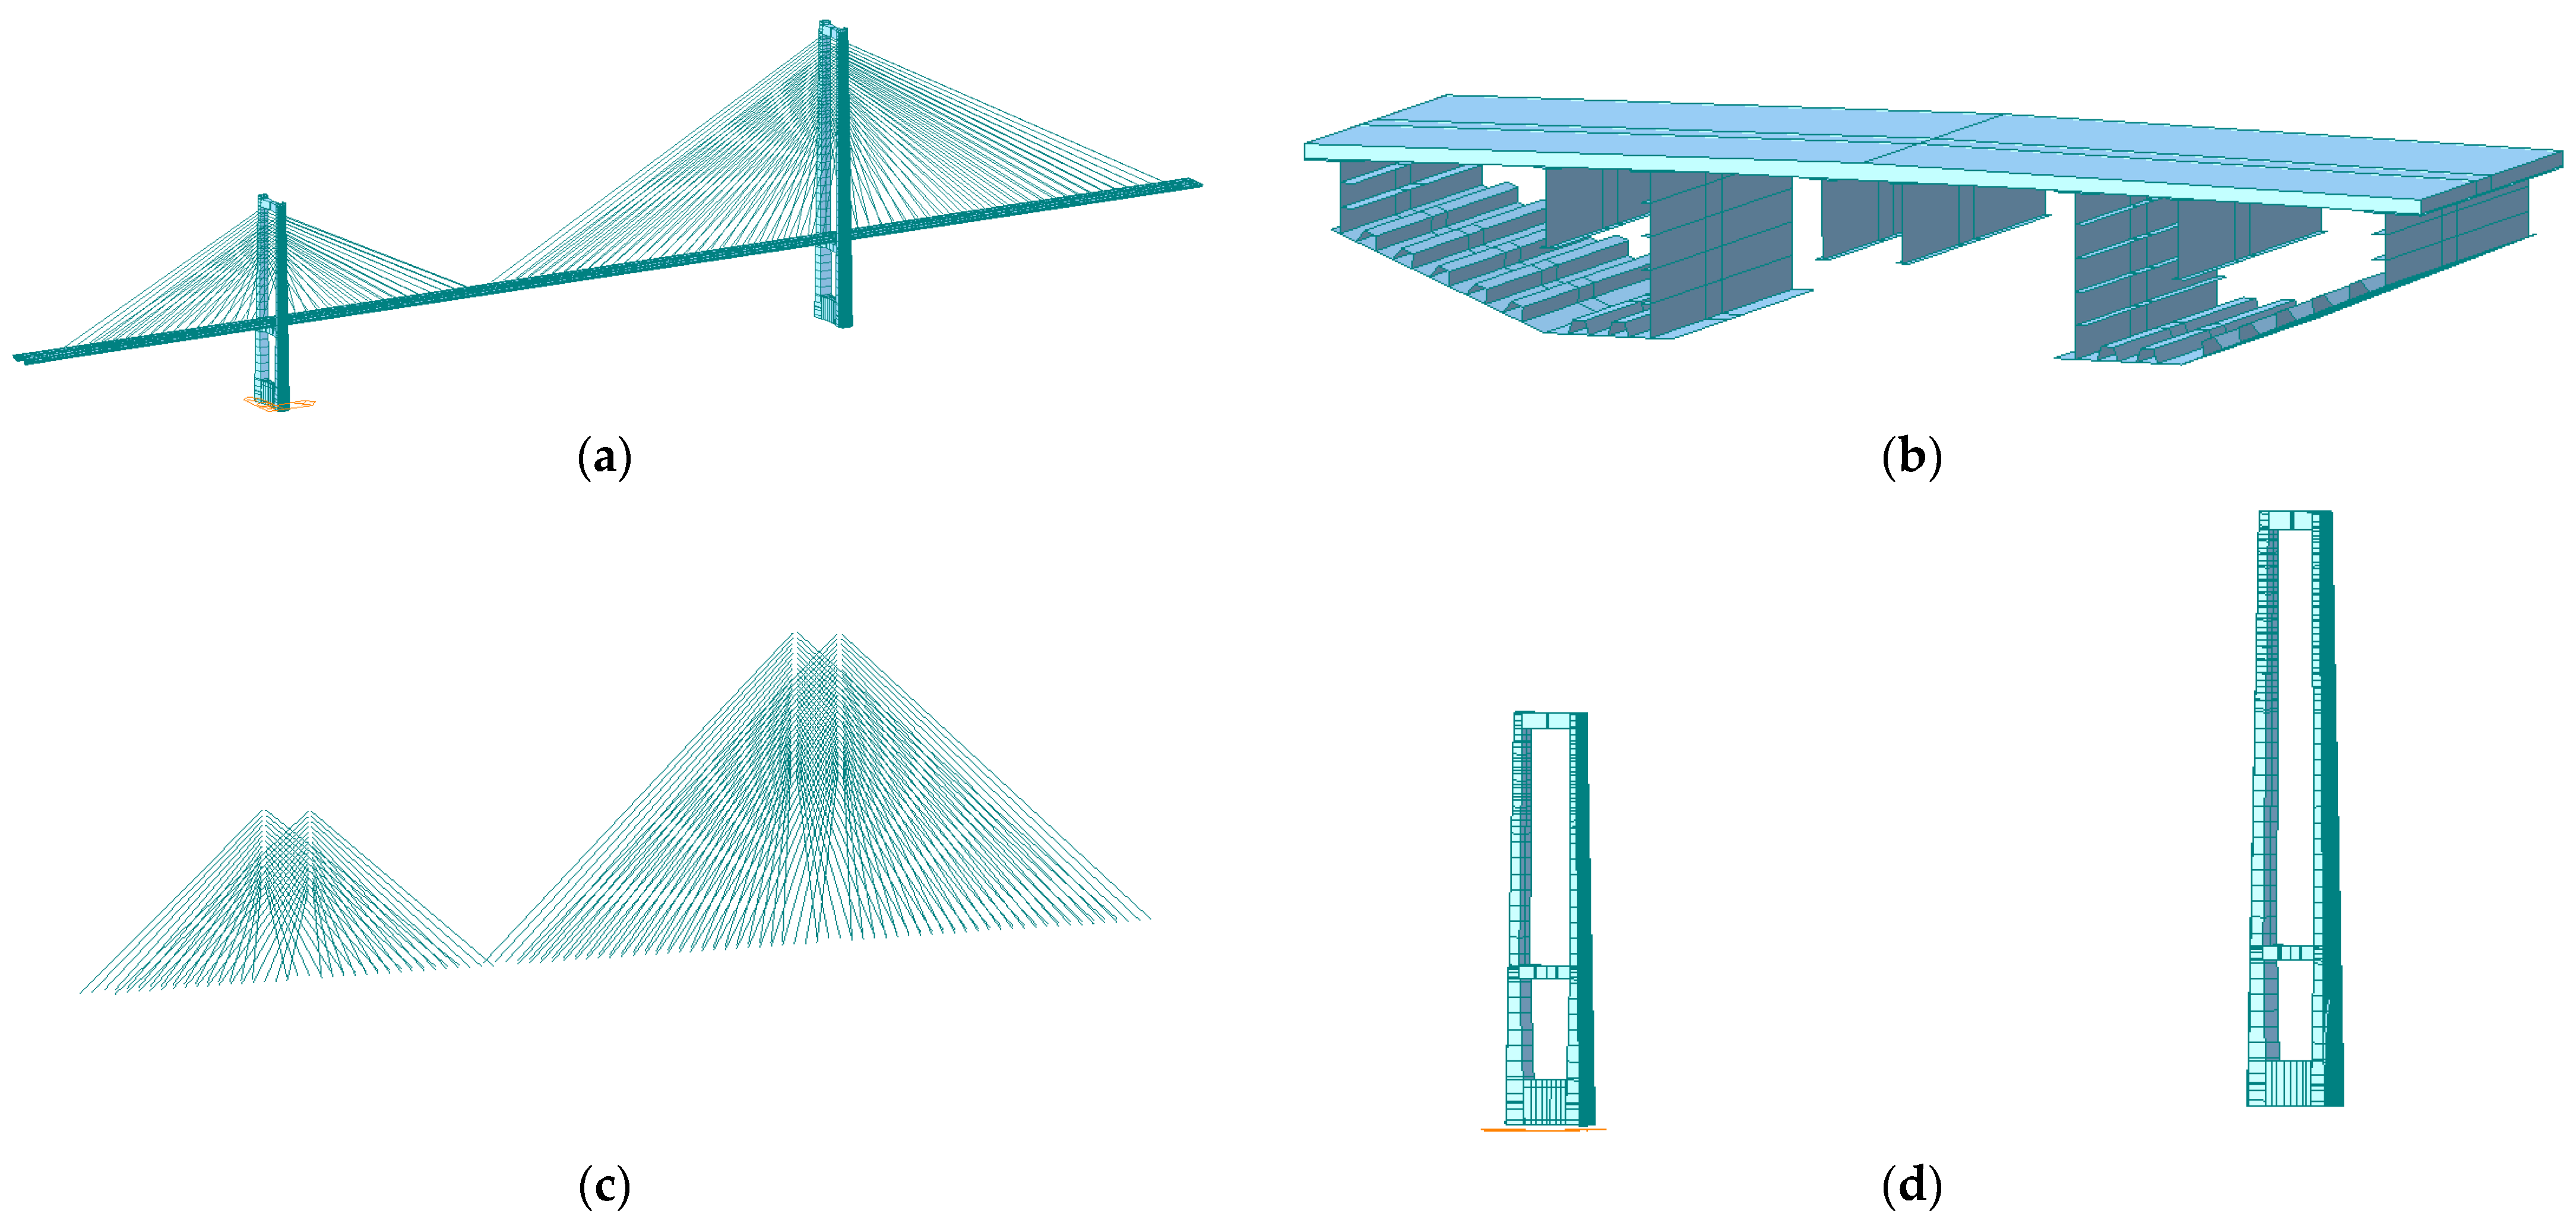
2.3. Finite Element Analysis

The general software MIDAS/Civil 2023 was used for the finite element analysis of Chongqing Nanjimen track bridge. There were 1085 nodes and 1504 units in the whole bridge, among which the inclined main tower and main beam were simulated by beam elements; the minimum length of the unit was 0.2 m, and a total of 1128 beam elements were simulated by the cable-stayed cable-only tension element. There was a total of 376 tension-only units. The bridge panels and main beams are simulated by the dual unit method. The bridge panels are made of C60 concrete with a 36,500 MPa elastic model; the bridge towers are made of C50 concrete with a 35,500 MPa elastic model; the steel beams are made of Q345qD steel with a 210,000 MPa elastic model, and the cable is made of 205,000 MPa galvanized high-strength low-relaxation galvanized parallel wire strands. The cable anchorage adopts a rigid connection; the bottom of the main tower adopts a general support solid connection, and the boundary constraint between the main beam and the main tower and bridge pier is an elastic connection. Train motion modeling method: Firstly, the axle load and distance of the vehicle load and the position of the left and right lanes are defined and the correlation between the two is established by defining the moving load condition. The number of iterations of load conditions is set to 20, and the convergence error is 0.001. The time-varying effect mainly considers creep, and the number of creep iteration calculations is set to 5 times, and the convergence error is 0.01. In the calculation of nonlinear analysis, the maximum number of iterations in each load step is set by the convergence criterion, which is 150 times, and the convergence error is 0.01. In the construction phase, nonlinear analysis and time-varying effect are considered, tangential assembly is considered for the main beam, and the cable force of the cable is controlled by external force, as shown in Figure 6.

3. Load Effect Analysis Method

The real-time structural response information obtained by the health monitoring system of the Chongqing Nanjimen track bridge is a composite value, including the train load effect, temperature load effect, and deterioration effect, wherein deterioration effect [22,23] is a long-term process, including shrinkage and creep of concrete, corrosion and rust of steel bars, etc. The response data obtained by the health monitoring system are real-time data, which are mainly affected by train load and temperature effect. Therefore, the deterioration effect cannot be considered in load effect analysis. Considering that the signal frequency and amplitude of the train load effect and the temperature load effect are different, this paper adopts an adaptive filtering method to separate the train action from the temperature load effect. The specific principle is as follows:
  • According to the period T of the train crossing the bridge and the monitoring data acquisition frequency V , the number of data samples N = T . V required for analysis is determined.
  • When the number of data samples N reaches the minimum value f m i n and the median value f z of the data sample is obtained, where data sample f generally refers to structural stress, displacement, and cable force. If f m i n = f z , the program preliminarily determines it as the train load effect data.
  • Based on the finite element model, the calculated value f m under train load is obtained, and the limit value f m = k f m f is set, where k is less than 1. The specific value is determined by the sample data, and the initial value f c of the sample is obtained. If f m i n f c f m , it is confirmed that these data samples N are train load effect data.
  • After the train load effect data are extracted, the initial sample value f c is subtracted to carry out initialization processing and remove the influence of temperature load.
Taking the vertical displacement of the main beam at the mid-span of the Chongqing Nanjimen track bridge on 1 November 2023 as an example, the train load effect and temperature load effect are separated through the above steps and the results are shown in Figure 7, Figure 8 and Figure 9.
It can be seen from Figure 7, Figure 8 and Figure 9 that the signal separation method proposed in this paper is effective. At 16:50:49, the deflection caused by the train load is −88.3 mm, the deflection caused by the temperature load is −179.9 mm, while the measured vertical displacement of the main beam is −266.7 mm, with an error of 0.56%. At 3:24:00, the deflection generated by the train load is 0 mm, the deflection generated by the temperature load is −51.5 mm, while the measured vertical displacement value of the main beam is −50.0 mm, with an error of 3.0%, meeting the requirements.
In conclusion, the composite structural response data derived from the health monitoring system are inadequate for the accurate and effective evaluation of bridge behavior. To achieve load effect analysis, it is essential to differentiate between the train load and temperature load and utilize the data after the temperature effect has been isolated for targeted analysis of the operational state of the bridge under the influence of the train. This will facilitate the assessment of the bridge’s performance and provide technical support for the scientific management and maintenance of the bridge.

4. Load Effect Separation Experiment

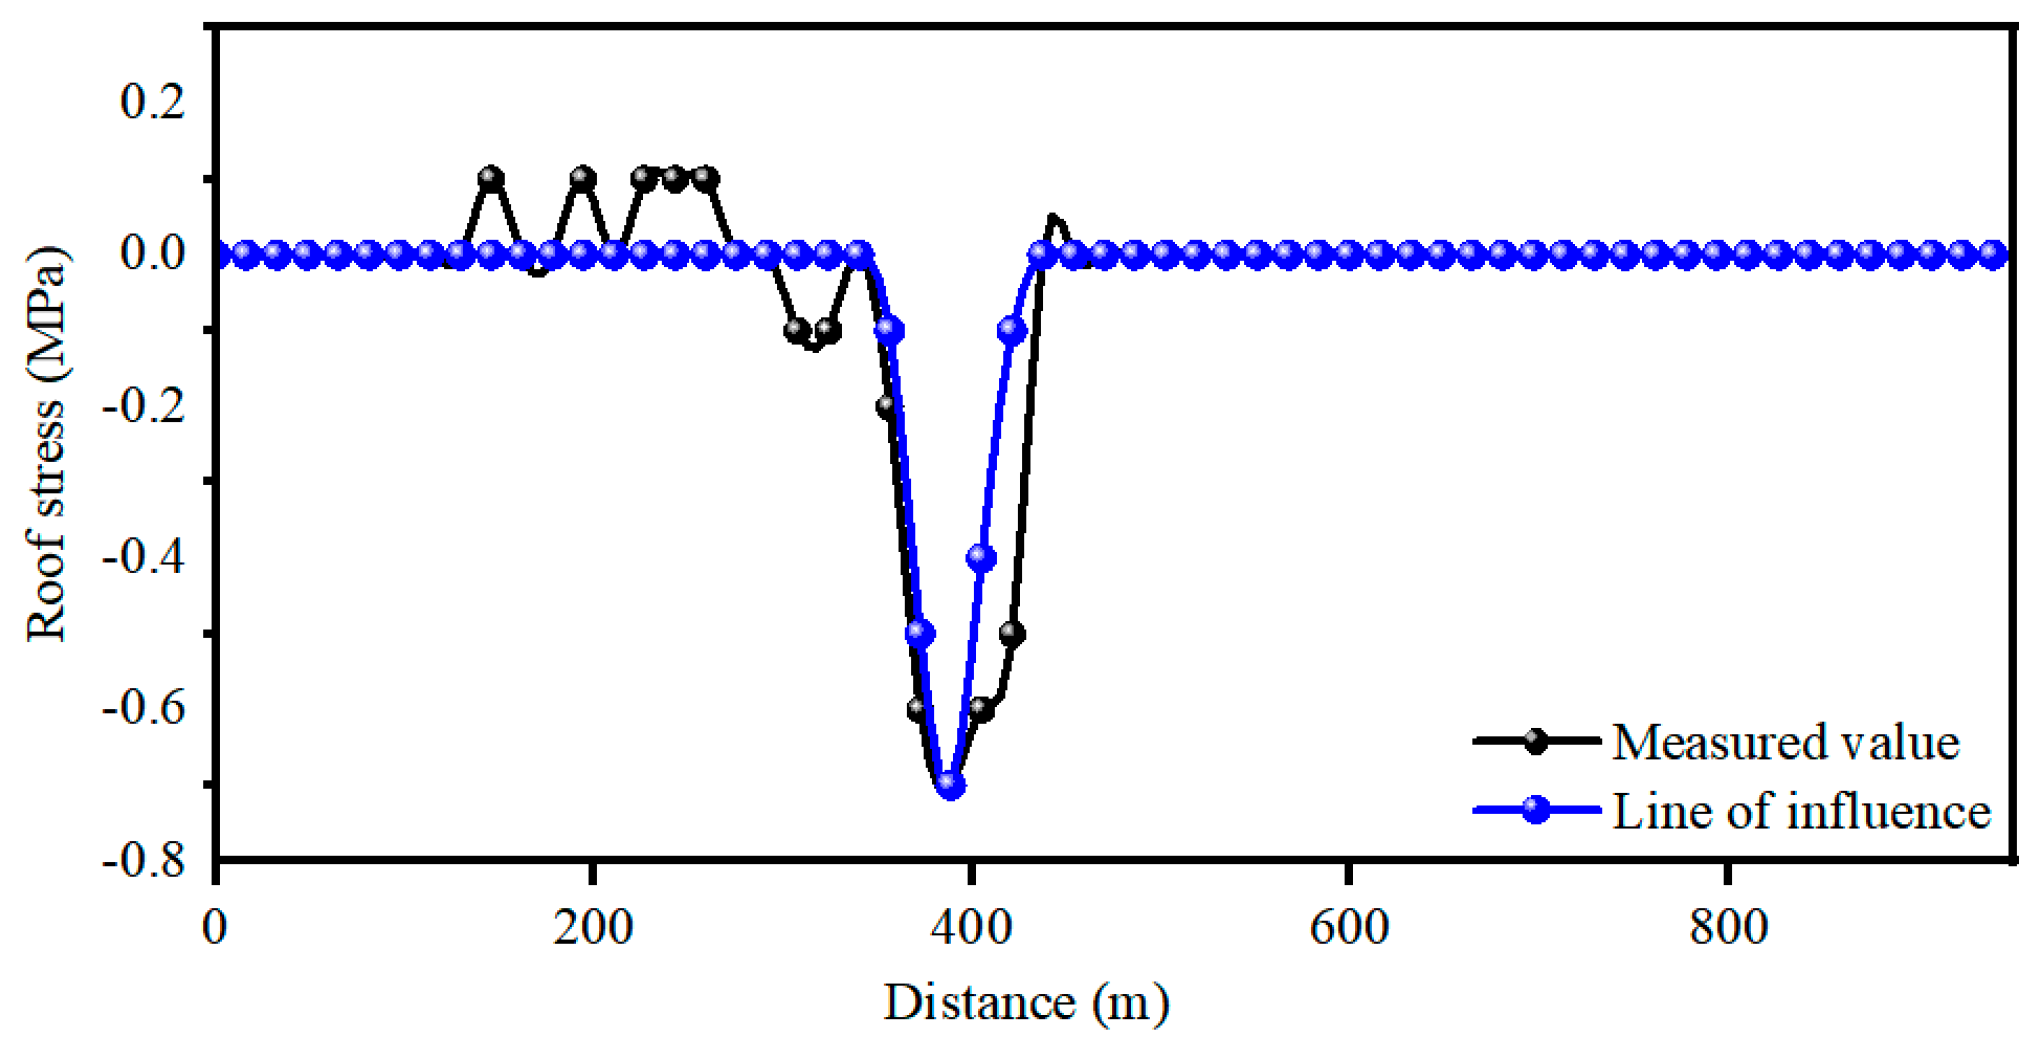
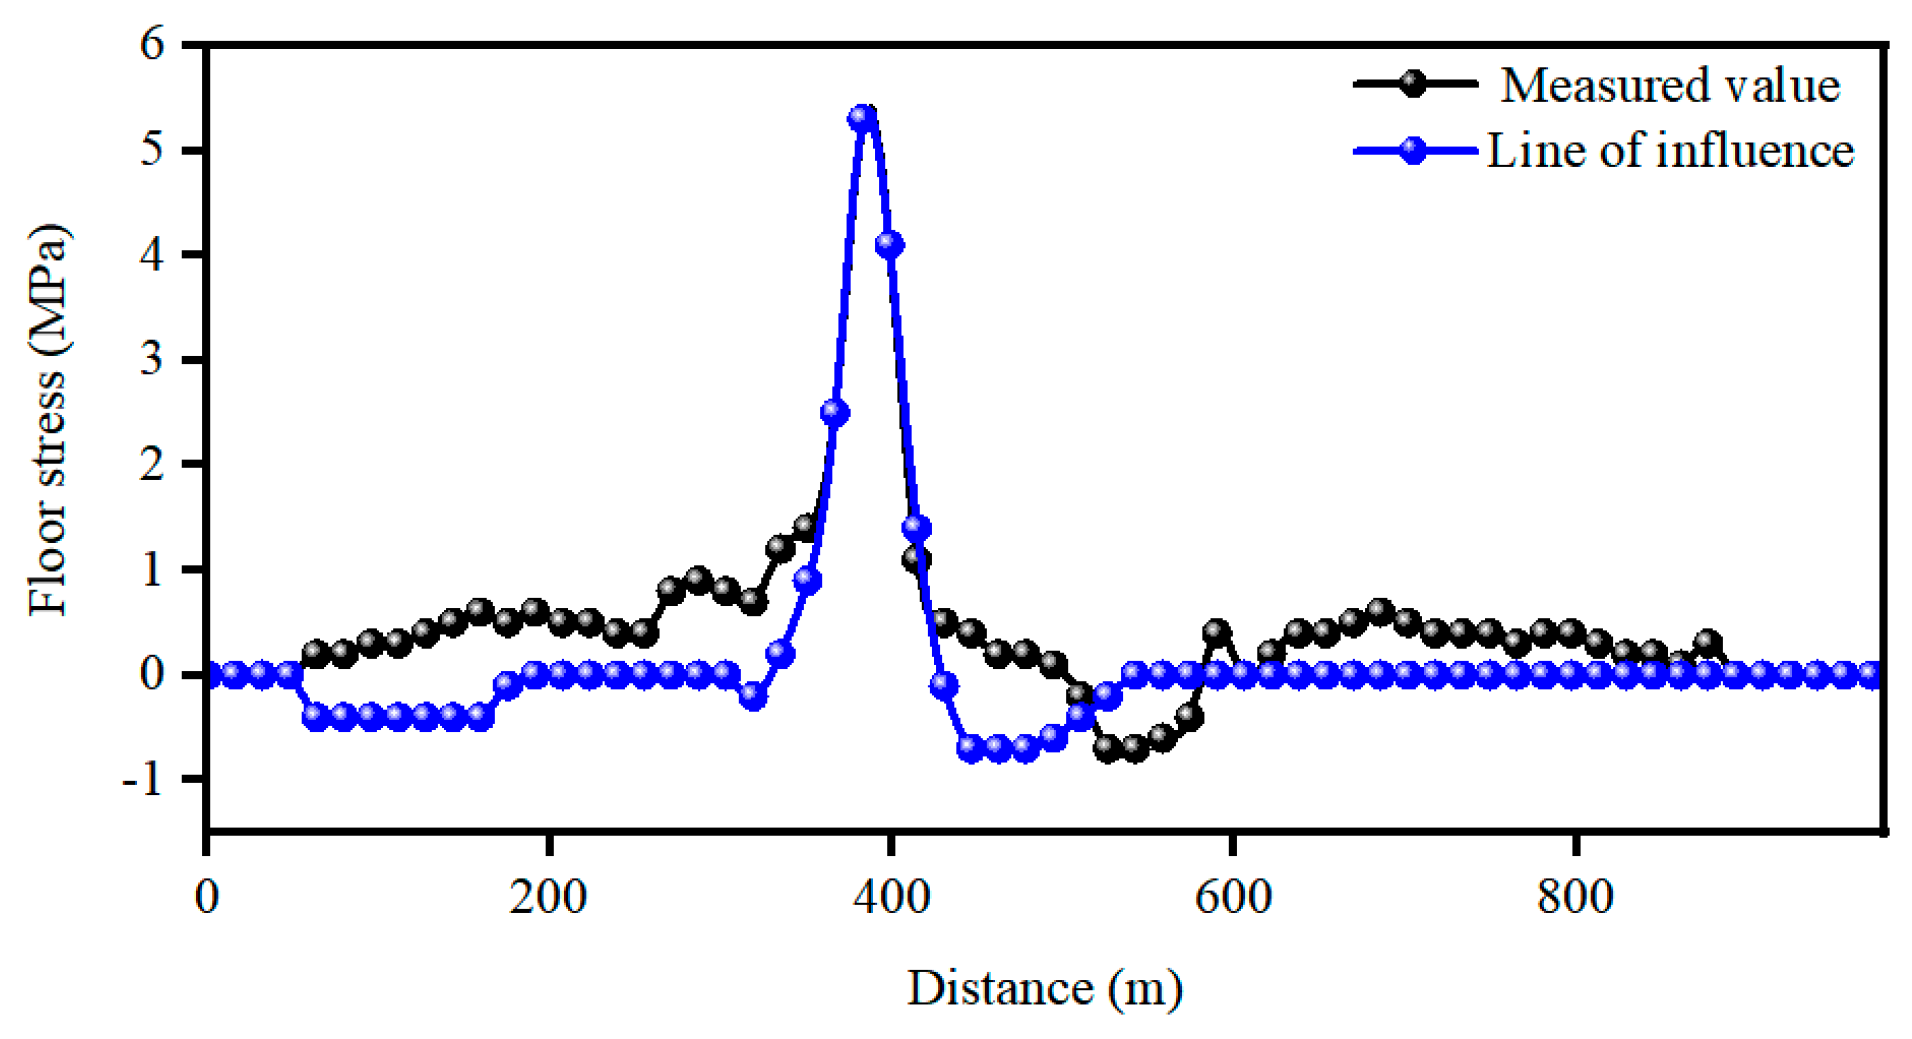
4.1. Analysis of Train Load Effect Based on Influence Line

The stiffness or elastic modulus of the bridge structure will change after damage. As an inherent characteristic of the bridge, the influence line [24,25,26,27,28,29] will also have different degrees of influence with the change in the structural characteristics of the bridge.
The Chongqing Nanjimen track bridge’s health monitoring system enables the real-time acquisition of response data, including vertical displacement of the main beam, longitudinal displacement of the main tower, and stress of the main beam, during the operation of a train. Considering that the train is running at a constant speed during the crossing of the bridge (the impact of different speeds is minimal) and the duration is brief (the effect of temperature and wind is stable), bridge influence lines of various indexes can be obtained through monitoring data analysis and compared with the finite element analysis results to achieve a bridge state assessment. The analysis results are shown in Figure 10, Figure 11, Figure 12, Figure 13 and Figure 14.
As can be seen from Figure 10, Figure 11, Figure 12, Figure 13 and Figure 14, based on the response data such as vertical displacement of the main beam, longitudinal displacement of the main tower, and stress of the main beam collected by the health monitoring system of the Chongqing Nanjimen track bridge, the temperature load is removed by the above separation method and the response data under the action of the train load are obtained. A comparison of the influence line obtained by Midas/Civil 2023 simulation with the measured maximum vertical displacement of the main beam reveals that the measured maximum vertical displacement of the main beam is 92.00 mm and the theoretical maximum is 92.4 mm, both of which occur at 67.80 m from the left side of the span. The measured maximum longitudinal displacement of the P2 main tower is 34.00 mm, and the theoretical maximum is 34.4 mm, both of which occur at 106.28 m from the left side of the span. The measured maximum longitudinal displacement of the P3 main tower is 18.80 mm, and the theoretical maximum is 19.20 mm, both of which occur at 11.42 m from the left side of the span. The measured maximum stress of the main beam roof is −0.70 Mpa, and the theoretical maximum stress is −0.70 Mpa at 67.80 m from the left side of the span. The measured maximum stress of the main beam floor is 3.80 Mpa; the theoretical maximum stress is −0.70 Mpa, and the stress is 9.32 m from the left side of the span.
Meanwhile, normalized cross-correlation (NCC) was employed to assess the degree of similarity between the two entities [30,31].
For each lag (k), we calculated the number of normalized cross-relations:
R ( k ) = i = 1 n ( y 1 ( i ) y ¯ 1 ) · ( y 2 ( i + k n ) y ¯ 2 ) i = 1 n ( y 1 ( i ) y ¯ 1 ) 2 · i = 1 n ( y 2 ( i + k n ) y ¯ 2 ) 2
where
n—Sample size;
y ¯ 1 y ¯ 2 —Mean of samples y 1 and y 2 , respectively.
The larger the NCC value, the better the fitting. As can be seen from Table 2, the normalized cross-correlation values are 0.9457, 0.9531, 0.8873, 0.9098, and 0.9101 indicating a high degree of fitting between the measured values and the theory. In summary, the structural response under train load and the influence line results of finite element calculation have small errors and a high fitting degree and no significant anomalies are found on the bridge, which proves that the data obtained through the health monitoring system can achieve the load effect analysis of the bridge and provide technical support for the scientific management and maintenance of the bridge.

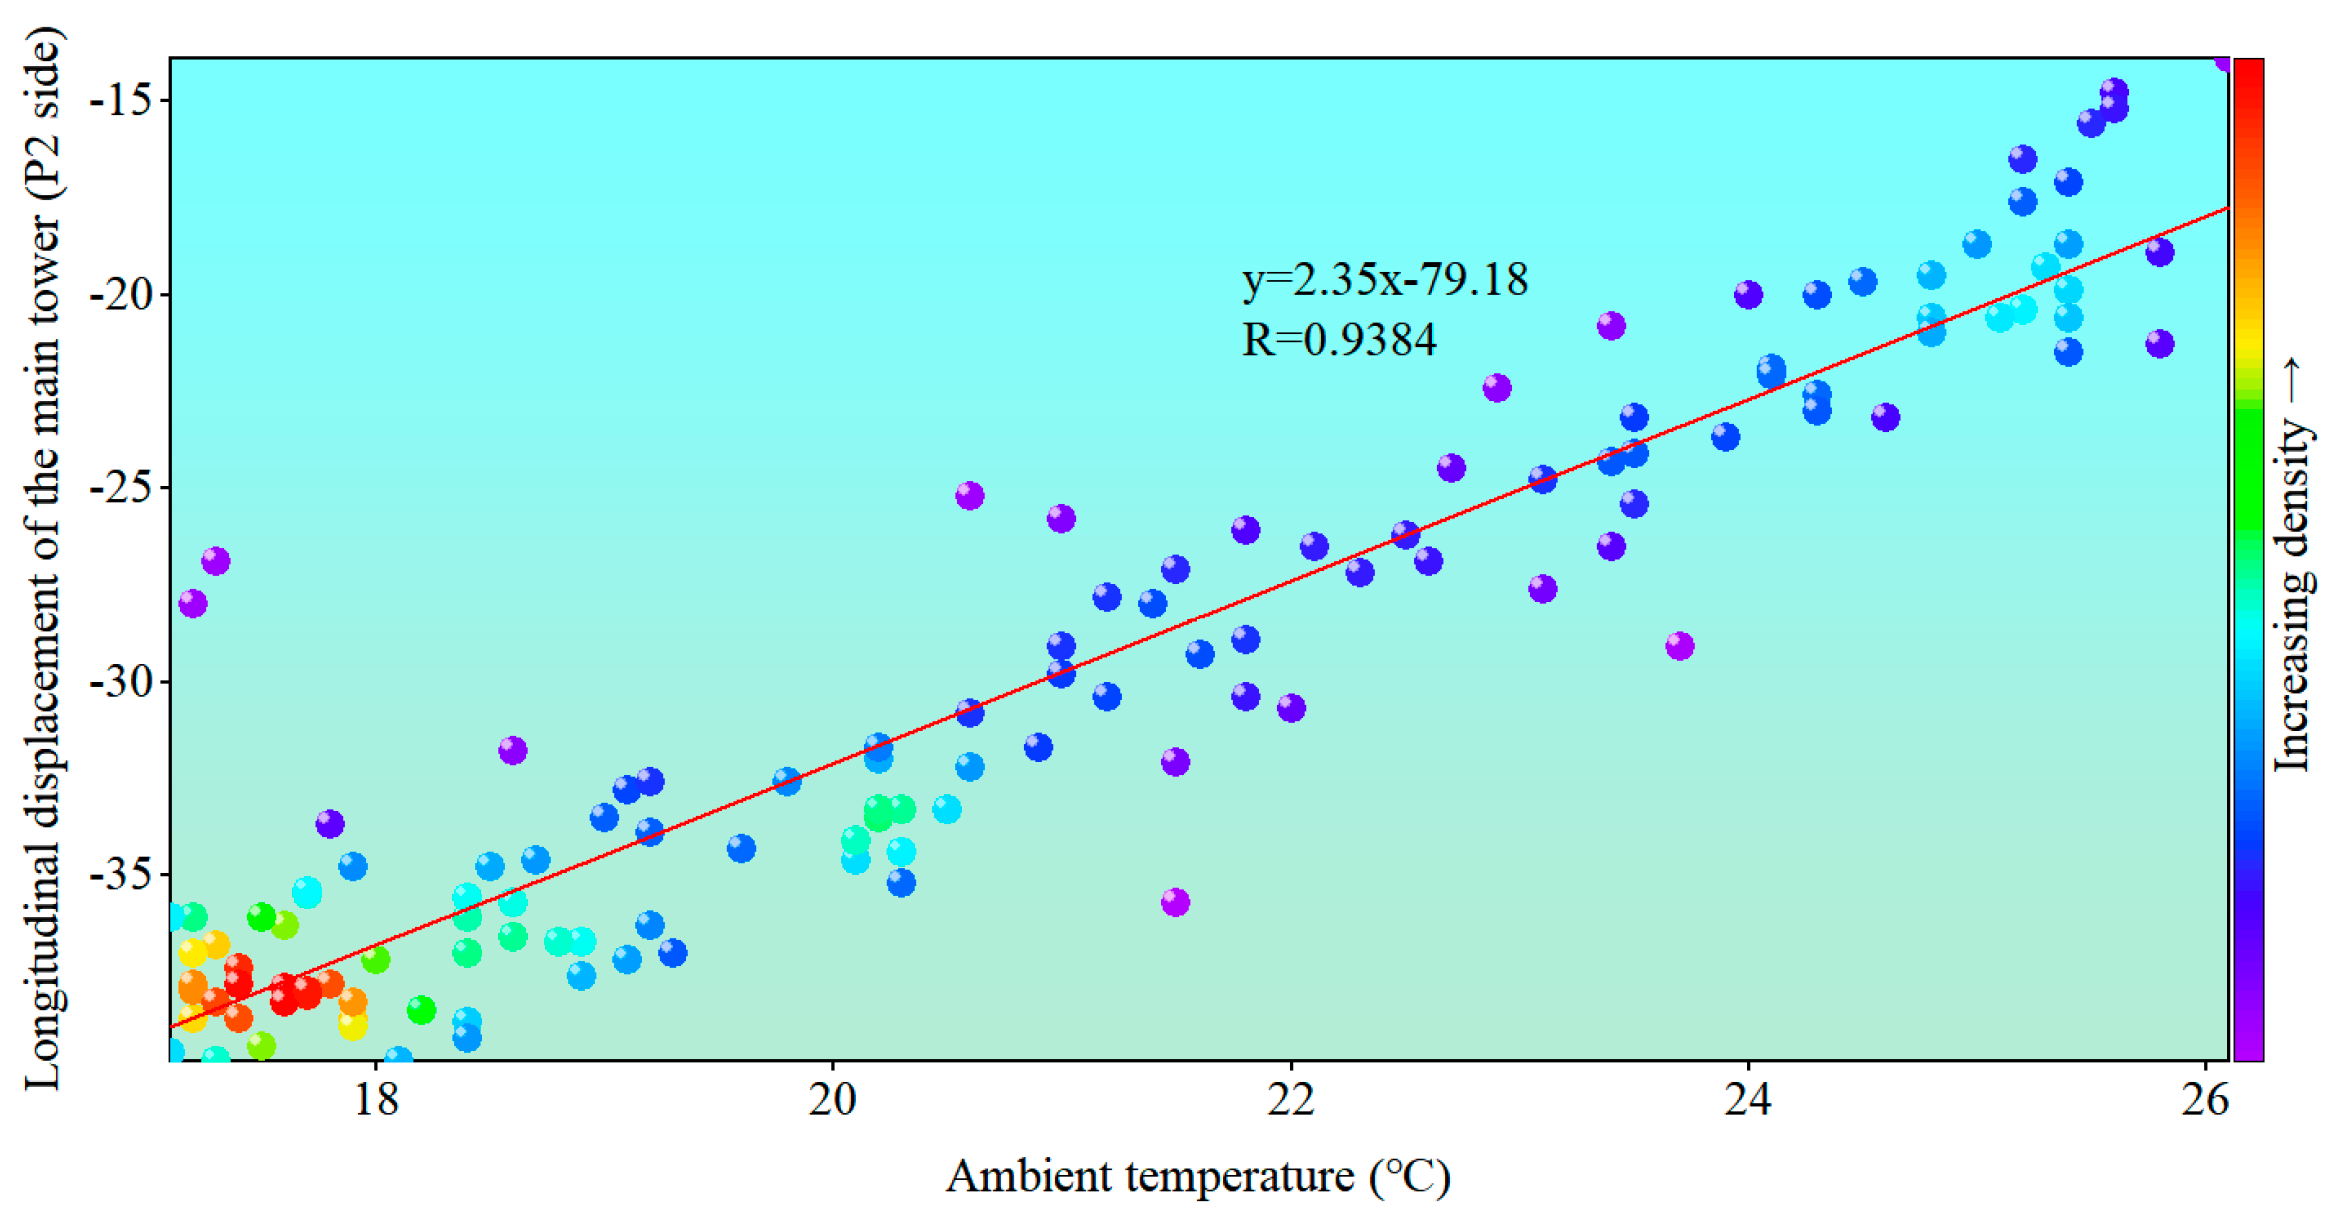
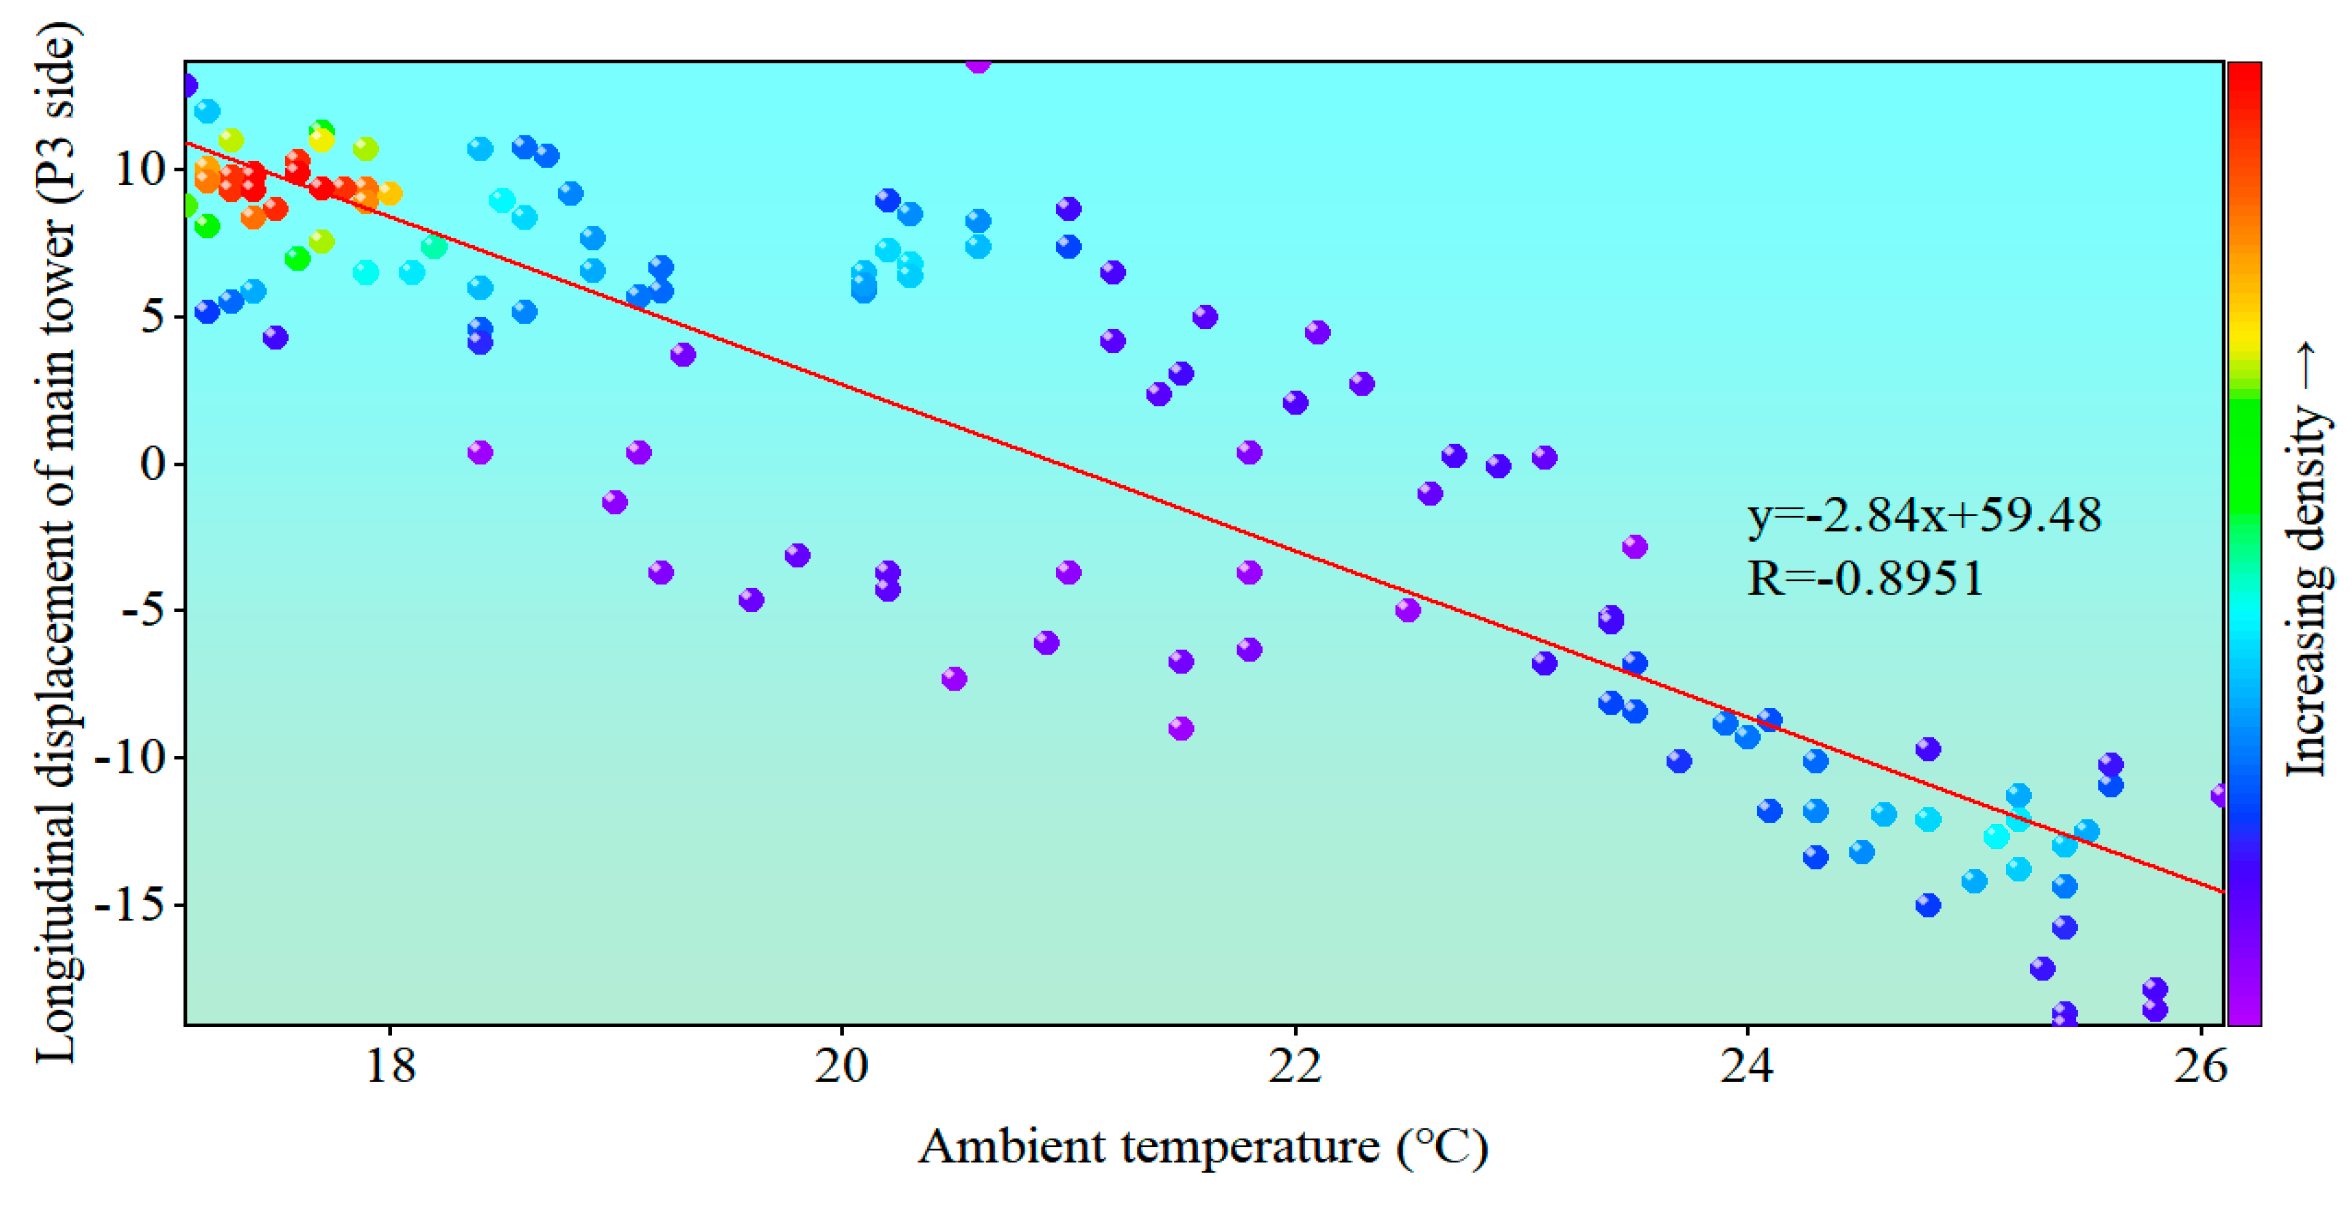
4.2. Analysis of Temperature Load Effect Based on Correlation

The cable-stayed bridge dedicated to the long-span track has an obvious response to temperature load. Therefore, an accurate analysis of the correlation between ambient temperature, displacement of the main beam and main tower, cable-stayed cable force, and main beam stress is of great significance for accurately identifying the structural state of the bridge and ensuring the operation safety of the bridge [32,33]. In this paper, the linear regression equation is fitted by the least squares method and the Pearson correlation coefficient [34,35] is used to determine the strength and direction of its correlation. The formula is shown as follows:
R = i = 1 n ( X i X ¯ ) ( Y i Y ¯ ) [ i = 1 n ( X i X ¯ ) 2 i = 1 n ( Y i Y ¯ ) 2 ]
where
R P e a r s o n c o r r e l a t i o n c o e f f i c i e n t ;
X i , Y i —Values of X and Y variables for the ith sample;
X ¯ , Y ¯ —Sample average of X variable and Y variable;
n—Sample size.
According to the stress characteristics of the track bridge, one-day monitoring data with small and stable wind speed in the bridge area are selected to separate the train load response data and the correlation between daily temperature difference and vertical displacement of the main beam, longitudinal displacement of the main tower, longitudinal displacement of the main beam, cable force of the cable, and stress of the main beam is analyzed, as shown in Table 3 and Figure 15, Figure 16, Figure 17, Figure 18, Figure 19, Figure 20, Figure 21, Figure 22 and Figure 23.
Figure 15, Figure 16, Figure 17, Figure 18, Figure 19, Figure 20, Figure 21, Figure 22 and Figure 23 show the following: The ambient temperature has a strong negative correlation with the vertical displacement of the main beam, the longitudinal displacement of the main tower (A0 side, P3 side, and P5 side), and the Pearson correlation coefficient R < −0.7 of the SMC1 stay cable and NMC1 stay cable. When the temperature rises, the vertical displacement of the main beam, the longitudinal displacement of the P3 main tower, and the longitudinal displacement of the A0 side main beam show a downward torsion trend. The SMC1 and NMC1 cable bodies become longer, and the tension becomes smaller. The Pearson correlation coefficient R > 0.7 shows a strong positive correlation between the longitudinal displacement of the main tower (P2 side), the roof stress in the main beam span, and the stress in the middle floor of the main beam span. When the temperature rises, the longitudinal displacement of the main tower (P2 side) shows an upward bending trend, and the roof stress in the main beam span and the stress in the middle floor of the main beam span increase. The results show that temperature has a significant effect on the cable-stayed bridge with a long-span track and there is a significant correlation with the response of each part of the structure.

5. Conclusions and Prospects

Based on the characteristics of track bridges, such as large volume, narrow transverse width, large excitation, high safety level, and clear load response, this paper proposes for the first time a method to obtain temperature load and train load from the composite response data of track bridge through an adaptive filter separation monitoring system. Relying on the structural health monitoring system of the Chongqing Nanjimen track bridge to analyze the load effect of train and temperature effects, this paper obtains the following conclusions:
  • The adaptive filtering load effect separation method proposed in this paper is both feasible and effective. Based on the characteristics of high frequency, large response, and periodicity of train load effect, a method for separating load effect is proposed. Through the signal separation of the composite structure response data obtained by the monitoring system, the respective effects of train load and temperature load at the same time are obtained, which provides scientific support for the state evaluation of the bridge and makes the evaluation results more accurate and reliable.
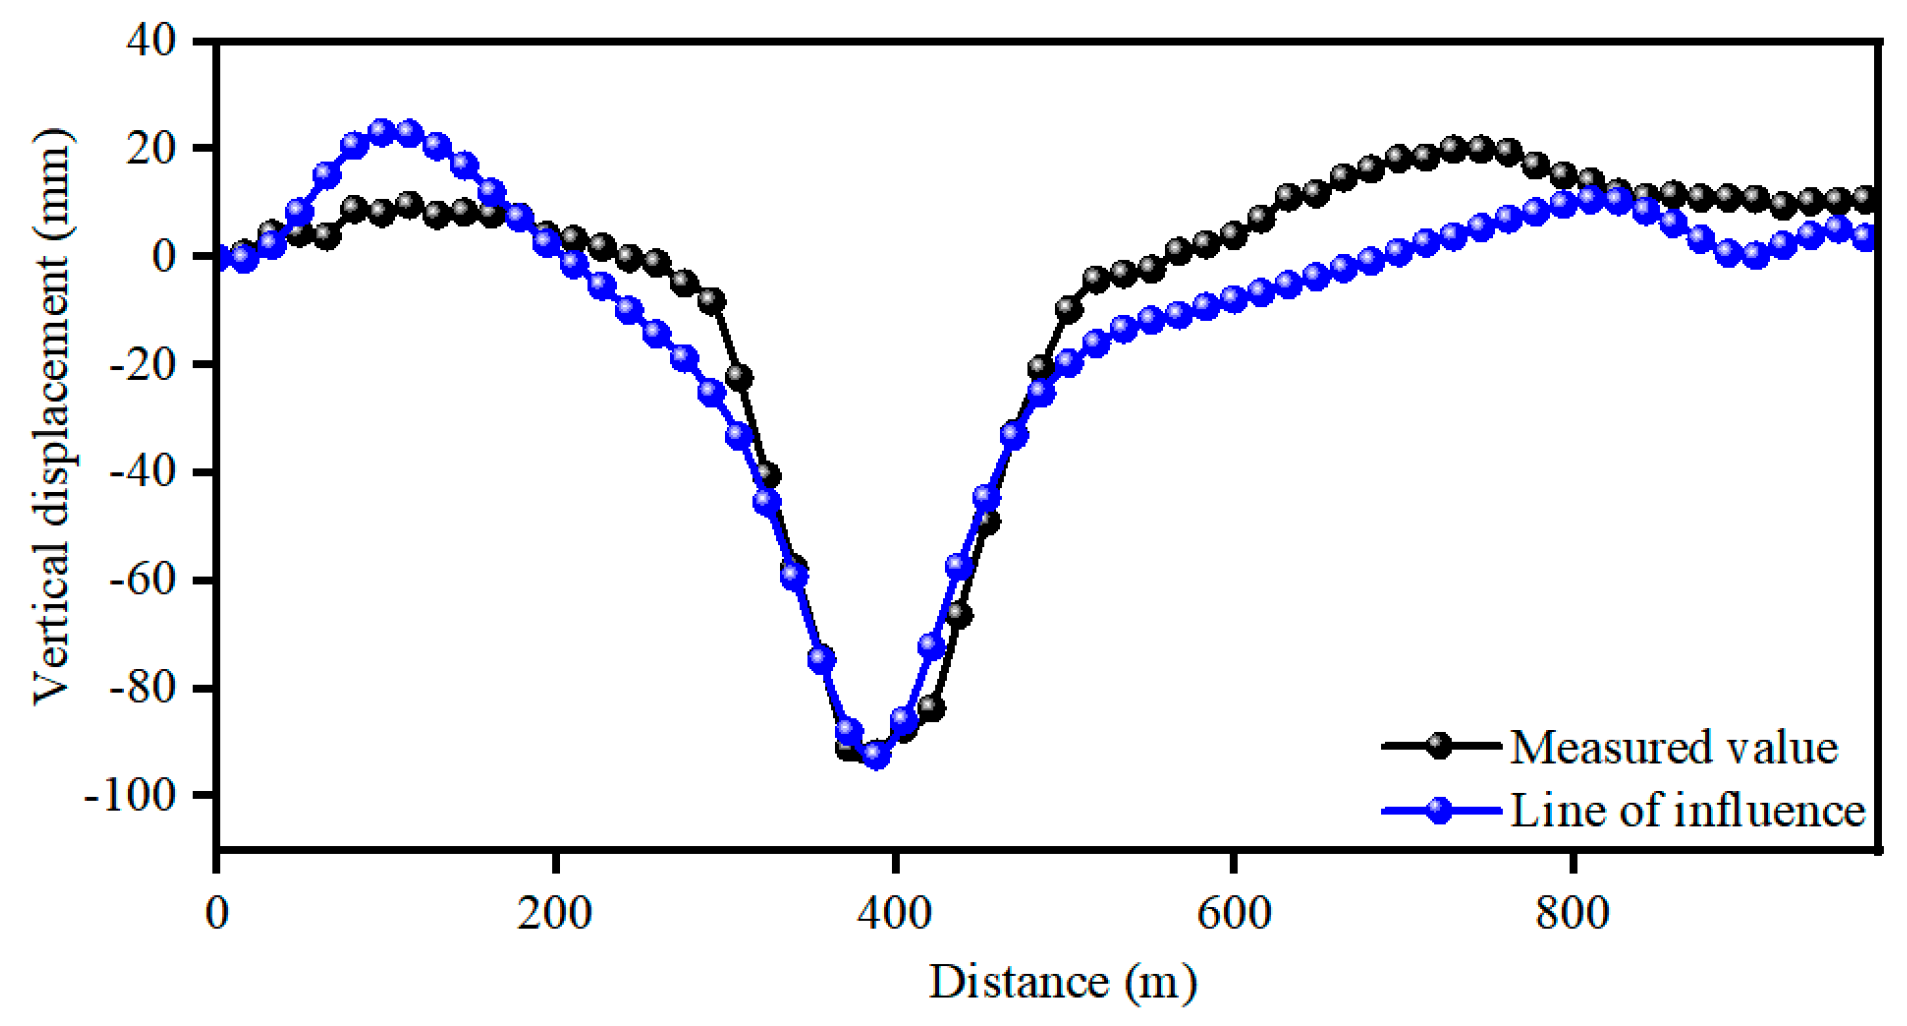
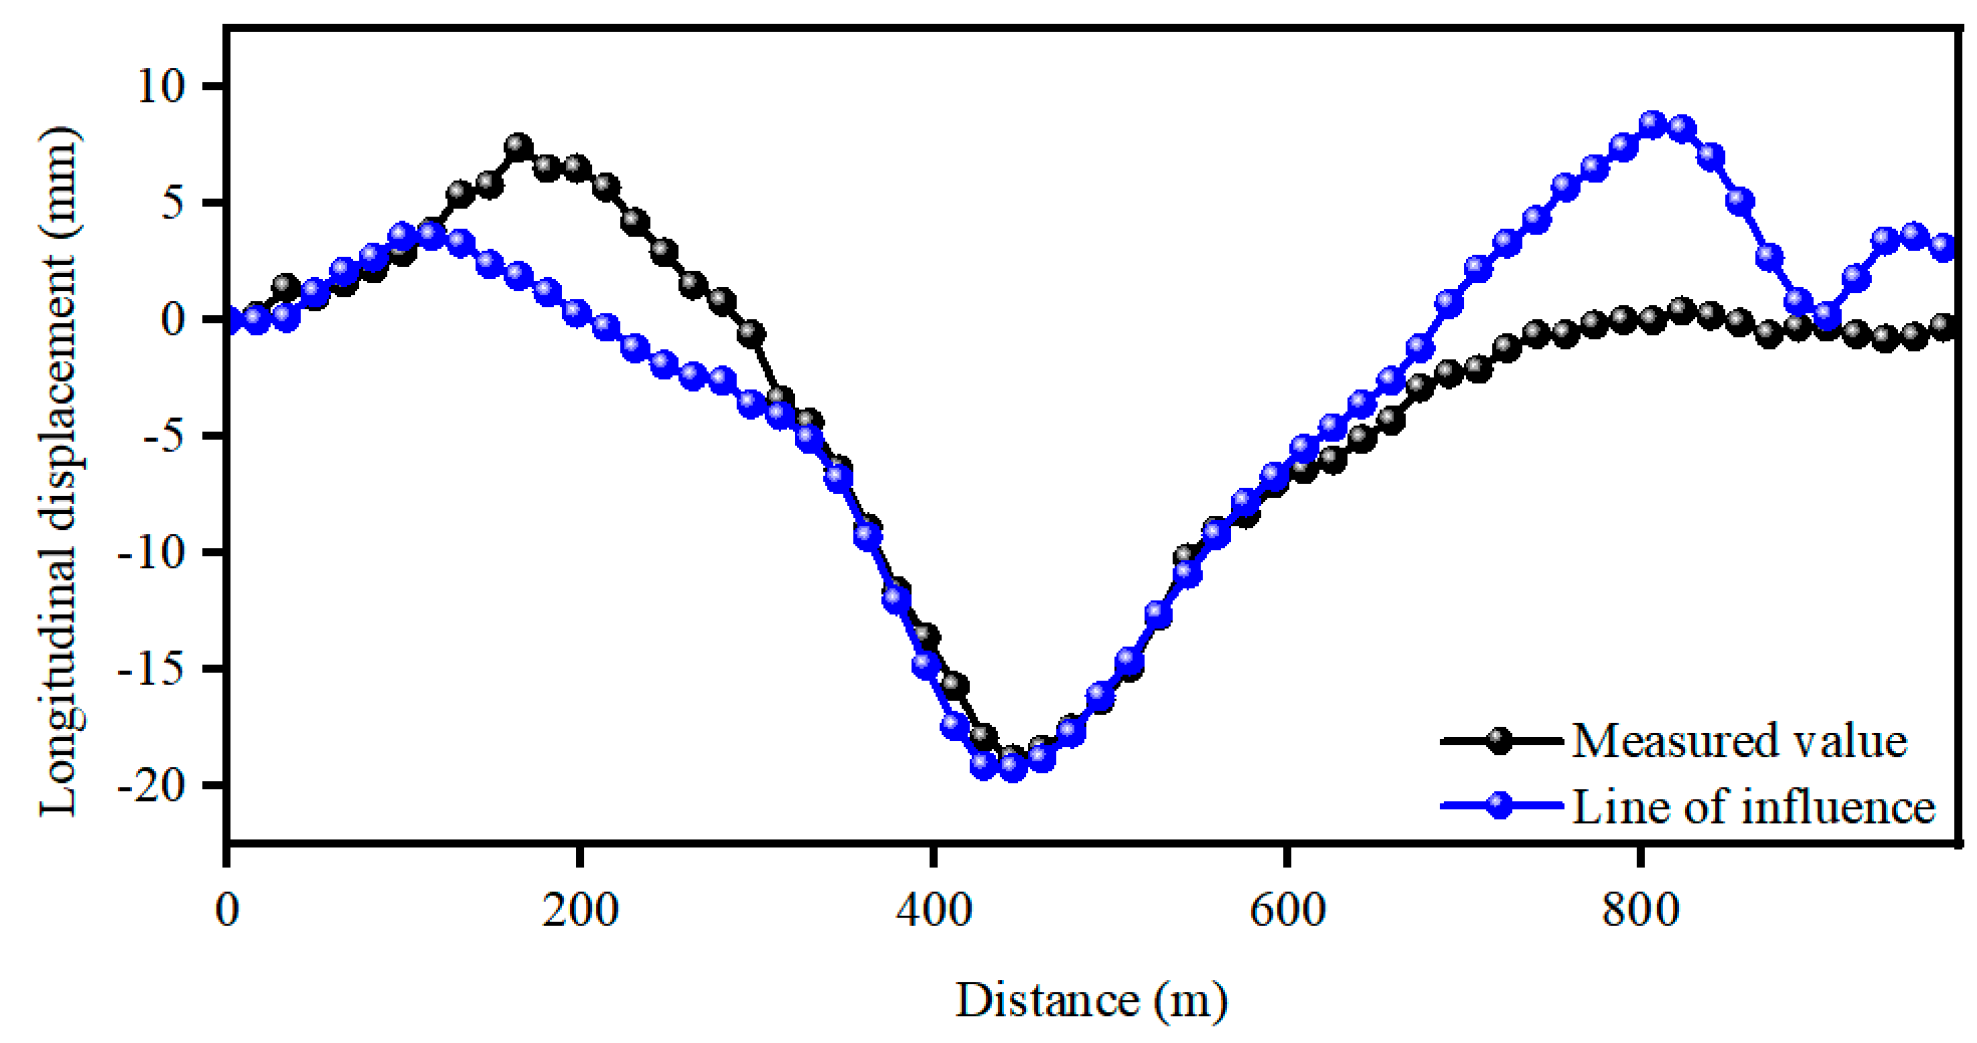
  • The measured values of the structural influence line of the vertical displacement of the main beam, the longitudinal displacement of the main tower, and the stress index of the main beam under the action of train load are compared with the theoretical influence line obtained by simulation, based on the train load effect analysis method of the influence line. The normalized cross-correlation (NCC) of the two indexes was found to be 0.9457, 0.9531, 0.8873, 0.9098, and 0.9101. This demonstrated a very high degree of fit, indicating that no significant anomalies were found in the bridge and verifying the direct evaluation of the structural state of the line affected by the train load.
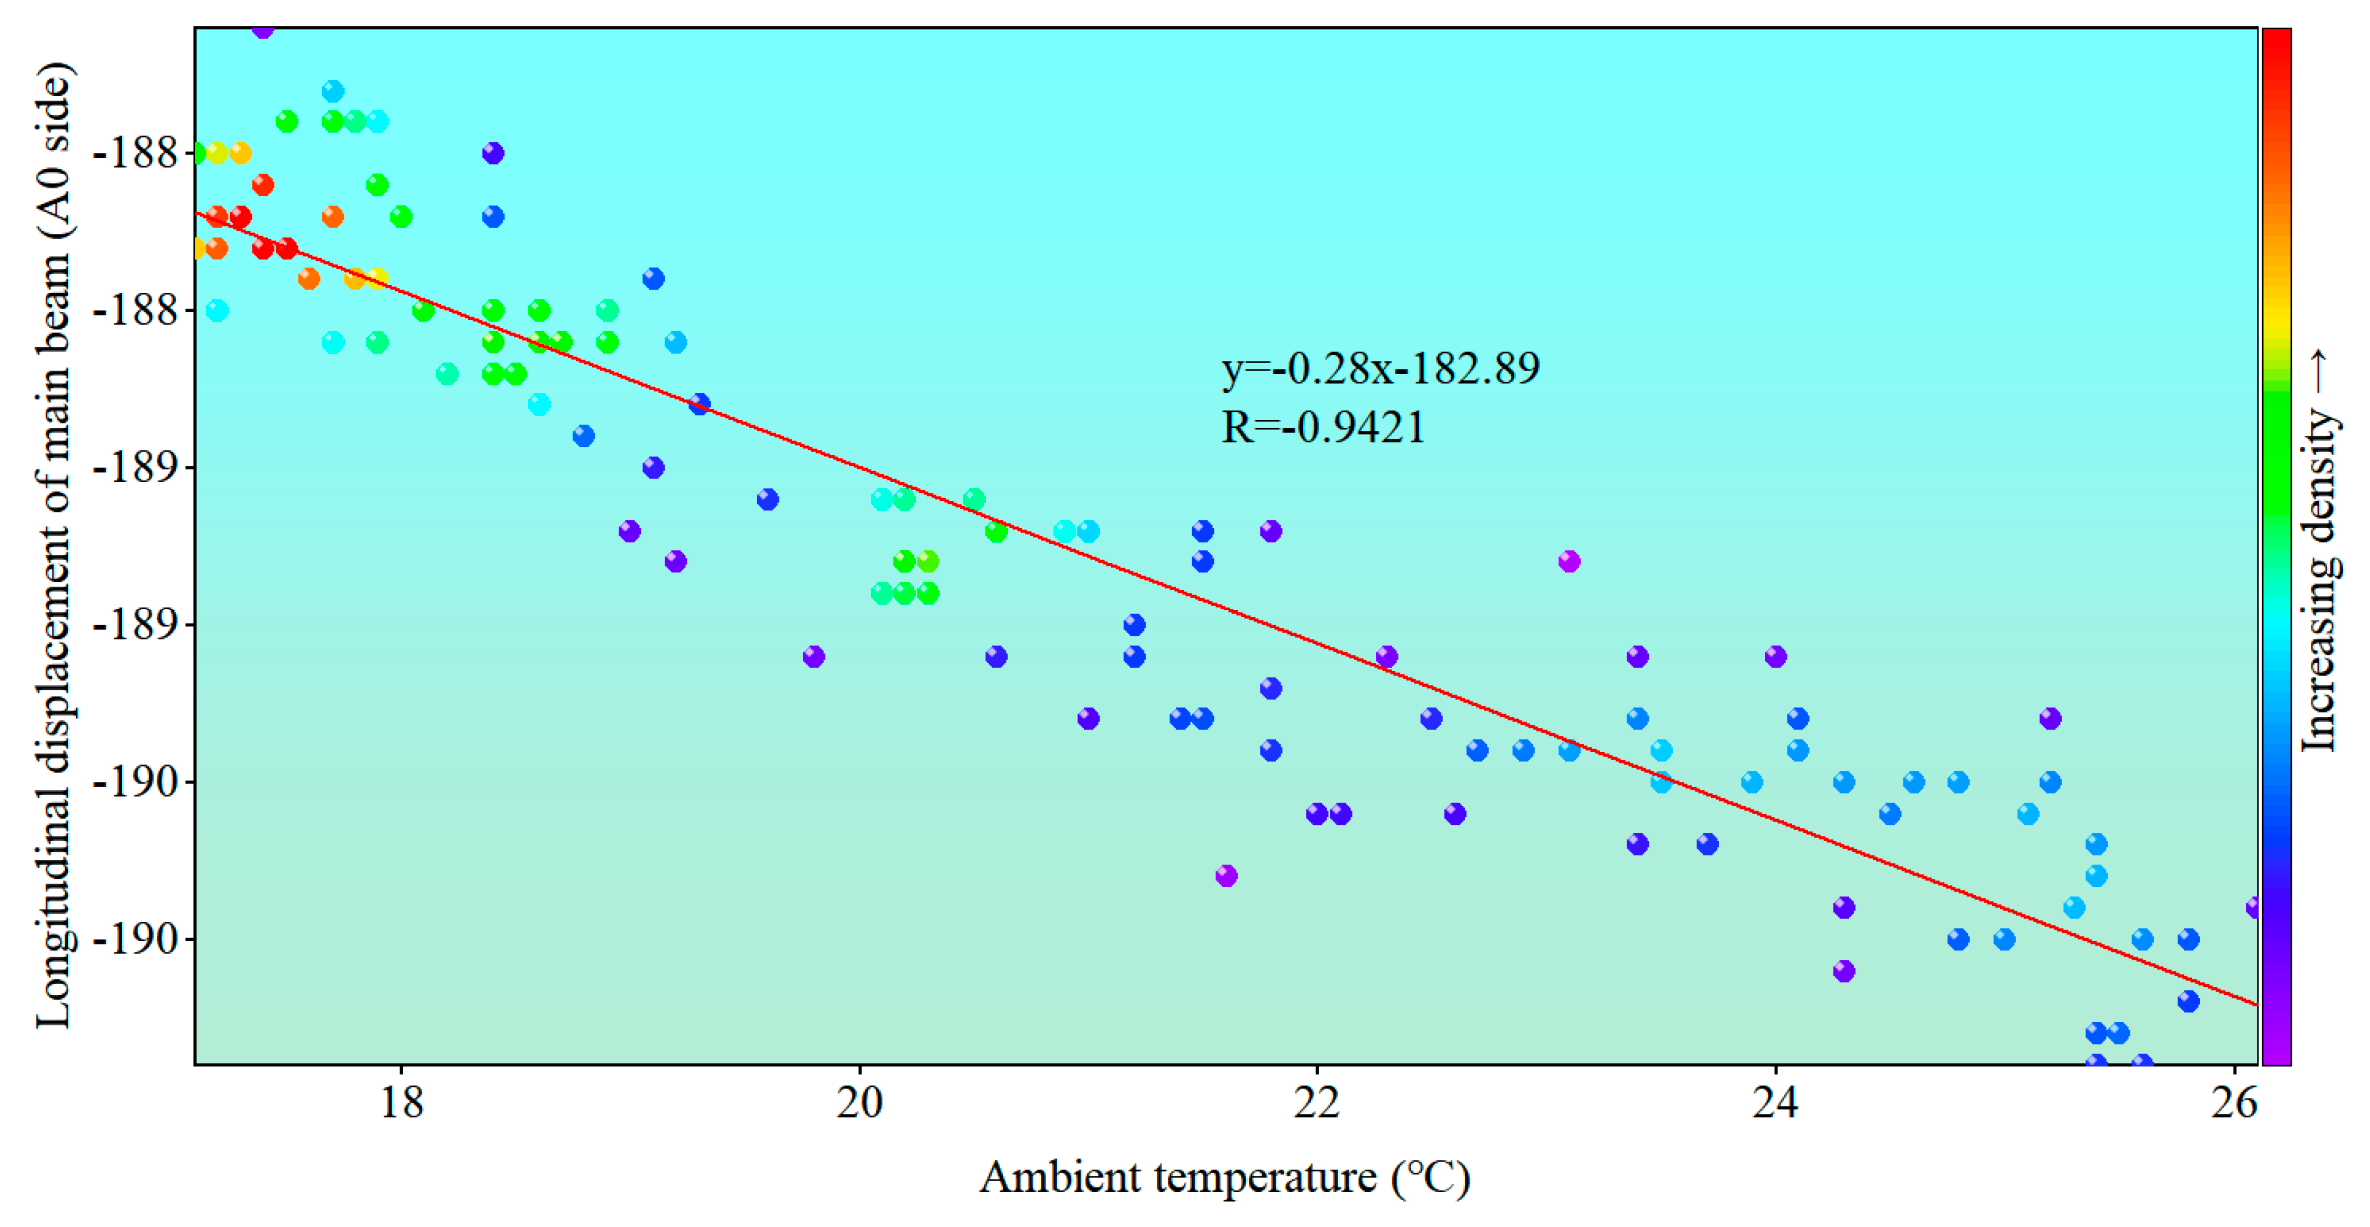
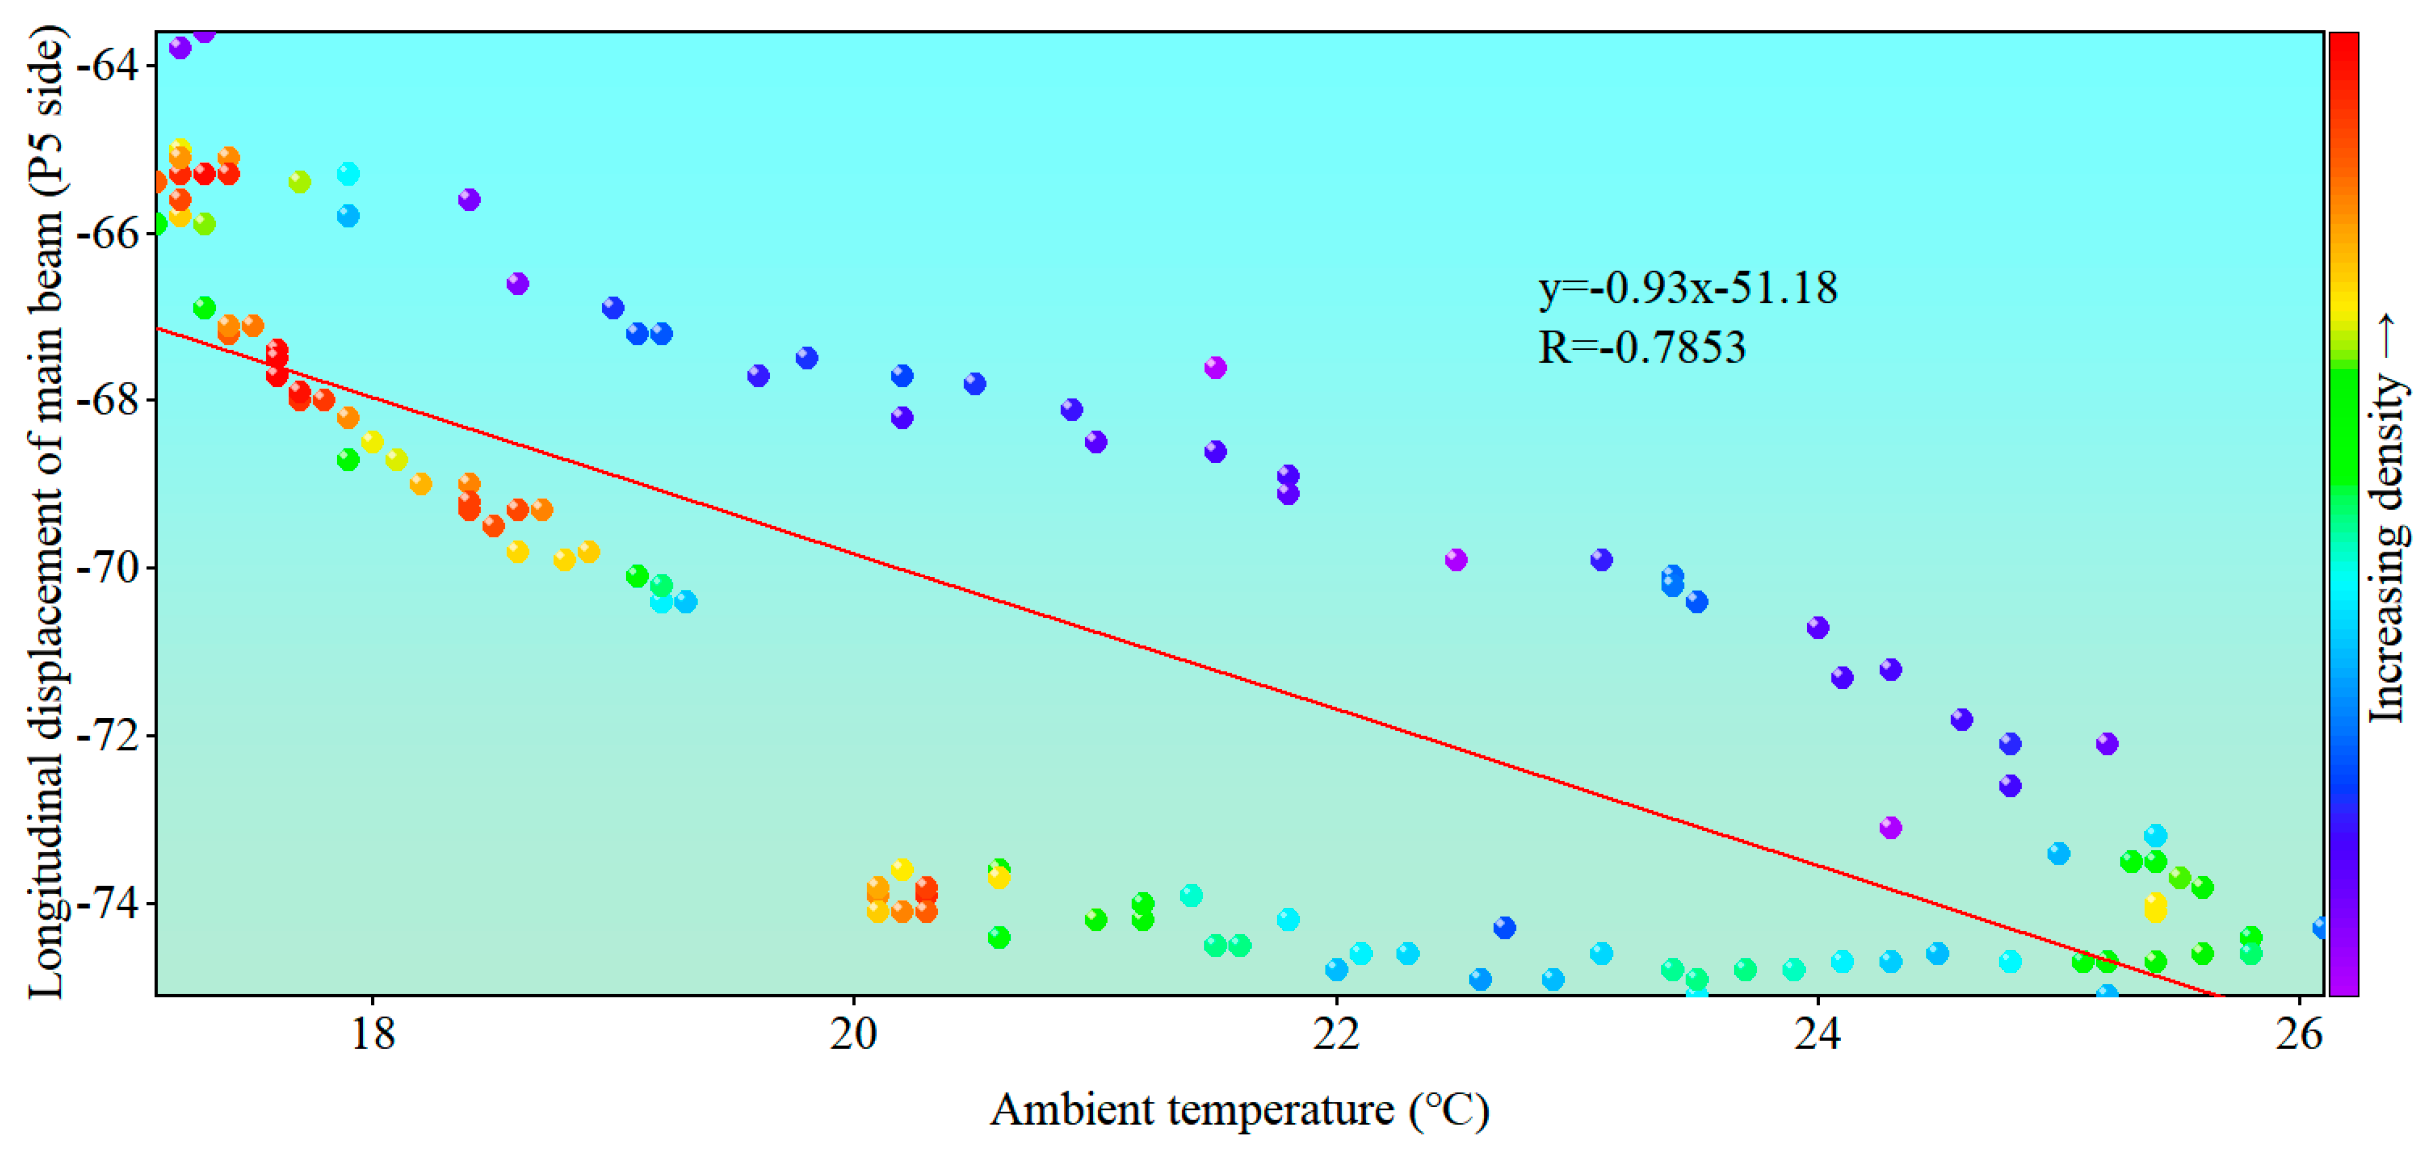
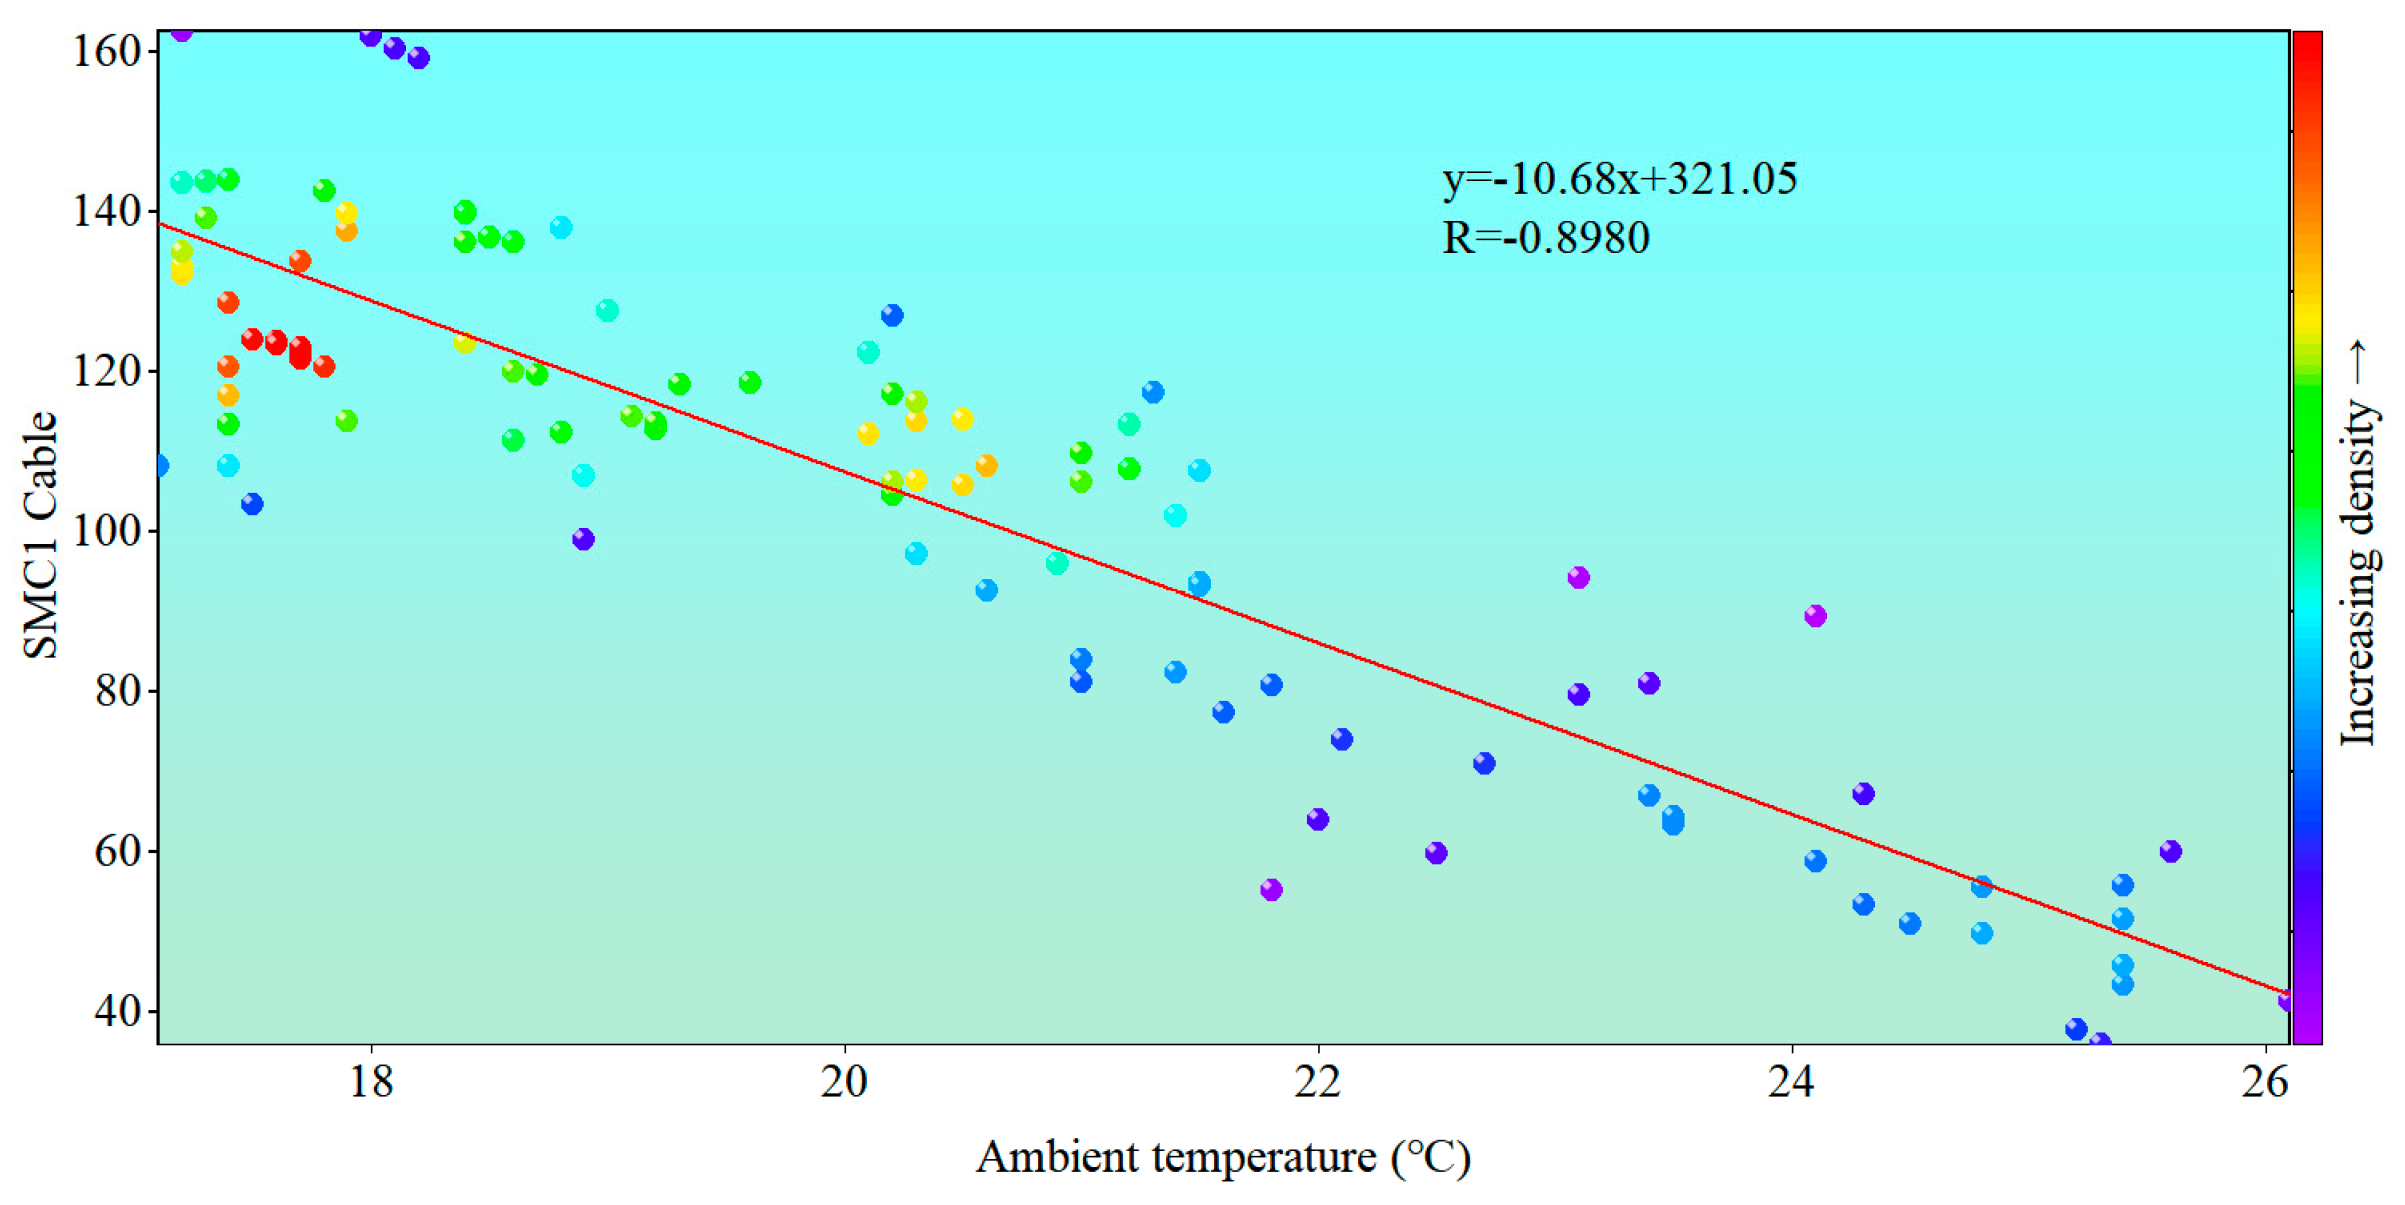
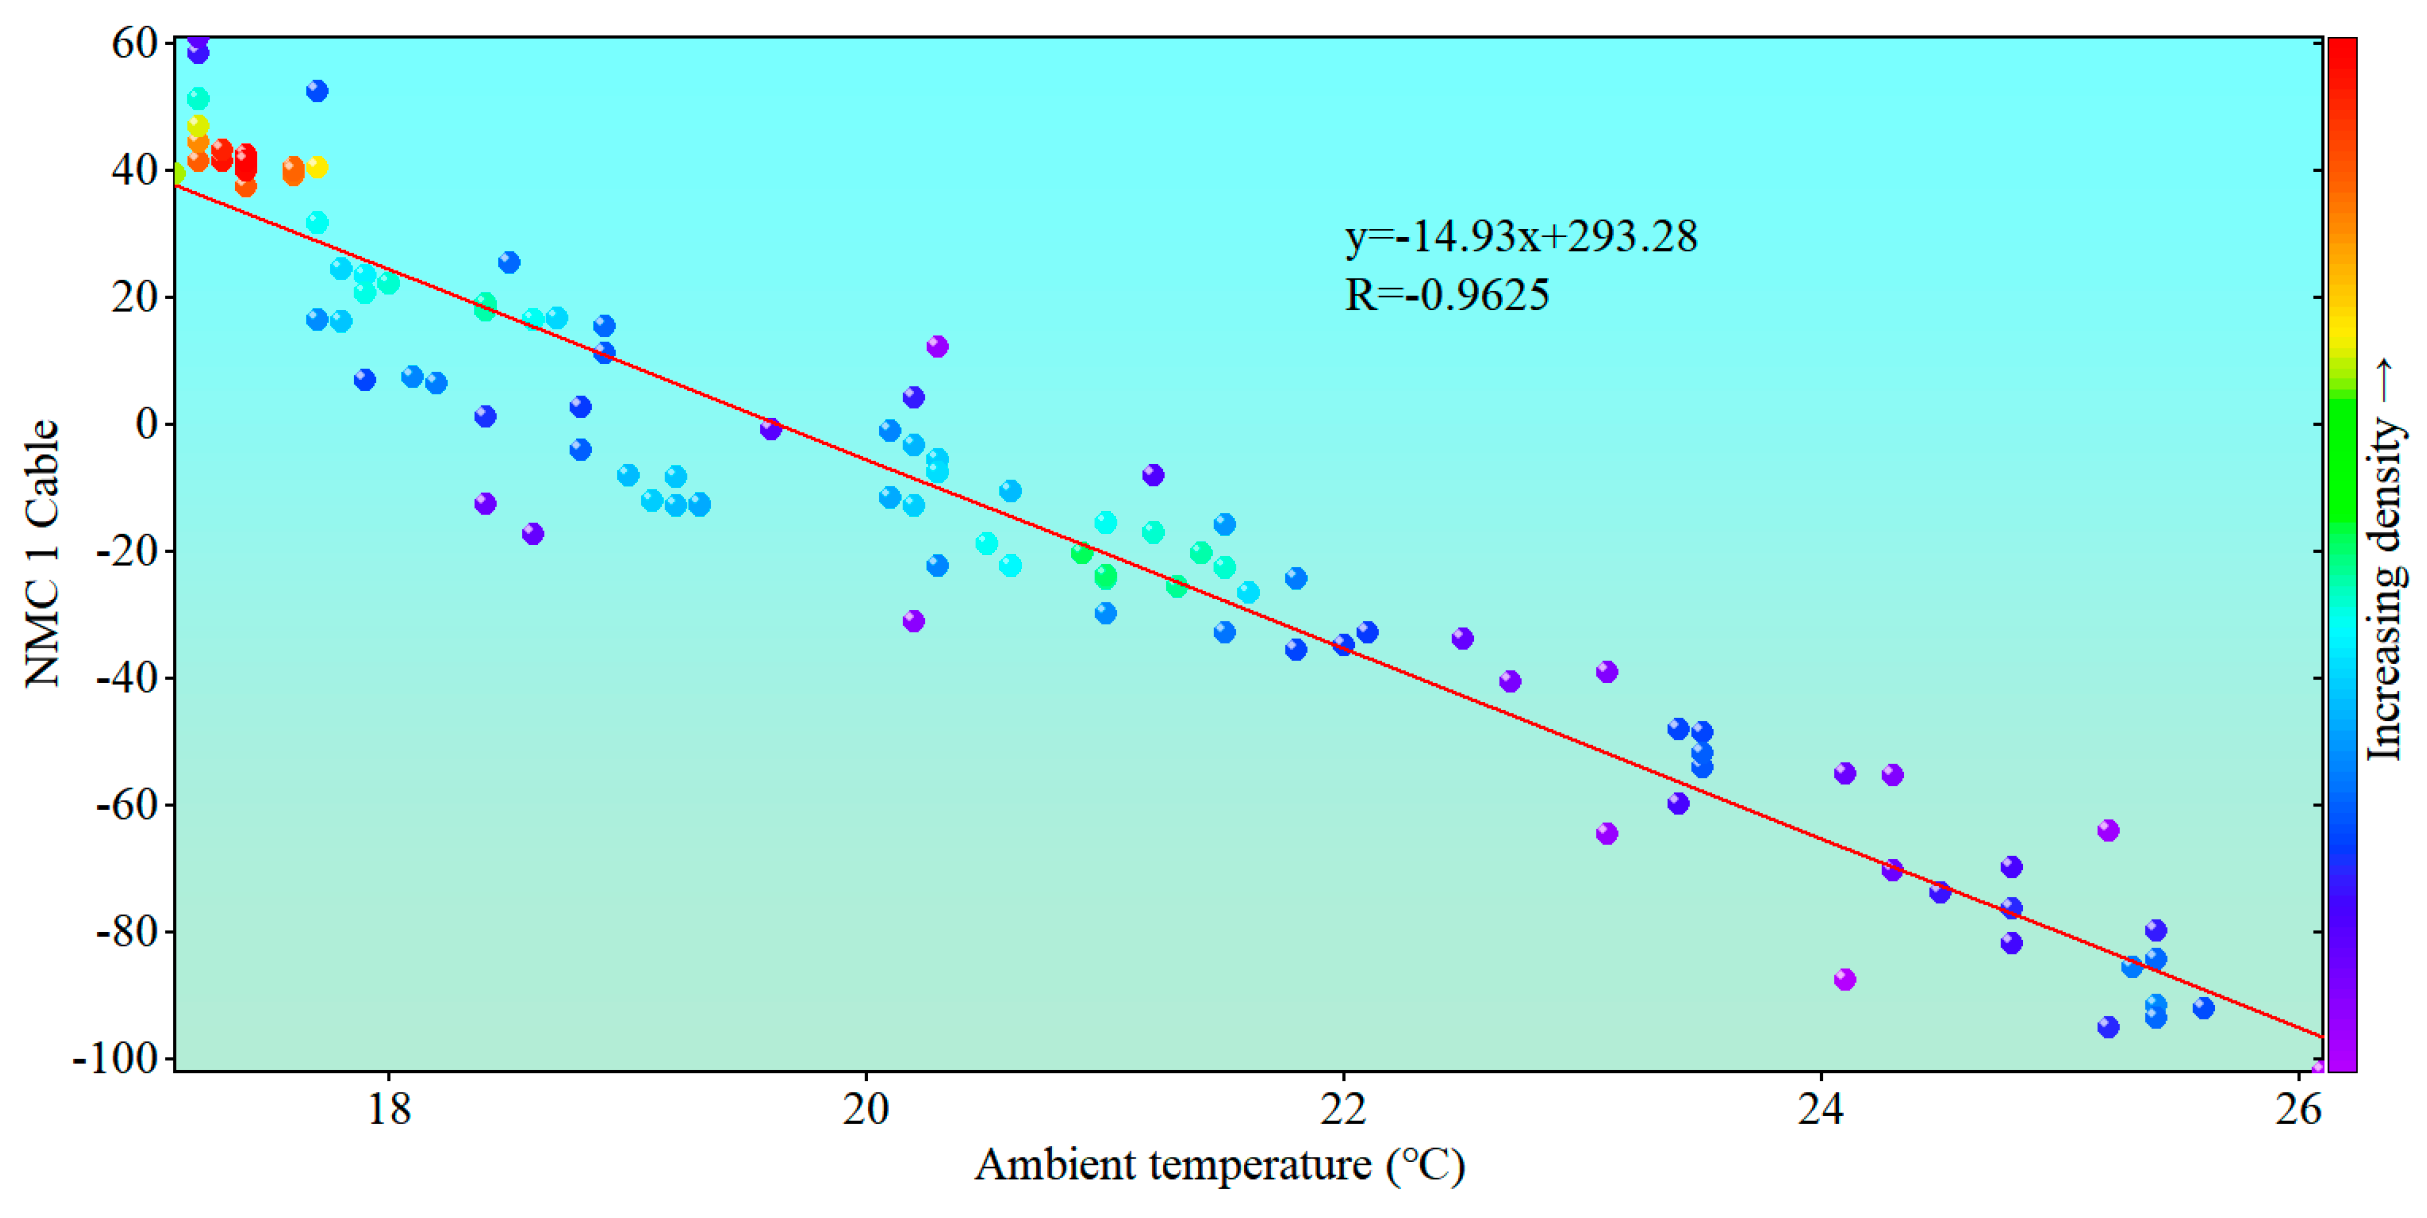
  • The impact of ambient temperature on the cable-stayed bridge with a long-span track is profound, and there is a clear correlation between the response of each structural component. The temperature exhibits a strong negative correlation with the vertical displacement of the main beam, longitudinal displacement of the main tower (A0 side, P3 side, and P5 side), and Pearson correlation coefficient R < −0.7 of the stay cable. Conversely, the longitudinal displacement of the main tower (P2 side), roof stress in the main beam span, and floor stress in the main beam span exhibit a strong positive correlation coefficient R > 0.7. It has been demonstrated that the structural state can be evaluated indirectly by temperature load correlation.
Based on the bridge health monitoring system, the load effect analysis and evaluation of long-span track special bridge structure are studied to some extent, but there are still the following deficiencies:
  • Comprehensive consideration of long-term effects: In addition to the load effect, the durability of the long-span track special cable-stayed bridge is also an important consideration. Therefore, in the future, a durability analysis will be carried out by monitoring the corrosion and fatigue of bridge materials to ensure the long-term safe operation of the bridge.
  • Optimize the monitoring system: In the future, the combination of artificial intelligence and big data analysis technology with the establishment of a decision support system will facilitate more accurate real-time monitoring, analysis, and prediction of the load effect of long-span track special cable-stayed bridges. Through systematic data management and analysis, the efficiency and safety of bridge operation and maintenance will be enhanced.

Author Contributions

P.D. Conceptualization, methodology, software, investigation, and writing—original manuscript; X.L. Conceptualization, methodology, formal analysis, and writing—review, and editing; S.C. Resources, visualization, and supervision; X.H. Writing—original manuscript, verification, and investigation; X.C. Resources, verification, investigation, and data management; Y.Q. Resources, writing—review and editing, and data management. All authors have read and agreed to the published version of the manuscript.

Funding

This work was supported by the Open Fund of Chongqing Key Laboratory of Energy Engineering Mechanics and Disaster Prevention and Mitigation (EEMDPM2021201) and the Chongqing University of Science and Technology research funding project (CKRC2021074).

Data Availability Statement

All of the data and models that were generated or used during the study are available from the corresponding author by request.

Conflicts of Interest

Author Mr. Sheng Chen was employed by the company T. Y. Lin International Engineering Consulting (China) Co., Ltd. The remaining authors declare that the research was conducted in the absence of any commercial or financial relationships that could be construed as a potential conflict of interest.

References

  1. Li, X.; Luo, H.; Ding, P.; Chen, X.; Tan, S. Prediction Study on the Alignment of a Steel-Concrete Composite Beam Track Cable-Stayed Bridge. Buildings 2023, 13, 882. [Google Scholar] [CrossRef]
  2. Tan, H.; Qian, D.; Xu, Y.; Yuan, M.; Zhao, H. Analysis of Vertical Temperature Gradients and Their Effects on Hybrid Girder Cable-Stayed Bridges. Sustainability 2023, 1053, 1013. [Google Scholar] [CrossRef]
  3. Tan, D.-M.; Guo, T.; Gan, Q.-L. Separation of Temperature Effect in Monitored Deflection of Bridges Based on VMD-SVD. Bridge Constr. 2023, 53, 87–94. [Google Scholar]
  4. Wang, L.-B.; Wang, Q.-L.; Zhu, Z.; Zhao, Y. Current Status and Prospects of Research on Bridge Health Monitoring Technology. Zhongguo Gonglu Xuebao/China J. Highw. Transp. 2021, 34, 25–45. [Google Scholar]
  5. Fang, C.; Xu, Y.L.; Hu, R.; Huang, Z. A web-based and design-oriented structural health evaluation system for long-span bridges with structural health monitoring system. Struct. Control Health Monit. 2021, 29, e2879. [Google Scholar] [CrossRef]
  6. Kaloop, M.R.; Eldiasty, M.; Hu, J.W. Safety and reliability evaluations of bridge behaviors under ambient truck loads through structural health monitoring and identification model approaches. Measurement 2022, 187, 110234. [Google Scholar] [CrossRef]
  7. Chen, C.; Wang, Y.; Kaloop, M.R.; Wang, T.; Ma, J. Continuous Box-Girder Bridge Condition Assessment Based on Structural Health Monitoring System: A Case Study. In Proceedings of the 2020 International Conference on Intelligent Transportation, Big Data & Smart City (ICITBS), Vientiane, Laos, 11–12 January 2020; pp. 734–740. [Google Scholar]
  8. Li, X.Y.; Guan, Y.H.; Law, S.S.; Zhao, W. Monitoring abnormal vibration and structural health conditions of an in-service structure from its SHM data. J. Sound Vib. 2022, 537, 117185. [Google Scholar] [CrossRef]
  9. Svendsen, B.T.; Frøseth, G.T.; Øiseth, O.; Rønnquist, A. A data-based structural health monitoring approach for damage detection in steel bridges using experimental data. J. Civ. Struct. Health Monit. 2022, 12, 101–115. [Google Scholar] [CrossRef]
  10. Hanwen, J.; Yang, D.; Aiqun, L. Correlation model of deflection-temperature-vehicle load monitoring data for bridge structures. J. Vib. Shock 2023, 42, 79–89. [Google Scholar]
  11. Li, X.; Gao, M.; Zhou, J.; Chen, X.; Tan, S. Permanent deformation limits of long-span track cable-stayed bridges based on service performance analysis. Sage J. 2021, 40, 1215–1226. [Google Scholar] [CrossRef]
  12. Zhou, C.; Butala, M.D.; Xu, Y.; Demartino, C.; Spencer, B.F. FE-based bridge weigh-in-motion based on an adaptive augmented Kalman filter. Mech. Syst. Signal Process. 2024, 218, 111530. [Google Scholar] [CrossRef]
  13. Singh, P.; Bana, D.; Sadhu, A. Improved bridge modal identification from vibration measurements using a hybrid empirical Fourier decomposition. J. Sound Vib. 2024, 590, 118598. [Google Scholar] [CrossRef]
  14. Dan, D.; Zeng, G.; Pan, R.; Yin, P. Block-wise recursive sliding variational mode decomposition method and its application on online separating of bridge vehicle-induced strain monitoring signals. Mech. Syst. Signal Process. 2023, 198, 110389. [Google Scholar] [CrossRef]
  15. Hielscher, T.; Khalil, S.; Virgona, N.; Hadigheh, S.A. A neural network based digital twin model for the structural health monitoring of reinforced concrete bridges. Structures 2023, 57, 105248. [Google Scholar] [CrossRef]
  16. Liu, X.; Yang, J.; Zhuo, W.; Lin, K.; Lin, Y. Real-time identification of time-varying cable force for cable-stayed bridges based on vibration monitoring. Measurement 2024, 231, 114590. [Google Scholar] [CrossRef]
  17. Xu, X.; Shi, C.; Ren, Y.; Fan, Z.; Guo, Z.; Zeng, X.; Jin, Y.; Huang, Q. Probabilistic anomaly detection considering multi-level uncertainties for cable-stayed bridges. Structures 2023, 58, 105448. [Google Scholar] [CrossRef]
  18. Azhar, A.S.; Kudus, S.A.; Jamadin, A.; Mustaffa, N.K.; Sugiura, K. Recent vibration-based structural health monitoring on steel bridges: Systematic literature review. Ain Shams Eng. J. 2024, 15, 102501. [Google Scholar] [CrossRef]
  19. Fang, F.; Lv, K.; Qiu, L. Design of GMM Damage Alarm Software Based on Embedded Structural Health Monitoring System. Trans. Nanjing Univ. Aeronaut. Andastronautics 2023, 40, 62–68. [Google Scholar]
  20. Yi, T.H.; Zheng, X.; Yang, D.H.; Li, H.N. Lightweight design method for structural health monitoring system of short-and medium-span bridges. J. Vib. Eng. 2023, 36, 458–466. [Google Scholar]
  21. Yu, J.; Peng, Z.; Meng, X.; Xie, Y. GNSS-based Rea-time Vibration Monitoring and Dynamic Response Analysis of a Long-span SuspensionBridge under an Extreme Typhoon Event. China J. Highw. Transp. 2024, 1–14. Available online: http://kns.cnki.net/kcms/detail/61.1313.U.20240222.1338.002.html (accessed on 6 August 2024).
  22. Xiaopeng, L.Z.F. Study of Degradation Effects of Perforation and Welding on Fatigue Performance of Steel Deck. Bridge Constr. 2020, 50, 8–13. [Google Scholar]
  23. Miao, P.; Yokota, H.; Zhang, Y. Deterioration prediction of existing concrete bridges using a LSTM recurrent neural network. Struct. Infrastruct. Eng. 2023, 19, 475–489. [Google Scholar] [CrossRef]
  24. Tang, L.; Wu, T.; Mao, R.; Zhou, Z. Curvature Influence Line Area Difference Method for Damage Location of Bridge Structures. Yingyong Jichu Yu Gongcheng Kexue Xuebao/J. Basic Sci. Eng. 2022, 30, 541–553. [Google Scholar]
  25. Zhang, C.; Zhu, J.; Zhou, S. Integration of multi-point influence line information for damage localization of bridge structures. J. Civ. Struct. Health Monit. 2024, 14, 449–463. [Google Scholar] [CrossRef]
  26. Zhou, Y.; Zhang, L.; Hu, J.; Hao, G. Measurement of Bridge lnfluence Lines Based on Machine Vision and lnterval Affine Algorithm. China J. Highw. Transp. 2024, 37, 142–151. [Google Scholar]
  27. Wang, Y.; Jing, G.G.; Wang, B. Online Structural Analysis and State Evaluation Method for Bridge Health Monitoring System. Bridge Constr. 2014, 44, 25–30. [Google Scholar]
  28. Zheng, X.; Yi, T.H.; Yang, D.H.; Li, H.N. Stiffness Estimation of Girder Bridges Using Influence Lines Identified from Vehicle-Induced Structural Responses. J. Eng. Mech. 2021, 147, 04021012. [Google Scholar] [CrossRef]
  29. Zhao, H.; Wei, B.; Jiang, L.; Xiang, P.; Zhang, X.; Ma, H.; Xu, S.; Wang, L.; Wu, H.; Xie, X. A velocity-related running safety assessment index in seismic design for railway bridge. Mech. Syst. Signal Process. 2023, 198, 110305. [Google Scholar] [CrossRef]
  30. Dong, C.-Z.; Bas, S.; Necati Catbas, F. A completely non-contact recognition system for bridge unit influence line using portable cameras and computer vision. Smart Struct. Syst. 2019, 24, 617–630. [Google Scholar]
  31. Dong, C.Z.; Celik, O.; Catbas, F.N.; O’Brien, E.J.; Taylor, S. Structural displacement monitoring using deep learning-based full field optical flow methods. Struct. Infrastruct. Eng. 2020, 16, 51–71. [Google Scholar] [CrossRef]
  32. Hu, J.; Zheng, Q.-G.; Zhang, W.-M. Study of Combined Effects of Wind and Thermal Loads on Changtai Changjiang River Bridge. Bridge Constr. 2020, 50, 42–47. [Google Scholar]
  33. Abid, S.R. Three-dimensional finite element temperature gradient analysis in concrete bridge girders subjected to environmental thermal loads. Cogent Eng. 2018, 5, 1447223. [Google Scholar] [CrossRef]
  34. Huang, H.-B.; Yi, T.-H.; Li, H.-N.; Liu, H. Strain-Based Performance Warning Method for Bridge Main Girders under Variable Operating Conditions. J. Bridge Eng. 2020, 25, 04020013. [Google Scholar] [CrossRef]
  35. Saccenti, E.; Hendriks, M.H.W.B.; Smilde, A.K. Corruption of the Pearson correlation coefficient by measurement error and its estimation, bias, and correction under different error models. Sci. Rep. 2020, 10, 438. [Google Scholar] [CrossRef] [PubMed]
Figure 1. Bridge layout (unit: cm).
Applsci 14 07057 g001
Figure 2. Cross-sectional layout (unit: cm).
Applsci 14 07057 g002
Figure 3. Section view of the main tower (unit: cm).
Applsci 14 07057 g003
Figure 4. Loading diagram of the 6-car train (unit: m).
Applsci 14 07057 g004
Figure 5. The overall layout of health monitoring points (unit: cm).
Applsci 14 07057 g005
Figure 6. The overall finite element model of the Chongqing Nanjimen track bridge. (a) Discrete diagram of the overall finite element model. (b) Finite element model of the main girder section. (c) Finite element model of the stay cable section. (d) Finite element model of the main tower section.
Applsci 14 07057 g006
Figure 7. Measured vertical displacement of the main beam (unit: mm).
Applsci 14 07057 g007
Figure 8. Vertical displacement of the main beam under train load (unit: mm).
Applsci 14 07057 g008
Figure 9. Vertical displacement of the main beam under temperature load (unit: mm).
Applsci 14 07057 g009
Figure 10. Comparative analysis of vertical displacement of the main beam and finite element influence line.
Applsci 14 07057 g010
Figure 11. Comparative analysis of longitudinal displacement of P2 tower top and finite element influence line.
Applsci 14 07057 g011
Figure 12. Comparative analysis of longitudinal displacement of P3 tower top and finite element influence line.
Applsci 14 07057 g012
Figure 13. Comparative analysis of roof stress and finite element influence line in the center section of the main beam closing section.
Applsci 14 07057 g013
Figure 14. Comparative analysis of the stress of the bottom plate of the center section of the main beam and the influence line of the finite element.
Applsci 14 07057 g014
Figure 15. Correlation between ambient temperature and vertical displacement of the main beam (unit: mm).
Applsci 14 07057 g015
Figure 16. Correlation between ambient temperature and longitudinal displacement of the main tower at P2 side (unit: mm).
Applsci 14 07057 g016
Figure 17. Correlation between ambient temperature and longitudinal displacement of the main tower at P3 side (unit: mm).
Applsci 14 07057 g017
Figure 18. Correlation between ambient temperature and longitudinal displacement of the main beam on the A0 side (unit: mm).
Applsci 14 07057 g018
Figure 19. Correlation between ambient temperature and longitudinal displacement of the main beam on the P5 side (unit: mm).
Applsci 14 07057 g019
Figure 20. Correlation between ambient temperature and the SMC1 cable (unit: kN).
Applsci 14 07057 g020
Figure 21. Correlation between ambient temperature and NMC1 cable (unit: kN).
Applsci 14 07057 g021
Figure 22. Correlation between ambient temperature and roof stress in the middle span of the main beam (unit: MPa).
Applsci 14 07057 g022
Figure 23. Correlation between ambient temperature and floor stress in the middle span of the main beam (unit: MPa).
Applsci 14 07057 g023
Table 1. Equipment information table of the health monitoring system.
CategoryMonitoring ItemNumber in Figure 5 *Main ParameterDevice TypeSampling Frequency
Load and environmental monitoringStrike⑫, ⑬, ⑭Crash—Ship crashUnidirectional acceleration sensor20 Hz
Temperature⑯, ㉓Temperature—Ambient temperatureHygrograph1/600 Hz
Temperature—Temperature inside the box girderHygrograph1/600 Hz
Humidness⑯, ㉓Humidity—Ambient humidityHygrograph1/600 Hz
Humidity—Box girder inside wetHygrograph1/600 Hz
RainfallrainfallHyetometer1/60 Hz
Water levelWater levelRadar water level gauge1 Hz
WindWind speed and directionanemometer1 Hz
Static and dynamic response monitoring of the whole structureVibration⑨, ⑩Vibration—Main beam vibrationUnidirectional acceleration sensor20 Hz
⑳, ㉑Vibration—Tower vibrationUnidirectional acceleration sensor20 Hz
AmorphosisDeformation—Vertical change in the main beamStatic level1 Hz
Deformation—Tower space deformation (GNSS)GNSS deformation monitoring system1 Hz
Static and dynamic response monitoring of the whole structureAmorphosisDeformation—Main beam space deformation (GNSS)GNSS deformation monitoring system1 Hz
Deformation—Horizontal displacement of the pierInclinometer1 Hz
Deformation—Displacement of expansion jointFiber grating displacement meter1 Hz
CornerCornerinclinometer1 Hz
Structure local response monitoringStressMain beam stressFiber grating strain gauge1 Hz
Main tower stressFiber grating strain gauge1 Hz
Cable forceCable force of the cableCable force accelerometer20 Hz
Transcore pressure sensor1/60 Hz
Structural fatigueFatigue of steel structureFiber grating strain gauge1 Hz
* Note: ③ in the figure is video surveillance.
Table 2. Normalized relationship between measured and theoretical values (NCC).
Serial NumberStructural Response ParameterNCCSimilarity
1Vertical displacement of the main beam0.9457High
2Longitudinal displacement of the main tower (P2 side)0.9531High
3Longitudinal displacement of the main tower (P3 side)0.8873High
4Roof stress in the span of the main beam0.9098High
5Middle floor stress of main beam span0.9101High
Table 3. Results of correlation analysis between ambient temperature and structural response.
Serial NumberStructural Response ParameterPearson Correlation Coefficient RStrength of Correlation
1Vertical displacement of the main beam−0.9634strong
2Longitudinal displacement of the main tower (P2 side)0.9384strong
3Longitudinal displacement of the main tower (P3 side)−0.8951strong
4Longitudinal displacement of the main beam (A0 side)−0.9421strong
5Longitudinal displacement of the main beam (P5 side)−0.7853strong
6SMC1 Cable−0.8980strong
7NMC1 Cable−0.9625strong
8Roof stress in the span of the main beam0.9658strong
9Middle floor stress of main beam span0.9326strong
Disclaimer/Publisher’s Note: The statements, opinions and data contained in all publications are solely those of the individual author(s) and contributor(s) and not of MDPI and/or the editor(s). MDPI and/or the editor(s) disclaim responsibility for any injury to people or property resulting from any ideas, methods, instructions or products referred to in the content.

