Abstract
The water jet nozzle is a penetrating drilling tool, which sends the pumped water to the nozzle through a high-pressure hose. It can work in a variety of working environments. When it dredges the blockage in the pipeline, its structural parameters will affect the jet flow field in the pipeline. Taking the self-propelled water jet nozzle as the research object, SolidWorks was used to establish the nozzle model with different parameter structures. Based on Fluent, the k-ε turbulence model was used to simulate the jet of nozzles with different nozzle sizes and arrangements in the pipeline. The distribution of the jet flow field and the change in velocity and displacement of nozzles with different parameters in the pipeline were compared, and then computational fluid dynamics (CFD) were used to process the simulation data for further research. The results show that when the inclination angle of the rear nozzle is 35°, the attenuation of the front jet velocity and the fluctuation of the wall fluid velocity are the smallest. When the nozzle aperture is increased from 2 mm to 3.5 mm, the vortex area inside the pipe is reduced, and the velocity attenuation of the front jet is also reduced, with the velocity attenuation rate decreasing by about 10%. This study provides a reference for the design and parameter optimization of self-propelled water jet nozzles.
1. Introduction
The water jet nozzle serves as a crucial component that converts the pressure energy of water into kinetic energy. It finds widespread application in areas such as rock-breaking mining and object cutting [1]. During the process of pipeline transportation, due to the inherent characteristics of the filling paste, it tends to accumulate and condense within the pipeline, ultimately leading to pipeline blockage. Under conditions of ultra-high pressure and high-speed rotation, the water jet nozzle undergoes intense energy exchange between the jet and the surrounding medium, resulting in the formation of a complex, multiphase turbulent flow field. This flow field plays a significant role in the dredging of blocked pipelines [2]. In the realm of flow field research, CHEN et al. [3] employed the improved delayed separation vortex simulation method coupled with the shear stress transport model to analyze the evolution of vortex structures, velocity fields, and pressure fields within a rotating jet. They also examined the influence of the nozzle pressure drop on the development of vortex structures and turbulent fluctuations. Qin [4] employed the technique of specifying input boundary conditions for their numerical research and effectively characterized the spatial distribution of droplet velocity utilizing the Reynolds-averaged Navier–Stokes prediction method. Zhao Liang et al. [5] developed a visual nozzle model to depict the flow field characteristics and observed that the circumferential effective spray density of the external flow exhibited a double-peak distribution, with the peaks positioned near 120° and 280°. During the movement of the water jet nozzle, various factors such as system resistance, the quantity of return water, the inclination angle of the drill bit, and the speed of movement all influence the friction coefficient (k). Additionally, both the friction coefficient (k) and the geometry of the nozzle play a crucial role in the nozzle’s motion and the generation of eddy currents [6,7,8,9,10]. Molly et al. [11,12] used the standard k-ε two-equation model to analyze the flow field in the wellbore of the nozzle with varying back nozzle parameters. It is proposed that the self-propelled water jet nozzle will generate a vortex zone under the combined action of the front and rear nozzles. The size and position of this vortex will have an impact on both the efficiency of the water flow and the friction between the high-pressure hose and the water jet nozzle. Additionally, the resistance experienced by the nozzle could potentially shorten its service life.
In terms of nozzle structure, Wen et al. [13] studied the jet characteristics of nozzles with various structures using the straight cone nozzle model invented by Soviet scholar G.P. Nikonov and their self-developed test platform. The straight cone nozzle exhibits excellent structural parameters and performance. Li Jian et al. [14,15,16] investigated the impact of various nozzle structures on dynamic pressure conversion, jet velocity, and turbulent kinetic energy conversion by creating nozzle models with different shapes and employing 2023 version of Fluent and Gambit software. For two kinds of conical nozzles with different structures, the velocity, pressure, medium, and other physical quantities of high-pressure water jet flow field are numerically simulated and analyzed by the computational fluid dynamics method. The SIMPLEC algorithm is used to obtain a residual error of less than 10−4, and the two nozzles are compared. Chen [17] provided a quantitative analysis of the external parameters of the ultra-high-pressure water jet nozzle and the optimization method of jet core parameters. Wang et al. [18] obtained the optimal high-pressure nozzle structure and striking distance through structural design, model establishment, numerical simulation, and result analysis of high-pressure nozzles. Mohammad et al. [19,20,21] studied a simulation model by calculating the pressure pulse and shear force generated by turbulent kinetic energy. Based on the k-ε model, the low Reynolds number non-Newtonian model, and the RKE and RNG versions of the non-Newtonian damping function, they used these tools to numerically simulate the turbulent flow of the drag-reducing fluid within the pipeline. Mohammadi [22] proposed a full-scale computational fluid dynamics CFD model that utilizes three types of tanks for modeling: circular, square, and square-arc angle tanks. Using fluent software, the optimal arrangement of the number of inlets, the inlet position, the inlet angle, and the number of nozzles on each inlet is reconfigured. These equations govern the average turbulent flow of water, enabling the creation of an optimized fluid domain. Adarsh et al. [23] leveraged ANSYS Fluent to solve the Navier–Stokes (N-S) equation for the average turbulent flow field. By adopting a complex conjugate eigenvalue approach based on the velocity gradient tensor, they were able to examine the flow dynamics, turbulence, and vortex structures within the average turbulent flow field. It is found that the convex contour surface inside the elbow is the key eddy current generating surface.
In summary, while the research on nozzle flow fields is abundant, there is a scarcity of studies examining the impact of the rear nozzle inclination angle and nozzle diameter parameters on convection and operational conditions within the pipeline environment of the nozzle. In this paper, a numerical simulation analysis of the flow field within a pipeline for a self-propelled water jet nozzle will be conducted using Fluent. The aim is to investigate the influence of parameters, such as the inclination angle and aperture of the nozzle’s rear section on the flow field, and to analyze the effect of vortex regions on the jet flow velocity within the pipeline.
2. Physical Model and Control Equation
2.1. Physical Model and Simulation Scheme
The nozzle relies on the need for a high-pressure water pump when working. With the high-pressure water pump in action, water flows into the nozzle through the high-pressure hose and is then ejected from the nozzle. The jet expelled by the front nozzle provides the dredging power; the debris is discharged from the pipe through the backflow, achieving the pipe dredging function. Based on the calculation formula for water jet nozzle propulsion [24], the calculation results show that the propulsion of all schemes is positive, which meets the working requirements.
where is rock-breaking pressure in N; is recoil in N; is the number of front nozzle holes; is the number of rear nozzle holes; d1 is front nozzle diameter in mm; d2 is back nozzle hole diameter in mm; p is water pressure in MPa; is the inclination angle of the front nozzle; is the post-spray hole inclination angle; and F is the driving force in N.
The outer diameter of the nozzle is 30 mm, and the inner diameter is 20 mm. The nozzle is arranged as one front nozzle, and three rear nozzles are arranged around each other at 120° intervals. Since this paper mainly studies the flow field in the pipeline, the nozzle modeling is simplified. Compared with the traditional nozzle with only the front hole, due to the existence of the rear nozzle hole, the rear jet can provide the reverse thrust for the whole nozzle during the operation process, so that the whole nozzle can rely on the reverse thrust of the rear jet flow to advance along the path without external force, and the rear jet can improve the fluid discharge efficiency. The nozzle aperture is 2 mm, and the control group is 3.5 mm. The nozzle length is 10 mm. The schematic diagram of the nozzle is shown in Figure 1.
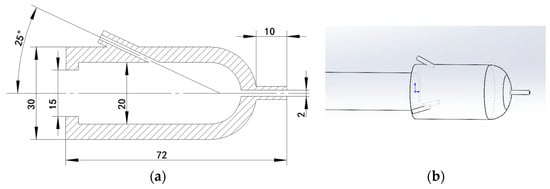
Figure 1.
(a) Nozzle parameter engineering drawing; (b) Nozzle modeling 3D schematic diagram.
In this paper, SolidWorks was utilized to model the flow field and then imported into Fluent for numerical simulation. A comparison was made between a nozzle with only a front nozzle and a nozzle with a rear nozzle, which can provide self-propelled thrust. The interaction between the front and rear nozzles can create a vortex area in the pipeline. The water vortex, with its ability to wrap gravel, influences the characteristics of the slag discharge and the injection of the nozzle jet. The water jet ejected by the front and rear nozzles generates a balanced force, enhancing the stability of the nozzle operation.
To explore the influence of nozzles with different axis angles and apertures on the working flow field of the nozzle in the pipeline, a numerical simulation scheme was implemented. The arrangement consisted of one front nozzle and three rear nozzles, with a 120° interval between the rear nozzles. The study examined the flow field differences under the same initial velocity condition with varying axis angles. The research is mainly aimed at the rear nozzle inclination angle of the four schemes, 30°, 35°, and 40°, for the rear nozzle axis angles, with an increased diameter of 3.5 mm as a control group for research purposes. The specific scheme design is detailed in Table 1.

Table 1.
Conceptual design.
2.2. Governing Equation
- (1)
- Continuity equation:
Because it is an incompressible liquid, / = 0
- (2)
- Navier–Stokes equations:
In this paper, the simulation environment is an incompressible liquid, and there is complex turbulence. Therefore, the k-ε two-equation model is used for numerical simulation.
- (3)
- The momentum equation:
- (4)
- Turbulent kinetic energy equation:
2.3. Turbulent Eddy Viscosity Model
The direction of the rear jet is opposite to the direction of the incoming flow inside the jet bit, resulting in a very large curvature of the streamline at the inlet of the rear jet, creating a vortex zone [25]. The RNG k-ε two-equation model enhances the k-ε model under high Reynolds number and strong swirl conditions. This equation can reflect the influence of small-scale by large-scale motion and a modified viscosity term to reduce the error and accelerate the convergence of calculations [26,27].
2.4. Mesh Setting and Mesh Independence Verification
In order to enhance the calculation accuracy, mesh refinement has been applied to the outlet area. The naming selection is shown in Figure 2. Assuming that the front end of the pipe constitutes a blockage, it is designated as the “wall”. The maximum and minimum values of the mesh element quality are in the range of 0~1, and the average value is 0.83924. The maximum aspect ratio is 8.7097, the minimum value is 1.1579, and the average is 1.841. The minimum value of skewness approaches 0, the maximum is 0.67254, and the average value is 0.22574. The above data show that the mesh division quality is good and in compliance with the mesh standard.
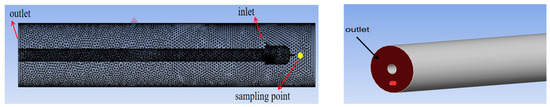
Figure 2.
Mesh division and boundary condition naming.
To accurately identify small features in the model, local grid refinement technology is applied at the outlet of the nozzle where the velocity gradient changes significantly, whereas a sparse grid is employed at the outlet of the nozzle where the velocity gradient changes minimally. To validate the grid independence of varying densities and compare the velocity variations at the same position and under the same scheme for different grid numbers, this study examines the velocity at points with coordinates (70, 0, 0) (Figure 2) located at the outlet of the front nozzle, as illustrated in Figure 3. The grid numbers are 340,000, 650,000, 950,000, and 1.77 million, respectively. The results indicate that, after reaching 950,000 grids, there is no notable change in the outcomes with further increments in grid numbers. Consequently, to expedite the numerical calculations, a grid value of 950,000 is utilized for the simulation.
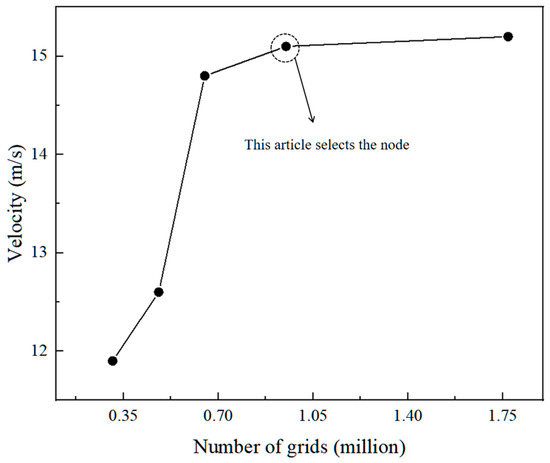
Figure 3.
Mesh independence verification.
2.5. Solution Method and Boundary Condition Setting
In this paper, Fluent software is utilized for conducting simulation experiments. The solver type is configured as pressure-based, the velocity format is set to relative, and a transient environment is selected for the simulation. The solution method is set to coupled, and the initialization method is configured as hybrid initialization. This initialization approach can enhance the convergence of the calculation results by adjusting the relaxation factor. The boundary conditions are set as follows:
- (1)
- The RNG model in the k-ε (2 eqn) model was selected. The wall function selects the standard wall function.
- (2)
- The model constants were Cmu = 0.0845, C1-Epsilon = 1.42, C2-Epsilon = 1.68.
- (3)
- The material is liquid water, the nozzle outlet is the inlet of the fluid domain, the inlet is the velocity inlet, the velocity is 25 m/s, and the turbulence intensity is 5%. Considering the influence of gravity, the initial velocity of the y-axis is set to −9.81 m/s.
- (4)
- The outlet condition is the pressure outlet, the initial gauge pressure is 0, the reflux turbulence intensity is 5%, and the reflux turbulence viscosity ratio is 10.
- (5)
- Set the wall as a non-slip solid wall.
- (6)
- The time step method is set to “Automatic”. The length scale method is set to “Conservative”. The time scale factor is set to 1. The number of iterations is set to five hundred. The report interval is set to 0.5. The data update interval is set to 1.
Because it is a turbulence model, the pressure and velocity schemes select the Coupled scheme. The spatial discretization is based on the least squares cell, and the second-order gradient pressure is selected. The momentum is second-order upwind, and the turbulence dissipation rate is one-section upwind. The value of y+ is between 30 and 60. Since the model used in this paper is the k-ε model, which is a high Reynolds number model, the value of y+ meets the calculation requirements within this interval.
3. Analysis of Jet Flow Field in Pipe
Due to the presence of multiple nozzles in the pipeline, the interaction between the multiple jets produces a vortex area. The jet impacts the blocking material and is ejected towards the direction of the pipe outlet. The fragmented material obstructing the flow moves towards the annular area of the pipeline along with the jet flow, compressing the trailing jet and forming a vortex zone. This vortex zone envelops the fragmented material, causing it to impact the obstruction surface once again. Simultaneously, it exerts pressure on the high-pressure hose and the water jet nozzle, thereby influencing the self-propulsion and slag removal efficiency of the water jet nozzle. Additionally, it accelerates the wear and tear of the high-pressure hose and the jet nozzle, consequently reducing their lifespan. Therefore, it is very important to optimize the position and size of the vortex region. Next, the numerical simulation analyzes the vortex region configuration and the flow field within the water jet nozzle pipe.
3.1. Flow Field Analysis of 25° Tilt Angle Rear Nozzle
The simulation results add a y-z plane for vertical plane analysis. The simulation results are shown in Figure 4.
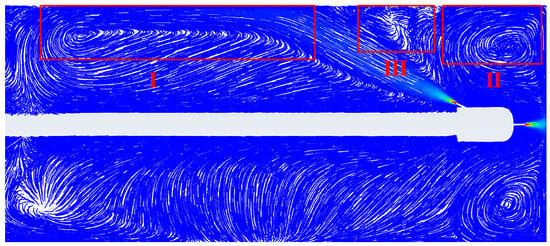
Figure 4.
Aperture 2 mm.
The rear nozzle is oriented at an angle of 25° with respect to the axis. The jet is ejected from the nozzle towards the pipe wall and flows along the pipe wall for a certain distance. After the kinetic energy is exhausted, the low-speed water flow separates from the wall and near the high-pressure hose, being squeezed to produce a large vortex area in Region I. In Region III, the two diffusion jets collide, but their initial distance is large. Due to the weak collision and vibrations, no vortex area is generated. A small angle between the rear jet and the wall increases the stroke, resulting in higher speed loss. The jet near the wall cleans the wall to a certain extent. The presence of the vortex area may carry some debris back toward the nozzle, impacting the high-pressure hose and nozzle components. In Region II, after the front nozzle hits the wall of the blockage, the fluid entrainment breaks the rock and diffuses towards the wall, and the front jet can only flow within a limited range along the wall of the blockage. However, due to the presence of the rear nozzle, the jet from the front nozzle diffuses towards the pipe wall along the blockage surface and is then sucked by the high-speed jet at the outlet of the rear nozzle, flowing into the annulus. Additionally, in the second zone, there is an area where the water flow does not pass through. Although this reduces the interference of the rear jet on the flow field to a certain extent, it also weakens the fluid entrainment effect of the rear jet in Region II, leading to the rapid accumulation of water in that region, thereby hindering the forward jet.
3.2. Flow Field Analysis of 30° Tilt Angle Rear Nozzle
A comparative study was conducted when the inclination angle of the rear nozzle was increased to 30° and the aperture was set to 3.5 mm. The flow field simulation results were extracted from the y-z plane simulations, as depicted in Figure 5 and Figure 6.
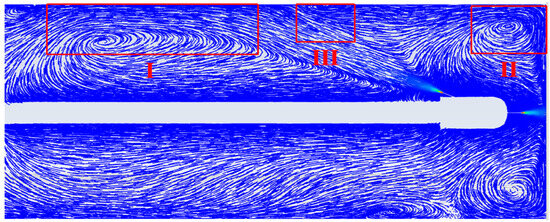
Figure 5.
Aperture 3.5 mm.
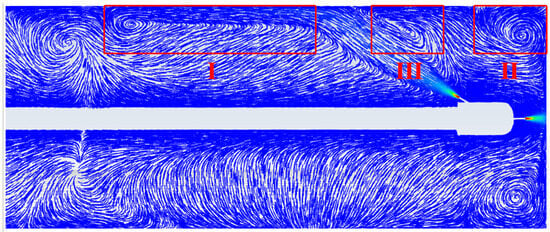
Figure 6.
Aperture 2 mm.
When the inclination angle is increased to 30°, the post-jet trace line of the 2 mm aperture in Region I is virtually identical to the post-jet trace line observed in Region II with a 25° inclination scheme. Consequently, the distance of the post-jet from the wall decreases, velocity attenuation weakens, and the wall is impacted at a higher speed. When the post-jet comes into contact with the wall, the jet diffusion direction becomes non-uniform, spreading out with a slight tendency to diffuse towards the front of the pipe (Region III). Simultaneously, the backflow phenomenon in Region II diminishes, and the vortex area contracts. This is attributed to the increase in the inclination angle of the rear jet, which effectively flushes the backwater in Zone II into the annulus, thereby preventing the formation of vortices in Zone II. Compared to the rear nozzle structure with a 25° tilt angle, the volume of the vortex area in Region II is reduced, significantly enhancing the stability of the flow field in that region.
In comparison to Region II of the 2 mm flow field, it is evident that the vortex area is substantially reduced when the aperture is increased to 3.5 mm. While Region III also demonstrates jet diffusion along the wall, the diffusion is not pronounced enough to form a distinct vortex area. As the aperture size increases, the outlet velocity remains constant, leading to an increase in water output. This enhanced capability allows the rear nozzle jet to efficiently transport residual water from Zone II to the annulus area located at the rear end of the pipeline. Consequently, the accumulation of residual water in Zone II is prevented, resulting in a smaller eddy current area in Zone II when the pore size is 3.5 mm.
3.3. Flow Field Analysis of 35° Tilt Angle Rear Nozzle
With a rear nozzle angle set at 35° and apertures of 3.5 mm and 2 mm, the x-y plane was intercepted for analysis, as illustrated in Figure 7 and Figure 8.
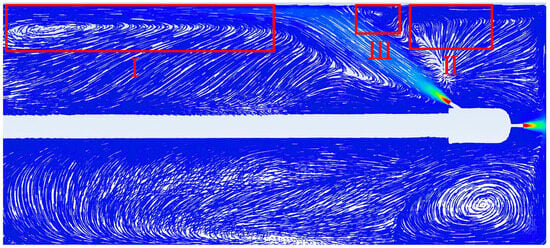
Figure 7.
Aperture 3.5 mm.
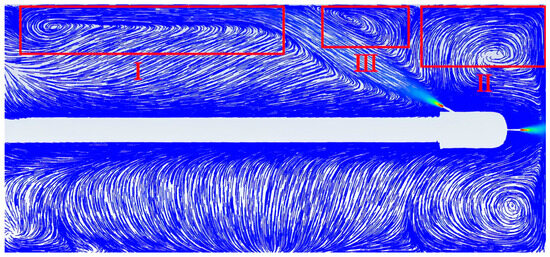
Figure 8.
Aperture 2 mm.
The flow field diagram depicted in Figure 7, showcasing the 35° axis angle rear nozzle with an aperture of 3.5 mm, reveals that the vortex generated in Region I exhibits similarities to the first two cases. However, there is a prominent change in Region II. As observed in Figure 7, there is virtually no backflow phenomenon present in Region II. This absence can be explained by the short flow distance traversed by the front jet along the pipe wall, followed by a notable decrease in flow velocity once it leaves the pipe wall, before the onset of the backflow phenomenon, the flow is subjected to the entrainment effect and is subsequently drawn into the annulus by the powerful high-speed jet from the rear nozzle. The structure efficiently directs the blockage into the rear jet region, ensuring its expulsion from the pipe without any backflow. In Region III of Figure 7, a limited vortex region is observed. This vortex arises due to the rear jet striking the pipe wall at a high velocity and angle, causing the jet to disperse radially from the point of impact. As the dispersed jet interacts with the front jet, they collide and, after oscillating, form a vortex area. However, the extent of this vortex is limited, resulting in minimal disruption to the reaming and dredging operations.
The flow field diagram in Figure 8 clearly demonstrates that the vortex area in Region II, with an aperture of 2 mm, is more extensive than the vortex area observed in the flow field with a 3.5 mm aperture. When compared to the flow field featuring a 30° inclination angle and a 2 mm aperture, an increase in the inclination angle of the rear nozzle leads to an earlier encounter with the backflow in Region I. This premature contact subsequently results in a portion of the backflow being transported toward the rear end of the pipeline through the entrainment effect. However, due to insufficient flow rate and limited entrainment capacity, Zone III still generates a relatively smaller eddy current zone. The reduction in the vortex area in Zone III frees up space in the front-end of the pipeline, having no detrimental impact on the fluid flow from the front end towards the annulus area.
3.4. Flow Field Analysis of 40° Tilt Angle Rear Nozzle
In Figure 9 and Figure 10, the flow field analysis outcomes for the rear nozzle configured with an axis angle of 40° and apertures measuring 3.5 mm and 2 mm, respectively, have been captured along the x-y plane for in-depth vertical plane analysis.
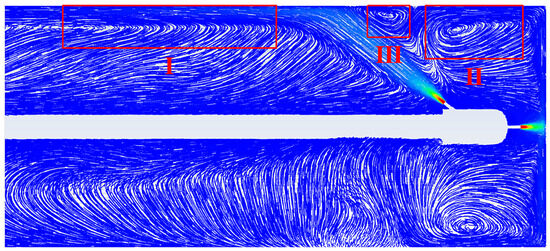
Figure 9.
Aperture 3.5 mm.
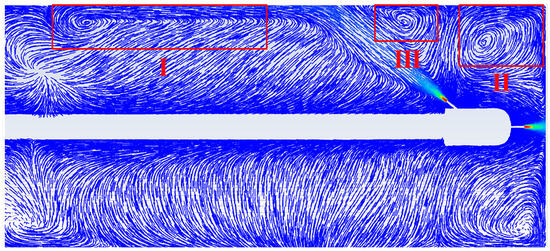
Figure 10.
Aperture 2 mm.
Upon observation of Figure 9, it becomes evident that Region I signifies the rear nozzle generating a more expansive vortex area upon impacting the wall. Despite making contact with the pipe wall over a shorter stroke, this configuration enhances the local wall cleaning capability within a smaller attenuation range. However, the diffusion effect becomes more significant when the jet comes into contact with the pipe wall, causing the dispersed jet to collide with the jet emanating from the front nozzle along the pipe wall. This collision results in a larger vortex area, as depicted in Region III. The enlargement of the vortex area in Region III encroaches on the space where the jet from the front nozzle converges with the high-velocity jet emitted by the rear nozzle, thereby intensifying the backflow problem in Region II and impeding effective drainage. Furthermore, the accumulation of water and debris in Region II, resulting from the obstruction of prompt flow into the annulus outflow pipeline, can hinder the front nozzle’s ability to effectively remove blockages, thereby compromising overall efficiency. This scenario is detrimental to effective cleaning and waste removal, as increasing the angle of the rear nozzle would further diminish the self-feeding efficiency. Figure 10 vividly demonstrates how an increase in the inclination angle of the rear nozzle exacerbates this issue. The size of the vortex area in Region III, as evidenced by Figure 10 with a 2 mm aperture, expands significantly. This finding underscores that the vortex area in Region III is not solely influenced by the angle of inclination of the rear nozzle, but is also significantly dependent on the nozzle diameter and flow rate.
4. Flow Velocity Analysis
4.1. Velocity Analysis of Front Nozzle
In order to observe more clearly the flow field changes in water jet nozzles with different schemes within a slurry pipeline of 200 mm diameter, CFD post-processing was conducted on the Fluent simulation data. In the 2023 version of CFD processing software, the velocity-displacement relationship in the front jet region (indicated by the yellow line in the figure) is examined. The speed data collected along the yellow line are imported into Origin for further analysis and research. The resulting velocity-displacement relationship in this region is presented in Figure 11.
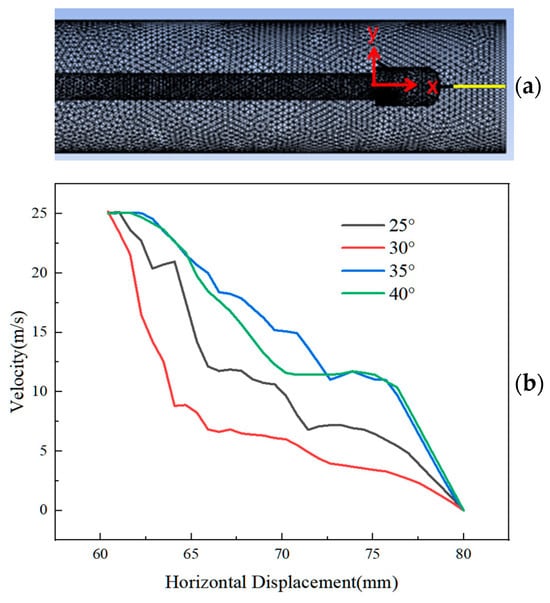
Figure 11.
(a), the yellow line represents the sampling position and the origin coordinates in the model; (b), the velocity and displacement of the fluid near the pipe wall in the flow field with a pore size of 3.5 mm and a rear inclination angle of 25°~40°.
Firstly, the aperture of the four schemes depicted in the Figure 11 is 3.5 mm, and the jet outlet velocity setting is uniform for all of them. The instantaneous space at the front jet outlet enlarges, leading to fluctuations in velocity, while the initial velocities among the four schemes remain relatively similar. However, the velocity subsequently undergoes a rapid decay, which is attributed to the presence of broken rocks within the space and the backflow that cannot be discharged in a timely manner, thus causing obstruction to the jet. On the other hand, the reason for this is that when water flows from a narrow space into a larger space, the kinetic energy of the water jet dissipates rapidly. As the four schemes approach the blocking surface, their velocities undergo rapid changes, which can be attributed to the velocity attenuation that occurs once again due to the wall backflow phenomenon. Through the analysis of the velocity changes in the diagram for the four schemes, it can be concluded that the velocity of the front jet impacting the wall, for schemes with rear jet axis angles of 25°, 30°, 35°, and 40° and an aperture of 3.5 mm, are 5.71 m/s, 4.15 m/s, 8.07 m/s, and 7.72 m/s, respectively. For the scheme with the rear nozzle’s inclination angle of 35°, the front jet exhibits the maximum velocity on the blockage surface, suggesting that the vortex area in the region has minimal impact on jet obstruction and consequently has less influence on the outlet jet velocity. This can impact the blocking surface at a faster speed. Furthermore, the overall velocity variation in the scheme with a rear nozzle axis angle of 35° is smoother compared to the other three schemes, with the exception of a slightly smaller velocity fluctuation of 72 mm. The wall backflow phenomenon is also relatively minor in this case. In the 30° angle rear nozzle scheme, the front jet velocity decays rapidly due to the small angle between the jet axes of the rear nozzle and the water in front of the tube. This results in a weak entrainment effect, making it difficult to efficiently discharge the accumulated water outside the tube.
In terms of the velocity change in the front jet, the overall velocity of the front jet in the scheme with a rear nozzle inclination angle of 35° is greater than that of the other three schemes, and the velocity it reaches when impacting the blockage surface is the highest, the velocity change curve is smoother, and the kinetic energy dissipation rate is lower, which makes it more conducive to the dredging work performed by the water jet nozzle.
4.2. Velocity Analysis of Pipe Wall Flow Field
When the rear jet strikes the pipe wall, the backflow from the front jet creates an interference, leading to varying velocities along the wall at the point of contact. This phenomenon contributes to a complex flow pattern in the vicinity. In analyzing the four different schemes, it is noted that the instantaneous wall velocities vary significantly: 1.22 m/s for the 25° scheme, 1.46 m/s for the 30° scheme, 2.52 m/s for the 35° scheme, and 2.53 m/s for the 40° scheme. Notably, the rear nozzle jet with a 25° axis angle has the longest distance to the wall, resulting in the lowest instantaneous velocity due to substantial kinetic energy loss. As the inclination angle increases, the jet distance shortens, yet the contact wall velocity fails to escalate. This phenomenon is primarily attributed to the intricate interaction between the front jet’s backflow and the rear jet’s entrainment. Consequently, the distance to the wall exerts a significant influence on the energy attenuation of the jet flow.
An analysis of the simulation results for an aperture of 2 mm with varying post-spray hole inclination schemes has been conducted. The numerical relationship between velocity and displacement, measured 20 mm from the pipe wall, was examined, and a line chart (Figure 12) was generated for further analysis.
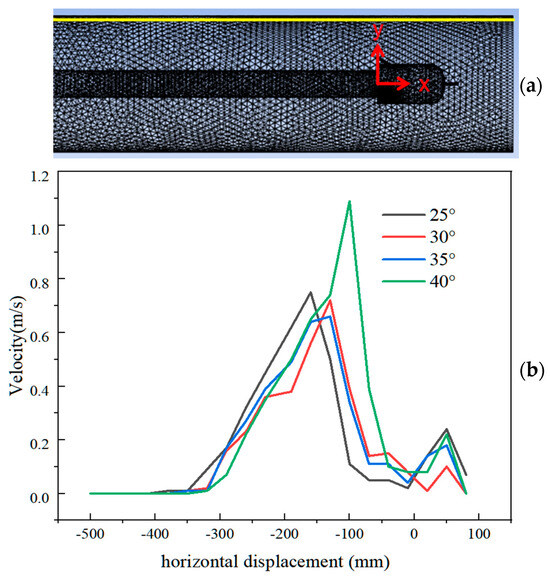
Figure 12.
(a), the yellow line represents the sampling position. The red line is the coordinate system in the model; (b), the velocity and displacement of the fluid near the pipe wall in the flow field with a pore size of 2 mm and a rear inclination angle of 25°~40°.
From the diagram, it is evident that although the 40° inclination scheme exhibits the highest velocity at 20 mm from the pipe wall, this is solely an instantaneous value. This observation can be attributed to the large inclination angle, resulting in a shorter distance between the jet and the pipe wall, which subsequently leads to less kinetic energy loss, thereby producing the highest velocity. However, the velocity of the 40° inclination angle scheme at the front end of the pipeline is not the highest, as the liquid with substantial kinetic energy tends to diffuse along the pipe wall upon impact with the rear nozzle. Upon impacting the pipe wall, the jet of the 40° inclination angle scheme exhibits the shortest stroke, and the instantaneous kinetic energy imparted to the contact pipe wall is the highest, resulting in more diffuse jets, the increased diffusion of water towards the front end of the pipeline, caused by the impact of the front jet on the blocking surface, results in the water being subjected to impacts, vibrations, and vortex generation. Consequently, this hinders the timely flow of water at the front end of the pipeline into the outlet. A significant volume of water converges at the front end, which results in the attenuation of forward jet momentum and a subsequent decrease in velocity. The reflux water and vortex wrap around the gravel, impacting the jet nozzle, which exacerbates wear and ultimately reduces its service life. Upon observing the flow field images of the four schemes, it is apparent that the image of the 35° inclination scheme displays no pronounced mutations at the two peaks, exhibiting a gentler flow compared to the other three schemes. Hence, the flow field of the 35° inclination scheme is more stable, with the least occurrence of vortex and backflow phenomena.
4.3. Analysis of Velocity Displacement Relationship in y Direction
The velocity displacement relationship in the y-direction of the flow field diagrams for various schemes is analyzed (referring to the yellow line position in Figure 13). The maximum speeds recorded for the four schemes at the yellow line position within the 25° to 40° range are 2.479 m/s, 5.881 m/s, 5.692 m/s, and 4.541 m/s, respectively. The limit values for the two schemes with 35° and 40° inclinations are close, with a maximum velocity difference of just 0.189 m/s. However, in the region close to the pipe wall, the overall velocity of the 35° inclination scheme is lower than that of the 40° inclination scheme, but it exhibits greater stability with no significant speed fluctuations. It also shows that the jet in the 35° velocity scheme is less affected by the vortex in this area. In contrast, there are large velocity fluctuations near the wall of the 30° inclination scheme, which is strongly influenced by the vortex region, suggesting the presence of a larger vortex area. Although the maximum velocity at the center point is similar to that of the 35° inclination scheme, the vortex area is more complex, resulting in an overall effect that is not as favorable as the 35° inclination scheme.
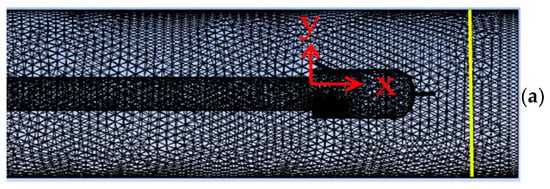
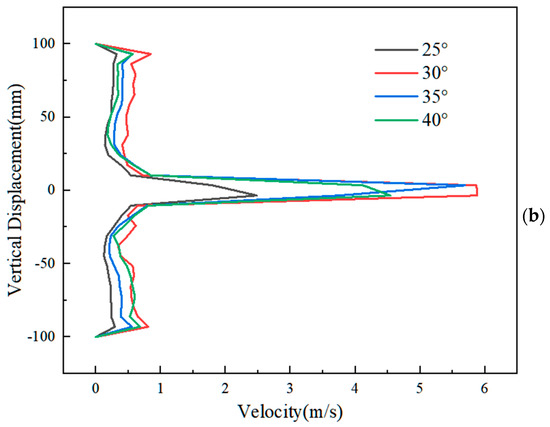
Figure 13.
(a) The yellow line represents the sampling position. The red line is the coordinate system in the model; (b) The velocity-displacement relationship diagram of the sampling position in the flow field diagram with an aperture of 3.5 mm and an inclination angle of 25°~40°.
It can be observed from Figure 13b that each scheme exhibits significant velocity fluctuations near the pipe wall. Furthermore, as the inclination angle increases, the velocity limit does not necessarily increase, and in fact, the maximum velocity decreases when the inclination angle reaches 40°. This is due to the fact that the entire flow field is influenced by the suction effect caused by the rear jet. In the case of the 25° inclination scheme, the inclination angle is too small, causing the jet to be situated far from the front flow field. Consequently, the suction effect is weak and does not significantly contribute to accelerating the backflow discharge; the inclination angle of the 40° inclination scheme is excessively large. Although the rear jet is positioned closer to the front of the pipeline, resulting in a more pronounced suction effect, the increase in inclination angle, When the rear jet hits the wall, the jet that should have flowed into the annulus diffuses around. This results in water accumulation in front of the pipeline, ultimately decreasing the overall drainage efficiency.
4.4. Comparison of Velocity Displacement of Different Aperture Jets
From Figure 14, it is observed that the post-nozzle inclination angle of 35° only increases the nozzle diameter and the remaining conditions remain unchanged. The volume of the vortex area in the 3.5 mm aperture flow field diagram is smaller than that in the 2 mm aperture flow field diagram. The fluent data are post-processed by CFD-POST and further analyzed by the line chart.
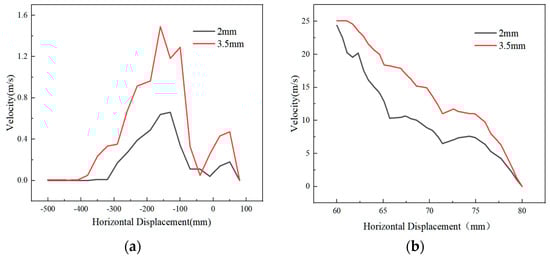
Figure 14.
(a), the scheme with an inclination angle of 35°, and the pore sizes are 2 mm and 3.5 mm, respectively. The velocity and displacement relationship of the fluid near the pipe wall is shown in Figure (a); (b), the scheme with an inclination angle of 35°, and the apertures are 2 mm and 3.5 mm, respectively. The relationship between the velocity and displacement of the fluid at the outlet of the front nozzle is plotted.
The left Figure 14a is the wall fluid velocity map at 20 mm from the wall, while the right image displays the velocity displacement map of the front nozzle jet outlet from the wall. Analyzing the wall velocity line chart of the two apertures in the left figure, it is evident that, apart from a brief instantaneous velocity fluctuation in the 3.5 mm aperture line chart at a horizontal distance of −150 mm from the coordinate origin, the overall velocity is higher than that of the 2 mm aperture. This fluctuation is limited in scope and has a momentary rebound effect. This phenomenon occurs because, with an increase in aperture size, the flow rate rises, leading to more jet impacts on the wall, causing a rebound effect on the forward jet. However, this effect is not significant in other areas.
It can be observed from Figure 14b. that as the aperture size increases, the flow rate also increases. This results in the jet having greater initial kinetic energy and leads to an increase in the water volume in the tube. The increased water volume may not impede the jet ejection. The pre-jet line chart for a 3.5 mm aperture in the outlet area appears smoother compared to the pre-jet image for a 2 mm aperture. At 12 mm from the outlet, the velocity of the front jet decreases first and then increases, attributed to the velocity decrease caused by the vortex area’s influence. However, the jet with a 3.5 mm aperture rebounded faster, indicating a smaller vortex area in the flow field with a 3.5 mm aperture. Similarly, there are two significant fluctuations at the outlet of the pre-jet with a 2 mm diameter, while the fluctuation at the same position for the 3.5 mm aperture is minimal. This can be explained by the fact that increasing the aperture from 2 mm to 3.5 mm reduces the volume of the vortex area in the pipeline, facilitating the flow of water-wrapped debris to the annulus for discharge outside the pipe.
5. Conclusions
In this paper, a simulation model featuring a front-1-rear-3 configuration and a rear nozzle inclination ranging from 25° to 40° has been established. Additionally, a nozzle model with varying aperture sizes has been developed. By utilizing 2023 version of Fluent simulation software, the flow field simulation of the nozzle jet within the pipeline has been conducted, yielding the following conclusions:
- (1)
- The rear nozzle’s varying inclination angles significantly influence the internal flow field of the pipeline. Specifically, when the inclination angle is set at 35°, further increasing the angle leads to a shortened stroke from the outlet to the wall surface, resulting in an elevated instantaneous velocity of the rear jet upon contact with the wall. However, this does not translate to a continual increase in the overall wall velocity.
- (2)
- The interplay between the rear and front jets creates vortex zones and wall backflow within the pipeline, subsequently affecting the jet velocity of the front nozzle. Notably, at an inclination angle of 35° for the rear nozzle, the impact on the flow velocity within the front jet pipe is minimized. Taking the 35° inclined rear nozzle scheme as an example, the jet velocity of the 2 mm aperture front nozzle experiences an attenuation of 77.2%, while the jet velocity of the 3.5 mm aperture front nozzle undergoes an attenuation of 67.7%.
- (3)
- When the inclination angle of the rear nozzle remains constant, augmenting the nozzle aperture from 2 mm to 3.5 mm effectively decreases the size of the vortex area. The vortex area of the 3.5 mm aperture nozzle comprises 63% of that of the 2 mm aperture nozzle. The reduction in this vortex can improve the dredging efficiency and reduce the damage to the workpiece.
Author Contributions
Y.P. conceived and designed the methodology; Z.G. performed the experiment and wrote the manuscript; S.Z. was responsible for software; F.H. performed validation; H.Y. carried out formal analysis. All authors have read and agreed to the published version of the manuscript.
Funding
This research was supported by the Natural Science Foundation of Hebei Province Ecological Intelligent Mine Joint Fund (E2022402102).
Data Availability Statement
Data is contained within the article.
Acknowledgments
I sincerely thank all the teachers, classmates, family members, and friends who have given me help and support in the process of completing this thesis. Without your understanding, encouragement, patient guidance, and selfless help, I would not be able to successfully complete this paper. Finally, thanks to the review experts and editors, thanks to your criticism and suggestions to make this paper can be constantly improved, let me in the academic research progress. Thank you again to all those who have given me help and support. May we grow together and make progress together in the future academic journey.
Conflicts of Interest
The authors declare no conflicts of Interest.
References
- Wang, Y.Q.; Ren, Q.L.; Xue, S.X.; Chen, Z.W.; Zhu, H.Q.; Pang, L. Research on new application technology and equipment of water jet. Fluid Mach. 2018, 46, 36–40. [Google Scholar]
- Peng, H.; Zhang, P. Numerical Simulation of High Speed Rotating Waterjet Flow Field in a Semi Enclosed Vacuum Chamber. CMES Comput. Model. Eng. Sci. 2018, 114, 59–73. [Google Scholar]
- Chen, J.; Yang, R.; Huang, Z.; Li, G.; Qin, X.; Li, J.; Wu, X. Detached eddy simulation on the structure of swirling jet flow field. Pet. Explor. Dev. Online 2022, 49, 929–941. [Google Scholar] [CrossRef]
- Qin, C.; Loth, E. Numerical description of a pressure-swirl nozzle spray. Chem. Eng. Process. Process Intensif. 2016, 107, 68–79. [Google Scholar] [CrossRef]
- Zhao, L.; Li, Y.Q.; Zhang, D.; Shen, S.Q. Experimental study on the characteristics of internal and external flow field of spiral nozzle. J. Chem. Ind. 2024, 8, 1–16. Available online: http://kns.cnki.net/kcms/detail/11.1946.TQ.20240618.1113.004.html (accessed on 1 January 2024).
- Shaji, K.; Lee, K.-K.; Salmani, F.; Kim, H.D. Numerical analysis and an approach for optimization of the Ranque–Hilsch vortex tube for a compressible flow. Appl. Therm. Eng. 2024, 243, 122590. [Google Scholar] [CrossRef]
- Liu, Y.; Dai, S.; Wei, J.P.; Guo, X.H.; Yuan, Y.W. Study on the motion equation and key parameters of self-propelled rotary drill hole repair. J. Henan Polytech. Univ. 2023, 9, 2021110075. [Google Scholar]
- Liu, Y.; Liang, B.C.; He, A.; Wei, J.P. Research on Drilling REPAIR theory and Key Parameters of Self-Propelled Rotary Drill Bit; China Safety Production Science and Technology: Beijing, China, 2016; Volume 12, pp. 39–44. [Google Scholar]
- Xiao, S. Study on the Flow Field Characteristics of Self-Rotating Jet and the Mechanism of Coal and Rock Breaking. Ph.D. Dissertation, Chongqing University, Chongqing, China, 2019. [Google Scholar] [CrossRef]
- Mitra, A.; Murugan, S.; van Hout, R.; Kleiman, A.; Raizner, M.; Cukurel, B. Near-field flow characteristics of a free coaxial jet. Int. J. Heat Fluid Flow 2023, 103, 109186. [Google Scholar] [CrossRef]
- Li, M.; Wang, J. Numerical simulation of flow field in self-propelled nozzle wellbore. J. Cent. South Univ. 2015, 46, 3656–3662. [Google Scholar]
- Du, P.; Peng, X.; Wei, Z.; Xu, B. Flow field investigation of a straight–swirling integrated jet for radial jet drilling. Energy Rep. 2022, 8, 7434–7443. [Google Scholar] [CrossRef]
- Wen, J.; Chen, C. Optimizing the Structure of the Straight Cone Nozzle and the Parameters of Borehole Hydraulic Mining for Huadian Oil Shale Based on Experimental Research. Energies 2017, 10, 2021. [Google Scholar] [CrossRef]
- Li, J.C.; Li, H.Y.; Chen, J.; Yang, Y.M. Study on the effect of nozzle structure on the performance of vacuum jet atomization. J. Vac. Sci. Technol. 2014, 34, 101–105. [Google Scholar]
- Yang, G.L.; Zhou, W.H.; Liu, F. Flow field simulation of high pressure water jet nozzle based on fluent. J. Lanzhou Univ. Technol. 2008, 2, 49–52. [Google Scholar]
- Tang, M.Z.; Cai, Y.; Chen, L.Y.; Li, Y.F. Design of high pressure water jet nozzle structure and flow field simulation based on CFD. Mech. Des. 2023, 12, 25. [Google Scholar] [CrossRef]
- Chen, Z.S.; Huang, L.Y.; Du, B.X.; Chen, Y.J.; Ni, L.X.; Jiang, H. Study on hydrodynamic characteristics of ultra-high pressure water jet nozzle. Explos. Shock. 2022, 42, 158–171. [Google Scholar]
- Wang, Y.X.; Wang, Z.W.; Zhang, M.J.; Meng, F.G.; Song, Y.X.; Zhang, L.H. Research on flow mechanism and structural optimization design of high pressure nozzle. J. Vac. Sci. Technol. 2024, 08, 1–8. [Google Scholar] [CrossRef]
- Niazi, M.; Ashrafizadeh, S.N.; Hashemabadi, S.H.; Karami, H. CFD simulation of drag-reducing fluids in a non-Newtonian turbulent pipe flow. Chem. Eng. Sci. 2024, 285, 119612. [Google Scholar] [CrossRef]
- Wang, G.; Yang, F.; Wu, K.; Ma, Y.; Peng, C.; Liu, T.; Wang, L. Estimation of the dissipation rate of turbulent kinetic energy: A review. Chem. Eng. Sci. 2020, 229, 116133. [Google Scholar] [CrossRef]
- Yang, Y.; Li, W.; Shi, W.; Zhang, W.; El-Emam, M.A. Numerical Investigation of a High-Pressure Submerged Jet Using a Cavitation Model Considering Effects of Shear Stress. Processes 2019, 7, 541. [Google Scholar] [CrossRef]
- Moghadam, M.M.; Islami, H.R.; Ezam, M.; Mousavi, S.A. Optimizing flow uniformity and velocity fields in aquaculture tanks by modifying water inlets and nozzles arrangement: A computational fluid dynamics study. Aquac. Eng. 2024, 106, 102431. [Google Scholar] [CrossRef]
- Adarsh, V.; Kaustav, C. The vortex structures of the mean turbulent flow field in a 90-degree bend pipe. Eur. J. Mech.-B/Fluids 2023, 98, 21–31. [Google Scholar]
- Wei, Y.; Zhang, D.; Wang, L. Calculation of self-propelled rotating water jet self-propelled force. Coal Mine Mach. 2007, 8, 14–15. [Google Scholar] [CrossRef]
- Feng, Q.; Bu, Q.; Liu, S. Similarity analysis and numerical simulation of flow field in rotating disk cavity with pre-swirl nozzle. J. Northw. Polytech. Univ. 2003, 2, 239–243. [Google Scholar]
- Dong, Z.Z.; Fu, B.W.; Guo, C.; Xi, Y.Q. Flow field simulation analysis of high pressure water jet nozzle based on CFD. Pet. Petro Chem. Equip. 2016, 19, 20–23. [Google Scholar]
- Zhang, S.; Tao, X.; Lu, J.; Wang, X.; Zeng, Z. Structure Optimization and Numerical Simulation of High Pressure Water Jet Nozzle. Mater. Sci. Eng. Prog. 2015, 2015, 732054. [Google Scholar]
Disclaimer/Publisher’s Note: The statements, opinions and data contained in all publications are solely those of the individual author(s) and contributor(s) and not of MDPI and/or the editor(s). MDPI and/or the editor(s) disclaim responsibility for any injury to people or property resulting from any ideas, methods, instructions or products referred to in the content. |
© 2024 by the authors. Licensee MDPI, Basel, Switzerland. This article is an open access article distributed under the terms and conditions of the Creative Commons Attribution (CC BY) license (https://creativecommons.org/licenses/by/4.0/).