Article

Experimental and Parametric Analysis of Pull-Out Resistance of Notched T-Perfobond Connectors

1
College of Civil Engineering, Huaqiao University, Xiamen 361021, China
2
Key Laboratory for Intelligent Infrastructure and Monitoring of Fujian Province, Huaqiao University, Xiamen 361021, China
3
Department of Bridge Engineering, Tongji University, Shanghai 200092, China
*
Author to whom correspondence should be addressed.
Appl. Sci. 2024, 14(16), 7089; https://doi.org/10.3390/app14167089
Submission received: 7 July 2024 / Revised: 3 August 2024 / Accepted: 11 August 2024 / Published: 13 August 2024
(This article belongs to the Special Issue Advances in Bridge Design and Structural Performance: 2nd Edition)

Abstract

:
To enhance the uplift capacity and facilitate the installation of multi-row perfobond connectors at shallow burial depths, this study puts forward a novel notched T-perfobond connector. The design incorporates an integrated flange at the bottom of the connector and a notch at the edge of the hole. Through pull-out model tests on four notched T-perfobond connectors, this research investigates their failure mechanisms and pull-out capacities. Utilizing the explicit dynamics method in ABAQUS, a finite-element model of the pull-out resistance test for notched T-perfobond connectors is established and verified against experimental data. Furthermore, a detailed parametric analysis involving 54 models is conducted, examining crucial parameters such as rib dimensions, hole geometry, flange size, notch width, bar diameter, and material properties. Based on the combined experimental and numerical results, this paper assesses the suitability of current formulas for calculating the pull-out capacity of perfobond connectors and proposes a refined calculation method specifically for notched T-perfobond connectors. All the findings reported in this paper can serve as a reference in the design and construction of composite structures.

1. Introduction

As pivotal interfacing elements in composite structures, perfobond connectors have been widely utilized in various structural systems, such as composite beams, hybrid beams, composite towers, bridge decks, and composite anchorages [1,2,3,4], due to their outstanding shear resistance and fatigue resistance, as well as ease of installation.
In recent years, extensive research has been conducted on perfobond connectors, employing a variety of methodologies. Physical modeling, the first of these methodologies, involves the creation of scaled or full-sized replicas of the connectors and the structures they are a part of. In particular, push-in, push-out, and pull-out model tests are usually used to obtain the shear and tensile behavior of perfobond connectors [5,6,7,8,9,10]. This hands-on approach allows researchers to observe, firsthand, the mechanical interactions that occur under real-world conditions, such as the distribution of forces and the development of stresses within the composite system. Physical models are particularly useful for studying complex interactions that cannot be fully captured by computational methods alone.
The second methodology is computational simulation, which leverages advanced software tools, such as ABAQUS (https://www.3ds.com/products/simulia/abaqus accessed date 10 August 2024) and ANSYS (https://www.ansys.com/ accessed date 10 August 2024), to create virtual models of perfobond connectors and the composite structures they are used in [11,12,13,14,15,16]. These simulations can account for a wide range of variables, including material properties, loading conditions, and environmental factors. By simulating various scenarios, researchers can predict the behavior of perfobond connectors under different circumstances, which is invaluable for optimizing their design and application.
Theoretical analysis, the third methodology, involves the development of mathematical models to describe the behavior of perfobond connectors [17,18,19,20,21,22]. This approach is based on established principles of mechanics and materials science and can provide deep insights into the fundamental mechanisms at play. Theoretical models can be used to derive equations that predict shear performance and pull-out characteristics, offering a basis for the design and evaluation of perfobond connectors.
Substantial research has been devoted to the fundamental mechanical attributes of perfobond connectors within conventional concrete slabs, yet some knowledge deficits persist [23,24,25]. For example, specific composite structures such as ultra-thin bridge decks possess an exceptionally thin concrete layer, raising the slab’s out-of-plane uplift resistance to a critical concern. Nevertheless, current literature mainly focuses on shear performance, frequently neglecting pull-out behavior.
Moreover, the insertion of steel bars to enhance connector performance is highly advantageous, but the closed circular holes of conventional perfobond connectors impede this procedure, necessitating the exploration of the mechanics of notched perfobond connectors. Enlarging the notch to align with the hole size might compromise the pull-out capacity, resulting in our proposal to incorporate a flange into the design of the notched perfobond connector.
In addition, although thin concrete components are prone to tensile cracking, the utilization of ultra-high-performance concrete (UHPC) could significantly enhance crack resistance. In spite of this, there is a marked scarcity of studies investigating the mechanical properties of perfobond connectors in UHPC settings.
Our research presents a novel notched T-perfobond connector devised to surmount the obstacles of insufficient pull-out bearing capacity in shallow-embedded multi-row connectors and the difficulty of steel bar penetration. The model test provides the pull-out bearing capacity of this new connector, and an ABAQUS finite-element model is constructed and validated with experimental data. Subsequently, 54 parametric models are formulated to analyze the key factors influencing performance. The study concludes with the proposition of a calculation method for the pull-out bearing capacity of the redesigned connector.

2. Pull-Out Test

2.1. Test Program

As shown in Table 1, four pull-out tests were conducted on the T-perfobond connectors and notched T-perfobond connectors. The aims were to obtain the failure mode, ultimate pull-out resistance, and load-separation behavior of the notched T-perfobond connectors and to verify the reliability of the finite-element analysis. Depending on the type of connection, these specimens can be evenly divided into the following two groups: PFR specimens with a flange of the same material at the bottom of the perfobond connector to enhance the pull-out resistance of the specimens and PMFR specimens with a notch at the bottom edge of the perfobond including the flange. The main parameters of the pull-out test specimens are the hole length (dl), hole height (dh), rib thickness (tp), rib length (lp), the width of the flange of the perfobond connector (bf), the thickness of the flange (tf), the length of the flange (lf = lp), the width of the notch (cw), and the diameter of the rebar (dr). P denotes the connecting piece, R represents for the penetrating rebar, F corresponds to the flange, and M represents the notch.

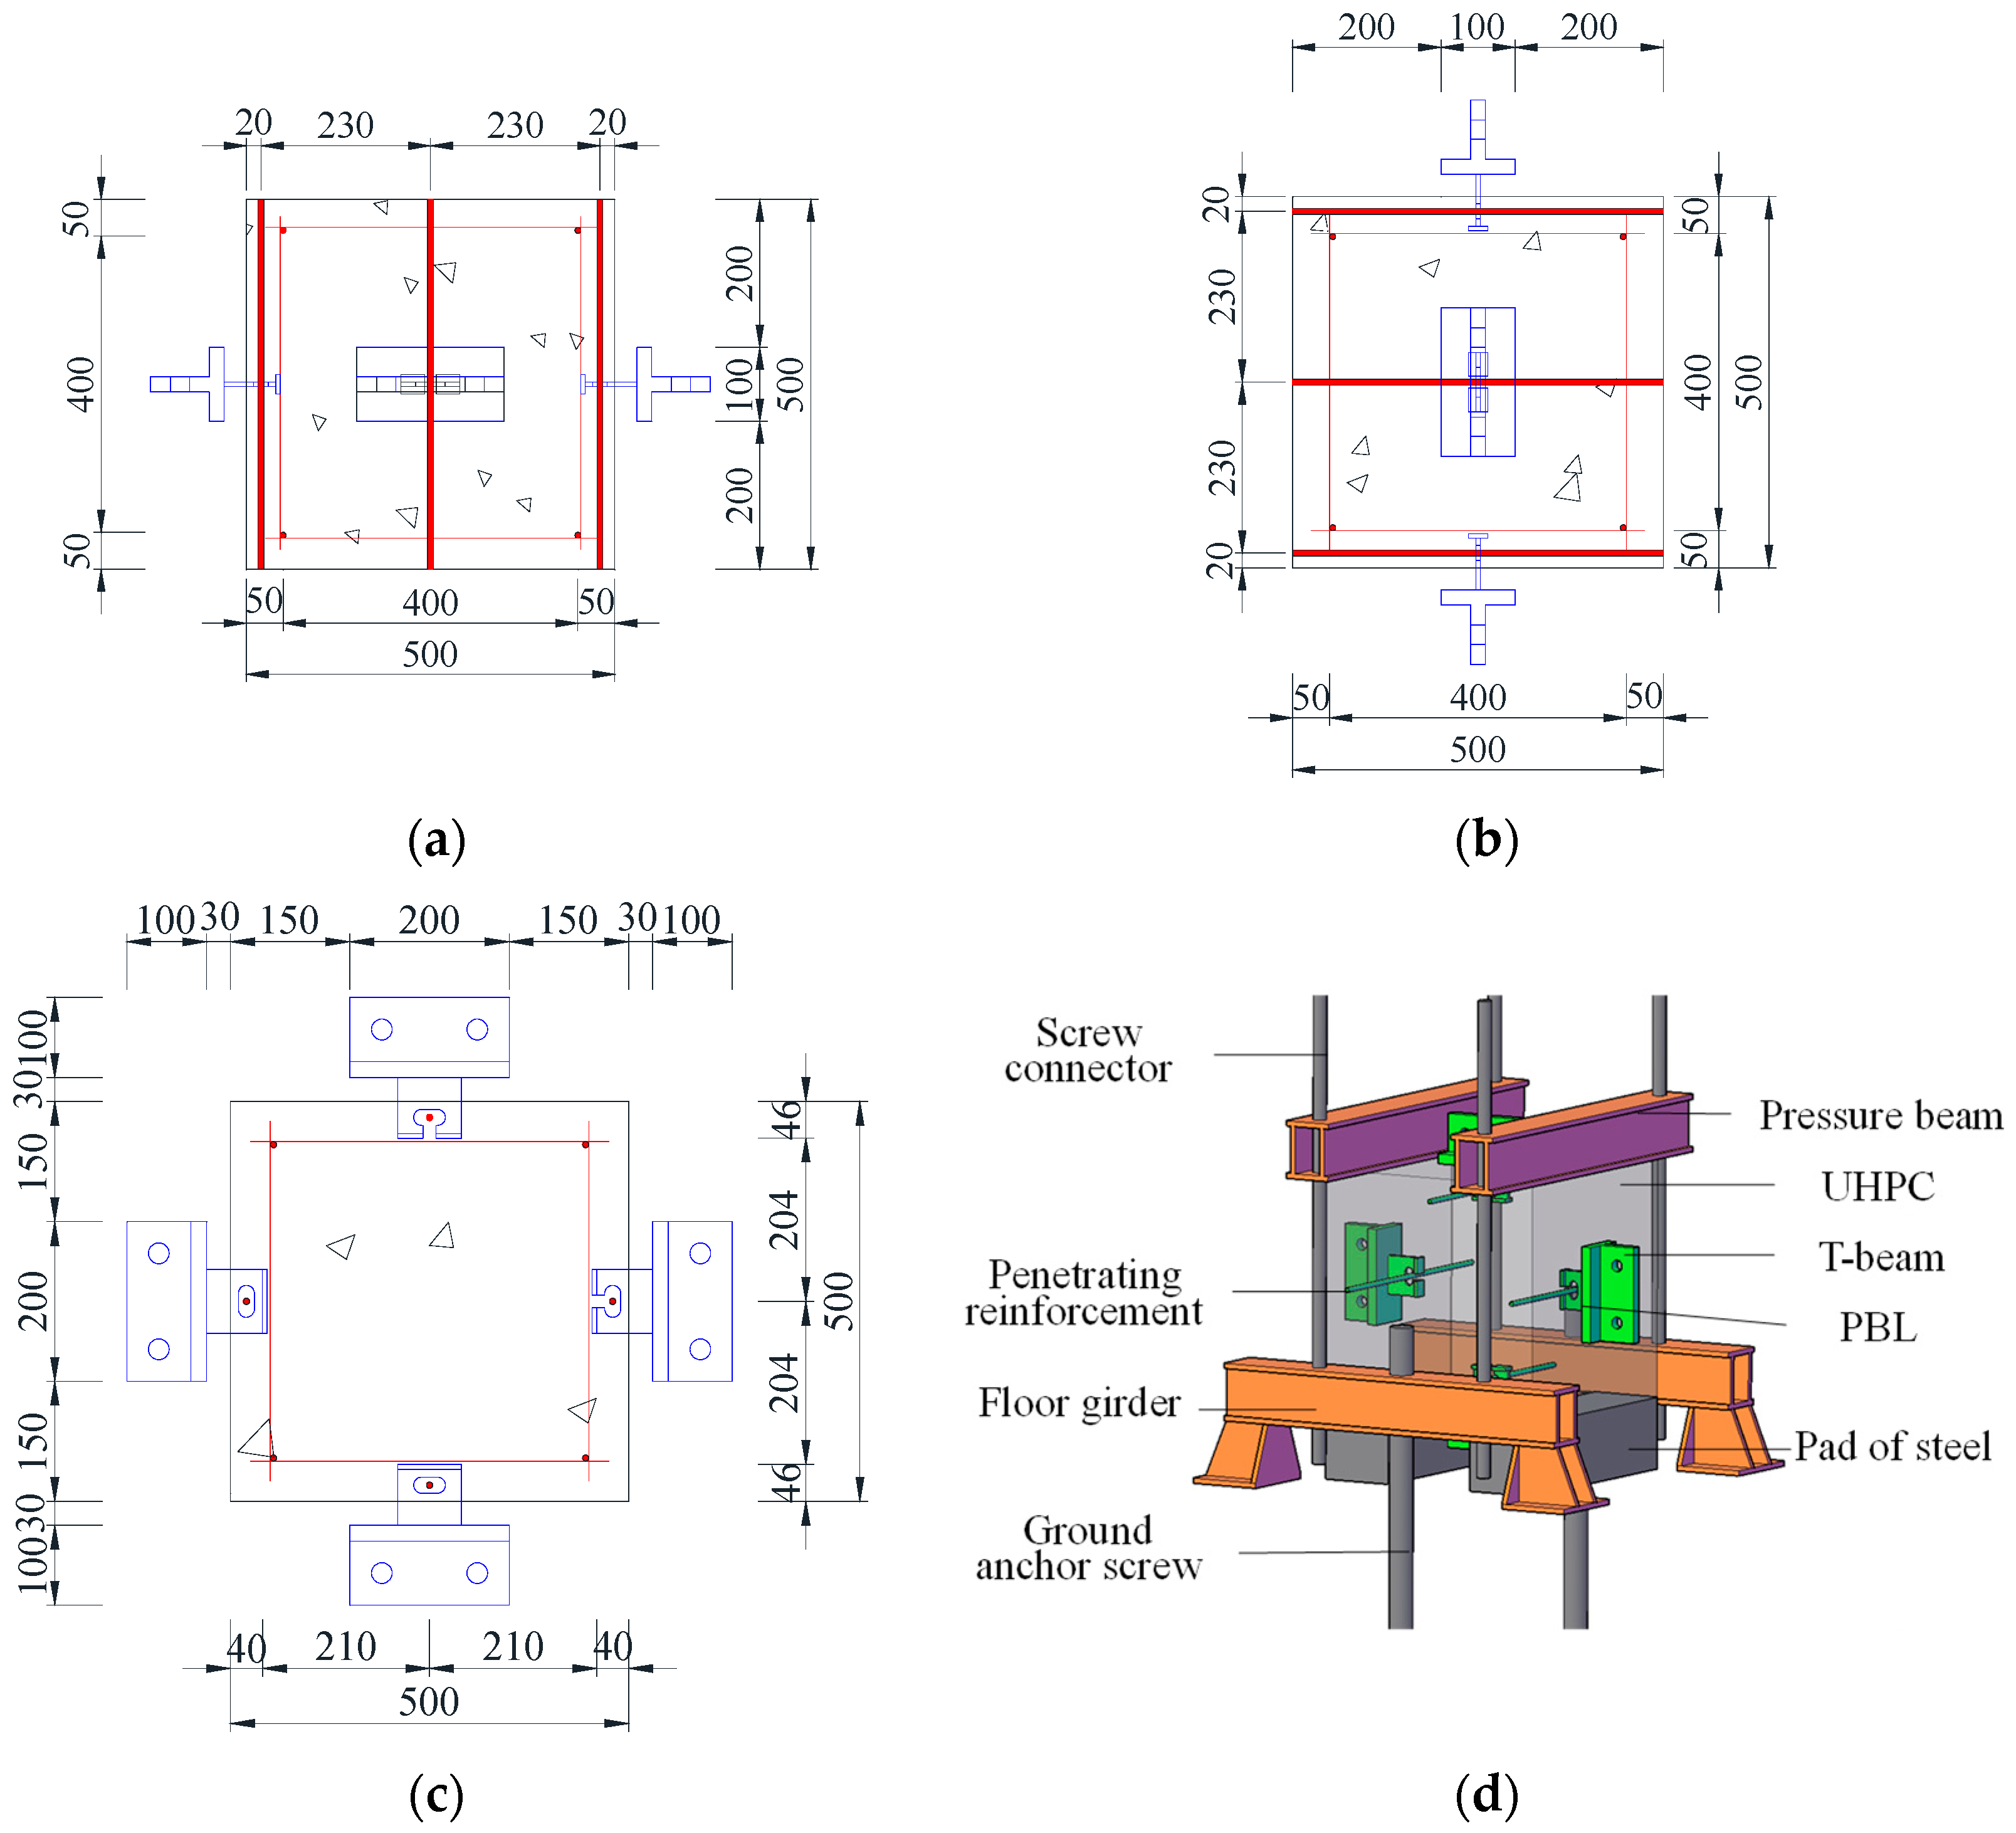
2.2. Specimen Layout

Figure 1 presents the constructional forms of the pull-out model specimens for the perfobond connector. The standard-model UHPC cube has a size of 500 mm × 500 mm × 500 mm. The T-perfobond rib is physically attached to the steel beam through welding. In the pull-out test, the prototype steel beam only needs to retain its steel flange and a portion of the web, forming a T-beam. Perfobond shear connectors are vertically welded to the T-beam, and the actuator is connected to the T-beam to transfer the force to the perfobond rib. Considering that the penetrating rebar is not truncated for its full length in the actual project, it is designed to be equal to the side length of the UHPC cube at the geometric center of the hole. The buried depth (h) of the notched T-perfobond shear connectors is 40 mm. A 6 mm-thick flange is added to the bottom of the connectors to increase the thickness, with an actual buried depth of 46 mm. A 30 mm space is left between the T-beam and the concrete surface to facilitate the observation of damage to the concrete and the perfobond rib. Four specimens are embedded along all four sides of the UHPC cube. Due to the shallow buried depth of the specimens, they do not affect each other, and the design can reduce the use of UHPC materials by approximately 40%.

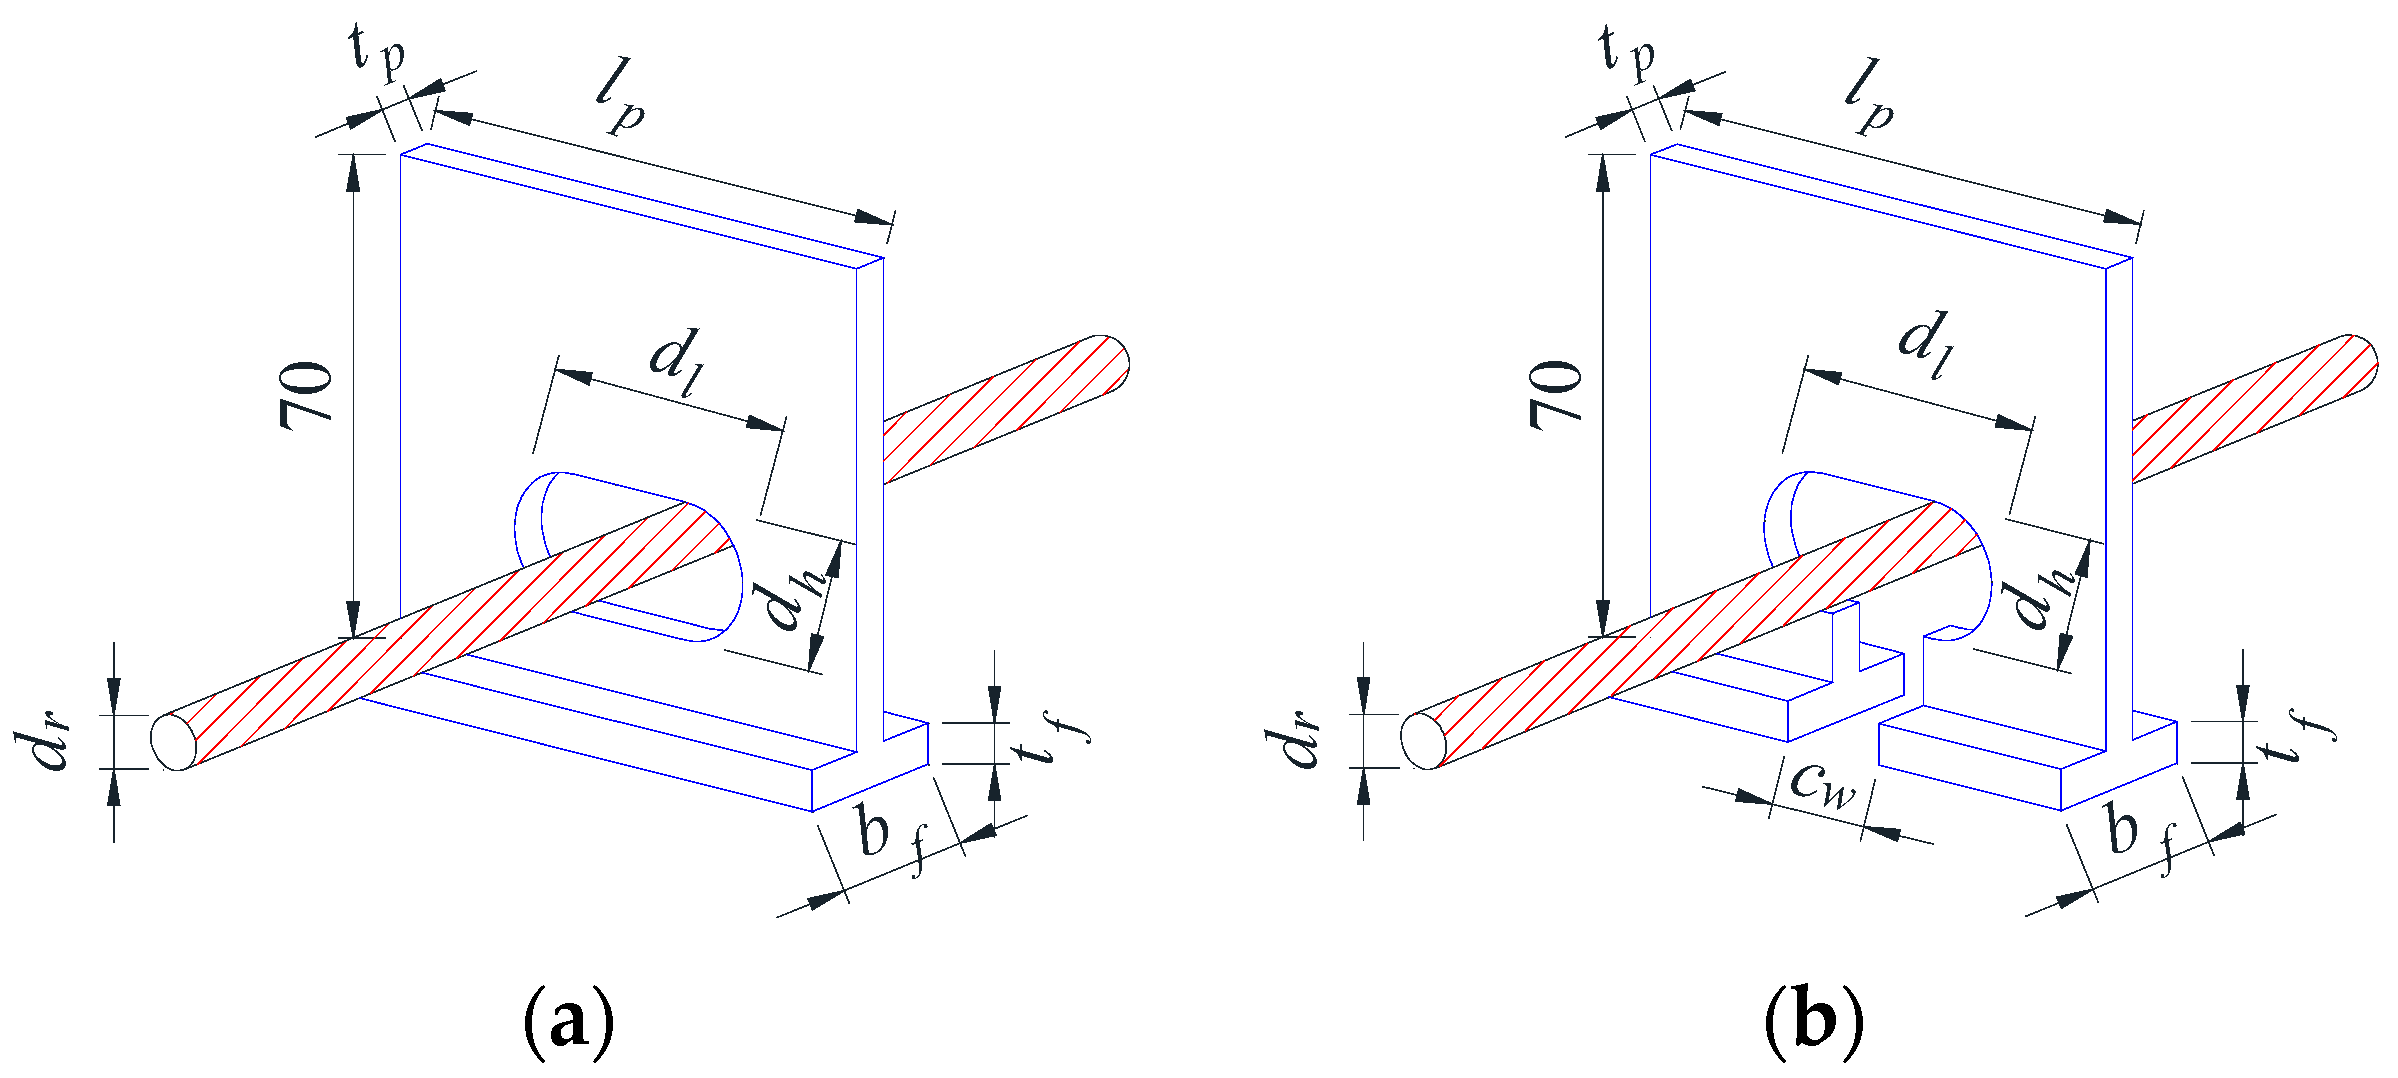
2.3. Details of Perfobond Ribs

Figure 2 shows the detailed structure and dimensions of the pull-out specimens of perfobond connectors. The material properties and construction dimensions of the perfobond connectors are the same, except for the presence or absence of notches, and the two groups of pull-out specimens are provided with penetrating rebars. Since the embedment depth of the perfobond connectors is only 40 mm, to increase the pull-out resistance of the members, all specimen holes are long and transverse.

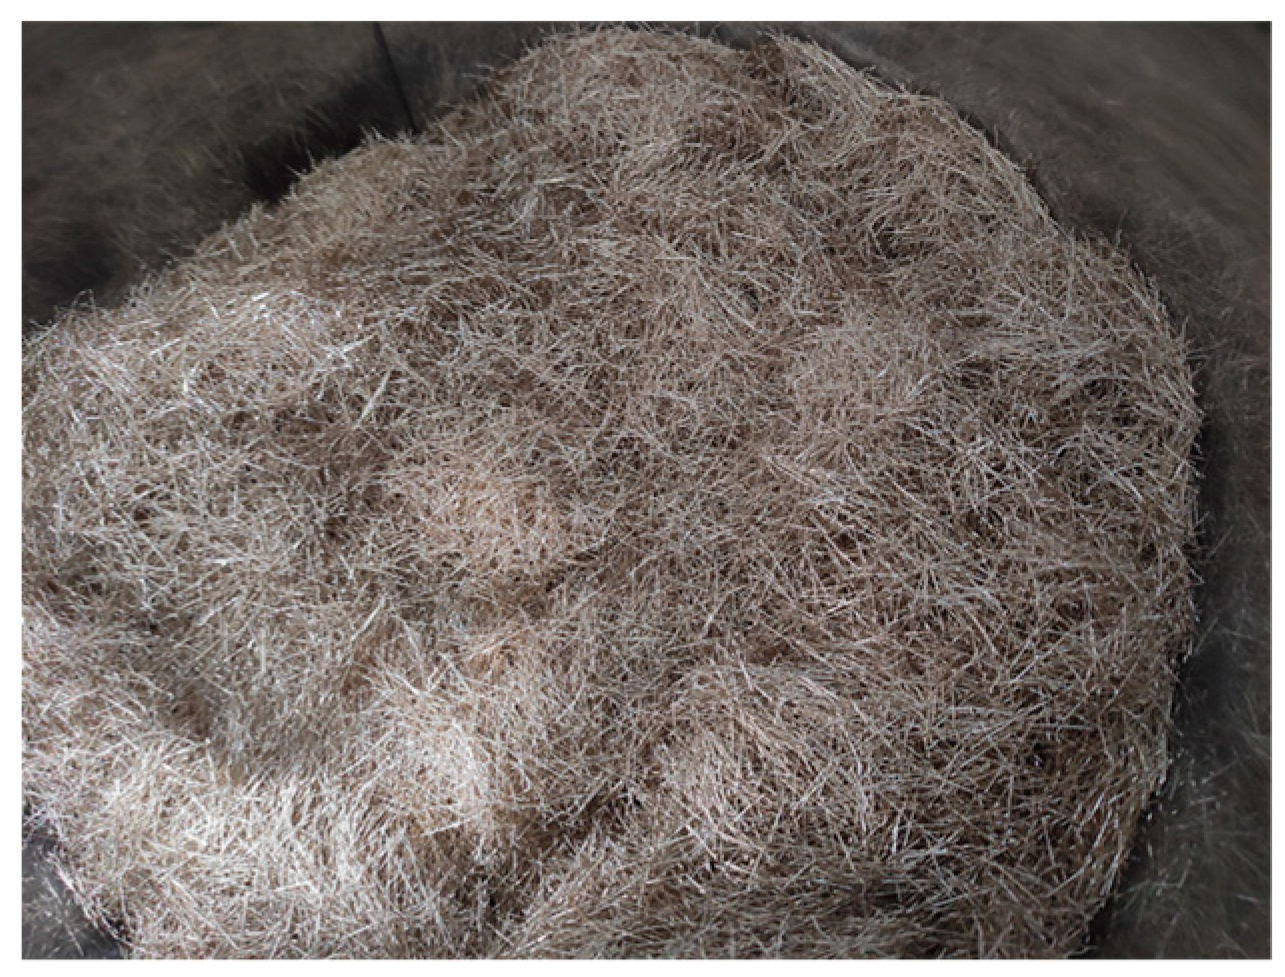
2.4. Material Properties

As depicted in Figure 3, steel fibers, accounting for approximately 6.78% of the mass fraction, are integrated into the ultra-high-performance concrete (UHPC) to enhance its ultimate tensile resistance. These steel fibers are in the form of straight lengths with a length of 14 mm, a diameter of 0.2 mm, and a tensile strength of 2200 MPa. The concrete’s cubic compressive strength, denoted by fcu, is measured at 118.75 MPa. Correspondingly, the uniaxial compressive strength, represented by fc, stands at 95.00 MPa, which is 80% of fcu. The tensile strength of the concrete, determined using a specimen shaped like a dog bone and labeled as ft, is recorded at 10.38 MPa. For the reinforcing bars, the yield strength (fry) and ultimate tensile strength (fru) are 351.30 MPa and 691.50 MPa, respectively. In the case of the perfobond rib and its flange, the yield strength (fsy) and tensile strength (fsu) are 384.67 MPa and 531.33 MPa, respectively.

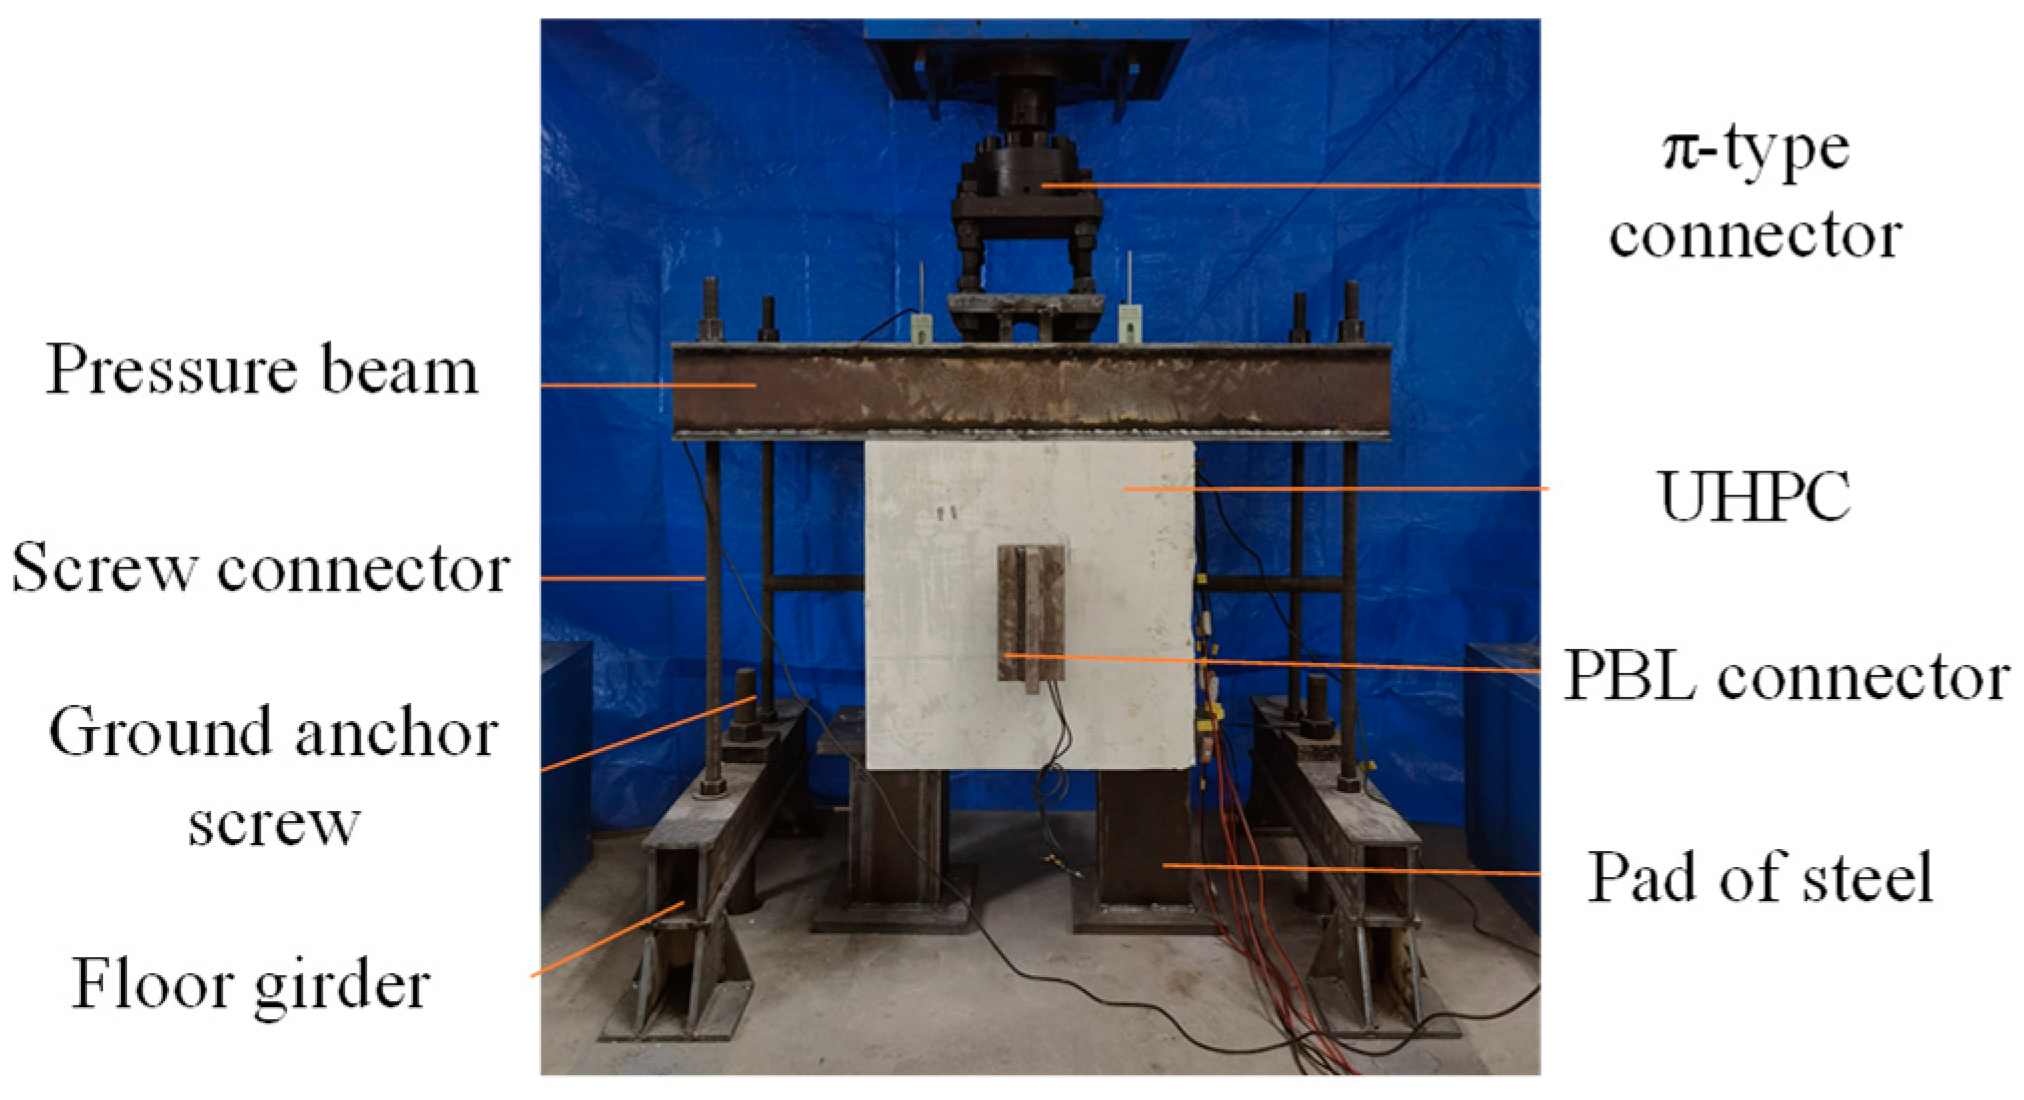
2.5. Test Setup and Instrumentation

Figure 4 illustrates the loading apparatus used for the pull-out test. A vertical pull-out force was exerted on the upper section of the specimens utilizing an MTS 50t push–pull actuator. The UHPC base of each specimen was firmly anchored to the floor girder through two short steel girders affixed to the floor girder by four screw connectors. A specially designed π-connector plate facilitated the linkage between the T-beam and the actuator, with the assembly secured using high-strength tension bolts. To ascertain the separation between the perfobond rib and the concrete, two displacement transducers were symmetrically positioned on the lateral surfaces of the specimens—one on each side. The pull-out load of the actuator increased monotonically until the T-perfobond connector and the notched T-perfobond connector were completely damaged and lost their bearing capacity. During the loading process, the pull-out load was continuously recorded by the actuator, and the separation displacement was collected by LVDT displacement gauges.

3. Test Results and Analysis
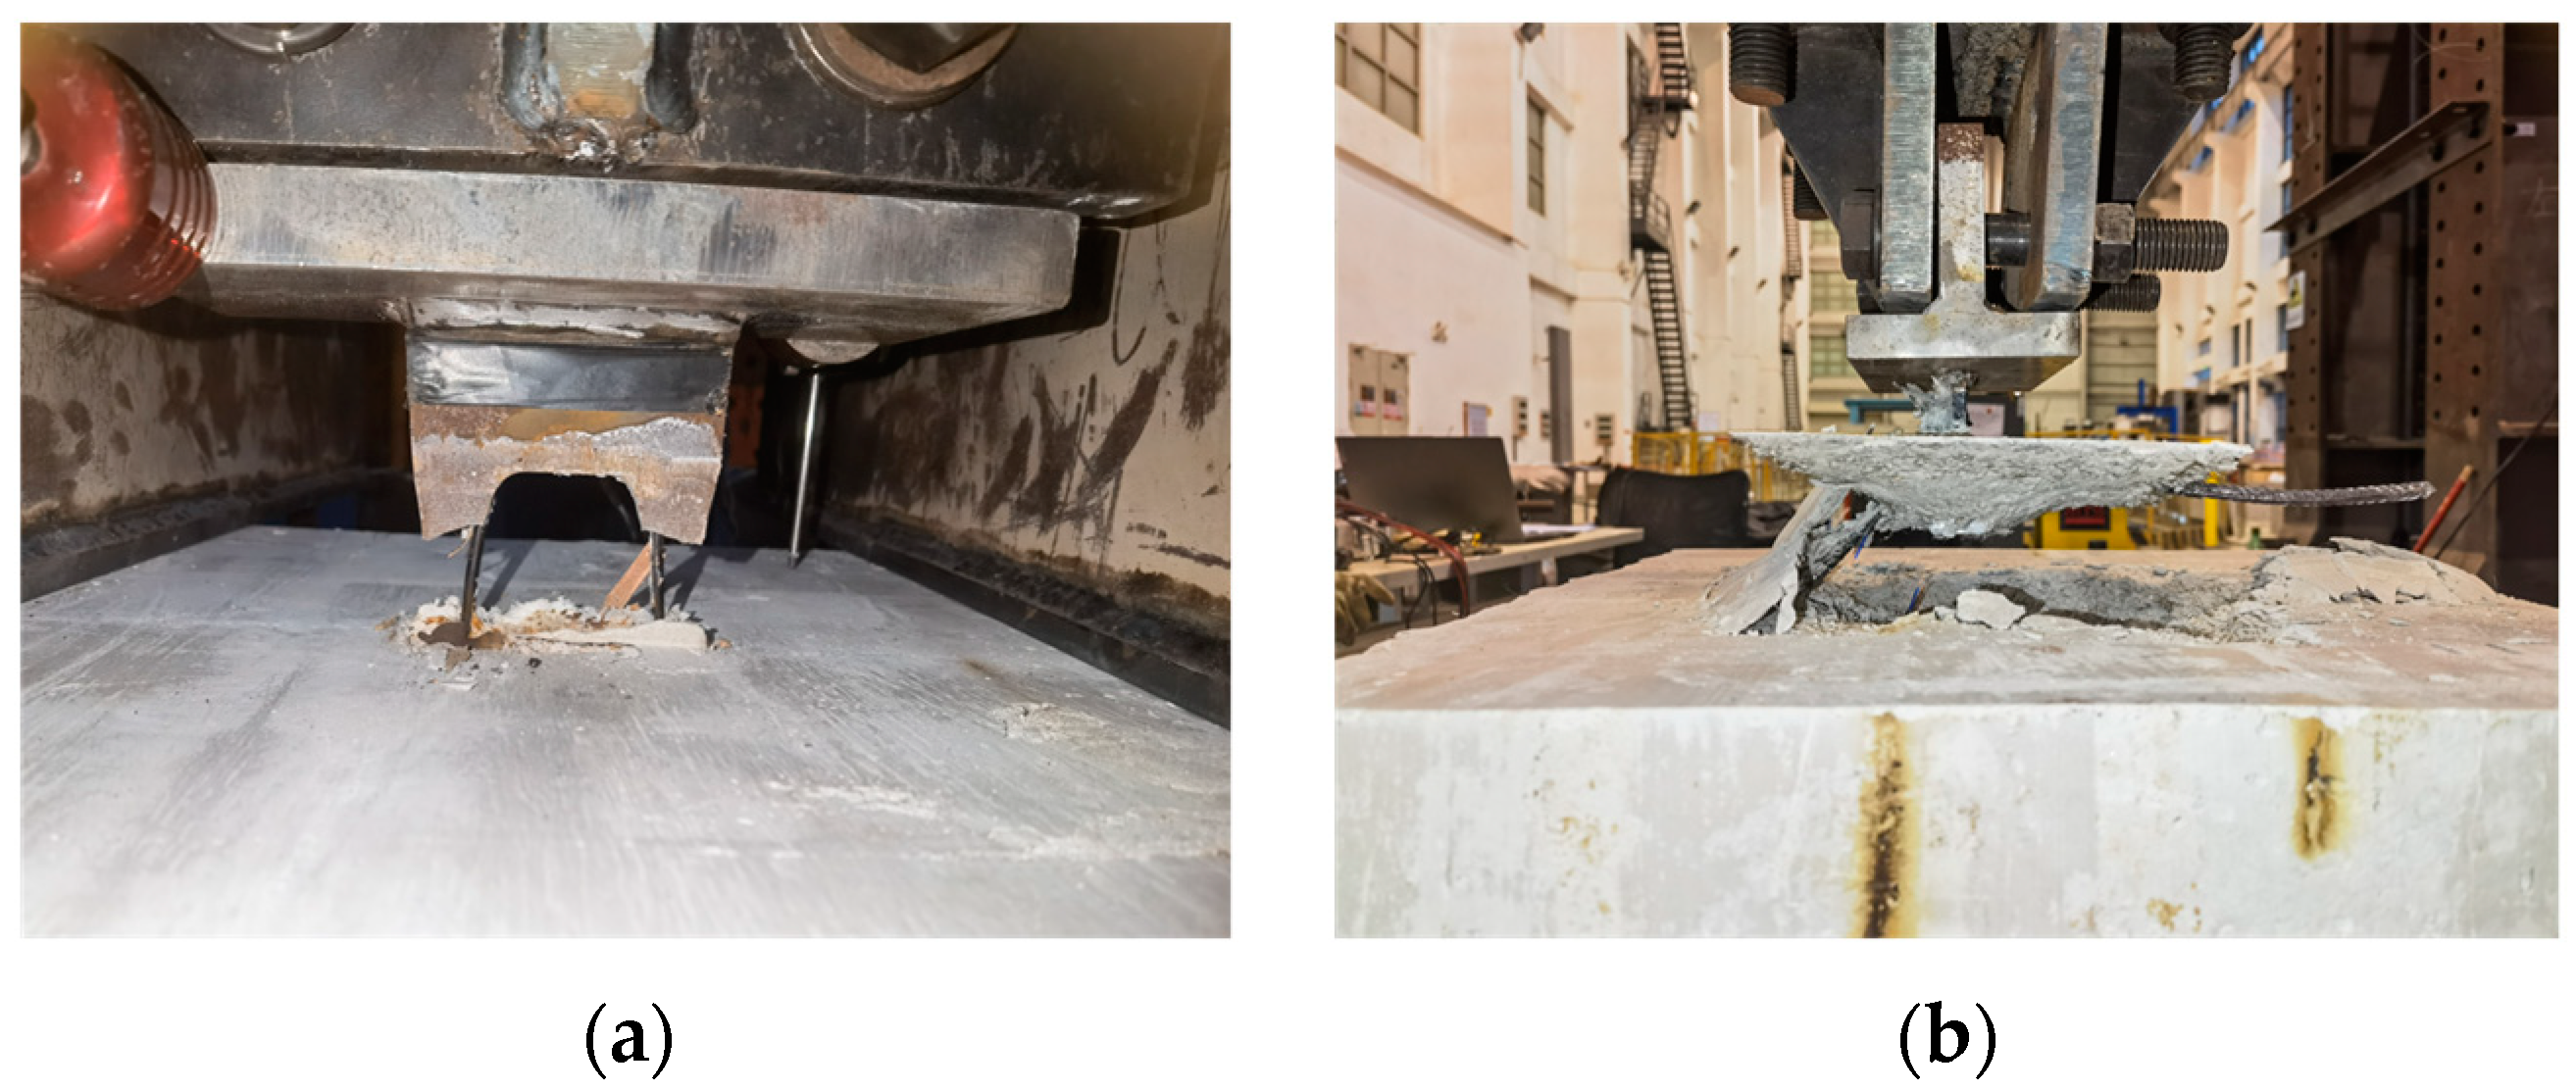
3.1. Failure Mode

The pull-out resistance of the specimens in pull-out tests is shown in Table 1. The PFR specimens were not notched at the hole edge. With an increase in vertical displacement, the constraint of concrete on the flange of the perfobond ribs was enhanced. The damage mode consists of the perfobond ribs on both sides of the hole of the perfobond connector being pulled off, which results in the loss of bearing capacity of the connectors. The surface of the UHPC was intact, without obvious bulges and cracks. The PMFR specimens were notched at the hole edge. Compared with the specimens without notches, the restraining area of the concrete on the flange of the perfobond connector was small. The UHPC was lifted upward diagonally along the edge of the flange at a certain angle to form a conical damage surface, which then pulled the perforated rebar out from the UHPC. The failure mode of the specimens is shown in Figure 5.

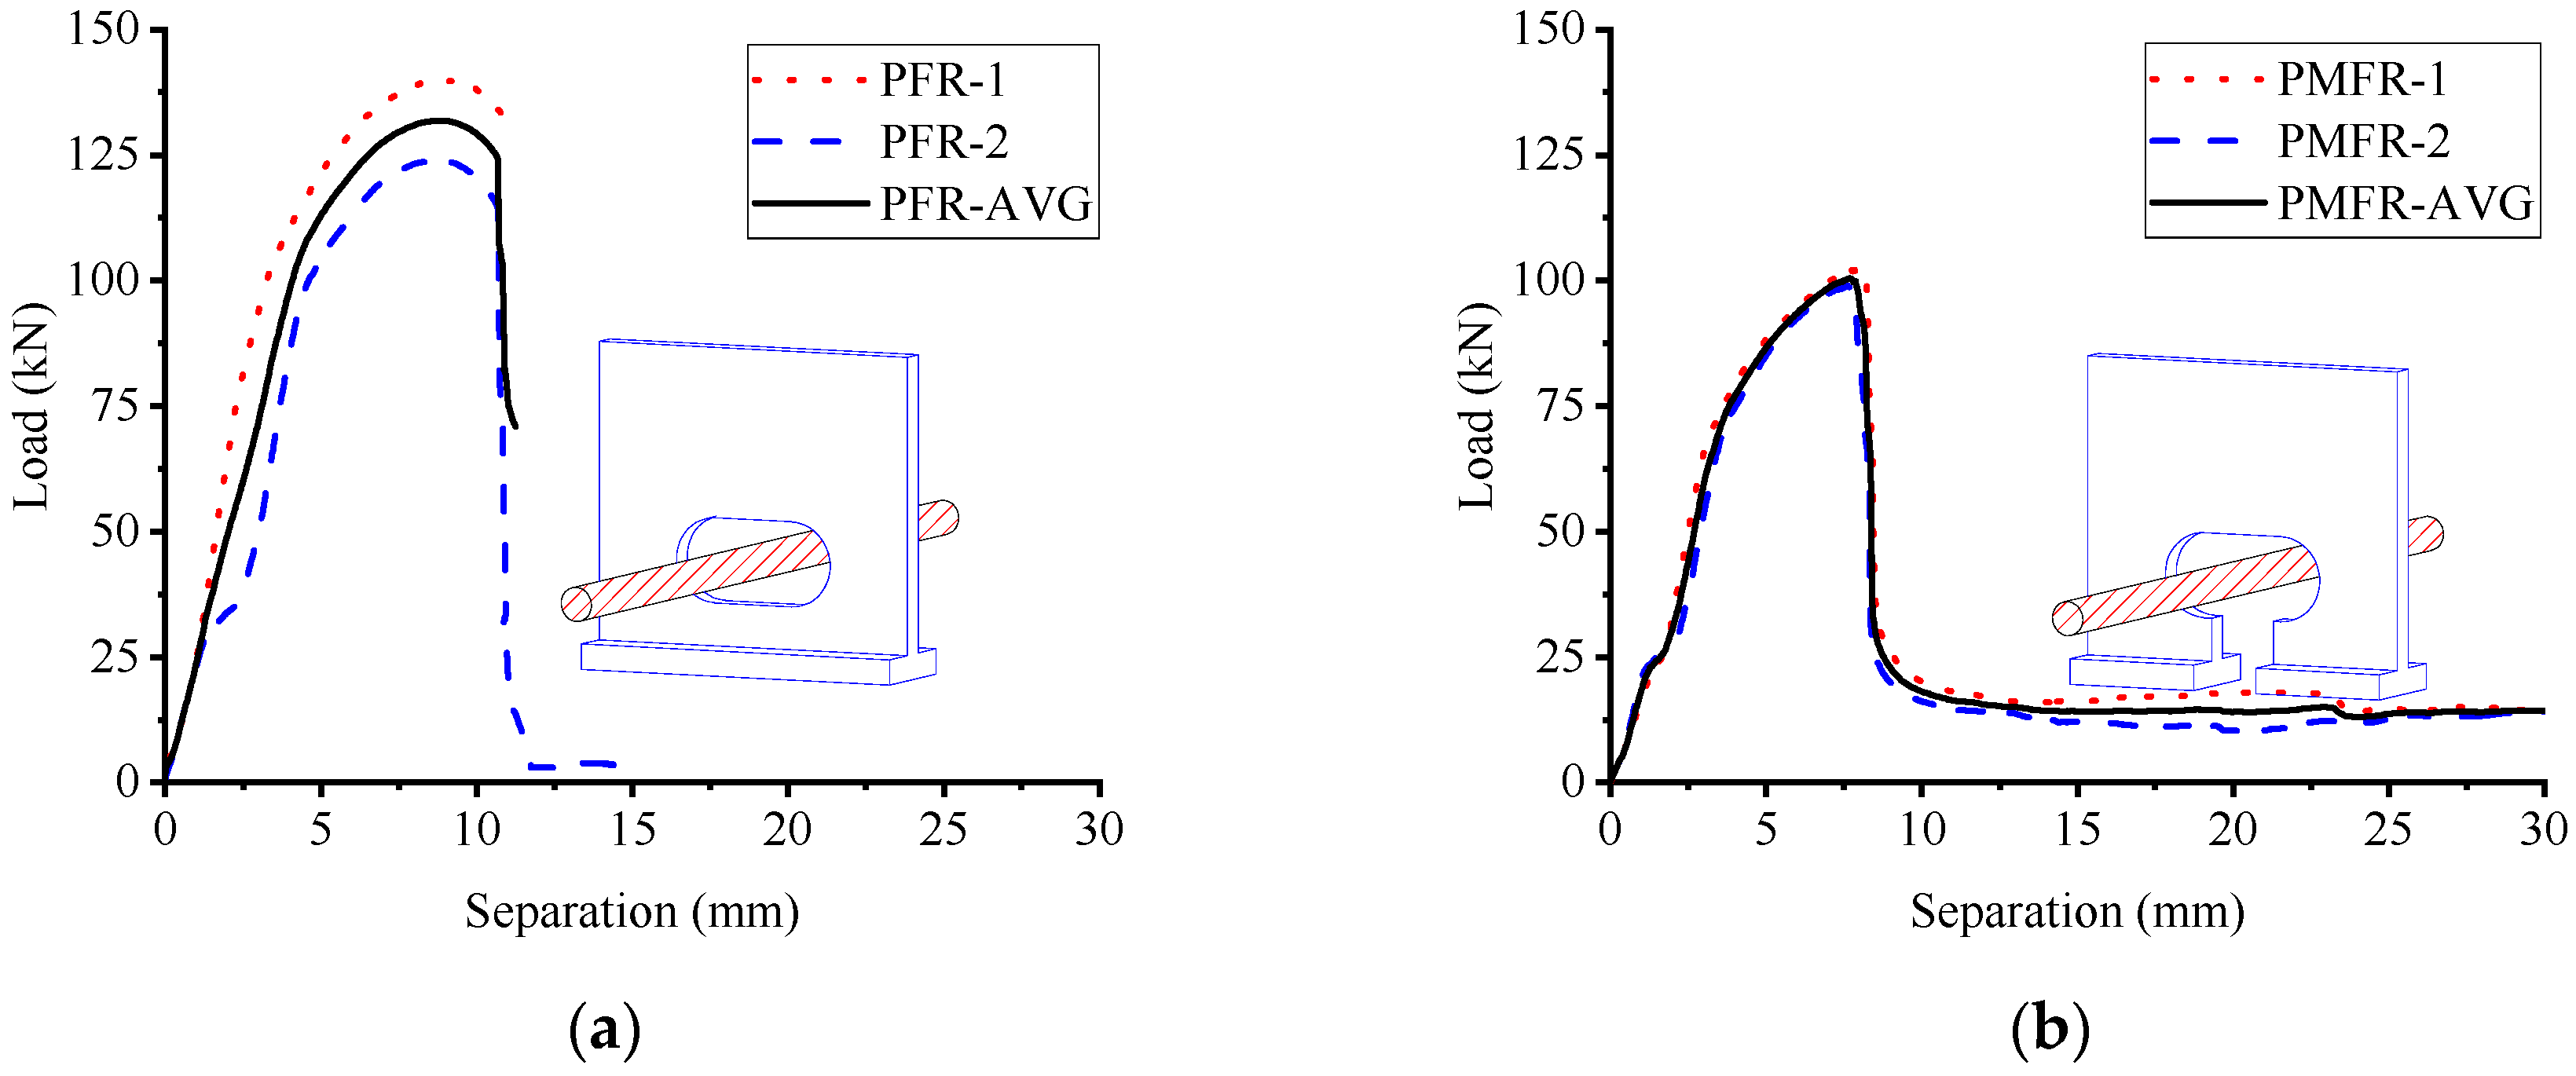
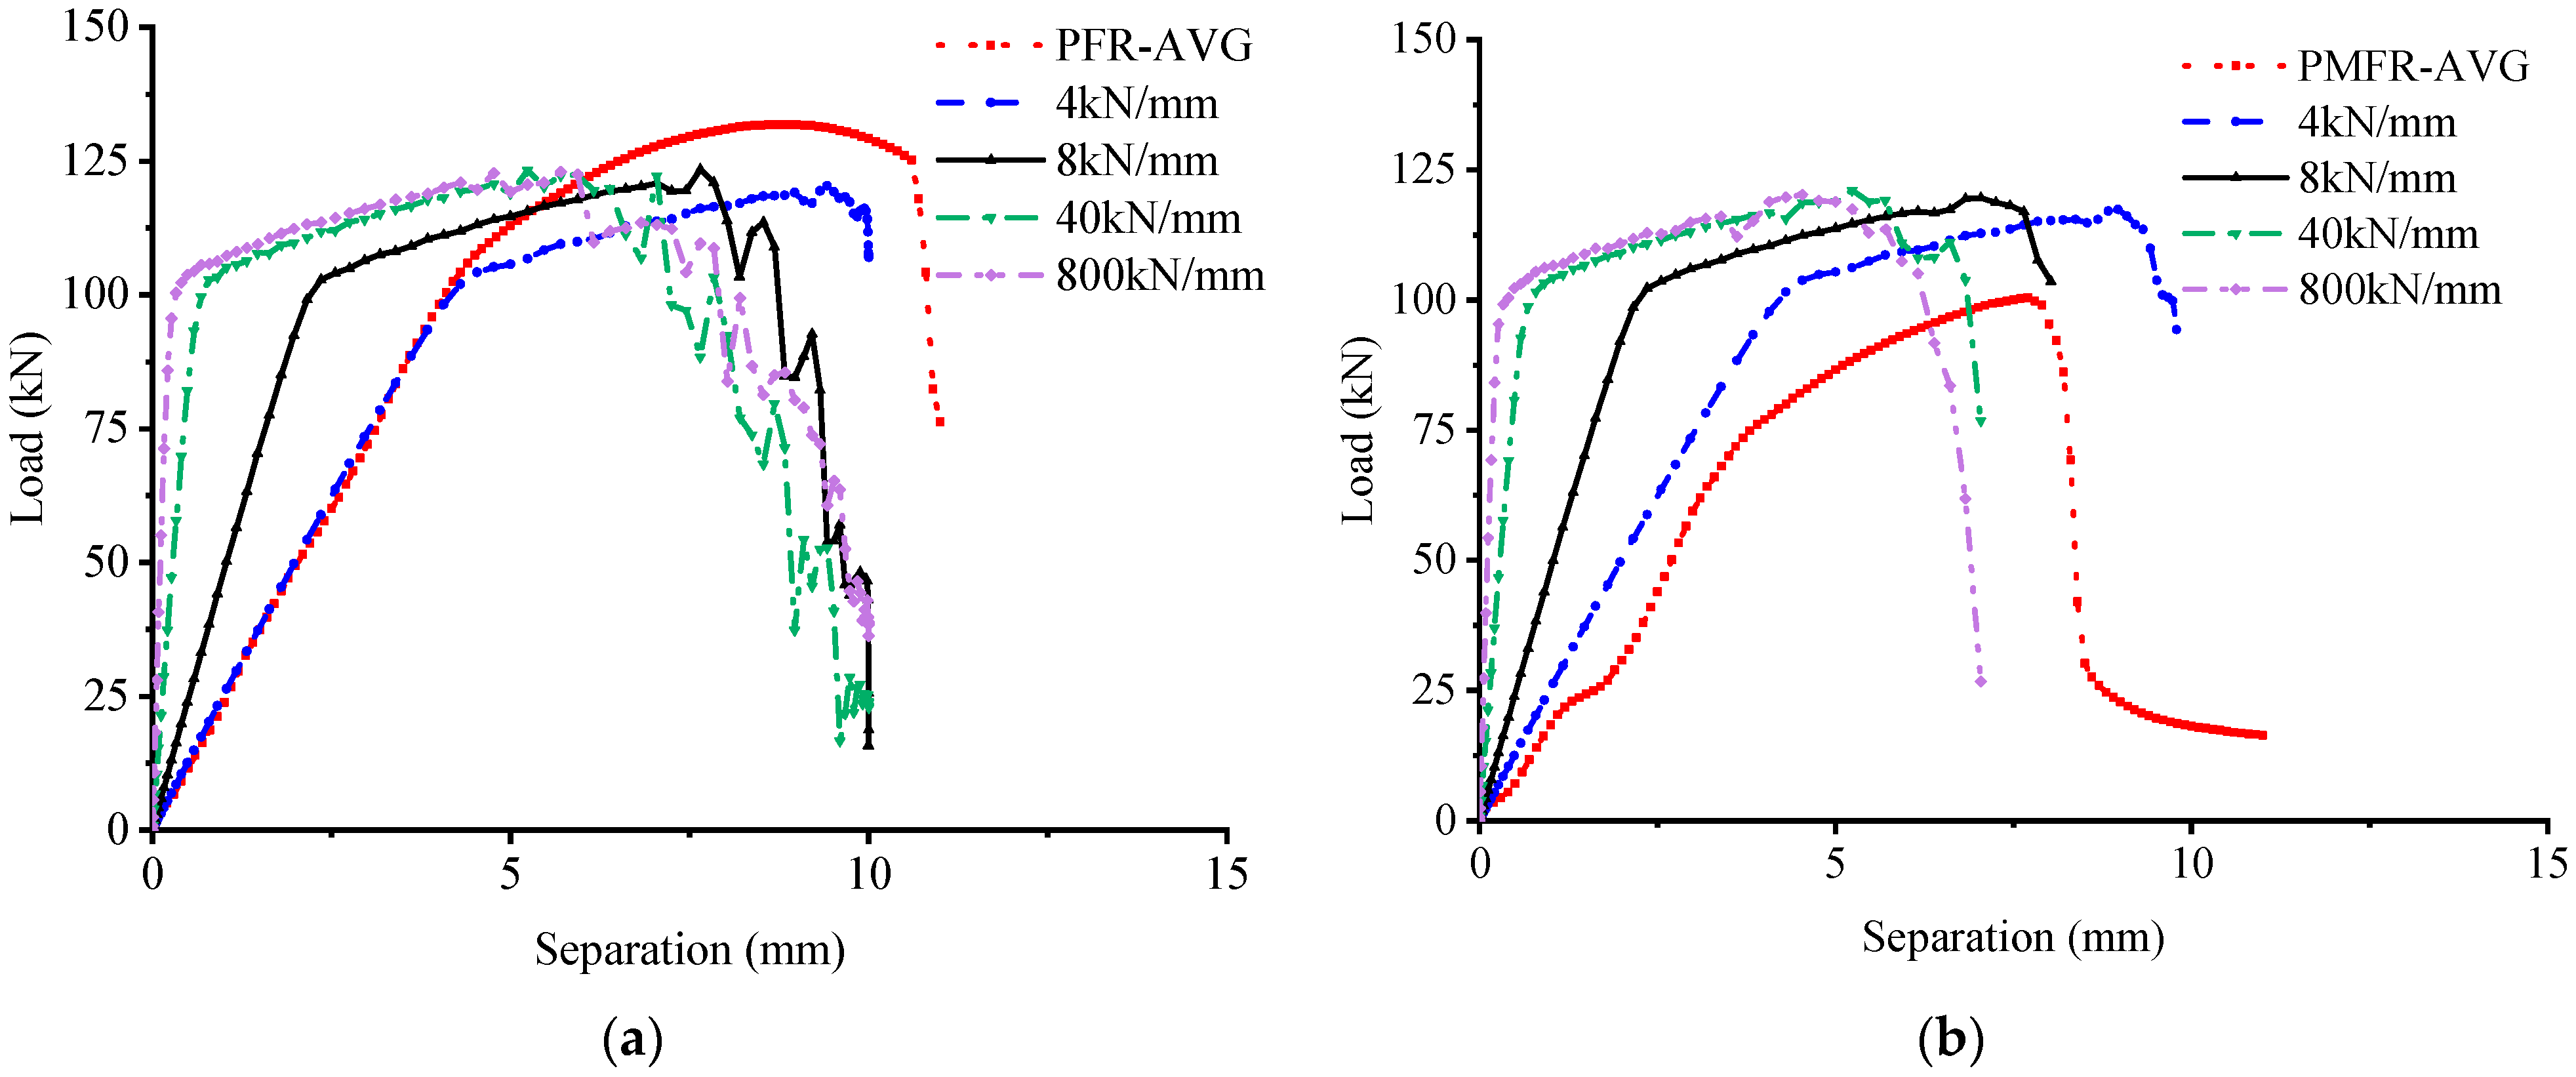
3.2. Load–Separation Behavior

Figure 6 presents the load––separation curves, illustrating the progression of separation between the steel beam and the concrete slab in response to the applied pull-out force. The curves delineate three distinct stages. Initially, upon specimen loading, the load increased linearly with separation, indicating a period of elastic behavior. As the specimens approached the damage stage, a noticeable reduction in stiffness was observed, reflecting the initiation of inelastic deformation. Post-ultimate load, separation persisted, augmenting while the pull-out force diminished, signifying the onset of the post-peak softening phase.
In this experiment, the average pull-out bearing capacity for the T-perfobond (PFR) and notched T-perfobond (PMFR) connectors was 132.0 kN and 100.5 kN, respectively, while the average peak separation was 8.83 mm and 7.73 mm, respectively. The introduction of notches decreased the pull-out bearing capacity by 23.86% and the peak separation by 12.46%. Nevertheless, due to the limited number of model specimens, additional parametric analysis is necessary to affirm the influence of notches on pull-out bearing performance.

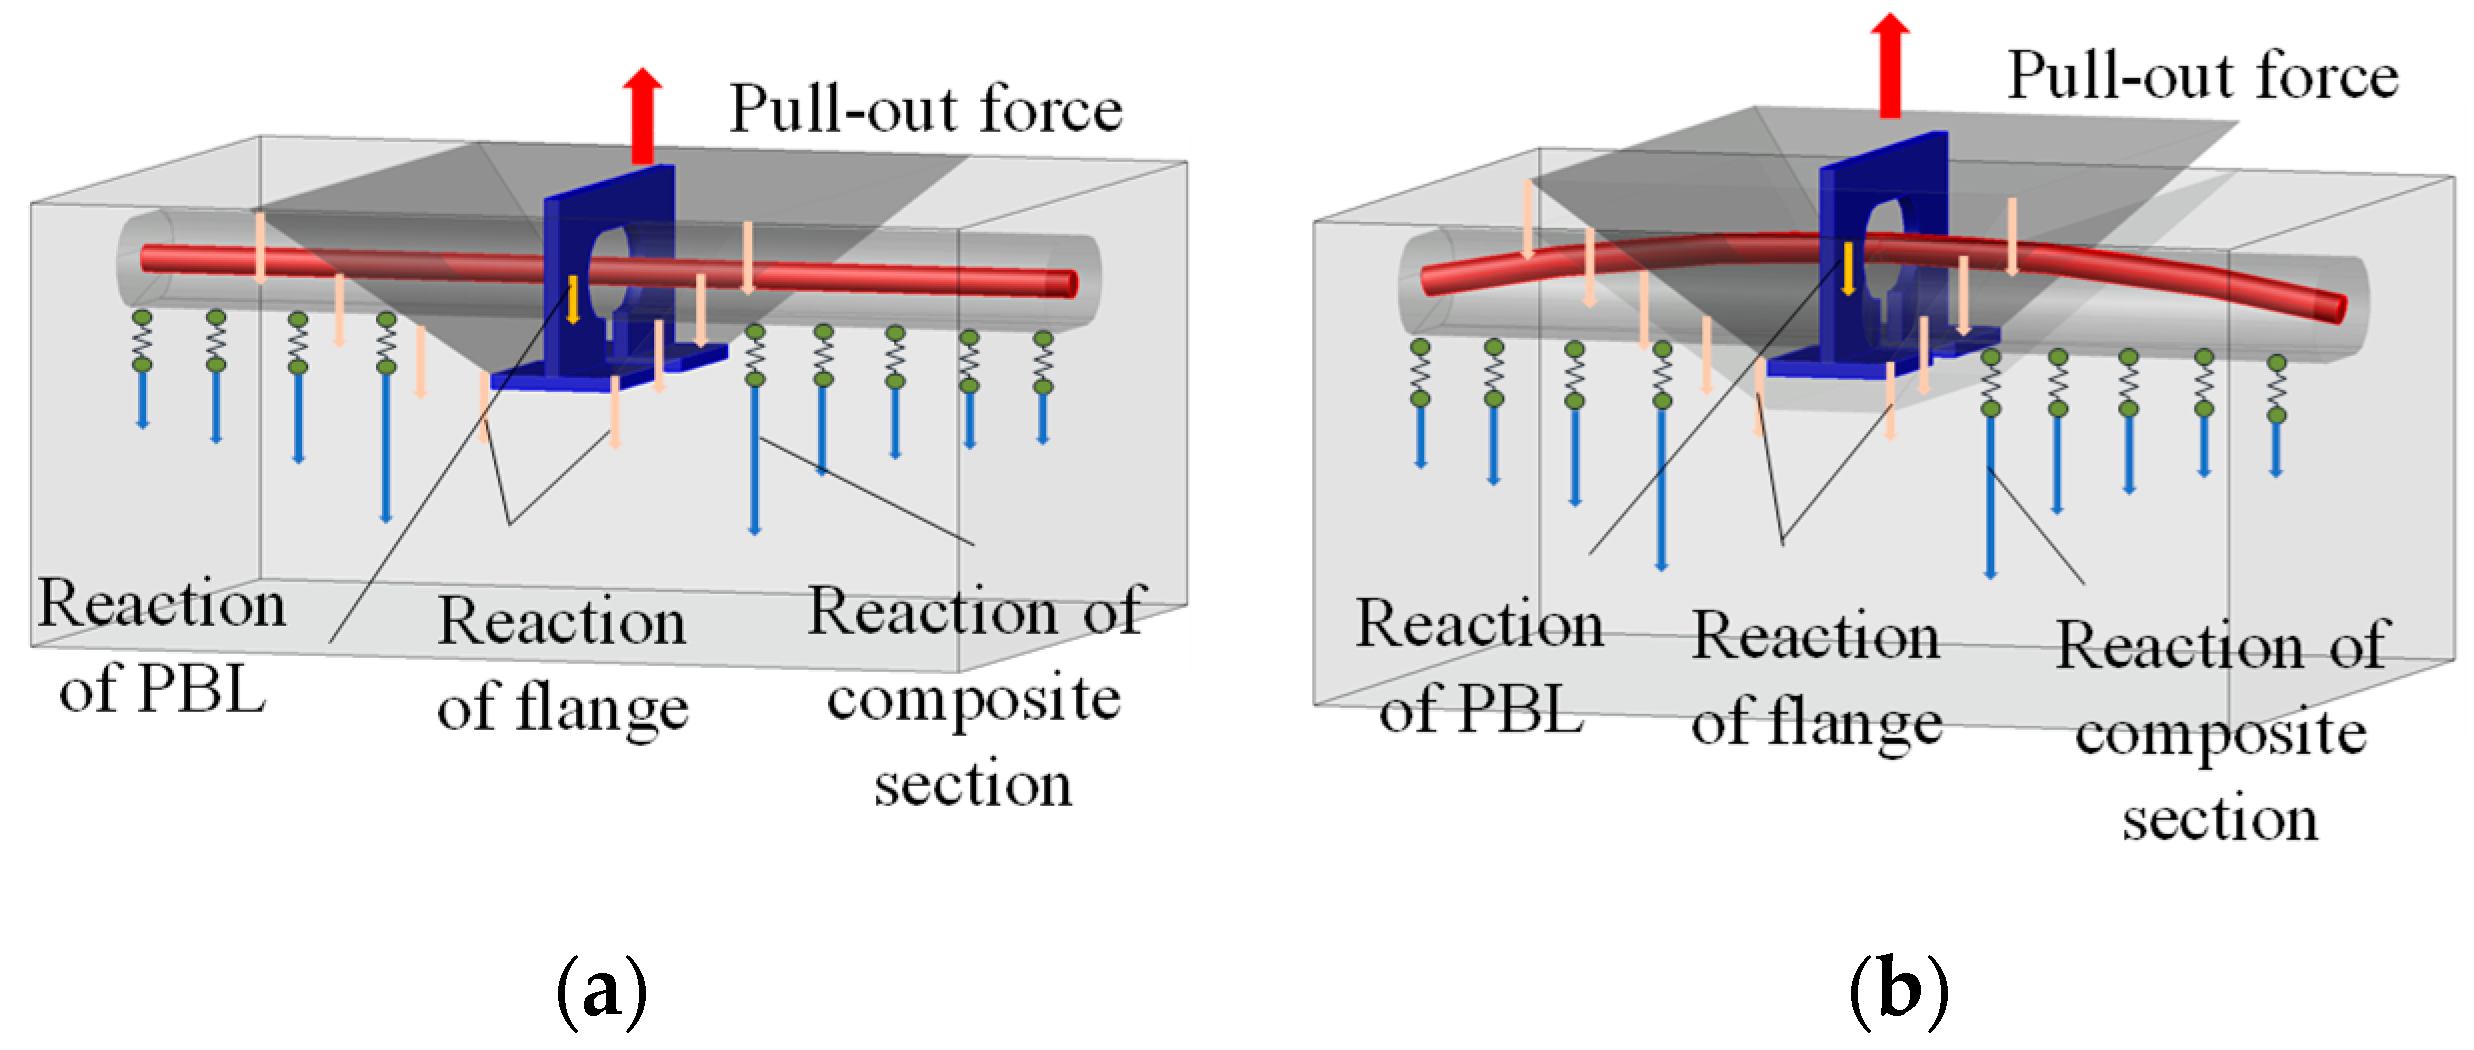
3.3. Pull-Out Mechanism

The tensile strength of the perfobond connectors is a collective result of the perfobond rib, the flange, the concrete, and the rebar that passes through the perforations. An external force applied to the perfobond rib was transmitted from the rib, through the concrete, and into the rebar and flange. The force exerted on the perfobond rib and its immediate vicinity was the most significant and diminished axially towards the rebar ends. The concrete dowel effect and the rebar’s role are analogous to that of an elastic foundation beam. The surrounding concrete serves as a foundation, providing the reaction force for this composite elastic beam. When the perfobond rib’s strength is less than that of the concrete dowel within the hole, the constraining effect of the rebar on the flange becomes critical. The fracture of the perfobond rib is the decisive factor that leads to the specimen’s loss of load-bearing capacity. On the other hand, if the concrete dowel’s strength predominates, an inverted pyramid-shaped wedge of concrete is formed diagonally upwards from the flange’s edge. In this scenario, the concrete’s punching shear failure is the determining factor that causes the ultimate loss of the specimen’s load-bearing capacity, as depicted in Figure 7.

4. Numerical Simulation
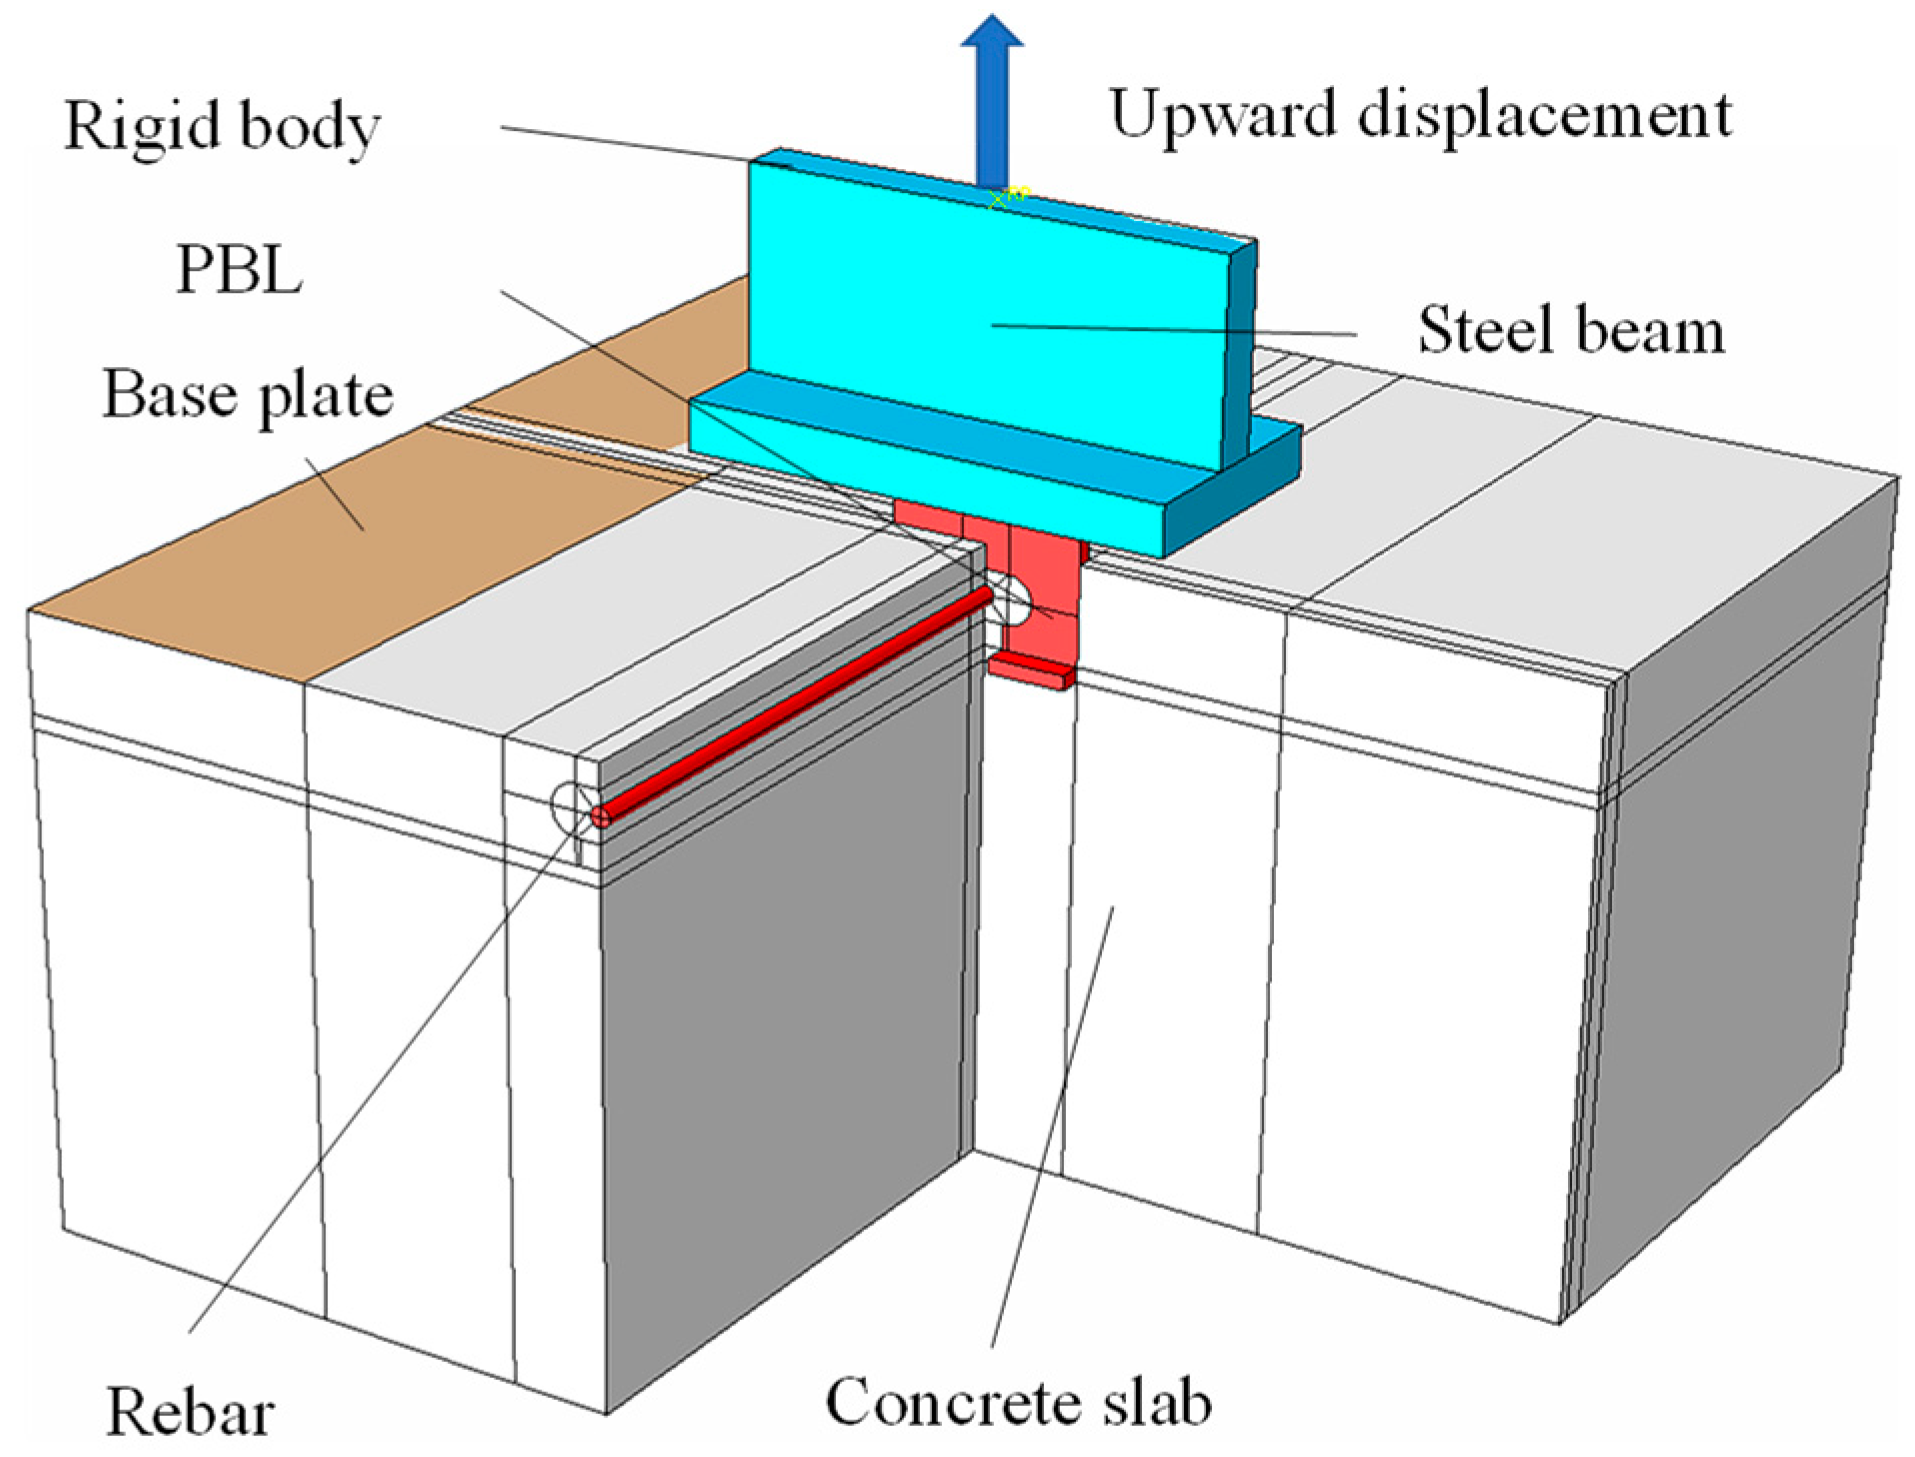
4.1. General

Figure 8 displays the simulated pull-out test for the notched T-perfobond shear connector, which was conducted utilizing the finite-element method. The numerical analysis aimed to elucidate the damage and pull-out resistance mechanisms inherent to these connectors. The simulation was executed using ABAQUS versatile analysis software [26], which served as a cost-effective and time-efficient alternative to physical pull-out tests. The analysis employed a dynamic explicit method, accounting for both material and geometric nonlinearities. Given the slow loading rate of the test, the loading was treated as quasi-static.

4.2. Finite-Element Type and Mesh

Figure 9 illustrates the meshing strategy for the pull-out model of the notched T-perfobond connectors, which incorporated both solid and rigid elements. The concrete slab, T-shaped steel plate, perforating rebar, and perfobond rib were represented using eight-node reduced integration hexahedral elements (C3D8R). A rigid body element (R3D4) discretized the upper surface of the T-shaped steel plate to simulate perfect bonding. To optimize analysis time, a global mesh with an average element size of 20 mm was implemented. However, for enhanced accuracy, a locally refined mesh was applied to critical areas. Specifically, the bond region of the UHPC was meshed with a minimum size of approximately 10 mm, while the perfobond ribs were further refined with a minimum mesh size of about 5 mm to accurately capture the detailed stress distribution.

4.3. Interaction and Boundary Conditions

Figure 10 depicts the setup where the reference point of the rigid body is constrained against all translational and rotational movements. An upward displacement was imposed on this reference point to simulate the pull-out action. To precisely simulate the connection between the steel beam and perfobond connectors in the finite-element model, tie-binding constraints were applied. At the interfaces between the concrete and both the perfobond connectors and the rebar, generalized contact interactions were established. To prevent interpenetration, a “hard” contact condition was specified in the normal direction. In the tangential direction, a “penalized” friction model was implemented to account for the sliding resistance. To simplify the model’s actual loading boundary conditions, fixed constraints were applied to the upper surface of the concrete slab, creating a base rib. This approach effectively replicates the experimental setup within the numerical simulation.

4.4. Material Constitution of Concrete

Figure 11 illustrates the nonlinear response of concrete under compression and tension, characterized by the uniaxial compressive stress–strain curves and the relationships between tensile stress and crack width.
The intrinsic compressive behavior of concrete is articulated by Equation (1) [27]. As depicted in Figure 11a, the stress–strain curve commences with an initial linear elastic branch. Subsequently, the curve transitions into a nonlinear parabolic segment, followed by a descending branch, each reflecting different phases of the material’s response under compression.
σ c = f c n ξ ξ 2 1 + n 2 ξ ε c ε c p σ c = f c ξ 2 ξ 1 2 + ξ ε c > ε c p
The model outlined by CEB-FIP (1993) governs the ascending segment of the curve, where σc denotes the compressive stress in MPa and fc represents the concrete’s axial compressive strength, also in MPa. The strain at the peak stress is defined as εcp = 0.0035, and ξ quantifies the strain relative to the peak strain, expressed as ξ = εc/εcp. Furthermore, n is the ratio of the initial modulus of elasticity (Ec) to the modulus of the descending branch at the peak point (Ecp), calculated as n = Ec/Ecp [27].For uncracked concrete, a linear stress–strain relationship captures the material’s elongation characteristics. In contrast, the cracked section, as illustrated in Figure 11b, necessitates a nonlinear description of the stress–crack width relationship. This is articulated through Equation (2) [27].
σ t f t = 1 + c 1 w w c 3 exp c 2 w w c w w c 1 + c 1 3 exp c 2
In the provided model, σt signifies the tensile stress in MPa, while ft is the concrete’s tensile strength, also expressed in MPa. The crack width is denoted by w in mm, and wc represents the crack width at complete stress relief, defined as wc = 5.14 GF/ft (mm), where GF is the fracture energy required to generate a unit area of stress-free crack, as expressed by GF = 0.073 fc0.18 (N/mm). The model incorporates constants of c1 = 3 and c2 = 6.93 [27].
The concrete damage plasticity model encapsulates the degradation response of concrete under stress. This model employs two independent uniaxial damage variables, namely dc and dt, to quantify concrete damage resulting from compressive crushing and tensile cracking, respectively [27].
For concrete under compression, the progression of dc is linked to the plastic strain (εlcp). It is determined to be proportional to the inelastic strain (εcin = εcσc/Ec) with a constant factor of bc (0 < bc < 1), as delineated in Equation (3) [27].
d c = 1 σ c E c ε c p l 1 / b c 1 + σ c
In this context, dc represents the compressive damage component of concrete. The ratio of plastic to inelastic strain is denoted by bc, as defined by bc = εcpl/εcin, and bc is assigned a value of 0.7 according to [27].
For concrete under tension, the damage evolution component (d) is correlated with the “plastic” crack width (wpl). This component is proportional to the actual crack width (w) with the proportionality governed by the constant factor (bt, where 0 < bt < 1), as described by Equation (4) [27].
d t = 1 σ t l 0 E c w p l 1 / b t 1 + σ t l 0
Here, dt signifies the tensile damage component of the concrete. The term l0 is considered a reference unit length for normalization purposes. Additionally, bt denotes the ratio of the ‘plastic’ crack width to the actual crack width, expressed as bt = wpl/w, with a designated value of 0.1, in accordance with [27].

4.5. Material Constitution of Steel

Figure 12 illustrates the stress–strain relationship for perfobond ribs and bars, modeled with three linear segments. Initially, the relationship is characterized by an elastic phase with a Young’s modulus denoted as Es. This is succeeded by a yielding phase, culminating in a strain-hardening phase. It is presumed that the stress–strain behavior mirrors that of steel under compression.

4.6. Verification of Finite-Element Model

The numerical simulation outcomes closely resemble the pull-out damage patterns observed in perfobond connectors, as depicted in Figure 13. In the case of notched T-perfobond connectors, an increase in pull-out force intensifies the concrete’s constraint on the flange, predisposing the perfobond rib and flange to a wedge-shaped inverted pyramid damage mechanism, as illustrated in Figure 13a. Conversely, for T-perfobond connectors, the larger area of the flange in contact with the concrete during upward pull-out results in enhanced anchorage. This robust anchorage ultimately culminates in the fracture of the perfobond connectors, as shown in Figure 13b. Specifically, the peak stress in the perfobond rib reached 667.99 MPa, a threshold sufficient to confirm the rib’s fracture. In the notched T-perfobond connectors, the shallow embedment depth coupled with the flange’s influence means that the perforated rebar’s loss of bearing capacity plays a limited role, predominantly in anchoring.
In Figure 14, the load–separation curves derived from the finite-element model (FEM) are juxtaposed with the outcomes of the pull-out tests. The experimental curves for T-perfobond connectors comprise three distinct phases, namely the elastic phase, the nonlinear parabolic phase, and the descending branch. With the concrete dilation angle set at 30°, the finite-element analysis predicted pull-out forces of 106.51 kN for the notched T-perfobond connectors and 111.52 kN for the T-perfobond connectors. These values correspond to 106.0% and 107.5% of the average experimental results, respectively. The initial stiffness observed in the numerical simulation’s load–separation curves exceeds the experimental values, possibly due to the idealized boundary conditions in the simulation, which do not account for the deformations present in the experimental setup. Additionally, discrepancies may arise from the inherent variability in the mechanical properties of the steel fiber-reinforced UHPC (ultra-high-performance concrete) material used in the tests. Therefore, the stiffness of the loaded steel beam was adjusted between 4 and 800 kN/mm by trial calculation so that the load–separation curves of the simulations were in better agreement with the model test results.

5. Parametric Study

As shown in Table 2, a total of 54 simulations were conducted to further investigate the effects of the connectors’ dimensions and material properties on the pull-out resistance of notched T-perfobond connectors. The considered parameters encompass the perfobond connector flange thickness (tf), width (bf), and cut width (cw) and perfobond rib-hole height (dh), hole length (dl), thickness (tp), width (lp), rebar diameter (dr), concrete axial compressive strength (fc), rebar yield strength (fry), and perfobond rib yield strength (fsy).

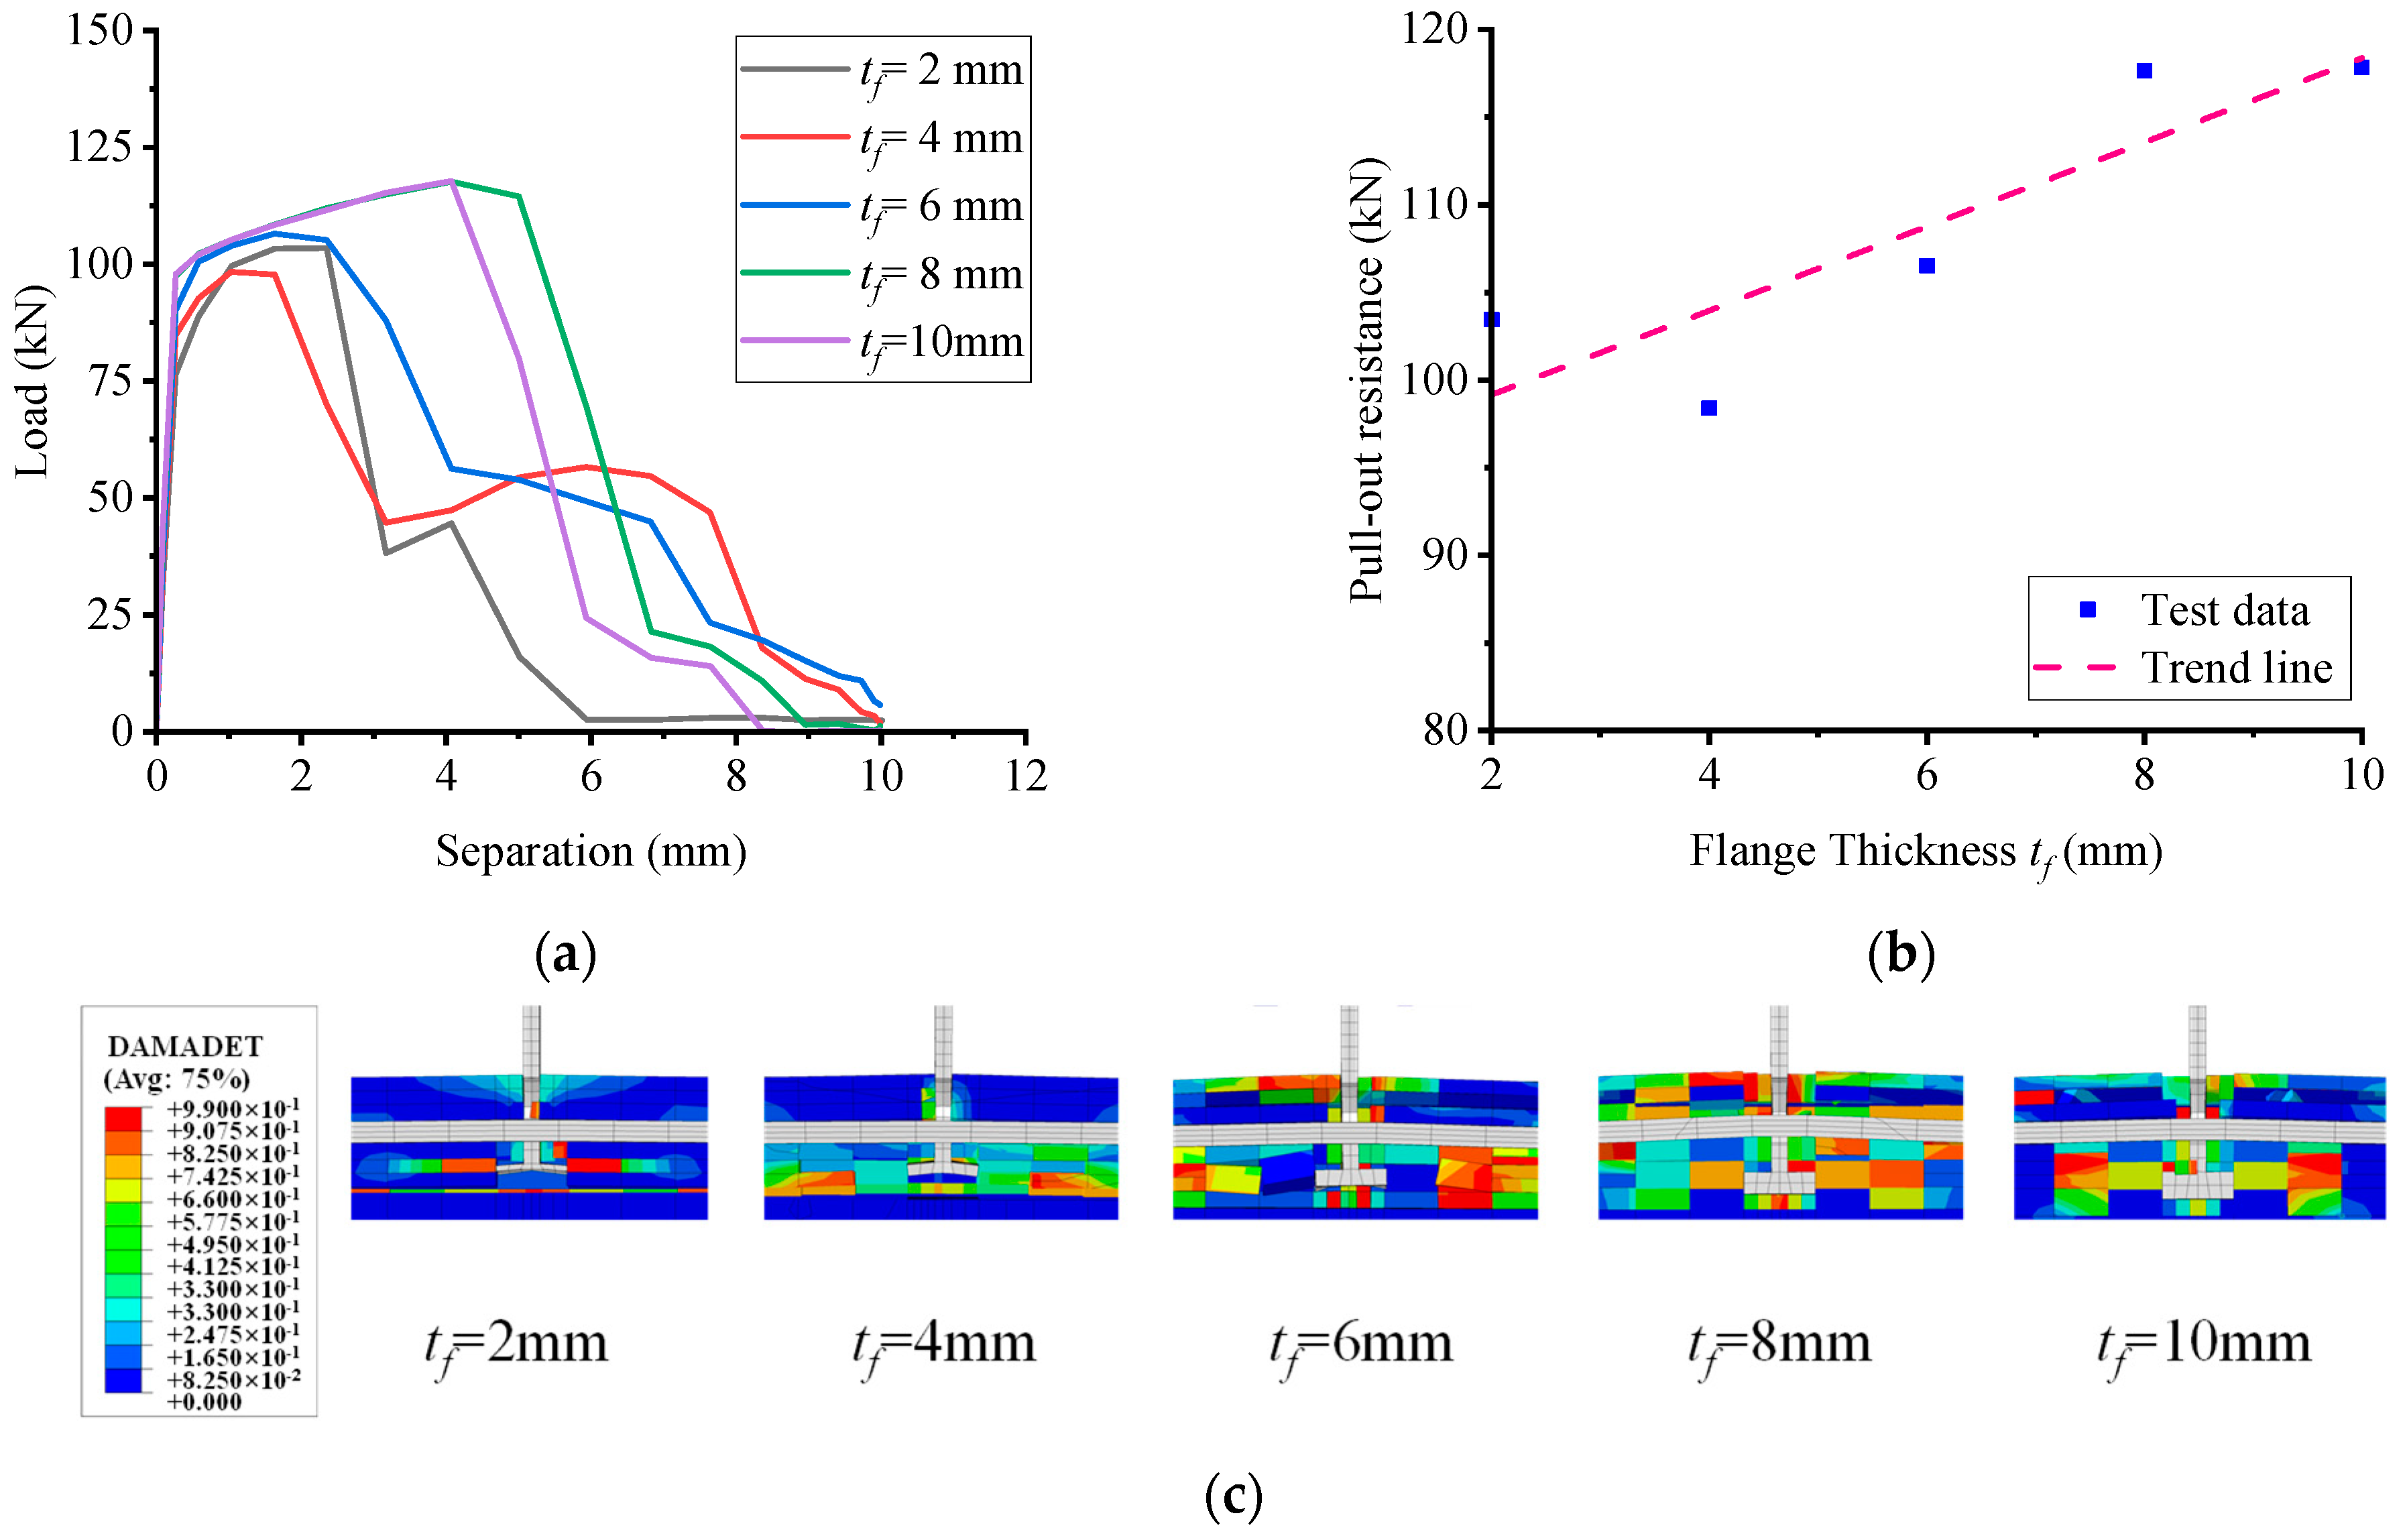
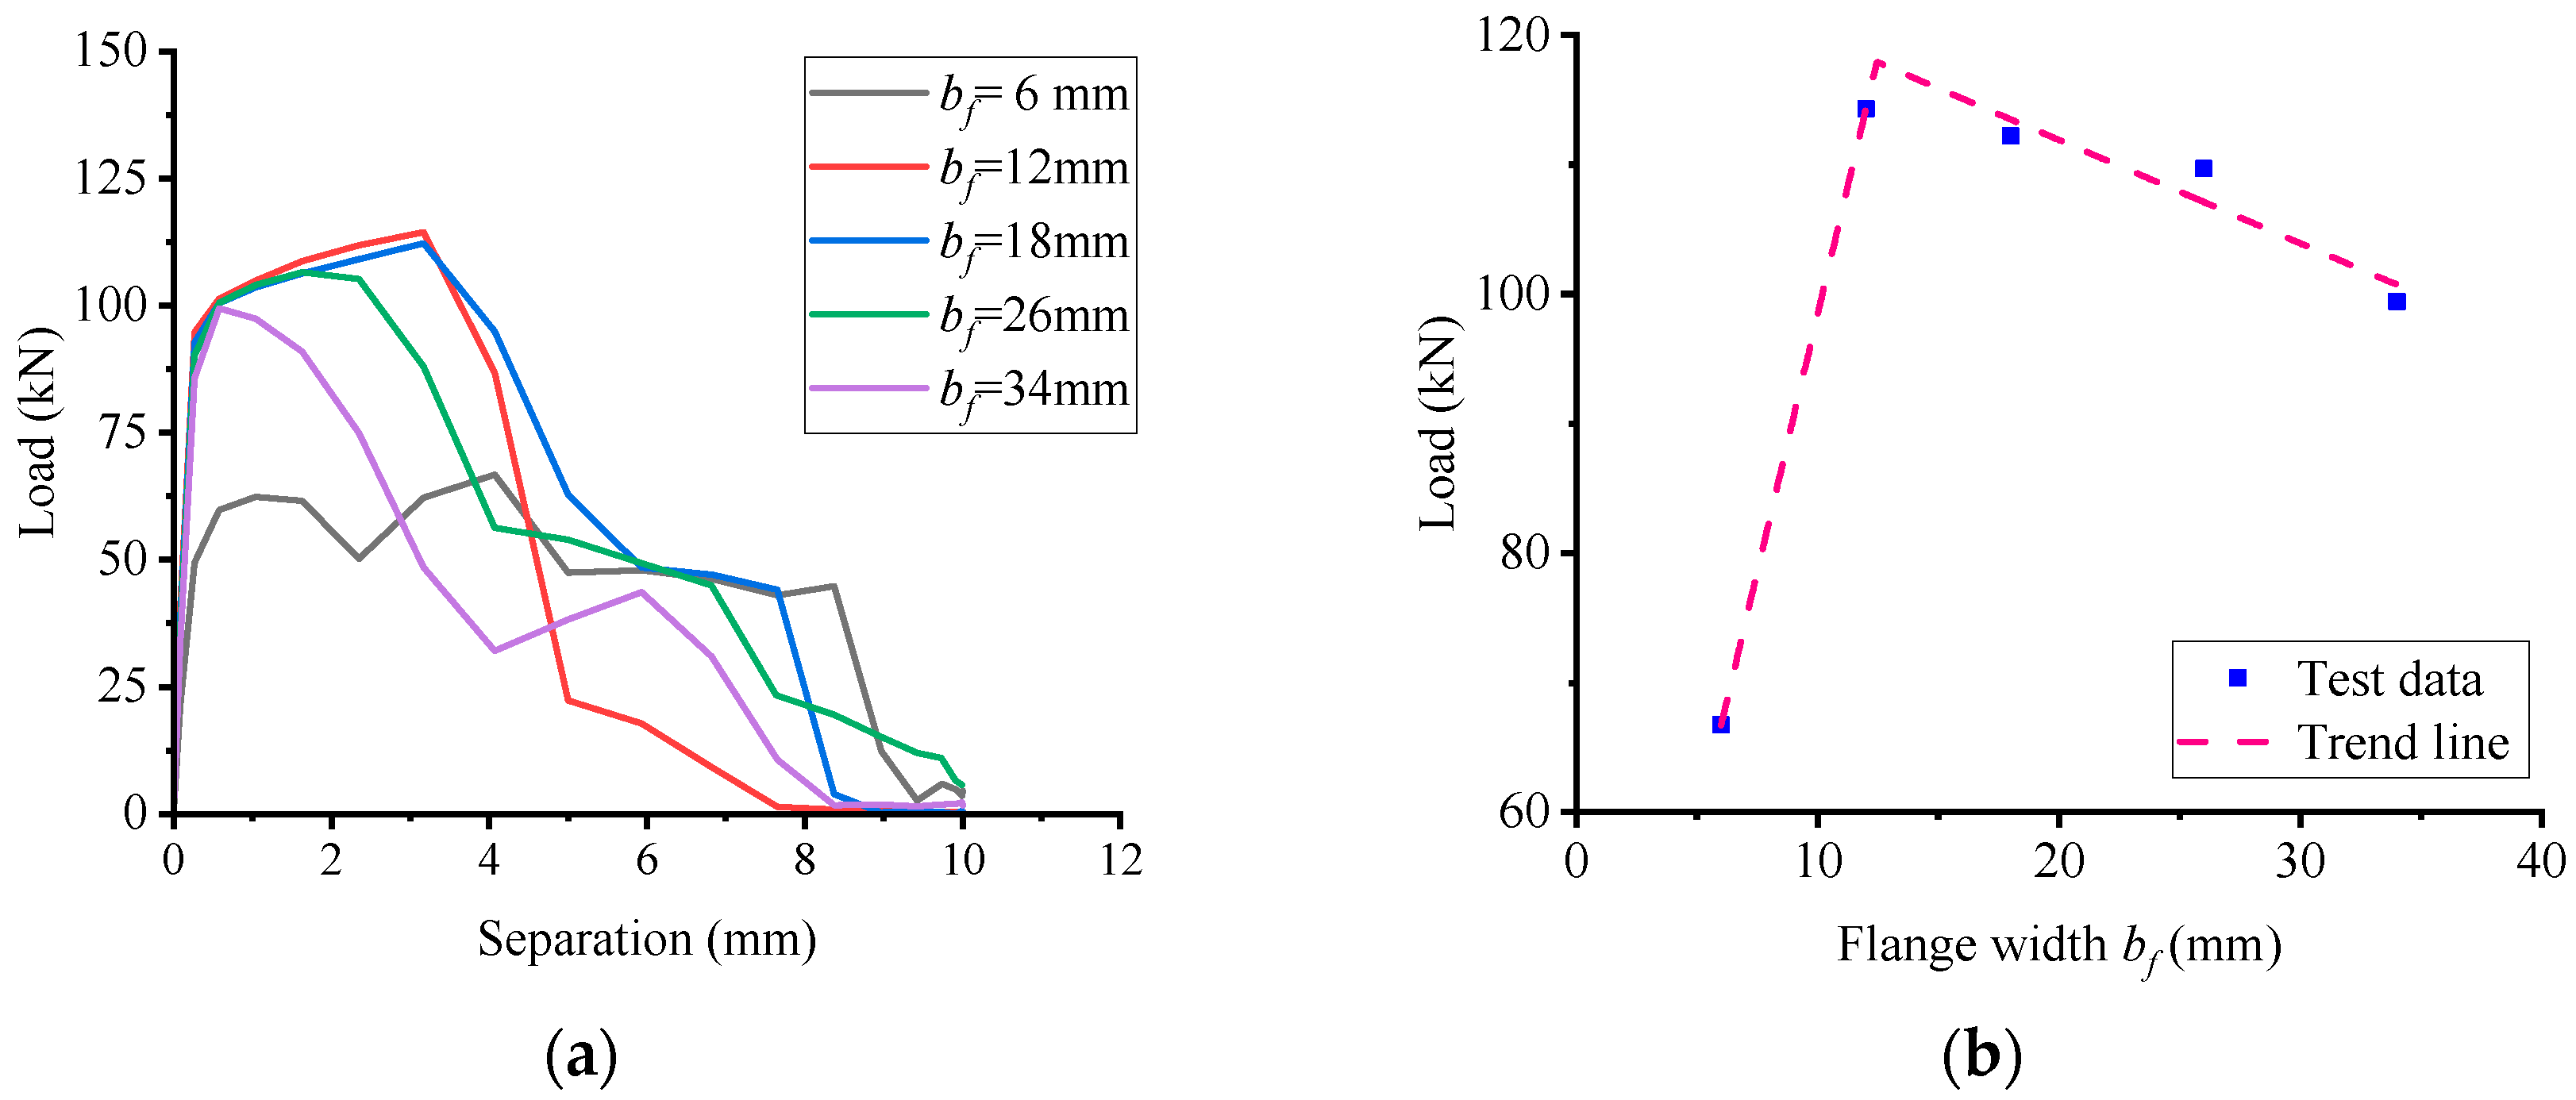
5.1. Influence of Flange Size

Figure 15 demonstrates the significant impact of flange thickness on the pull-out performance of notched T-perfobond connectors. Increases in flange thickness from 2 mm to 4 mm, 6 mm, 8 mm, and 10 mm resulted in corresponding pull-out resistance changes of −4.88%, 2.97%, 13.73%, and 13.90%, respectively. The findings indicate that enhancing flange thickness augments the pull-out resistance of these connectors. The primary rationale is the pronounced anchorage effect of the notched perfobond rib’s bottom flange. Between 2 mm and 8 mm flange thickness, the flange is the weaker constraint, and the pull-out resistance increases linearly with flange thickness. However, when the flange thickness exceeds 8 mm, the notched perfobond rib or the concrete becomes the limiting constraint and further increases in flange thickness yield minimal changes in pull-out resistance.
Figure 16 illustrates the substantial effect of flange width on the pull-out performance of notched T-perfobond connectors. Increasing the flange width from 6 mm, which matches the connector’s thickness, to 12 mm, 18 mm, 26 mm, and 34 mm, resulted in increases in pull-out resistance of 71.35%, 68.19%, 59.66%, and 49.05%, respectively. The data indicate that broadening the flange width from 6 mm to 12 mm significantly enhances the pull-out resistance due to the robust anchorage provided by the bottom flange of the connectors. However, as the flange width extends beyond 12 mm, there is a gradual decline in the ultimate pull-out resistance. This decrease may be attributed to the excessive length of the flange, which leads to a more pronounced upward force on the concrete at the junction of the notched perfobond rib and the flange. The resultant moment at the flange’s outer edge due to this force is larger and may cause stress concentration, leading to premature concrete failure at the flange’s outer edge and a consequent reduction in pull-out resistance.

5.2. Influence of Cut Width

Figure 17 displays the impact of notch width on the pull-out performance of notched T-perfobond connectors. In this study, the notched ratio (cw/lf) was varied from 0 to 0.50 across the specimens. The conventional T-perfobond connectors featured a notched width of 0 mm, corresponding to a notched ratio of 0. The notched T-perfobond connectors had notched widths of 8 mm, 16 mm, 24 mm, and 40 mm, with notched ratios of 0.10, 0.20, 0.30, and 0.50, respectively. The findings indicate that an increase in notch width has a minor influence on the pull-out resistance of notched T-perfobond connectors. When the notch width is less than 16 mm, corresponding to a notch ratio below 0.20, the reduction in pull-out resistance does not exceed 4.50%. Beyond a notch width of 16 mm up to 40 mm, the ultimate pull-out resistance of the specimens remains relatively stable. This constancy could be due to the flange providing the necessary pull-out resistance to counteract the effects of the notch.

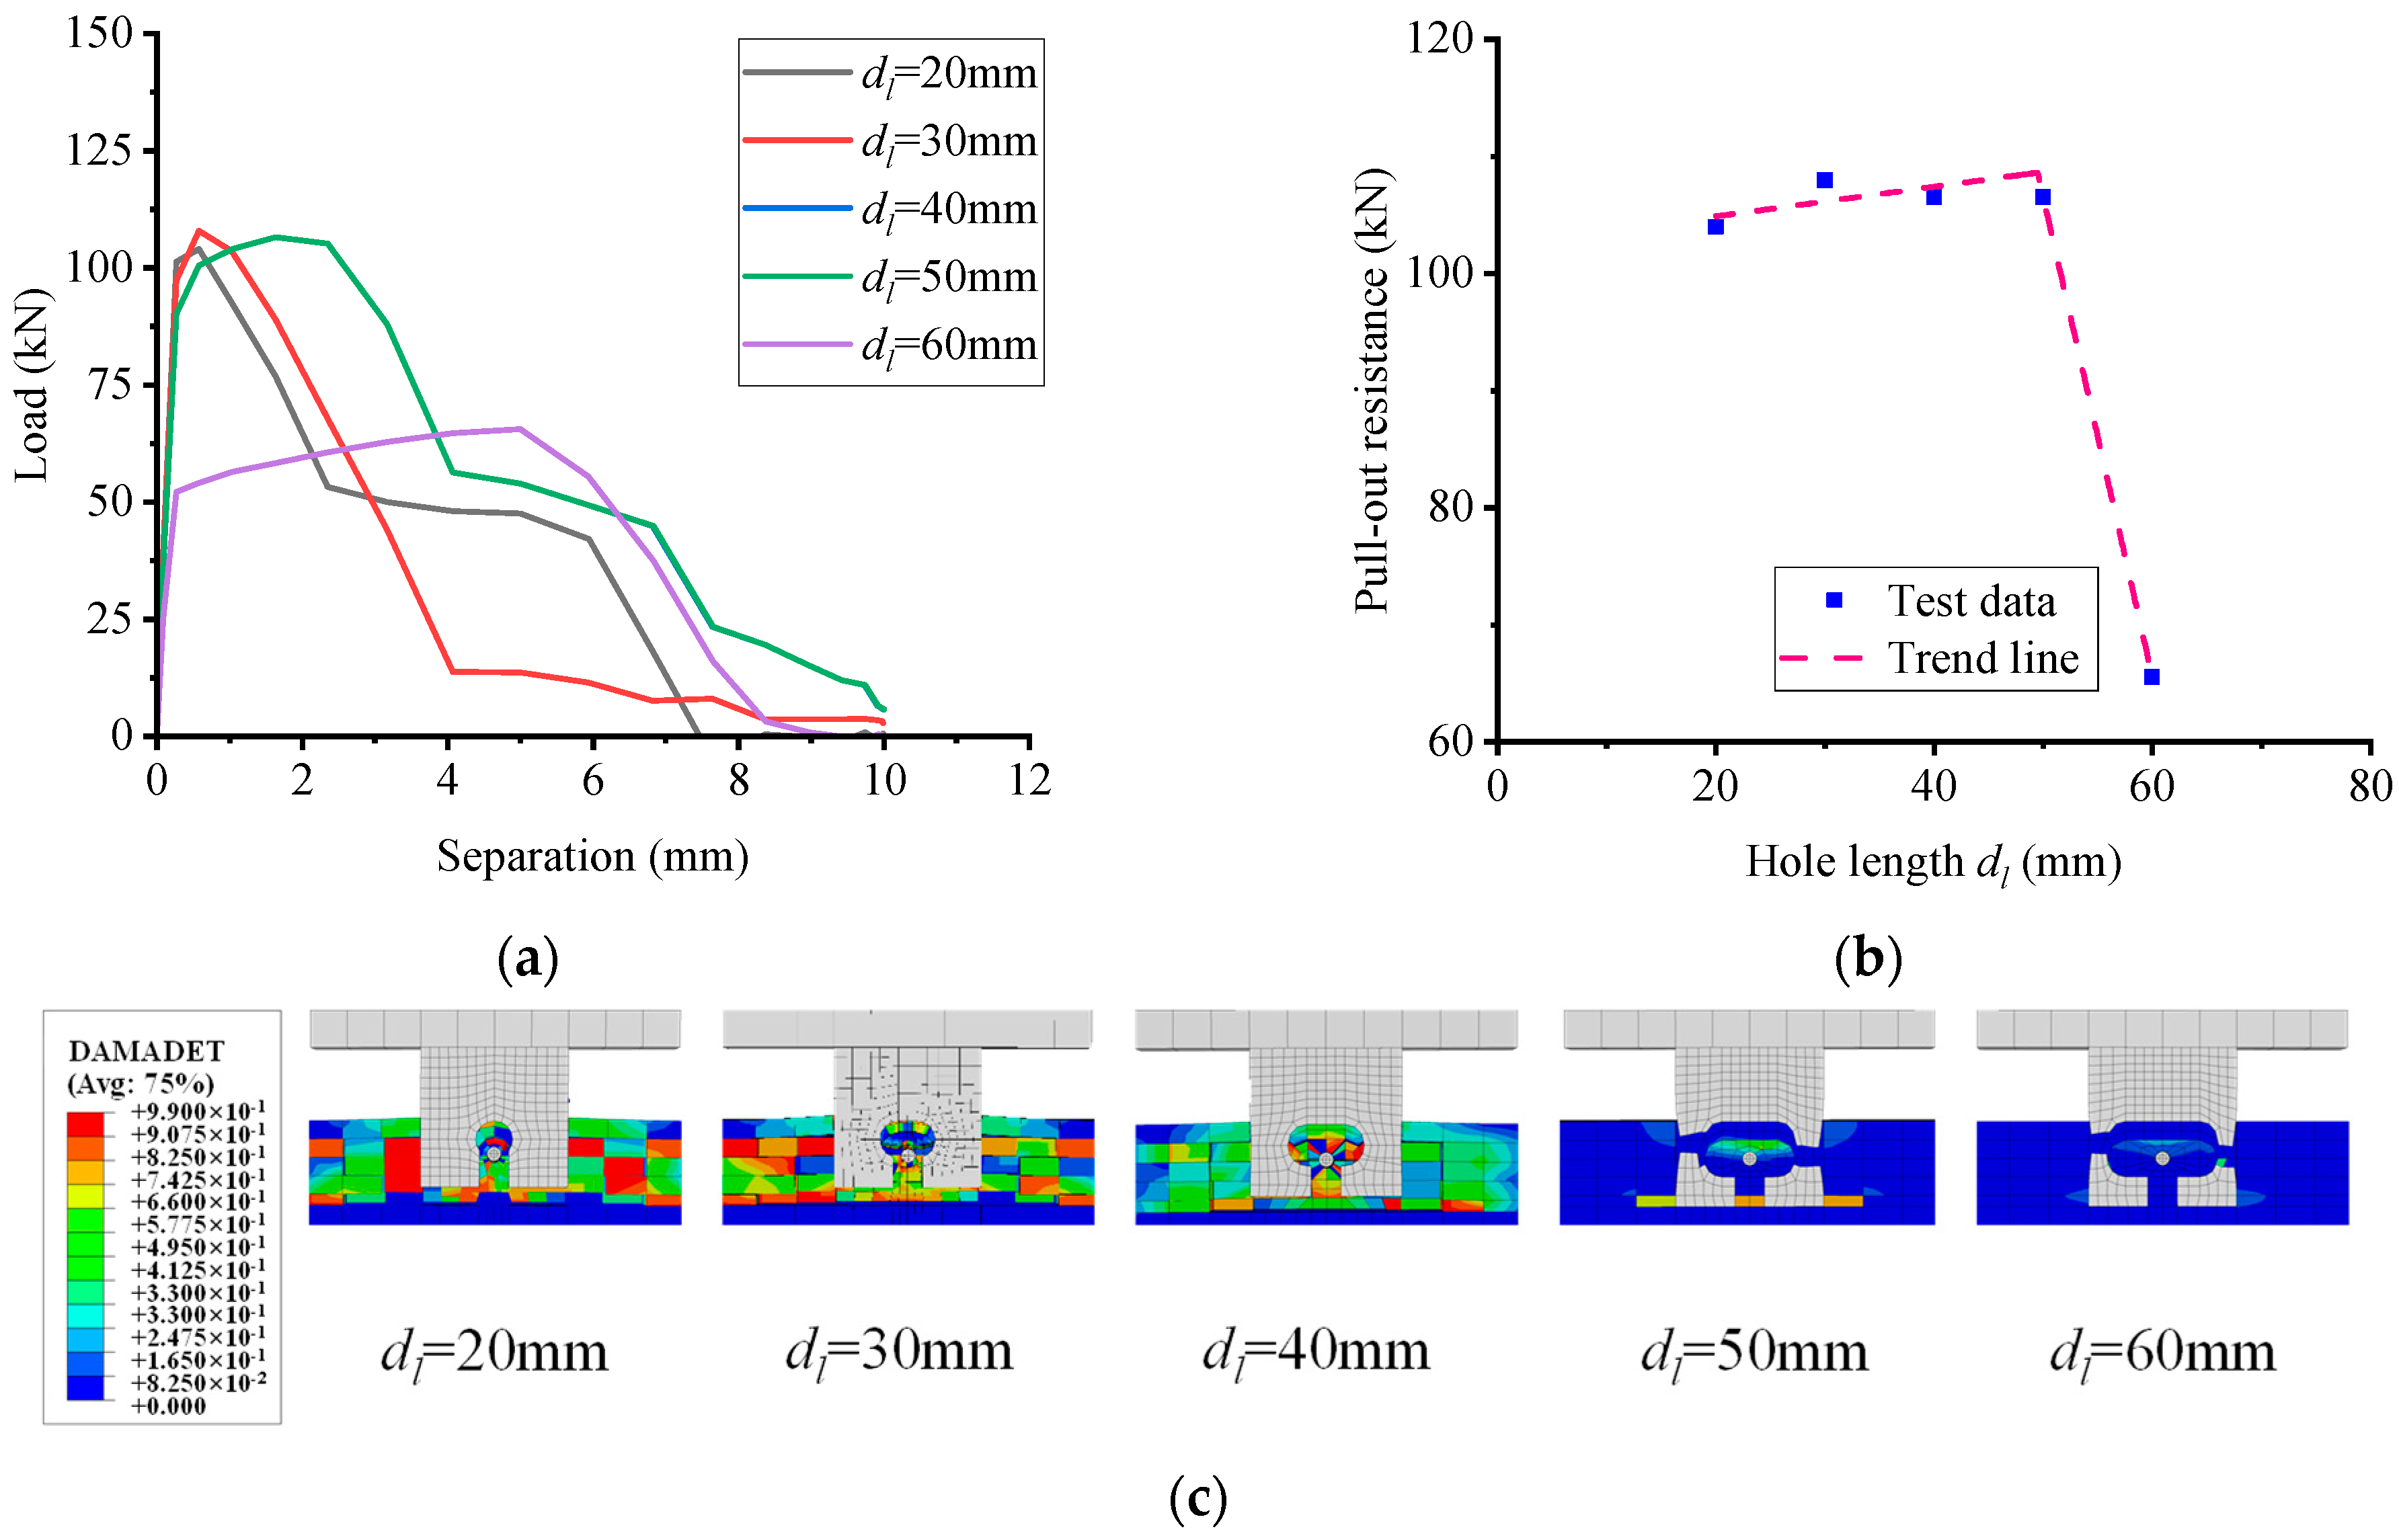
5.3. Influence of Hole Size

Figure 18 illustrates the impact of hole height on the pull-out performance of notched T-perfobond connectors. When the hole height was increased from 10 mm to 15 mm, 20 mm, 25 mm, and 30 mm, the corresponding changes in pull-out resistance were 1.59%, −1.65%, −2.87%, and −18.13%, respectively. The data reveal that while an increase in hole height from 10 mm to 15 mm slightly enhances pull-out resistance, further increases result in a decline. This trend is primarily attributed to the reduction in the perfobond rib’s thickness at the lower edge of the hole as the hole height increases. Concurrently, the moment at the notch of the perfobond rib and the inner edge of the hole at its maximum length intensifies. Despite this, the projected area of the concrete dowel and the contact area of the perfobond connectors remain constant, potentially causing earlier yielding and damage at the inner edge of the hole, which, in turn, diminishes pull-out resistance. Examination of the load–separation curve indicates that a larger hole height correlates with an extended ductile section.
Figure 19 demonstrates the influence of hole length on the pull-out performance of notched T-perfobond connectors. As the hole length increased from 20 mm to 30 mm, 40 mm, 50 mm, and 60 mm, the pull-out resistance of these connectors changed by 3.8%, 2.43%, 2.43%, and −36.96%, respectively. The results indicate that increasing the hole length up to 50 mm slightly augments the tensile strength of the connectors; however, a further increase to 60 mm significantly reduces the pull-out resistance. This phenomenon can be primarily attributed to the reduction in the perfobond rib’s thickness at the hole’s edge as the hole length expands. Consequently, the moment at the notch of the perfobond rib within the hole and at the inner edge of the hole at its maximum length increases. Although the projected contact area between the concrete dowel and the perfobond connectors may increase, the earlier yielding and damage of the perfobond rib at the inner edge of the hole at its maximum length occur, leading to a decrease in pull-out resistance.

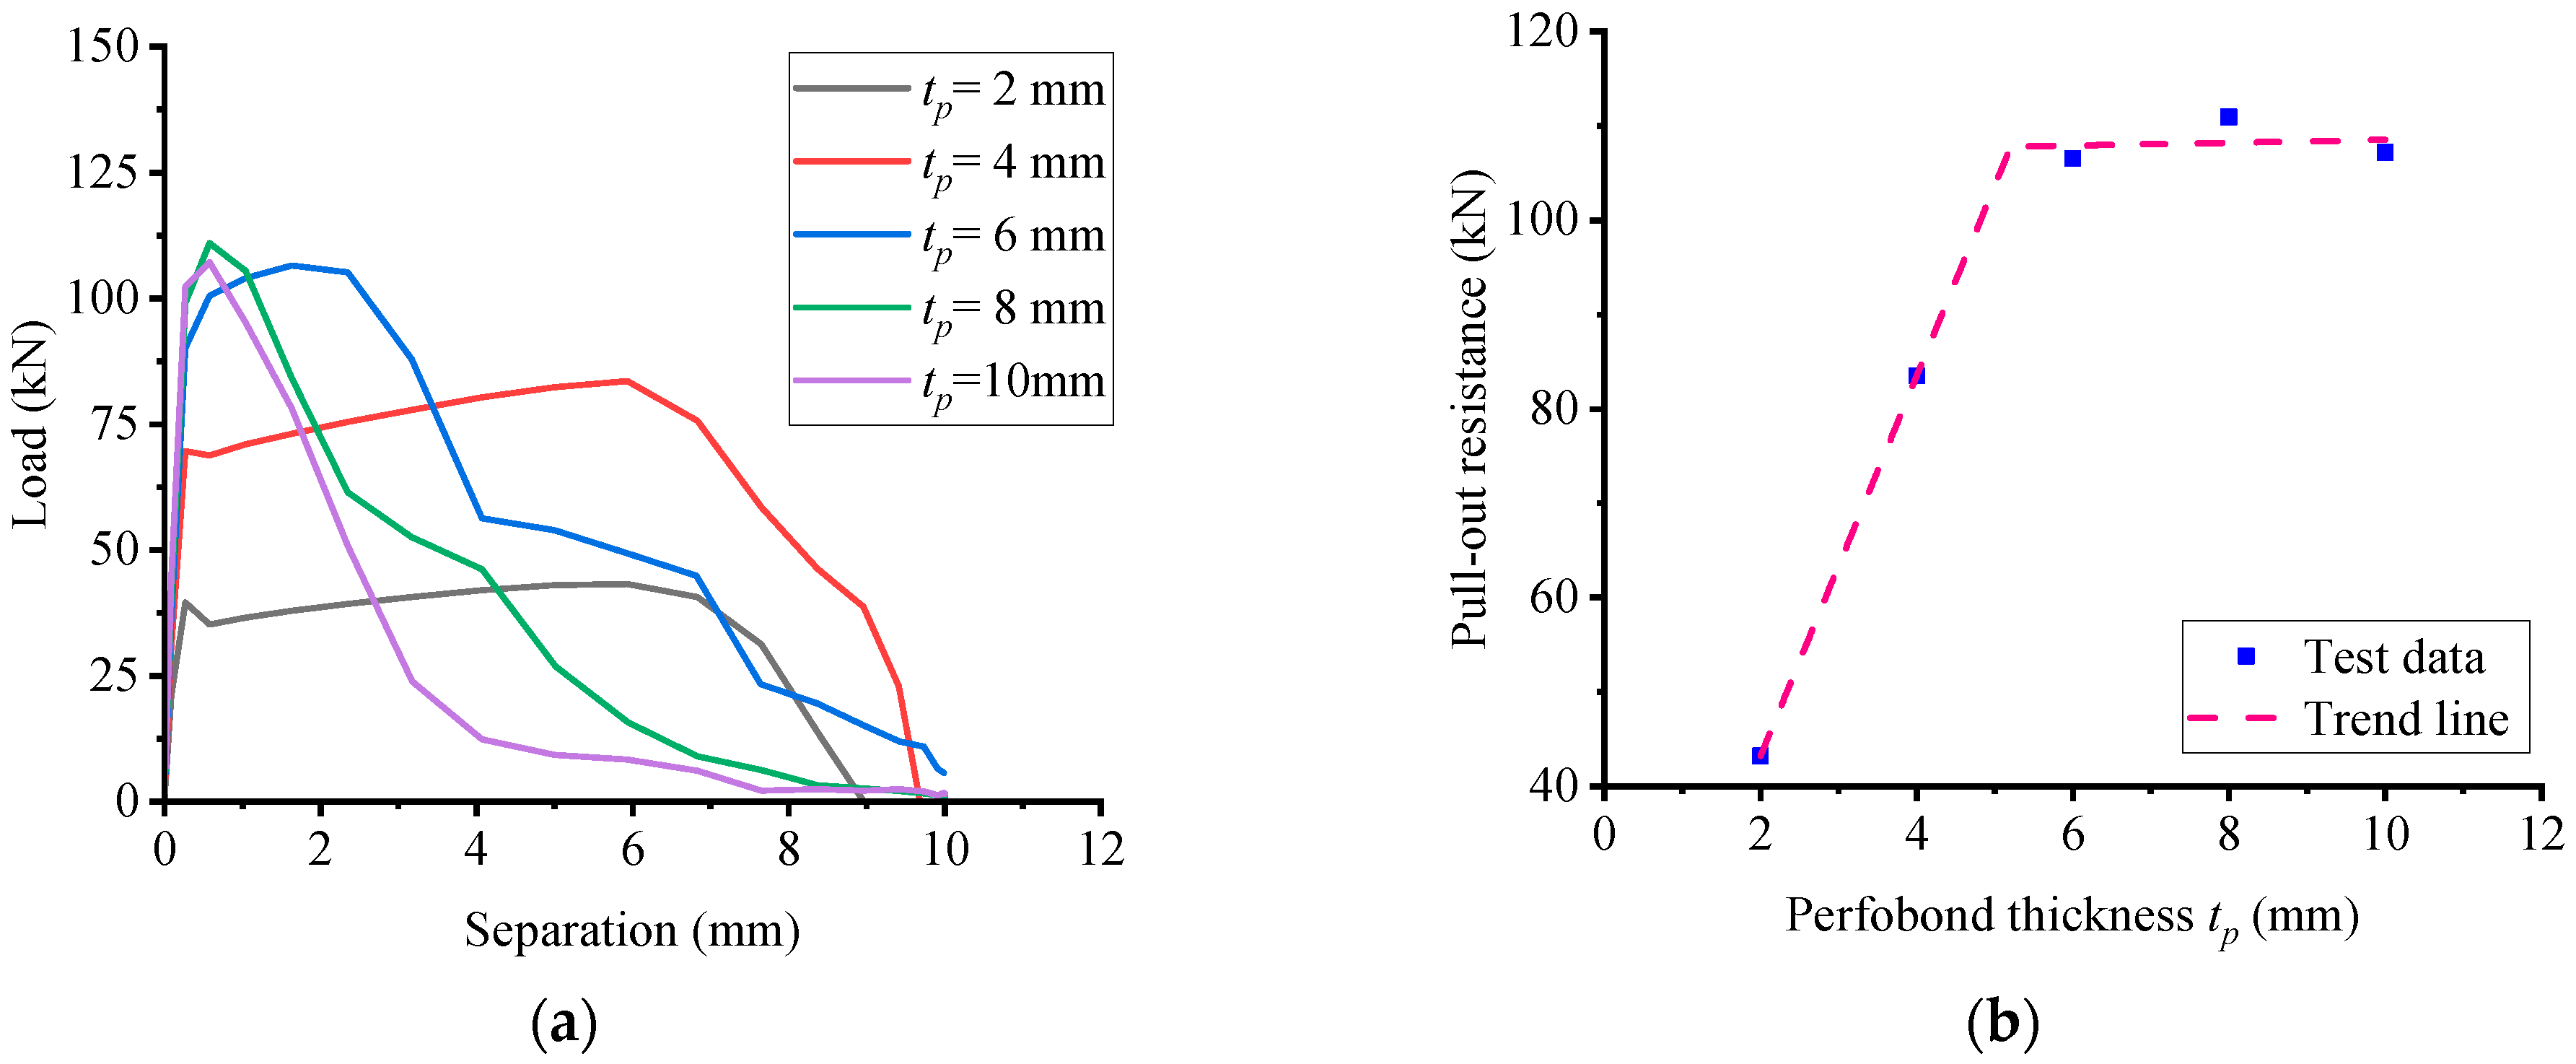
5.4. Influence of Perfobond Size

Figure 20 illustrates the significant impact of the perfobond connector’s thickness on the pull-out performance of notched T-perfobond connectors. The pull-out resistance increased dramatically as the thickness of the notched perfobond rib was incremented from 2 mm to 4 mm, 6 mm, 8 mm, and 10 mm, with respective increases of 93.22%, 146.44%, 156.71%, and 147.87%. The enhancement in pull-out resistance is primarily attributed to the robust anchoring effect of the bottom flange of the perfobond rib. For thicknesses between 2 mm and 6 mm, the perfobond rib weaker than the other structural elements; thus, the pull-out resistance increases linearly with the thickness of the perfobond rib. Once the thickness exceeds 6 mm, the perfobond rib’s strength surpasses the constraints imposed by the concrete and rebars in the holes. Consequently, further increases in the perfobond rib’s thickness lead to a continued rise in pull-out resistance. However, beyond a certain point, additional thickness does not yield a significant change in pull-out resistance.
Figure 21 demonstrates the significant impact of the notched perfobond rib’s length on the pull-out performance of notched T-perfobond connectors. As the perfobond rib’s length increased from 60 mm to 70 mm, 80 mm, 90 mm, and 100 mm, the pull-out resistance of the notched T-perfobond connectors correspondingly rose by 45.2%, 68.8%, 85.83%, and 83.11%, respectively. The enhancement in pull-out resistance is primarily due to the substantial anchoring effect of the bottom flange of the perfobond rib. Between lengths of 60 mm and 90 mm, the perfobond rib is weaker than the other structural constraints, and the ultimate resistance of the connectors increases linearly with the length of the perfobond rib. When the length exceeds 90 mm, the strength of the perfobond rib surpasses the constraints imposed by the concrete and rebars in the holes, suggesting that further increases in rib length may not significantly enhance pull-out resistance.

5.5. Influence of Rebar Diameter

Figure 22 illustrates the impact of rebar diameter on the pull-out performance of notched T-perfobond connectors. Increments in rebar diameter from 4 mm to 6 mm, 8 mm, 10 mm, and 12 mm resulted in minimal changes in pull-out resistance of −0.12%, −3.08%, −1.46%, and −0.34%, respectively. The findings indicate that the rebar diameter exerts a negligible influence on the ultimate pull-out resistance of the specimens. This outcome is likely attributed to the dominant anchorage effect provided by the flange and the notches, which overshadows the impact of rebar diameter variations on the ultimate resistance to pull-out.

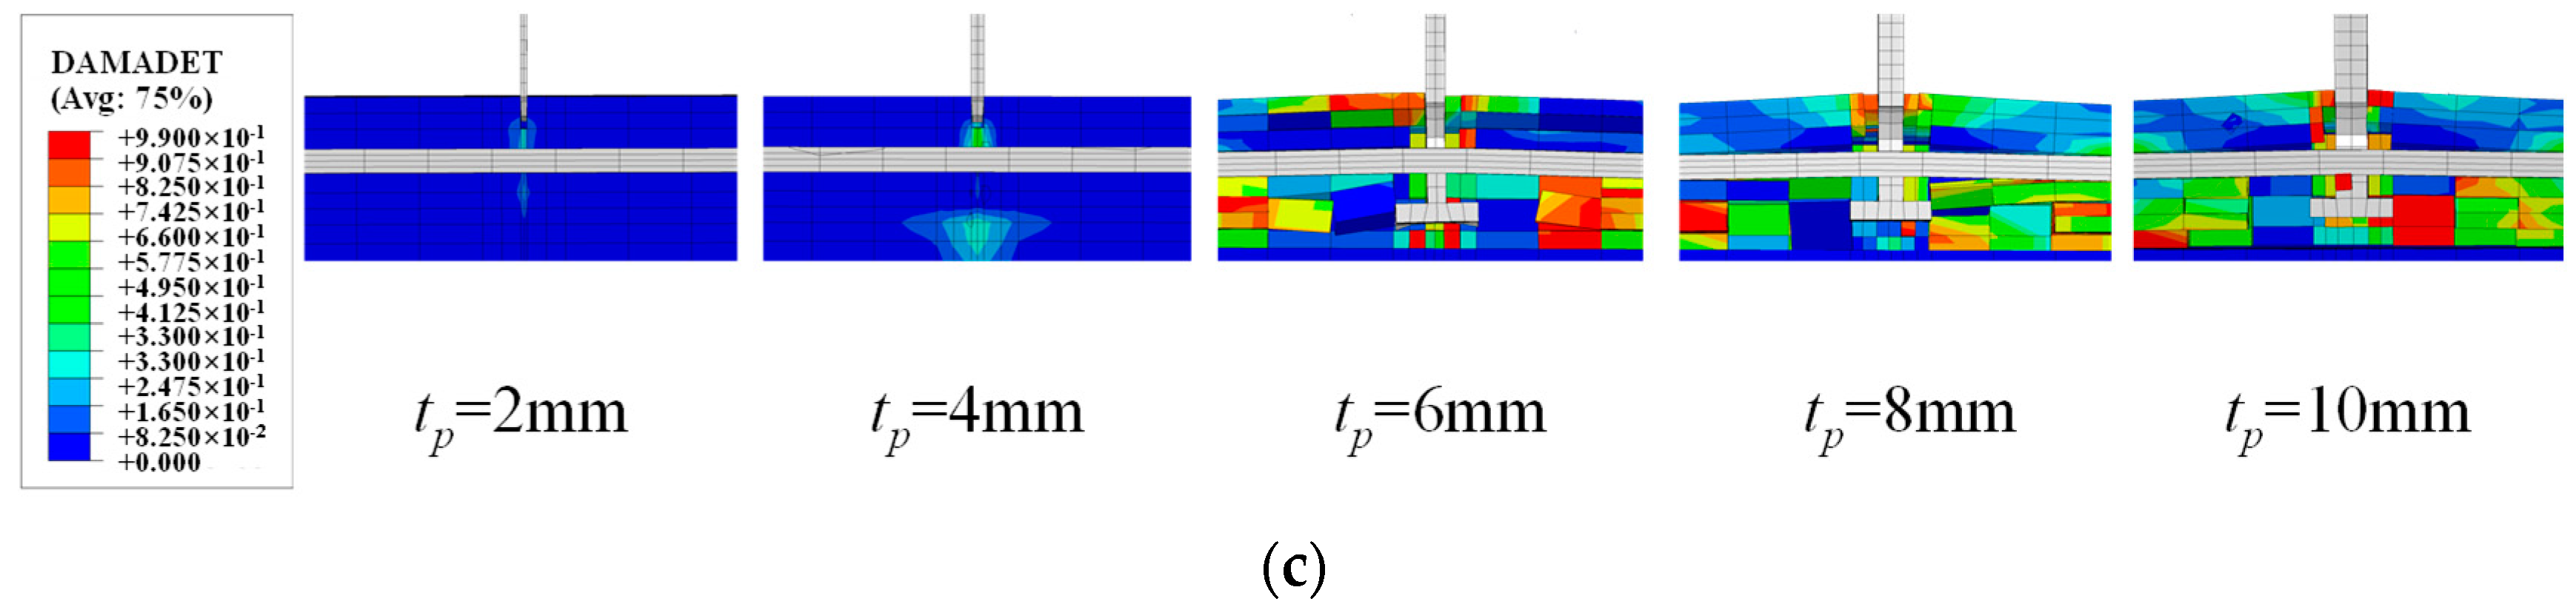
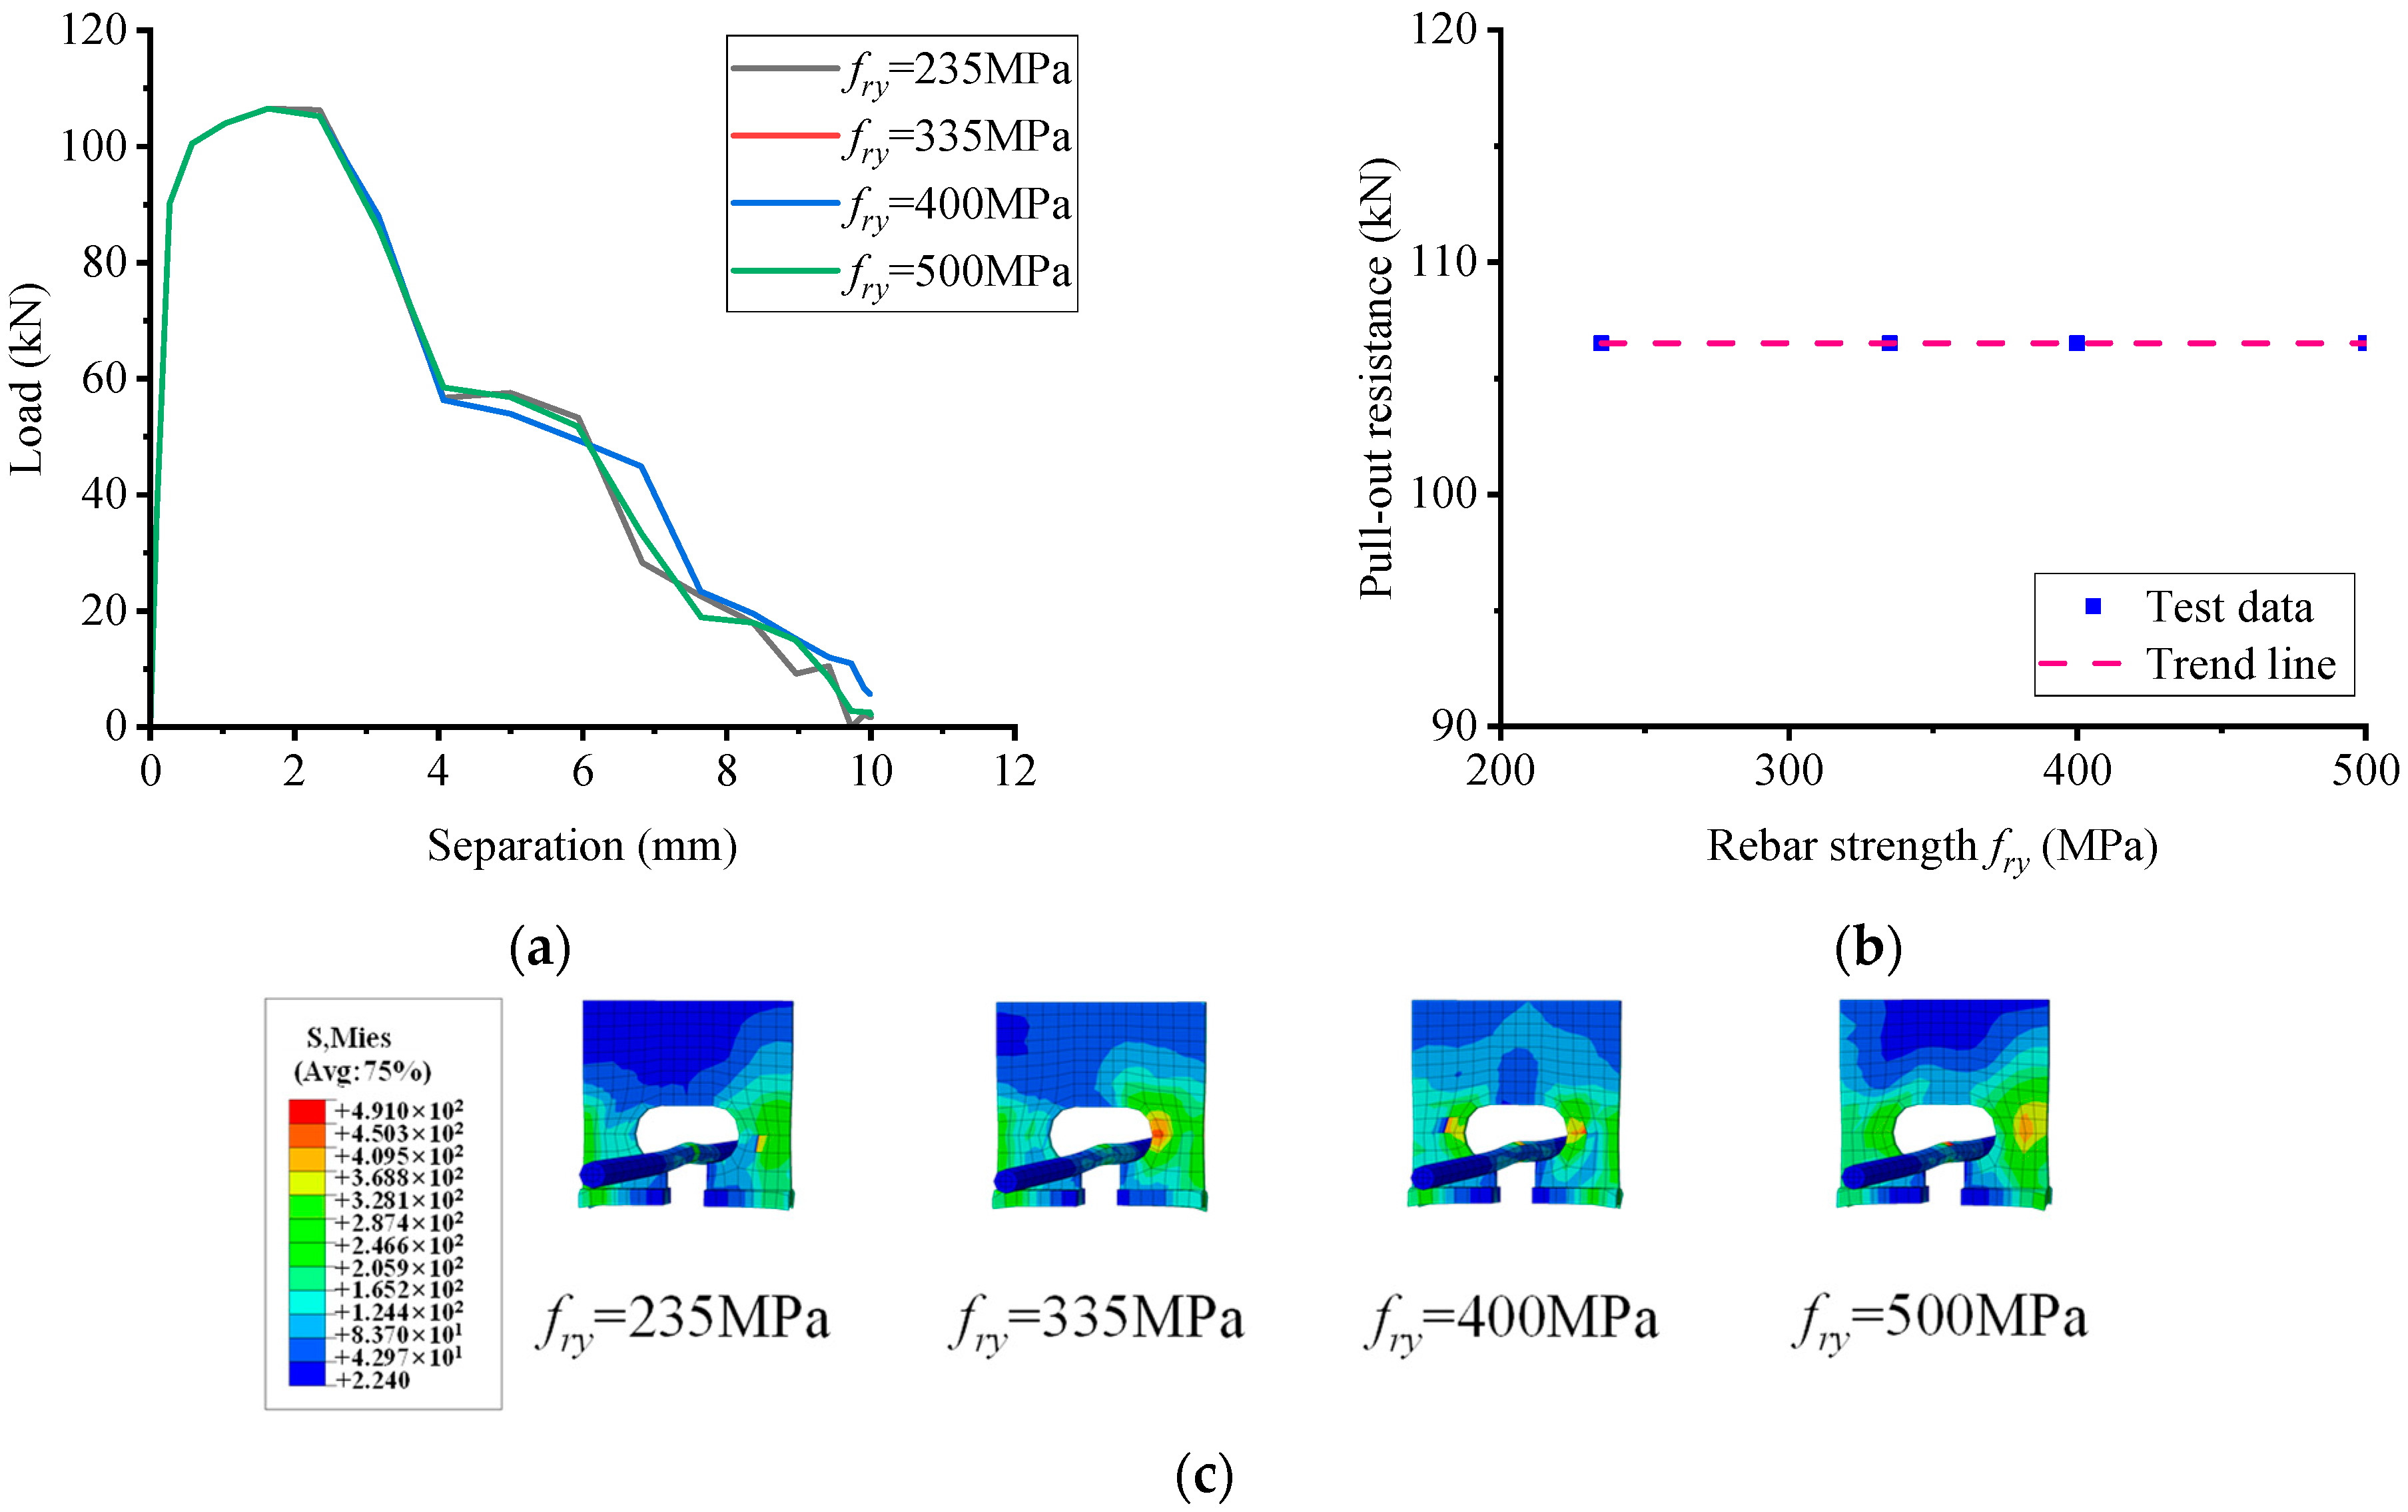
5.6. Influence of Material Strength

Figure 23 demonstrates the influence of concrete strength on the pull-out performance of notched T-perfobond connectors. As concrete strength escalated from 80 MPa to 95 MPa, 110 MPa, 130 MPa, and 140 MPa, the corresponding increases in pull-out strength were 8.87%, 22.79%, 25.31%, and 25.29%, respectively. The data indicate that the pull-out resistance of these connectors increases significantly with rising concrete strength, likely due to the strong anchorage effect of the flange. The predominant mode of specimen damage is concrete punching, and the pull-out resistance correlates linearly with concrete strength. Therefore, utilizing high-strength concrete can enhance the pull-out resistance of notched T-perfobond connectors. However, beyond a concrete strength of 110 MPa, there is a tendency for the pull-out resistance to plateau. This saturation may occur because, at certain strength levels, the concrete’s anchoring effect on the flange surpasses the strength of the notched perfobond rib, making the rib itself the limiting factor.
Figure 24 illustrates the impact of rebar strength on the pull-out performance of notched T-perfobond shear connectors. Notably, the pull-out resistance remained essentially constant as rebar strength increased from 235 MPa to 335 MPa, 400 MPa, and 500 MPa. The findings indicate that variations in rebar strength have a negligible effect on the pull-out resistance of the specimens. This outcome is likely due to the overwhelming anchorage effect of the flange and the notches, which diminishes the influence of rebar strength changes on pull-out resistance.
Figure 25 demonstrates the impact of the perfobond rib’s strength on the pull-out performance of notched T-perfobond connectors. As the strength of the perfobond rib increased from 235 MPa to 345 MPa, 390 MPa, 420 MPa, and 460 MPa, the pull-out strength correspondingly rose by 41.65%, 41.82%, 41.29%, and 52.61%, respectively. The results indicate that the pull-out resistance of the notched T-perfobond connectors increases significantly with the strength of the notched perfobond ribs. This substantial increase may be attributed to the linear relationship between pull-out resistance and the strength of the perfobond rib, facilitated by the exceptionally strong anchorage provided by the bottom flange of the notched perfobond rib, which is relatively weaker than other restraining elements.

6. Analytical Work

The damage modes are categorized into the following two types: perfobond rib fracture and concrete punching. For each specimen, the ultimate pull-out resistance, denoted as Tu, is defined as the minimum value between the calculated resistances for perfobond rib fracture (Ts) and concrete punching (Tc).
T u = min T s , T c

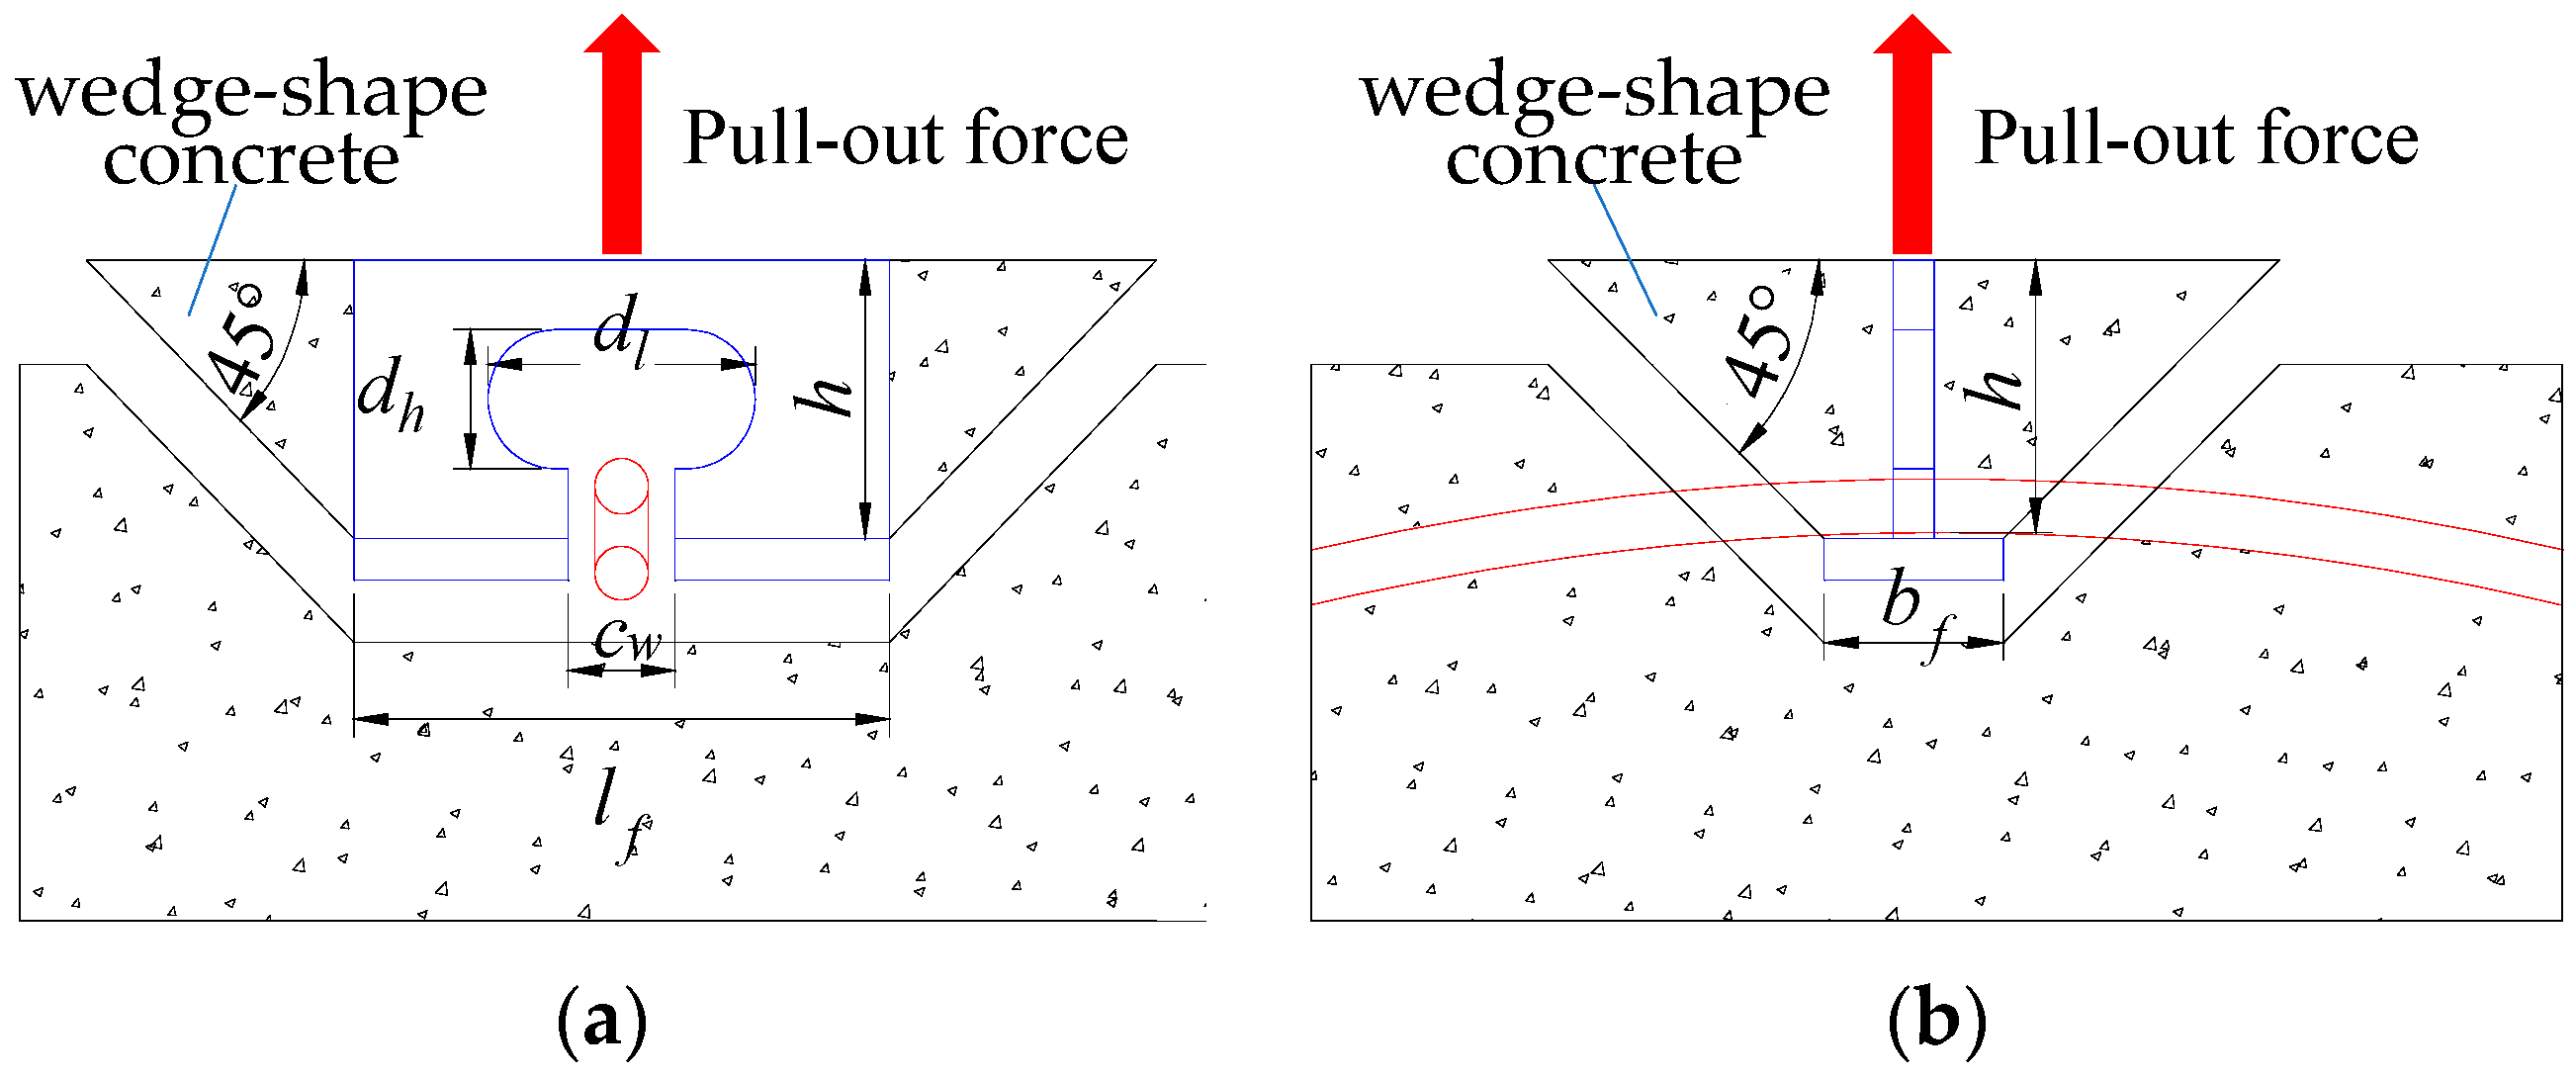
6.1. Fracture Damage of Perfobond Ribs

When the strength of the perfobond rib is lower than the anchoring effect provided by the concrete and the perforating rebar on the flange, the perfobond rib typically experiences stress concentration at the hole’s maximum length first. This concentration of stress initiates at the point where the rib is most likely to fracture. The fracture damage of the perfobond rib can be assessed using the calculation detailed in Equation (6).
T s = f s A s = f s l p d l t p
where fs represents the tensile strength of the perforated steel plate, a measure of its capacity to withstand pulling forces before breaking. Meanwhile, As denotes the cross-sectional area at the point where the perforated steel plate fractures, which is considered to be the largest area involved in the breakage.

6.2. Punching Damage of Concrete

As depicted in Figure 26, the model resembles a wedge-shaped inverted pyramid with diagonal edges, each forming a 45° angle with the horizontal plane. Owing to the exceptionally strong anchorage provided by the flange, once the concrete is lifted and damaged, the concrete dowel and the rebar within the hole no longer contribute to the ultimate tensile resistance. Consequently, Equation (7) considers the concrete damage as the determining factor based on the specimens’ damage patterns, and Equation (8) accounts for the effects of a reduction in the flange area of the notched specimens on the pull-out resistance, with the discounting factor being a piecewise function.
T c = f t S h = f t h 2 b f + h + 2 l f + h
T c = β f t S h = β f t h 2 b f + h + 2 l f + h
where Tc signifies the pull-out resistance corresponding to the concrete damage mode. The tensile strength of the concrete, represented by ft, is considered to be one-tenth of the concrete’s compressive strength (fc). Furthermore, Sh denotes the projected area of the concrete subjected to punching damage. The discount factor for the notch width (β) is defined as β = 1 − cw/lf ≥ 0.8, with the constraint that 0 ≤ cw/lf ≤ 0.2.

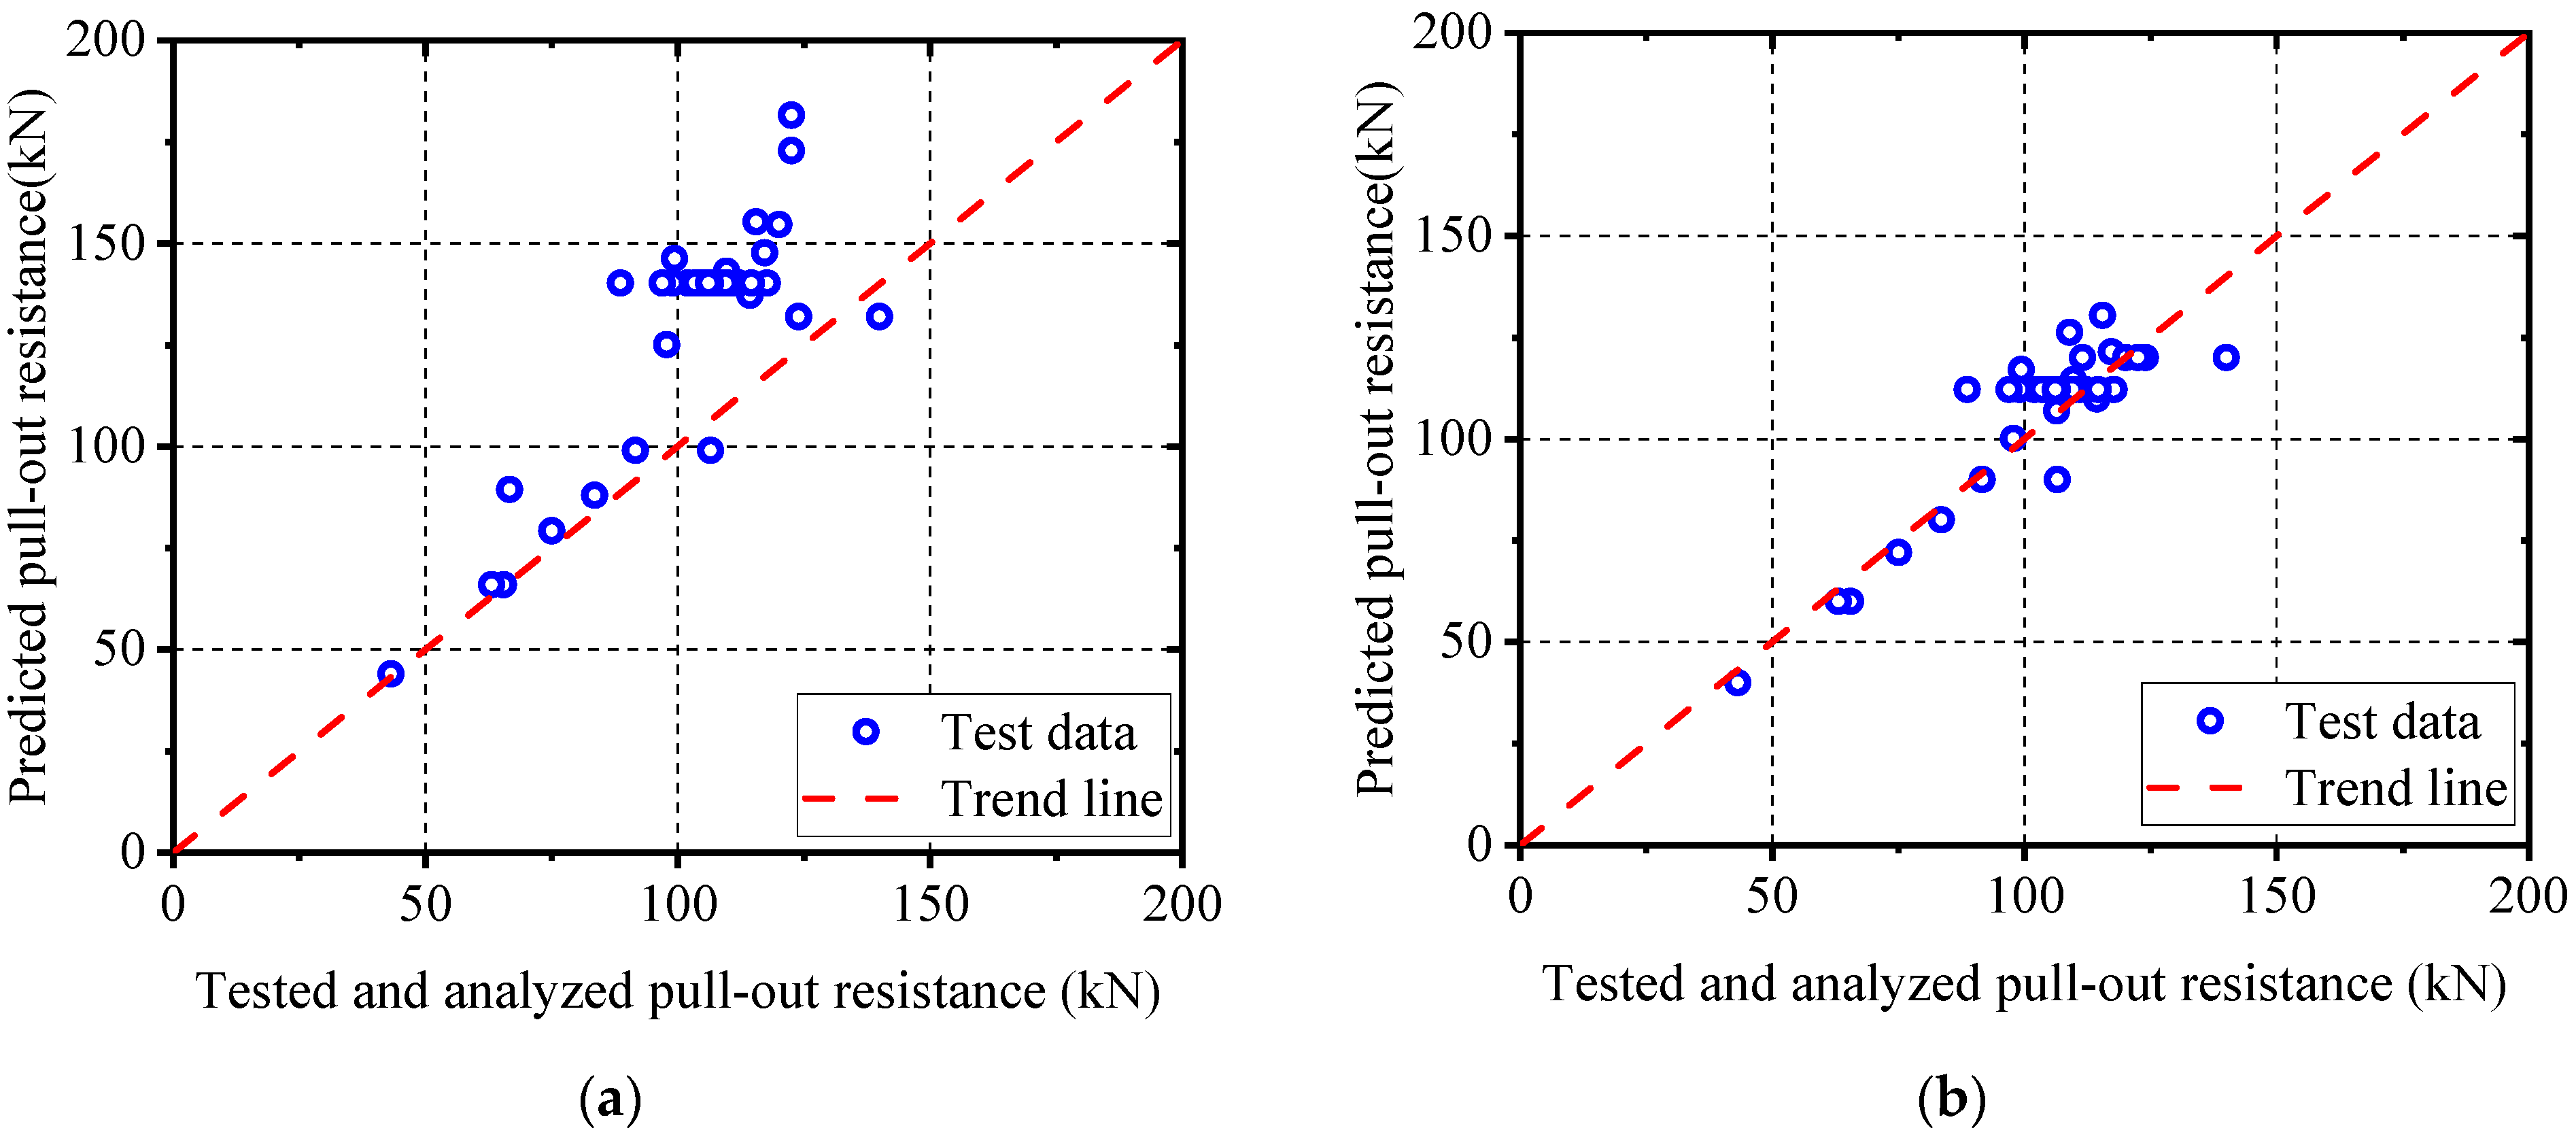
6.3. Comparison and Validation

Figure 27 presents a comparison of the calculated pull-out resistance with the results from pull-out tests and parametric analyses to validate the previously proposed equation. As illustrated in Figure 27a, Equation (7) tends to overestimate the pull-out resistance of notched T-perfobond connectors. This discrepancy may stem from the omission of the effect caused by discounting the notched area in Equation (7). The pull-out resistance calculated using a modified version of Equation (8) aligns more closely with both the test and numerical simulation outcomes, as shown in Figure 27b. Therefore, Equation (5), which is a combination of Equations (6) and (8), is deemed suitable for assessing the pull-out resistance of notched T-perfobond connectors in steel–concrete composite structures.

7. Conclusions

Based on the pull-out tests, numerical analyses, parametric studies, and analytical work on notched T-perfobond connectors, the following conclusions are drawn:
(1)
The pull-out damage modes for notched T-perfobond connectors consist of perfobond rib fracture and concrete punching damage. As the pull-out force increases, the interaction between the perforating rebar and the notched T-perfobond rib diminishes, making the connectors more susceptible to concrete damage in a wedge-shaped inverted pyramid pattern. In contrast, for un-notched T-perfobond connectors, the strong interaction between the perforating rebar and the perfobond rib, along with the anchorage effect of the concrete, leads to the fracture of the perfobond connectors. Notably, these damage modes do not exhibit the extensive fine cracks on the concrete surface that are typical of conventional concrete.
(2)
The proposed finite-element method is verified by comparison with the pull-out test results, demonstrating a favorable similarity to the observed pull-out damage. The analytical pull-out resistance values are 106.0% and 84.5% of the average test results for notched and un-notched T-perfobond connectors, respectively. This suggests that the finite-element model can generate rational parametric results for the pull-out performance of these connectors.
(3)
A total of 54 parameter simulations indicate that pull-out performance is mainly affected by flange size, connector thickness, and perfobond rib strength. Rebar diameter and strength have little effect. Concrete strength has a notable impact up to a point. Specifically, the flange thickness increases resistance from 2 to 8 mm, then plateaus. The flange width increases resistance significantly from 6 to 12 mm, then declines. The notch width has a minor influence and stabilizes beyond 16 mm. The hole height leads to a slight increase at 15 mm, then a decline. The hole length leads to an increase up to 50 mm, then a significant decrease. The perfobond rib thickness results in a dramatic increase, then plateaus. The perfobond rib length results in a linear increase up to 90 mm. The concrete strength leads to a significant increase and plateaus beyond 110 MPa. The perfobond rib strength leads to a significant linear increase. Design should balance these parameters for the desired resistance.
(4)
An analytical model is proposed to estimate the pull-out resistance of notched T-perfobond connectors. This model’s formula for calculating pull-out resistance correlates well with test and numerical simulation results, demonstrating its utility for evaluating the pull-out resistance of these connectors.

Author Contributions

Z.D. conducted the finite-element simulation and wrote the article. S.Z. applied for project funding and made overall plans. L.J. completed model experiments. X.X. participated in formulating the experimental plan. Y.Y. and Z.G. participated in experiments and simulations. H.L. participated in formulating project planning schemes. All authors have read and agreed to the published version of the manuscript.

Funding

The research described in this paper was financially supported by Grants from the Natural Science Foundation of China (51808235), the Fujian Provincial Natural Science Foundation of China (2018J05083), the Promotion Program for Young and Middle-aged Teacher in Science and Technology Research of Huaqiao University (ZQN-813), the Huaqiao University Scientific Research Funding (16BS804), and the College Students’ Innovation and Entrepreneurship Training Program Project (S202310385013).

Institutional Review Board Statement

Not applicable.

Informed Consent Statement

Not applicable.

Data Availability Statement

Data is contained within the article.

Conflicts of Interest

The authors declare no conflicts of interest.

Nomenclature

dlhole length
drdiameter of the rebar
tfflange thickness
lfflange length
cwcut width
Tupull-out resistance
fcuconcrete cube strength
fryyield strength of the reinforcing bar
fsyyield strength of the perfobond rib
σccompressive stress of concrete
εcppeak strain of concrete
EcYoung’s modulus of concrete
nratio of peak point cut-line modulus to initial modulus of elasticity
fttensile strength of concrete
wccrack width upon the complete release of stress
ciconstants (i = 1, 2)
dtuniaxial damage variables of concrete due to tensile cracking
εcininelastic strain of concrete
wpl“plastic” crack width of concrete
l0unit length
Tupulling resistance
Tstensile resistance calculated based on the strength of the perfobond connectors
Shprojected area of concrete punching damage surface
dhhole height
tpperfobond rib thickness
bfflange breadth
lpperfobond rib length
hperfobond rib burial depth
Tu,avgaveraged pull-out resistance
fcuniaxial compressive strength
frutensile strength of the reinforcing bar
fsutensile strength of the perfobond rib
εccompressive strain of concrete
ξratio of strain to peak strain
Ecppeak point cut-line modulus
σttensile stress of concrete
wcrack width of concrete
GFfracture energy required to create a unit area of stress-free crack
dcuniaxial damage variables of concrete due to compressive crushing
εcplplastic strain of concrete
bcconstant factor for concrete damage in compression
btconstant factor for concrete damage in tension
EsYoung’s modulus of steel
Tctensile bearing capacity calculated based on concrete strength
Asfractured cross-sectional area of perfobond connectors
βinfluence factor of the notch

References

  1. He, S.; Yang, G.; Jiang, Z.; Wang, Q.; Dong, Y. Effective width evaluation for HSS-UHPC composite beams with perfobond strip connectors. Eng. Struct. 2023, 295, 116828. [Google Scholar] [CrossRef]
  2. Ma, Y.; Zhang, B.; Peng, A.; Wang, L. Experimental and analytical investigation on shear mechanism of steel-UHPC composite T-perfobond connectors. Eng. Struct. 2023, 286, 116061. [Google Scholar] [CrossRef]
  3. Sun, L.; Liu, Y.; Wang, H.; Shi, F.; Liu, J.; Jiang, L. Tensile stiffness of perfobond rib connectors in steel–concrete composite pylon of bridges. Eng. Struct. 2023, 284, 115931. [Google Scholar] [CrossRef]
  4. Zhan, Y.; Huang, W.; Li, Y.; Li, J.; Shao, J.; Tian, B. Experimental investigation on mechanical behavior of T-type perfobond rib shear connectors under combined shear and tension. J. Build. Eng. 2023, 73, 106840. [Google Scholar] [CrossRef]
  5. Cândido-Martins, J.P.S.; Costa-Neves, L.F.; Vellasco, P.C.G.S. Experimental evaluation of the structural response of perfobond connectors. Eng. Struct. 2010, 32, 1976–1985. [Google Scholar] [CrossRef]
  6. Vianna, J.D.C.; De Andrade, S.A.L.; Vellasco, P.D.S.; Costa-Neves, L.F. Experimental study of perfobond connectors in composite construction. J. Constr. Steel Res. 2013, 81, 62–75. [Google Scholar] [CrossRef]
  7. Kim, Y.H.; Kang, J.Y.; Koo, H.B.; Kim, D.J. Pull-Out Resistance Capacity of a New perfobond connector for Steel Pile Cap Strengthening. Adv. Mater. Sci. Eng. 2016, 2016, 1374689. [Google Scholar] [CrossRef]
  8. He, S.; Fang, Z.; Mosallam, A.S. Push-out tests for perfobond strip connectors with UHPC grout in the joints of steel-concrete hybrid bridge girders. Eng. Struct. 2017, 135, 177–190. [Google Scholar] [CrossRef]
  9. Di, J.; Zou, Y.; Zhou, X.; Qin, F.; Peng, X. Push-out test of large perfobond connectors in steel–concrete joints of hybrid bridges. J. Constr. Steel Res. 2018, 150, 415–429. [Google Scholar] [CrossRef]
  10. Zheng, S.; Liu, Y.; Liu, Y.; Zhao, C. Experimental and parametric study on the pull-out resistance of a notched perfobond connector. Appl. Sci. 2019, 9, 764. [Google Scholar] [CrossRef]
  11. Oguejiofor, E.C.; Hosain, M.U. Numerical analysis of push-out specimens with perfobond rib connectors. Comput. Struct. 1997, 62, 617–624. [Google Scholar] [CrossRef]
  12. Al-Darzi, S.Y.K.; Chen, A.R.; Liu, Y.Q. Finite element simulation and parametric studies of perfobond rib connector. Am. J. Appl. Sci. 2007, 4, 122–127. [Google Scholar] [CrossRef]
  13. Zheng, S.; Liu, Y.; Yoda, T.; Lin, W. Parametric study on shear capacity of circular-hole and long-hole perfobond connector. J. Constr. Steel Res. 2016, 117, 64–80. [Google Scholar] [CrossRef]
  14. Kim, K.S.; Han, O.; Gombosuren, M.; Kim, S.H. Numerical simulation of Y-type perfobond rib shear connectors using finite element analysis. Steel Compos. Struct. 2019, 31, 53–67. [Google Scholar]
  15. Karam, M.S.; Yamamoto, Y.; Nakamura, H.; Miura, T. Numerical evaluation of the perfobond (PBL) shear connector subjected to lateral pressure using coupled rigid body spring model (RBSM) and nonlinear solid finite element method (FEM). Crystals 2020, 10, 743. [Google Scholar] [CrossRef]
  16. Suzuki, A.; Suzuki, K.; Kimura, Y. Ultimate shear strength of perfobond connectors subjected to fully reversed cyclic loading. Eng. Struct. 2021, 248, 113240. [Google Scholar] [CrossRef]
  17. Vianna, J.D.C.; Costa-Neves, L.F.; Vellasco, P.D.S.; De Andrade, S.A.L. Experimental assessment of Perfobond and T-perfobond connectors’ structural response. J. Constr. Steel Res. 2009, 65, 408–421. [Google Scholar] [CrossRef]
  18. Munemoto, S.; Sonoda, Y. An analytical study on dynamic strength evaluation of perfobond strip shear connectors. Appl. Mech. Mater. 2014, 566, 179–184. [Google Scholar] [CrossRef]
  19. Zheng, S.; Liu, Y.; Yoda, T.; Lin, W. Shear behavior and analytical model of perfobond connectors. Steel Compos. Struct. 2016, 20, 71–89. [Google Scholar] [CrossRef]
  20. Zheng, S.; Zhao, C.; Liu, Y. Analytical model for load–slip relationship of perfobond connector based on push-out test. Materials 2018, 12, 29. [Google Scholar] [CrossRef]
  21. Zhu, Y.Y.; Nie, X.; Fan, J.S.; Cui, B.; Huang, L.J. Experimental and analytical investigation on pull-out performance of multihole thin-rib perfobond connectors. J. Bridge Eng. 2019, 24, 04019037. [Google Scholar] [CrossRef]
  22. He, S.; Guan, P.; Wang, Q.; Fang, Z.; Mosallam, A. Investigation on structural performance of perfobond strip connector group in steel-concrete joints. Eng. Struct. 2021, 242, 112571. [Google Scholar] [CrossRef]
  23. Zhao, Q.; Zhang, G.; Liao, S.; Wu, N.; Fang, Z.; Fang, S.; Liu, F.; Li, L.; Zhu, H.; Xiong, Z. Static behavior of small-rib-height perfobond connectors embedded in UHPC: Experimental and analytical studies. J. Build. Eng. 2024, 85, 108750. [Google Scholar] [CrossRef]
  24. Liu, Y.; Yang, H.; Luan, L.; Xu, X.; Liu, Y.; Du, X. Three failure modes of high-strength steel (HSS) perfobond connector embedded in UHPC. Eng. Struct. 2023, 286, 116147. [Google Scholar] [CrossRef]
  25. He, S.; Li, Q.; Yang, G.; Zhou, X.; Mosallam, A.S. Experimental study on flexural performance of HSS-UHPC composite beams with perfobond strip connectors. J. Struct. Eng. 2022, 148, 04022064. [Google Scholar] [CrossRef]
  26. Dassault System. ABAQUS Documentation, Version 6.10; Dassault System: Waltham, WA, USA, 2010. [Google Scholar]
  27. Hordijk, D.A. Tensile and tensile fatigue behaviour of concrete; experiments, modelling and analyses. Heron 1992, 37, 1. [Google Scholar]
Figure 1. Layout of pull-out test specimens. (a) Front view; (b) side view; (c) top view; (d) 3D view. (Note: The black lines indicate the concrete cube, the black triangles indicate the concrete fill; the blue lines indicate the steel plate; and the red lines indicate the rebars.)
Applsci 14 07089 g001
Figure 2. Details of perfobond ribs. (a) T-perfobond rib; (b) notched T-perfobond rib. (Note: The blue lines indicate the perfobond connectors, and the red lines indicate the rebar.)
Applsci 14 07089 g002
Figure 3. Steel fibers.
Applsci 14 07089 g003
Figure 4. Test setup and instrumentation.
Applsci 14 07089 g004
Figure 5. Uplift failures of specimens. (a) Fracture damage of perfobond ribs of PFR; (b) concrete punching damage of PMFR.
Applsci 14 07089 g005
Figure 6. Load–separation curves. (a) PFR; (b) PMFR.
Applsci 14 07089 g006
Figure 7. Pull-out mechanism. (a) T-perfobond; (b) notched T-perfobond.
Applsci 14 07089 g007
Figure 8. Finite-element model.
Applsci 14 07089 g008
Figure 9. Finite-element type and mesh.
Applsci 14 07089 g009
Figure 10. Interaction and boundary conditions.
Applsci 14 07089 g010
Figure 11. Material constitution of concrete. (a) Compression; (b) tension.
Applsci 14 07089 g011
Figure 12. Material constitution of steel.
Applsci 14 07089 g012
Figure 13. Tested and analyzed failure modes. (a) Concrete damage verification; (b) perfobond rib fracture verification.
Applsci 14 07089 g013
Figure 14. Tested and analyzed load–slip curves. (a) T-perfobond; (b) notched T-perfobond.
Applsci 14 07089 g014
Figure 15. Influence of flange thickness. (a) Load–separation curves; (b) influence analysis; (c) failure mode.
Applsci 14 07089 g015
Figure 16. Influence of flange width. (a) Load–separation curves; (b) influence analysis; (c) failure mode.
Applsci 14 07089 g016aApplsci 14 07089 g016b
Figure 17. Influence of cut width. (a) Load–separation curves; (b) influence analysis; (c) failure mode.
Applsci 14 07089 g017
Figure 18. Influence of hole height. (a) Load–separation curves; (b) influence analysis; (c) failure mode.
Applsci 14 07089 g018
Figure 19. Influence of hole length. (a) Load–separation curves; (b) influence analysis; (c) failure mode.
Applsci 14 07089 g019
Figure 20. Influence of perfobond thickness. (a) Load–separation curves; (b) influence analysis; (c) failure mode.
Applsci 14 07089 g020aApplsci 14 07089 g020b
Figure 21. Influence of perfobond length. (a) Load–separation curves; (b) influence analysis; (c) failure mode.
Applsci 14 07089 g021
Figure 22. Influence of rebar diameter. (a) Load–separation curves; (b) influence analysis; (c) failure mode.
Applsci 14 07089 g022
Figure 23. Influence of concrete strength. (a) Load–separation curves; (b) influence analysis; (c) failure mode.
Applsci 14 07089 g023
Figure 24. Influence of rebar strength. (a) Load–separation curves; (b) influence analysis; (c) failure mode.
Applsci 14 07089 g024
Figure 25. Influence of steel strength. (a) Load–separation curves; (b) influence analysis; (c) failure mode.
Applsci 14 07089 g025
Figure 26. Punching damage of concrete. (a) Side view; (b) front view.
Applsci 14 07089 g026
Figure 27. Comparison of calculation and tested results. (a) Equations (6) and (7); (b) Equations (6) and (8).
Applsci 14 07089 g027
Table 1. Model grouping and experimental results.
Specimendl (mm)dh (mm)dr (mm)tp (mm)tf (mm)bf (mm)lp (mm)cw (mm)Tu (kN)Tu,avg (kN)
PFR–1402086626800140132.0
PFR–2402086626800124
PMFR–14020866268016102100.5
PMFR–2402086626801699
Table 2. Generalization of parametric models.
Modeltf
(mm)
bf
(mm)
cw
(mm)
dh
(mm)
dl
(mm)
tp
(mm)
lp
(mm)
dr
(mm)
fc
(MPa)
fry
(MPa)
fsy
(MPa)
Tu
(kN)
TF-02226162040680895400390103.44
TF-0442616204068089540039098.39
TF-06626162040680895400390106.51
TF-08826162040680895400390117.64
TF-101026162040680895400390117.82
BF-066616204068089540039066.71
BF-12612162040680895400390114.31
BF-18618162040680895400390112.2
BF-26626162040680895400390106.51
BF-3463416204068089540039099.43
CW-0062602040680895400390111.52
CW-0862682040680895400390109.01
CW-16626162040680895400390106.51
CW-24626242040680895400390108.45
CW-40626402040680895400390107.27
DH-10626161040680895400390108.3
DH-15626161540680895400390110.02
DH-20626162040680895400390106.51
DH-25626162540680895400390105.19
DH-3062616304068089540039088.66
DL-20626162020680895400390103.98
DL-30626162030680895400390107.93
DL-40626162040680895400390106.51
DL-50626162050680895400390106.51
DL-6062616206068089540039065.55
TP-0262616204028089540039043.22
TP-0462616204048089540039083.51
TP-06626162040680895400390106.51
TP-08626162040880895400390110.95
TP-106261620401080895400390107.13
LP-6062616204066089540039063.1
LP-7062616204067089540039091.62
LP-80626162040680895400390106.51
LP-90626162040690895400390117.26
LP-1006261620406100895400390115.54
DR-04626162040680495400390109.9
DR-06626162040680695400390109.77
DR-08626162040680895400390106.51
DR-106261620406801095400390108.29
DR-126261620406801295400390109.53
FC-8062616204068088040039097.83
FC-95626162040680895400390106.51
FC-1106261620406808110400390120.13
FC-1306261620406808130400390122.59
FC-1406261620406808140400390122.57
RY-235626162040680895235390106.51
RY-335626162040680895335390106.51
RY-400626162040680895400390106.51
RY-500626162040680895500390106.51
SY-23562616204068089540023575.1
SY-345626162040680895400345106.38
SY-390626162040680895400390106.51
SY-420626162040680895400420106.11
SY-460626162040680895400460114.61
Note: The datas in the gray background represent the same set of parameters.
Disclaimer/Publisher’s Note: The statements, opinions and data contained in all publications are solely those of the individual author(s) and contributor(s) and not of MDPI and/or the editor(s). MDPI and/or the editor(s) disclaim responsibility for any injury to people or property resulting from any ideas, methods, instructions or products referred to in the content.

