Abstract
Based on a damaged continuous rigid-frame bridge in Shaanxi Province, this study deduced the crack damage simulation algorithm and the vehicle-bridge coupling numerical algorithm. Then, it established a finite element analysis model using ANSYS APDL. The Newmark-β iterative method was used to study the dynamic response of different speeds, vehicle weights, and damage degrees before and after the structural damage. In the analysis of the influence of different speeds, the results showed that the dynamic stress responses of key sections of the undamaged bridge reached the maximum when the speed was 80 km/h, indicating that the undamaged bridge was sensitive to a speed of 80 km/h. The peak response of the damaged bridge was 90 km/h. In addition, the displacement peaks and the stress peaks rose and fell together. The analysis of different vehicle weights and damage degrees showed that with the increase in them, the displacement and impact coefficients of each section increased significantly. It can be concluded that the dynamic performance of the in-service bridge decreases continuously with the aggravation of the damage. Therefore, the influence of vehicle-bridge coupling should be emphasized in maintenance, and the frequent cracking area at the midspan should be strengthened in time to prevent further damage.
1. Introduction
With the continuous development of the highway transportation industry, the number of highway bridges is steadily increasing. The continuous rigid-frame bridge has large longitudinal and transverse stiffness and remarkable mechanical performance and span capacity. It integrates the mechanical advantages of the continuous beam and T-type rigid-frame bridge and also retains certain characteristics; thus, it allows a reduction in the daily maintenance of the expansion joints and the avoidance of the replacement of large tonnage supports in the later period [1,2,3]. These characteristics make it one of the main bridge types built in mountainous and canyon areas in northwest China.
The existing research on the vehicle-bridge coupling vibration of high-pier and long-span continuous rigid-frame bridges is relatively well-established, and the factors involved are comparatively comprehensive. For example, Li et al. [4] developed a vehicle-bridge coupling analysis program based on Intel Visual Fortran language. Combined with the corresponding finite element model, the effects of carriageway position, vehicle-bridge mass ratio, and the bridge support form on vehicle-bridge coupling vibration were studied. Zhang et al. [5] studied the vehicle-bridge coupling response of a curved bridge using a finite element simulation method. The results showed that vehicle weight and road roughness were the most influential factors. Peng et al. [6] established a finite element model of a five-span continuous beam bridge according to the general drawings of bridges and culverts and applied the numerical simulation method to analyze the dynamic response of the bridge under vehicle load according to the two aspects of deflection and stress. Finally, it was concluded that there would be a sizable dynamic amplification factor in the middle of the side span and in the middle of the secondary side span and midspan and that the simple support structure at one end of the side span had a greater influence on this factor. Li et al. [7] took a three-span continuous beam bridge with a variable cross-section as a research object to carry out variable parameter analysis and studied the effect of jump-off on the vehicle-bridge coupling response. In addition, Lu et al. [8] further studied the coupling response of continuous rigid-frame bridges under the action of random traffic flow, fitted the critical dynamic deflection, and then provided the reliability index of the bridge under the corresponding working conditions. Lin et al. [9] studied the impact coefficient of a high-speed railway continuous rigid-frame–arch-combined bridge and obtained the fitting formula of the impact coefficient for each component. A. Camara et al. [10] established an analytical framework for the wind–vehicle-bridge interaction and analyzed driving comfort based on 2-D road roughness. Thomas J. Matarazzo et al. [11] proposed a simplified analysis method of vehicle-bridge coupling and proved that it can significantly reduce computational costs. Liu et al. [12] proposed a new method of reordering finite element model numbers using the improved Gibbs–Poole–Stockmeyer algorithm and pointed out that the method could significantly improve the iterative calculation of vehicle-bridge coupling efficiency. Sandro Carbonari et al. [13] combined the mass change method with the OMA method to obtain the modal scaling factors for the mass normalization of mode shapes. The effects of vehicle-bridge coupling effect are considered in the study, and the cases that need to be considered and can be ignored are distinguished. Soheil Sadeghi Eshkevari et al. [14] used STRIDEX algorithm to process the mobile sensor data and identify the modal characteristics of the bridge under different road roughness level. Li et al. [15] established a 2-D vehicle model and 3-D vehicle model, and the effects of the different models on the coupling vibration of the vehicle-axle are analyzed. Arturo Gonzalez et al. [16] carried out a parameterization study on the uncoupled vehicle-bridge interaction and calculated the influence of different factors on the algorithm error.
Through the above investigations, it can be seen that the theory of vehicle-bridge coupling vibration under the continuous rigid-frame bridge system is now mature after nearly 70 years of research. However, the research focus is mainly on the vehicle-bridge coupling vibration response of the undamaged continuous rigid-frame bridge, while the research on the dynamic response of the damaged continuous rigid-frame bridge under vehicle-bridge coupling vibration is still insufficient. Using modified concrete bridge damage parameters [17,18], Yin et al. [19] carried out a vehicle-bridge coupling analysis of a damaged three-span continuous concrete box beam with variable sections and pointed out that the impact coefficient of the multi-span variable sections of the damaged beam varied with the vehicle speed and was related to the crack parameters. Xie et al. [20] studied the vehicle-bridge coupling response of an old concrete truss arch bridge by combining a real bridge detection method and finite element modeling and then gave the impact coefficient of different bridge locations under different vehicle speeds. Zhou et al. [21] analyzed the vehicle-bridge coupling vibration of an in-service curved-string truss bridge based on an analysis method that considered the jump-off period and calculated the dynamic response of the space vehicle fleet crossing the bridge. However, structural diseases such as beam cracking, steel corrosion, and the local spalling of concrete are also very common in continuous rigid-frame bridges. In addition, this type of bridge has developed rapidly and in large numbers in northwest China (especially in Shaanxi Province). With the increase in their service lives, a large number of in-service bridges with cracks are in continuous operation. When cracks appear in the beam body, their damage develops under the repeated influence of vehicle-bridge coupling vibration, which has an impact on the structural durability and load-bearing safety of the concrete bridge. If it is not controlled in time, when the cracks expand to a certain extent, the collapse of the bridge structure will become a threat to people’s lives and property.
Therefore, this study mainly investigates the dynamic response of the high-pier and long-span continuous rigid-frame bridge with crack damage under different vehicle parameters and the degrees of structural damage; then, it analyzes the influence of the bridge stress, displacement, and impact coefficient.
2. Crack Damage Simulation Algorithm
Based on the statistical analysis of the number, length, width, and height of the cracks in the continuous rigid-frame bridge, this study simulates the crack damage by reducing the stiffness in the areas with high concentrations of cracks and establishes a crack model accordingly. This can improve the accuracy of the results and can also establish a theoretical foundation for the subsequent influence of the coupling vibration of the vehicle bridge on the dynamic response of the bridge structure.
According to Wu Xiaoguang’s [22], the investigation of 74 continuous rigid-frame bridges in Shaanxi Province, the section cracking of continuous rigid-frame bridges is serious in the L/4, L/3, and midspan closure sections. Among them, the longitudinal cracks in the bottom plate of L/4 and the assembly section, such as the midspan closure section, are particularly serious and have become the most serious disaster [23] area for crack development. Therefore, L/4, L/3, and the midspan in the following text refer to the corresponding position of the second span (middle span). The cracks are divided into four categories, and each category is shown in Figure 1, Figure 2, Figure 3 and Figure 4.
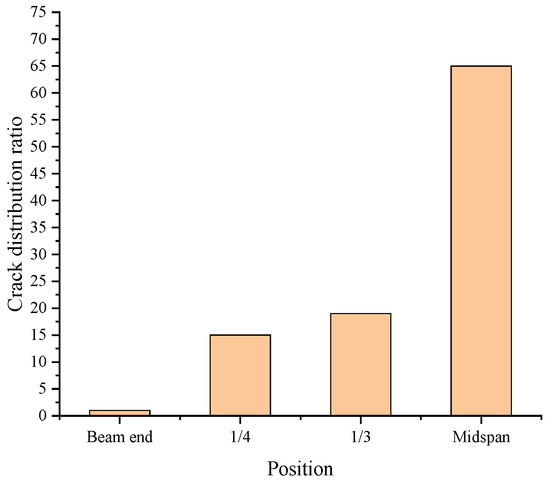
Figure 1.
Distribution ratio of cracks in the first type of bridge.
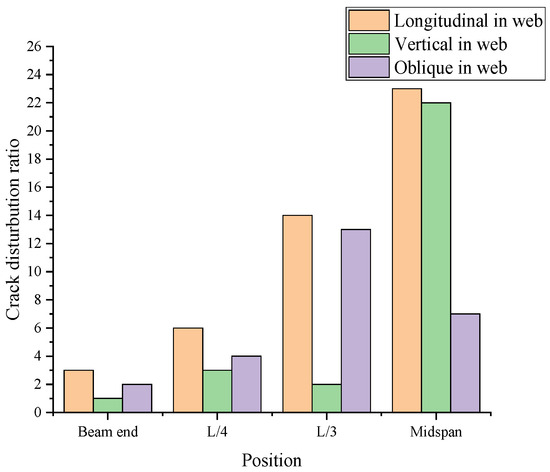
Figure 2.
Distribution ratio of cracks in the second type of bridge.
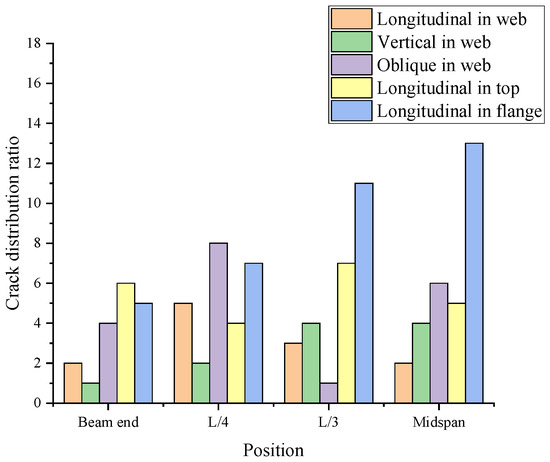
Figure 3.
Distribution ratio of cracks in the third type of bridge.
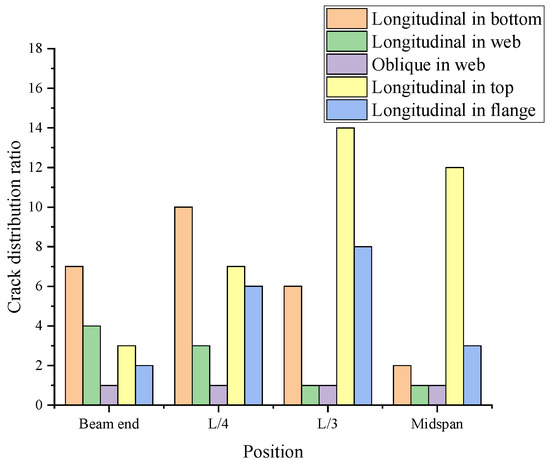
Figure 4.
Distribution ratio of cracks in the fourth type of bridge.
The first type of bridge cracks is mainly distributed on the bottom plate, running longitudinally along the bridge span direction. The second type of bridge cracks is mainly distributed on the web of the beam body, and the longitudinal, vertical, and oblique cracks extend from the end of the beam to the middle of the span in an increasing trend. The third type of bridge cracks is mainly distributed in the web, roof, and flange plate. These cracks include longitudinal, vertical, and oblique cracks. Of these, the top plate and flange plate mainly have longitudinal cracks, while the web plate mostly has inclined cracks. The fourth type of bridge cracks is mainly distributed in the top plate, bottom plate, web and flange plate. The top plate, bottom plate and flange plate have longitudinal cracks, while the web has longitudinal cracks and oblique cracks.
The beam cracks mainly appear at the midspan, and the length of the cracks along the longitudinal position (near the end, one-fourth, one-third, and the midspan) typically measures around 1.5 m; in addition, a small number of cracks are longer than 2 m and concentrated in the area from one-third to the midspan. From the perspective of crack width, cracks larger than 0.2 mm are mainly concentrated in the area from one-fourth span to approximately middle span position. Therefore, this research focused on the areas around these three positions. According to the results of the crack field investigation, a cracked beam section was selected as the research object (as shown in Figure 5), where represents the degree of concrete withdrawal from the work in the tension area; is the degree of cracking, i.e., the crack width; is the crack spacing, which represents the number of cracks in the curved section beam; and represents the range of crack distribution and is related to the position of the external load form.
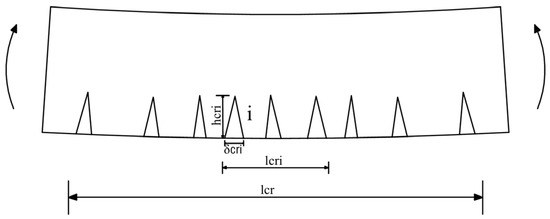
Figure 5.
Schematic diagram of cracks in beam bending section.
Zhao Yu [24] pointed out that the statistical parameters of the cracks in the section are as follows: the average height of the cracks is , the average statistical spacing of the cracks is , the total width of the cracks is , etc.
According to the bridge appearance survey, the cracks with similar length and width were merged to form an overall gradient beam model (see Figure 6). Specifically, the cracks with similar heights in the crack section (the difference between the crack heights should be less than one-tenth of the beam height) were merged, the section of the cracked section was reduced, and the reduction was compensated by the dead weight.

Figure 6.
Overall gradient beam model.
Then, as shown in Figure 6, a mechanical analysis of the structure was carried out to solve the internal force distribution of the structure with cracks. At this point, the nominal tensile stress (strain) of the concrete on the tensile side can be expressed as:
By making the tensile stress of the concrete at the lower edge of the section equal to the nominal tensile stress, the stress state of the reinforcement of the concrete in the tensile zone can be obtained based on statistics and detection; the stress balance relation of the crack section can be established on this basis, as shown in Figure 7, where is the stress at the edge of the pressure zone; is the nominal stress on the edge of the tension zone; is expressed as the ratio of the elastic modulus between the ordinary reinforcement and the concrete; and is the ratio of the elastic modulus between the prestressed reinforcement and the concrete.

Figure 7.
Stress (strain) equilibrium state of the section of the crack area.
Through the balance of the cross-sectional stress relationship, the actual compression height of the concrete, the position of the neutral axis, and the edge stress of the concrete in the compression zone can be solved numerically.
As the height of the compression zone and the bending curvature φ of the section are unknown, a trial algorithm can be used to solve the problem. When the calculated bending moment of the current round is close enough to that of the previous round, the result is considered final.
According to the calculated concrete crack model, the stiffness of the cracked concrete beam was reduced. It was assumed that the initial flexural rigidity of the box girder section is , and the flexural rigidity becomes when cracks appear. α is the reduction coefficient of the flexural stiffness:
where represents the bending moment of the section, and φ represents the bending curvature of the section.
The process used to solve the reduction coefficient α of the flexural rigidity is shown in Figure 8. Since the height of the compression zone and the bending curvature φ of the section are unknown, a known initial value and a changing value can be assumed first, making the relative error satisfy and . When the results of the last two iterations are close enough, the obtained value can be put into Formula (4) to find α. In order to avoid the interaction of multiple factors, the single control variable method was used in this study to obtain the average stiffness damage degree of the three sections and to reduce the stiffness of the solid elements in the finite element model in this area, so as to simulate the bridge crack damage. It can be seen from the trial calculation that the reduction coefficient of the flexural stiffness α is 0.76.
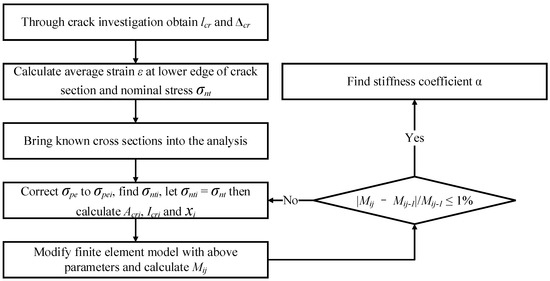
Figure 8.
Process of solving the reduction coefficient α of flexural stiffness.
3. Numerical Algorithms of Vehicle-Bridge Coupling
The vehicle and bridge models were established by assuming that the wheel and bridge deck maintain favorable contact and that there would be no temporary separation due to turbulence vibration during the driving process. Using the displacement coordination at the contact point and the mechanical equation, an ANSYS model was established to achieve the vehicle-bridge coupling simulation algorithm.
The bridge model built in this study adopted the linkage and solid element model. For the existing bridge after cracking, its dynamic equation can be expressed as
where , , and represent, respectively, the structural unit mass matrix, the modified damping matrix, and the modified stiffness matrix of the bridge; , , and represent, respectively, the acceleration vector, velocity vector, and displacement vector of the bridge structural unit nodes; and represents external force. The vehicle is modeled using the spring–damp–mass model, and the equation of motion can be expressed as
where M is the vehicle body mass matrix; K is the stiffness matrix of the car body; C is the damping matrix of the car body; G is the gravity load vector; and is the instantaneous coupling load between the tire and the ground contact point.
To solve iteratively the coupled vibration equations of the beam arch VBI system, the detailed processes are summarized as follows.
- Step 1:
- determine the working conditions to be analyzed and build the finite element model of the bridge.
- Step 2:
- input the relevant calculation parameters according to the working condition and generate vehicle file, track irregularity file and coupling analysis macro command file.
- Step 3:
- engage ANSYS transient dynamic analysis and obtain the coordinates of the contact points between each wheel and the bridge, node displacement D(n,ti), node velocity V(n,ti), and node acceleration A(n,ti) of node n at time ti.
- Step 4:
- calculate the interaction force between vehicle and bridge at corresponding time based on the displacement coordination condition.
- Step 5:
- Check whether all vehicles are off the bridge or not. If so, proceed to the next step. If not, set i = i + 1 and repeat from Step 3.
- Step 6:
- Read the RST result file and export the results. Then check if all working conditions finished and repeat from Step 2 when negative. The analysis process is shown in Figure 9.
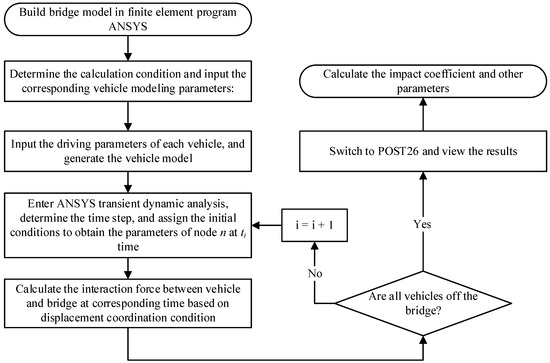 Figure 9. Process of vehicle-bridge coupling analysis.
3.1. Build the Bridge Model
This study is based on a prestressed concrete continuous rigid-frame bridge in Shaanxi Province. The length of the main bridge is 292 m, and the span combination is 76 + 140 + 76 m. The main span is a 140 m continuous prestressed concrete rigid frame with a variable section comprising a single box and a single chamber. The roof width of the box girder is 12 m, the width of the bottom plate is 6.5 m, and the length of the flange cantilever is 2.75 m. The top plate of the box girder is provided with a bidirectional 2% transverse slope, and the transverse bridge direction of the bottom plate is horizontal. The overall layout of the main bridge type is shown in Figure 10.
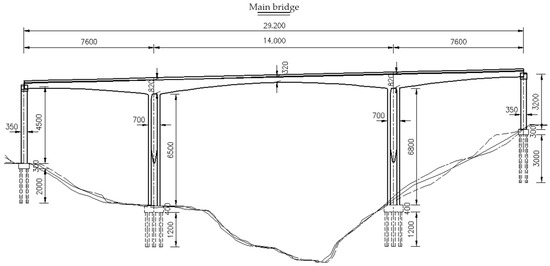
Figure 10.
General layout of the main bridge type.
In this study, a multi-scale mixed-elements model was established according to the different requirements of the modeling accuracy. Solid65 (3-D-reinforced concrete solid element) element modeling was used to simulate the cracking, crushing, and stress release state of the concrete. In addition, beam44 (3-D elastic tapered asymmetric beam element) and link8 (3-D rod or truss element) were used to simulate other components. Considering that the in-service bridge could no longer meet the linear stress characteristics, nonlinear analysis was required. The constitutive relation of the concrete adopted the “miso” model, and the constitutive relation of the steel bar adopted the “biso” model. The FE model is shown in Figure 11.
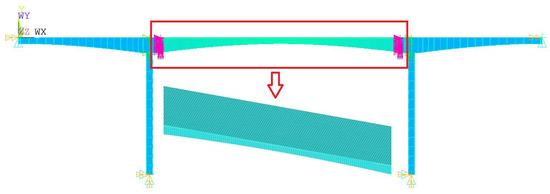
Figure 11.
Multivariate hybrid finite element model.
3.2. Establishment of Vehicle Model
Through the image analysis of the surveillance video of the continuous traffic flow in a section of Shaanxi Province over a period of 24 h, the frequency of each vehicle on the highway was obtained. The types of vehicles that travel on the highway bridges in this area are mainly dual-axle vehicles. Therefore, in the analysis of the vehicle-bridge coupling vibration, spatial dual-axle (car) and spatial dual-axle (bus) were selected as the research objects, as shown in Figure 12. The higher the number of vehicle dimensions and degrees of freedom, the higher the accuracy of the vehicle model and the more realistic the vibration process [25,26]. According to Section 1, The research on the stiffness matrices of various vehicle models is very extensive; therefore, it is not necessary to go into detail here.
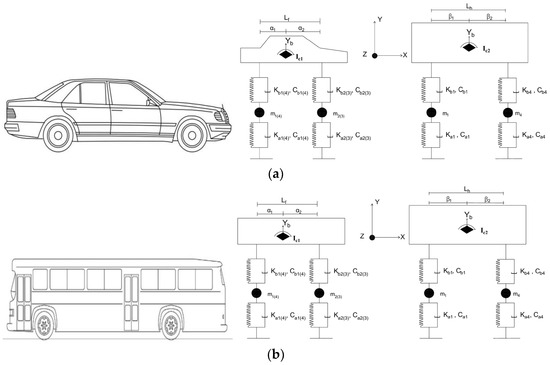
Figure 12.
Schematic diagram of the bus. (a) The longitudinal and transverse mechanics of the car. (b) The longitudinal and transverse mechanics of the bus.
3.3. Bridge Deck Roughness Simulation
At present, the roughness data of a bridge (bridge deck) are usually obtained via field measurement or numerical simulation. The application cost of the measured data is high, while the numerical simulation method is lower in cost and may be more efficient. Based on the inverse Fourier transform method, the numerical calculation model of the road surface (bridge deck) smoothness sequence generated in this study is shown in Formulas (7) and (8).
In accordance with the ISO standard [27], MATLAB was used to simulate and generate the first three levels of the pavement smoothness sequence obtained via Fourier inversion, as shown in Figure 13.
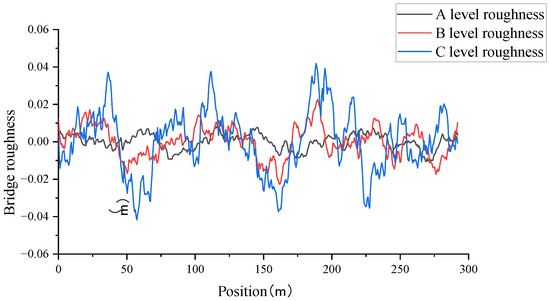
Figure 13.
Roughness sequence of three levels of pavement (bridge deck).
In the investigation of continuous rigid-frame bridges in Shaanxi Province, it was found that most of the highway pavement grades had reached Class B; therefore, the road roughness examined in this study is mainly Class B.
4. Results of Vehicle-Bridge Coupling Analysis
4.1. Impact Analysis of Vehicle Parameters
4.1.1. Influence of Different Vehicle Speeds
In the study of speed parameters, the 35 t spatial dual-axis vehicle model was adopted, and the analyzed speeds were 60 km/h, 80 km/h, 90 km/h, 100 km/h, and 120 km/h. The stiffness reduction coefficients were 1 (undamaged) and 0.76 (damaged), with a total of 10 working conditions. According to the discussion in Section 2, crack damage is realized by stiffness reduction. The positions of stiffness reduction are mid-span, one-third, and one-fourth of the middle span. When analyzing these conditions, the stiffness of the beam segment at the corresponding positions in the numerical model is multiplied by the stiffness reduction factor.
Through the analysis of the dynamic response of the bridge under different vehicle speeds, the stress peak value of the concrete at the lower edge of the cross-section was extracted, and the change rule is shown in Figure 14 and Figure 15.
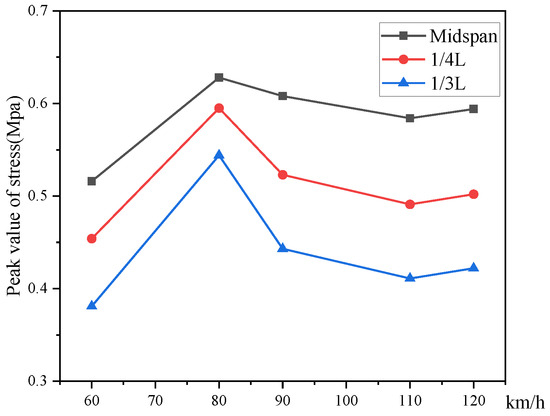
Figure 14.
Stress peaks of different sections of undamaged bridges at different speeds.
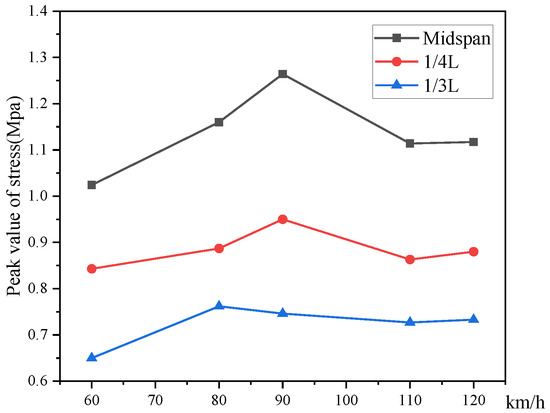
Figure 15.
Stress peaks of different sections of damaged bridges at different speeds.
By comparing the stress values of the damaged bridges and undamaged bridges, it can be seen that the vehicle-bridge coupling vibration response of each section changes greatly after the bridge is damaged. Taking the maximum stress peak values of 80 km/h and 90 km/h as examples, the midspan stress increases by 84.71% and 107.89%, respectively. The stress of the one-fourth section of the midspan increases by 49.07% and 81.64%, respectively. The stress of the one-third section of the middle span increases by 40.07% and 68.39%, respectively. From the above data, it can be seen that the vehicle-bridge coupling vibration response of the damaged bridge is more significant. From Figure 14, the stress at the speed of 80 km/h is significantly greater than that of the other three speed conditions for any of the sections. Therefore, when the bridge is undamaged, the bridge response under vehicle-bridge coupling vibration is sensitive to the speed of 80 km/h. As can be seen in Figure 15, the peak value of the vehicle-bridge coupling vibration response is the highest when the vehicle speed is 90 km/h at the midspan and one-fourth section positions. However, at the one-third section of the midspan, the structural response is greater than that at the other speeds when the vehicle speed is 80 km/h, and the peak stress value is 2.14% larger than that at the 90 km/h speed. This indicates that although the dynamic response of the bridge at the one-third section of the midspan is the largest when the vehicle speed is 80 km/h, the dynamic response is also obvious at the 90 km/h speed.
Taking the damaged bridge as the research object, the reduction coefficient is 0.76, and the other vehicle parameters remain unchanged. According to the above research on the relationship between the vehicle parameters and the damaged bridge, the vehicle speeds in this section are still 60 km/h, 80 km/h, 90 km/h, 100 km /h, and 120 km/h. The vehicle weight is 35 t, and the vehicle type is the spatial dual-axis model; the road roughness grade remains Class B, and the dynamic response of different vehicle speeds to the bridge is studied. Figure 16 and Figure 17 show the variation diagrams of the peak displacement law and the impact coefficient.
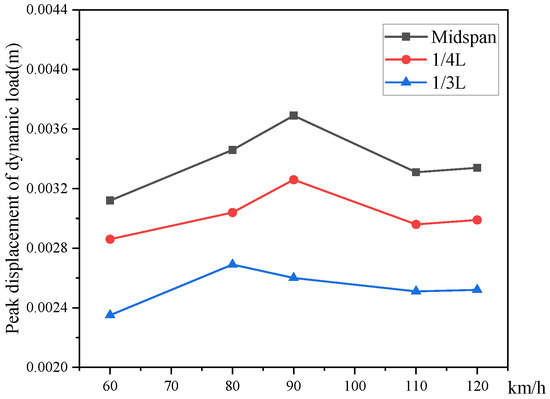
Figure 16.
Peak displacement of each section at different vehicle speeds.
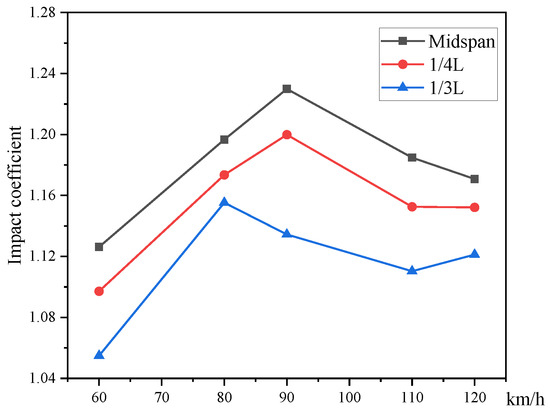
Figure 17.
Dynamic amplification factor of each section at different vehicle speeds.
As shown in Figure 16, the dynamic response of each section of the middle span to the speed is different. For the damaged bridge, the fluctuation of the displacement curve of each section corresponds to the peak stress, reflecting the law that the peak displacement and peak stress increase and decrease at the same time. In combination with the vehicle speed, the peak displacement of both the midspan section and the midspan one-fourth section reaches its maximum when the vehicle speed is 90 km/h. At the one-third cross-section of the middle span, the displacement reaches the maximum when the speed is 80 km/h. However, when the speed is from 80 km/h to 90 km/h, the displacement change rate at the cross-section is −3.46%, and the displacement peak does not change much. These data also show the correlation between the peak displacement and the peak stress.
As shown in Figure 17, when the vehicle speed reaches 90 km/h, the impact coefficient at the one-fourth section of the midspan and the midspan is the largest. When the vehicle speed reaches 80 km/h, the impact coefficient at the one-third section of the midspan is the largest. When the speed is 60 km/h, the impact coefficient of each section is the smallest. According to the change in the peak displacement and impact coefficient, the bridge is more sensitive to the speed of 90 km/h when the damage occurs.
4.1.2. Influence of Different Vehicle Weights
With the continuous development of the highway traffic industry, the phenomena of heavy loads and excessive loads are becoming more and more frequent. The above situation will cause the static load stress of the bridge to become very large over a period of time; furthermore, it will make the damage caused by the dynamic load on the bridge more serious. Therefore, this section chooses six working conditions to study the dynamic response of the bridge. The vehicle weights are 35 t, 45 t, and 55 t, respectively. The stiffness reduction coefficients are 1 and 0.76, respectively.
Through the analysis of different vehicle weight conditions, the stress peak values of the lower edge of the concrete section at the midspan, the one-fourth section of the middle span, and the one-third section of the middle span were obtained, and the change rule is shown in Figure 18.
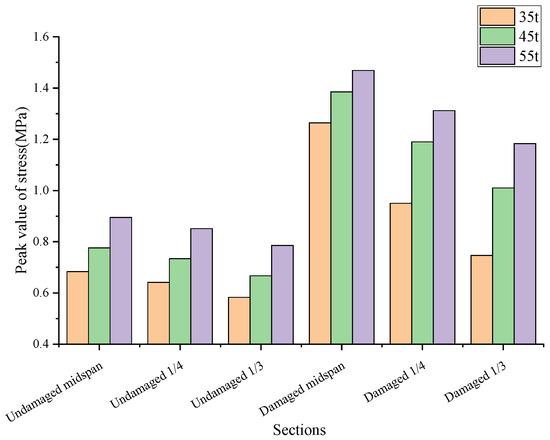
Figure 18.
Stress peak values of each section under different vehicle weights.
It can be seen from Figure 18 that the peak stresses of each section of the damaged bridge under different vehicle weight conditions have obvious changes. When the vehicle weight increases from 35 t to 55 t, the increase rate of the peak stress of the middle section of the middle span is 16.21%, that of the one-fourth section of the middle span is 38.11%, and that of the one-third section of the middle span is 58.58%. Although the dynamic response of the midspan section is the largest, the one-third section has the fastest stress increase rate.
For the undamaged bridges, with the increase in vehicle weight the stress change of each section is similar to that of the damaged bridges. Under different vehicle weights, the stress at the midspan position is the largest, followed by the one-fourth section, and the one-third section is the smallest. When the vehicle weight increases from 35 t to 55 t, the stress increase rate of the middle span section is 31.03%, the stress increase rate of the one-fourth section is 32.76%, and the stress increase rate of the one-third section is 34.65%. It can be seen that the vehicle weight parameter has a significant effect on the dynamic response of the bridge under the vehicle-bridge coupling vibration, and the impact on the dynamic response of the damaged bridge is more significant.
The variation laws of the peak value and impact coefficient of the displacement at the one-fourth section and one-third section are shown in Figure 19 and Figure 20. It can be seen that with the increase in vehicle weight, the displacement of each section also increases significantly. Among them, the increase is more obvious in the midspan position. When the vehicle weight increases from 35 t to 55 t, the peak increase rate of the midspan displacement is 22.49%. Figure 20 shows that the displacement impact coefficient of each section of the damaged bridge is different under the condition of vehicle weight, and the impact coefficient keeps increasing with the increase in vehicle weight. The increase in vehicle weight occurs at the same rate, but the impact coefficient increases in a nonlinear way. When the vehicle weight increases from 35 t to 55 t, the midspan impact coefficient increases by about 16.24%. The impact coefficient at the position of the one-fourth section increases by about 13.15%, and the impact coefficient at the position of the one-third section increases by about 11.10%. Although the increase in vehicle weight did not result in a large increment in the impact coefficient, the impact coefficient only reflected the ratio relationship between the dynamic response and the static response. The increase in the dynamic response of each section can indicate that the increase in vehicle weight has a significant impact on the dynamic response of the bridge.
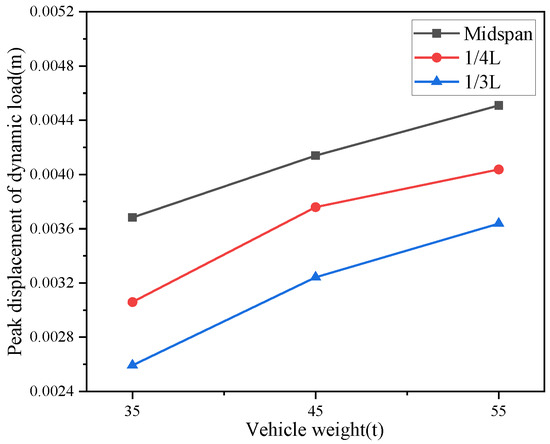
Figure 19.
Peak displacement of each section under different vehicle weights.
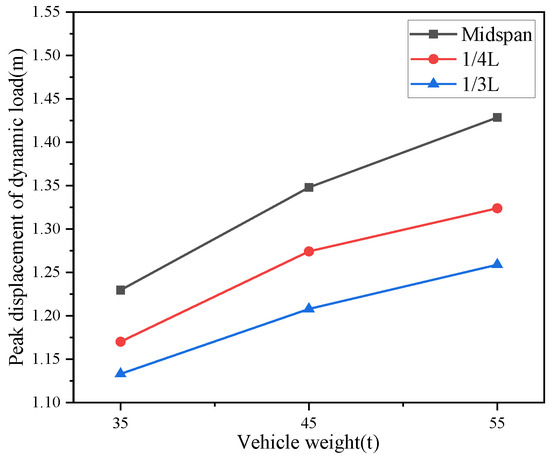
Figure 20.
Impact coefficient of each section under different vehicle weights.
4.2. Impact Analysis of Damage Parameters
Based on the research above on the dynamic response of different vehicle parameters to the damaged bridge, this section studies the dynamic response of the vehicle-bridge coupling vibration to the bridge with sustained damage. The vehicle speed is 90 km/h, the vehicle weight is 35 t, and the vehicle is a spatial dual-axle model. As the bridge continues to serve after damage, the stiffness of the bridge itself will decrease with the passage of time. Assuming that the stiffness reduction coefficient starts at 0.76, six working conditions are considered: 0.76, 0.7, 0.65, 0.6, 0.55, and 0.5.
According to Figure 21, it is obvious that with the continuous damage to the bridge, the stress of each section continues to increase. The stress growth trend is different at different cross-section locations. For the midspan position, the stiffness reduction coefficient is from 0.76 to 0.5, and the change in stress value shows obvious fluctuation. When the reduction coefficient is from 0.76 to 0.7, the stress changes faster, and the growth rate is 12.5%. In the range of 0.7–0.65, the stress changes slowly, and the growth rate is 1.78%. In the range of 0.65–0.6, the stress growth rate is 7.02%, which is faster than the stiffness decay in the second stage. When the reduction coefficient is in the range from 0.6 to 0.5, the curve of the stress change is almost linear, and the average stress growth rate is 8.83%. It can be inferred that with the continuous damage to the bridge, the stress increase rate will be larger and larger. If the stress in the span continues to increase until the tensile strength is reached or even exceeded, the concrete will be damaged. For the position of the one-fourth section of the middle span, the stress value fluctuates to a certain extent. In the range of the stiffness reduction coefficient from 0.76 to 0.5, the slope of each straight line changes as follows: k0.6–0.55 > k0.76–0.6 > k0.55–0.5. It can be seen from the slope that the stress increases slowly and linearly in the range of 0.76 to 0.60. In the range of 0.60 to 0.55, the stress increases rapidly; from 0.55 to 0.50, the rate slows down again. As the damage continues, the growth rate of the stress at the position of the one-fourth section first increases and then decreases for the damaged concrete. For the position of the one-third section of the middle span, the stress growth rate does not change rapidly in the range of 0.76 to 0.6 and always maintains a gentle rate of increase. In the range of 0.6 to 0.55, the stress growth rate has a large change and becomes smaller again after 0.55 to 0.5. It can be inferred that the stress growth rate will increase up to failure at the position of the one-third section as the stiffness continuously attenuates.
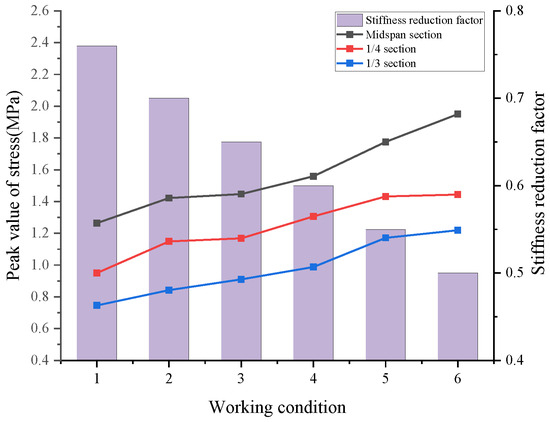
Figure 21.
Stress of each section under different damage degrees.
The results of the dynamic displacement peak value and impact coefficient also show similar rules. As can be seen from Figure 22, in the process of the continuous damage to the bridge, the displacement of each section is increasing, and the displacement increment of the midspan section is the largest. When the stiffness reduction coefficient reaches 0.6, the displacement increases almost linearly. When the stiffness of the one-fourth section reaches 0.6, the displacement growth fluctuates a little. The displacement change is gentler than that in the previous stage when the reduction coefficient is 0.55 to 0.5. When the reduction coefficient is in the range from 0.76 to 0.5, the displacement is relatively gentle at the one-third section compared with the other two places. When the damage coefficient decreases from 1 to 0.76, the displacement of each section increases rapidly, with an increase of 86.36% in the midspan, 114.08% in the one-fourth section, and 192.13% in the one-third section. When the reduction coefficient increases from 0 to 0.5, the displacement growth rate of the midspan section is 335.86%, that of the one-fourth section is 316.9%, and that of the one-third section is 452.8%. It can be seen from these data that with the continuous damage to the bridge, the displacement of each section will continue to increase and that the growth trend is the fastest in the midspan.
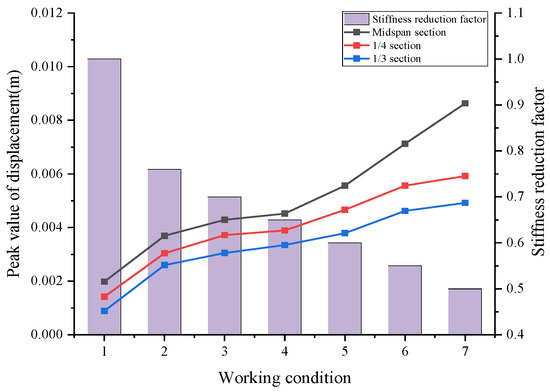
Figure 22.
Peak displacement of each section under different damage degrees.
As can be seen from Figure 23, the impact coefficient of the bridge also changes greatly, and the impact coefficient at the midspan increases the fastest. By comparing the change curves of the impact coefficients at the three cross-section locations, the approximate slope of each reduction coefficient curve is ordered as follows: k0.65–0.5 > k0.76–0.7 > k0.7–0.65. When the reduction coefficient of stiffness reaches 0.65, the growth trend of the impact coefficient of each cross-section increases significantly compared to that before 0.65, and the three curves are almost linearly distributed. However, before the reduction coefficient reaches 0.65, the impact coefficient curves of each section fluctuate to a certain extent. Therefore, the impact coefficient obviously increases after the damage occurs.
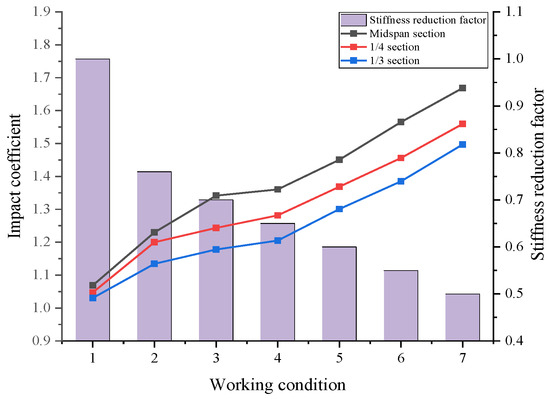
Figure 23.
Impact coefficient of each section under different damage degrees.
In summary, when the stiffness reduction coefficient is in the range of 0.65 to 0.6, the stress growth rate of each section does not change much. In other ranges, the stress growth rate of the different sections is different. According to the stress growth mode shown in the figure, the stress on the lower edge of the concrete in the midspan section will first reach the tensile strength and crack, followed by the one-fourth section and, finally, the one-third section. With the continuous damage to the bridge, the displacement and impact coefficient of each section will have an increasing trend, with the fastest growth in the midspan. Therefore, when these two indexes of the bridge structure increase significantly, it indicates that the structural stiffness is decaying, and certain reinforcement measures should be taken at this time.
5. Conclusions and Prospect
This study investigated the dynamic response of an in-service continuous rigid-frame bridge under vehicle load based on the crack damage report, the finite element software ANSYS 17.0, and custom software. The main findings and conclusions are as follows:
- (1)
- The crack damage of continuous rigid-frame bridges in Shaanxi Province was investigated, and it was found that the positive cracks of the structure floor were mostly concentrated in the midspan, the one-fourth section, and the one-third section of the middle span. The characteristic parameters and damage model of the cracks were established, and the simplified crack zone unit was obtained. The stress state of the crack element area was analyzed using a numerical method, and the total bending moment of the section and the resultant force of the reinforcement were solved. The process was iterated until convergence was achieved, and the resulting coefficient of the sectional flexural rigidity reduction for the cracked area was obtained. Based on this parameter, the in-service damage to the bridge was simulated.
- (2)
- The investigation of traffic flow and vehicle types on highway bridges concluded that the largest proportion of the highway traffic consisted of dual-axle vehicles; therefore, the dual-axle vehicle model was adopted in this study. According to the analysis of different vehicle parameters, the results showed that under different speed conditions, the undamaged bridge was more sensitive to the speed of 80 km/h, and the damaged bridge was more sensitive to the speed of 90 km/h at the midspan and one-fourth span sections. For the one-third section, the sensitive speed of the damaged bridge was still 80 km/h, but the difference between the stress peak and the value at 90 km/h was very small. Therefore, it is generally recommended to focus on a speed limit of 90 km/h for damaged bridges.
- (3)
- In the investigation of the dynamic responses under different vehicle masses, the results showed that the dynamic response was obvious for the damaged bridge and that the increase in the concrete stress at the lower edge of each section was prominent. Therefore, it is recommended to strengthen the middle span of the bridge in the crack disaster area in time to prevent further cracking.
- (4)
- The results of the analysis of the dynamic displacement and impact coefficients of the bridge showed that the dynamic response of vehicle mass to bridge structure was more obvious. With the increase in vehicle mass, the displacement response and impact coefficient response of each section continued to increase. With the continuous damage to the structure, the dynamic response and impact coefficient of each section continued to increase, and the growth rate of the impact coefficient increased. This indicates that the dynamic performance of the in-service bridge will continue to decline with the aggravation of the damage. Therefore, the influence of vehicle-bridge coupling should be emphasized in the maintenance of the in-service bridge.
In this study, only the factors of speed, vehicle weight, and damage degree were considered. In the subsequent research, more factors can be introduced for analysis, and the superposition of multiple factors can also be considered. In addition, this study investigated the dynamic response of damaged bridges based on single-vehicle crossing conditions; thus, the influence of multi-vehicle conditions and random traffic flow can be considered in the future.
Author Contributions
Conceptualization, L.W.; methodology, L.W.; software, Y.L. and C.J.; validation, L.W., Y.L. and H.S.; formal analysis, Y.L.; investigation, C.J.; resources, L.W.; writing—original draft preparation, Y.L. and C.J.; writing—review and editing, Y.L.; visualization, H.S.; supervision, L.W.; project administration, L.W.; funding acquisition, L.W. All authors have read and agreed to the published version of the manuscript.
Funding
This research was funded by National Key Research and Development Program of China (Grant No. 2021YFB1600305); the Natural Science Basic Research Program of Shaanxi (Program No. 2022JC-23); and Shaanxi Provincial Natural Science Foundation 2020JM-230.
Institutional Review Board Statement
Not applicable.
Informed Consent Statement
Not applicable.
Data Availability Statement
The original contributions presented in this study are included in the article. Further inquiries can be directed to the corresponding author.
Conflicts of Interest
Author Cong Jiang was employed by the company Hubei Provincial Expressway Industrial Development Co., Ltd. The remaining authors declare that the research was conducted in the absence of any commercial or financial relationships that could be construed as a potential conflict of interest.
References
- Wang, D.; Tong, L.; Wang, R.; Sun, Z. Review on Advances in Seismic Research of Large-Span Prestressed-Concrete Continuous Rigid-Frame Bridges. J. Southwest Jiaotong Univ. 2023, 58, 511–526. [Google Scholar]
- Zhu, J.; Zhang, Y.; Chen, X. Crack propagation of concrete beams under moving vehicle loads. J. Southeast Univ. (Nat. Sci. Ed.) 2018, 48, 678–686. [Google Scholar]
- Wang, H.; Wang, L.; Zhang, Z.; He, X. Safety early warning technology of continuous rigid frame bridges based on crack width variation. J. Jilin Univ. (Eng. Sci.) 2023, 53, 1650–1657. [Google Scholar] [CrossRef]
- Li, Z.; Li, Z.; Zhang, Y.; Chen, D.; Xu, S.; Zhang, Y. Theoretical analysis and experimental study of vehicle-bridge coupled vibration for highway bridges. Arch. Appl. Mech. 2024, 94, 21–37. [Google Scholar] [CrossRef]
- Zhang, X.; Chen, E.; Li, L.; Si, C. Development of the Dynamic Response of Curved Bridge Deck Pavement under Vehicle-Bridge Interactions. Int. J. Struct. Stab. Dyn. 2022, 22, 2241003. [Google Scholar] [CrossRef]
- Peng, W.; Gao, Q.; Xu, Z. Dynamic Response Analysis of Continuous Beam Bridge Based on Vehicle-bridge Coupling Vibration. For. Eng. 2022, 38, 146–155. [Google Scholar]
- Li, X.; Zhang, Z.; Xiao, R. Parameters influence analysis of vehicle bridge coupling vibration under vehicle jumping impact. J. Appl. Mech. 2023, 1–8. Available online: https://kns.cnki.net/kcms/detail//61.1112.o3.20230227.1306.014.html (accessed on 28 February 2023).
- Lu, W.; Wang, K.; Wang, H.; Liu, Y. Dynamic Reliability of Continuous Rigid-Frame Bridges under Stochastic Moving Vehicle Loads. Shock Vib. 2020, 2020, 8811105. [Google Scholar] [CrossRef]
- Lin, P.; Hou, S.; Wang, Y. Impact Factor of Through Continuous Rigid Frame-Arch Composite Bridge for High-Speed Railway. China Railw. Sci. 2023, 44, 73–80. [Google Scholar]
- Camara, A.; Kavrakov, I.; Nguyen, K.; Morgenthal, G. Complete framework of wind-vehicle-bridge interaction with random road surfaces. J. Sound Vib. 2019, 458, 197–217. [Google Scholar] [CrossRef]
- Soheil, S.E.; Thomas, J.M.; Shamim, N.P. Simplified vehicle-bridge interaction for medium to long-span bridges subject to random traffic load. J. Civ. Struct. Health Monit. 2020, 10, 693–707. [Google Scholar]
- Liu, X.; Han, W.; Yang, Q.; Yuan, Y.; Liu, B.; Su, N. Application Research on Improving Gibbs-Poole-Stockmeyer Algorithm to Accelerate Vehicle-Bridge Coupling Vibration Analysis. China J. Highw. Transp. 2024, 1–18. Available online: http://kns.cnki.net/kcms/detail/61.1313.u.20240301.1434.003.html (accessed on 5 August 2024).
- Sandro, C.; Vanni, N.; Riccardo, M.; Fabrizio, G. Dynamics of bridges during proof load tests and determination of mass-normalized mode shapes from OMA. J. Eng. Struct. 2024, 310, 118111. [Google Scholar]
- Soheil, S.E.; Thomas, J.M.; Shamim, N.P. Bridge modal identification using acceleration measurements within moving vehicles. J. Mech. Syst. Signal Process. 2020, 141, 106733. [Google Scholar]
- Li, J.; Feng, D. A comparative study of vehicle-bridge interaction dynamics with 2D and 3D vehicle models. J. Eng. Struct. 2023, 292, 116493. [Google Scholar] [CrossRef]
- Arturo, G.; Enrique, C.; Miguel, C. Verifying the suitability of uncoupled numerical methods for solving vehicle- bridge interaction problems. Struct. Infrastruct. Eng. 2023, 19, 1407–1424. [Google Scholar]
- Wahab, M.A.; De Roeck, G.; Peeters, B. Parameterization of damage in reinforced concrete structures using model updating. J. Sound Vib. 1999, 228, 717–730. [Google Scholar] [CrossRef]
- Law, S.S.; Zhu, X.Q. Dynamic behavior of damaged concrete bridge structures under moving vehicular loads. J. Sound Vib. 2004, 26, 1279–1293. [Google Scholar] [CrossRef]
- Yin, X.; Fang, Z. Dynamic Response of Cracked Concrete Continuous Beam Bridge under Moving Vehicular Loads. Eng. Mech. 2009, 26, 174–180. [Google Scholar]
- Xie, R.; Li, M.; Xu, C. Study on the Technical Status of Old Concrete Truss-Arch Bridge based on Vehicle-Bridge Interaction. J. Adv. Civ. Eng. 2022, 2022, 9946957. [Google Scholar] [CrossRef]
- Zhou, R.; Wang, Y.; Chen, H. Analysis of vehicle-bridge coupled vibration of long-span curved truss bridge in service. J. Vib. Eng. 2022, 35, 103–112. [Google Scholar] [CrossRef]
- Wu, X.; He, P. Investigation and analysis of cracks in longitudinal cracks of continuous rigid frame bridge in Shaanxi Province. J. Henan Univ. Urban Constr. 2017, 26, 54–60. [Google Scholar] [CrossRef]
- Sobczyk, B.; Pyrzowski, Ł.; Miśkiewicz, M. Damage of a post-tensioned concrete bridge—Unwanted cracks of the girders. Eng. Fail. Anal. 2024, 160, 108178. [Google Scholar] [CrossRef]
- Zhao, Y.; He, S.; Li, C.; Ge, Y. Evaluating System of Bearing Capacity for Existing Cracked Prestressed Concrete Box Girder Based on Crack Feature. J. Tongji Univ. (Nat. Sci.) 2010, 38, 1271–1275. [Google Scholar]
- Zhou, Y.; Xue, Y.; Gao, X.; Li, R.; Wang, Y.; Zhao, Y. Research on dynamic amplification factor of highway simply supported girder bridge based on modal superposition method. J. Traffic Transp. Eng. 2023, 23, 146–155. [Google Scholar] [CrossRef]
- Feng, D.; Li, J.; Wu, G.; Zhang, J. Fast modeling and dynamic analysis method for vehicle-bridge interaction system considering road roughness. J. Southeast Univ. (Nat. Sci. Ed.) 2022, 52, 1088–1094. [Google Scholar]
- ISO 8608:2016; Mechanical Vibration—Road Surface Profiles—Reporting of Measured Data. International Organization for Standardization: Geneva, Switzerland, 2016.
Disclaimer/Publisher’s Note: The statements, opinions and data contained in all publications are solely those of the individual author(s) and contributor(s) and not of MDPI and/or the editor(s). MDPI and/or the editor(s) disclaim responsibility for any injury to people or property resulting from any ideas, methods, instructions or products referred to in the content. |
© 2024 by the authors. Licensee MDPI, Basel, Switzerland. This article is an open access article distributed under the terms and conditions of the Creative Commons Attribution (CC BY) license (https://creativecommons.org/licenses/by/4.0/).