
Effect of Grinding and Successive Sieving on the Distribution of Active Biological Compounds in the Obtained Fractions of Blackthorn Berries


 ,
,  , ,
, , 
Abstract
:1. Introduction
2. Materials and Methods
2.1. Materials
2.1.1. Plant Material
2.1.2. Chemicals
2.2. Methods
2.2.1. Grinding of Dry Plant Material
2.2.2. Sieving Plant Powder
2.2.3. Moisture Content and Water Activity
2.2.4. Hydration Properties
2.2.5. Preparation of Extracts and Analysis of the Absorption Spectrum
2.2.6. Total Phenolic Content
2.2.7. Antioxidant Activity: DPPH Test
2.2.8. Proteins by the Lowry Method
2.2.9. Carbohydrates by Dinitrosalicylic Acid (DNSA) Technique
2.2.10. Amount of Vitamin C by the Iodometric Method
2.2.11. Data Analysis
3. Results
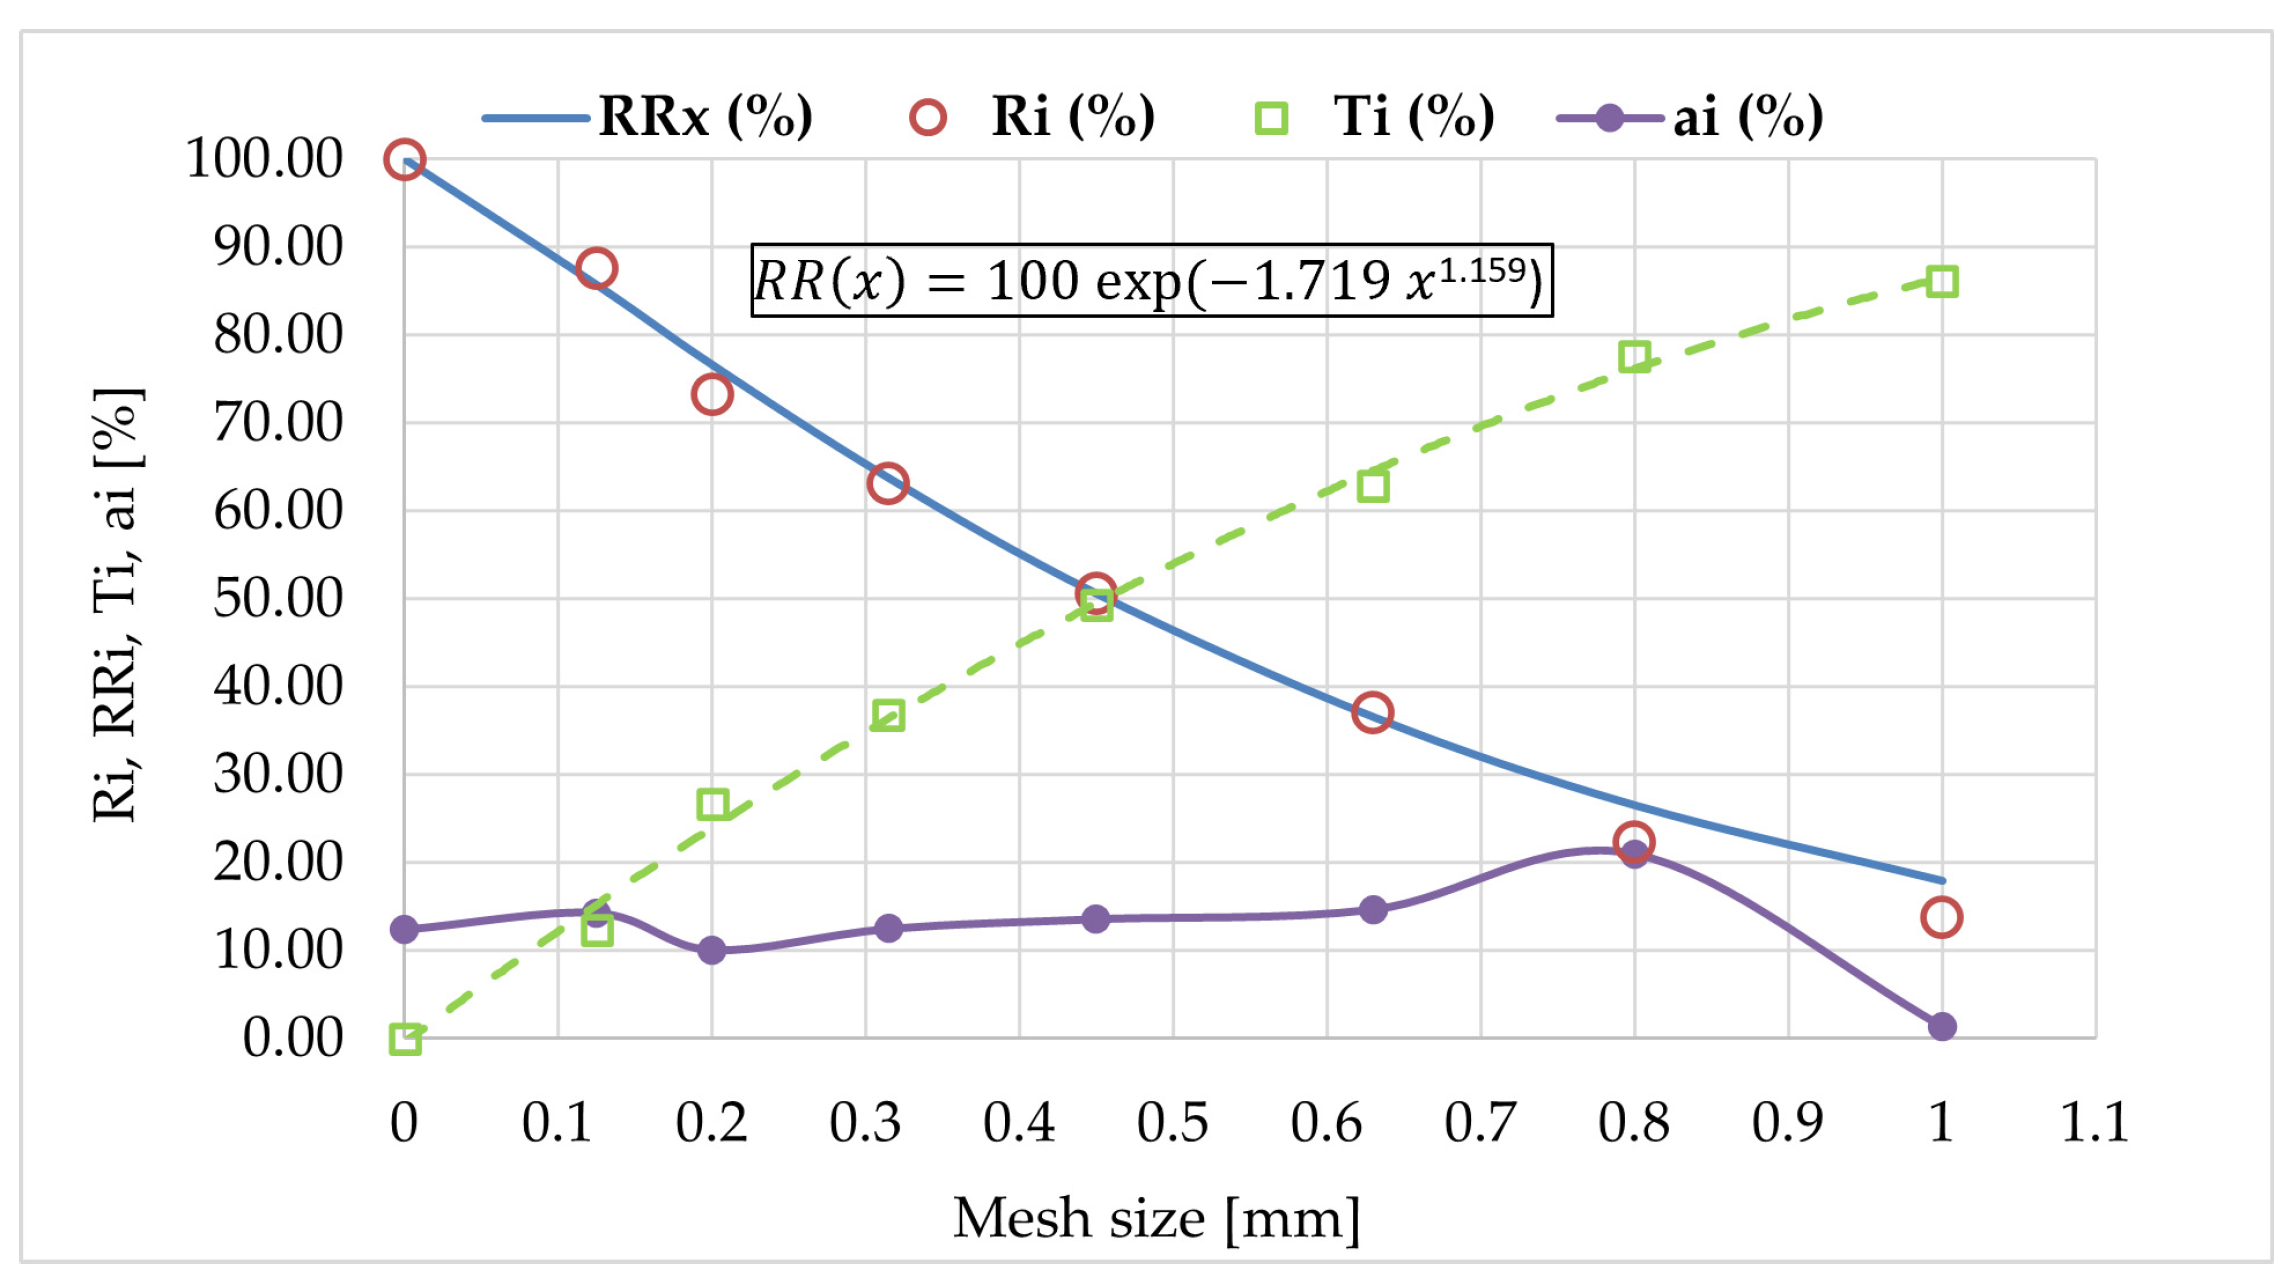
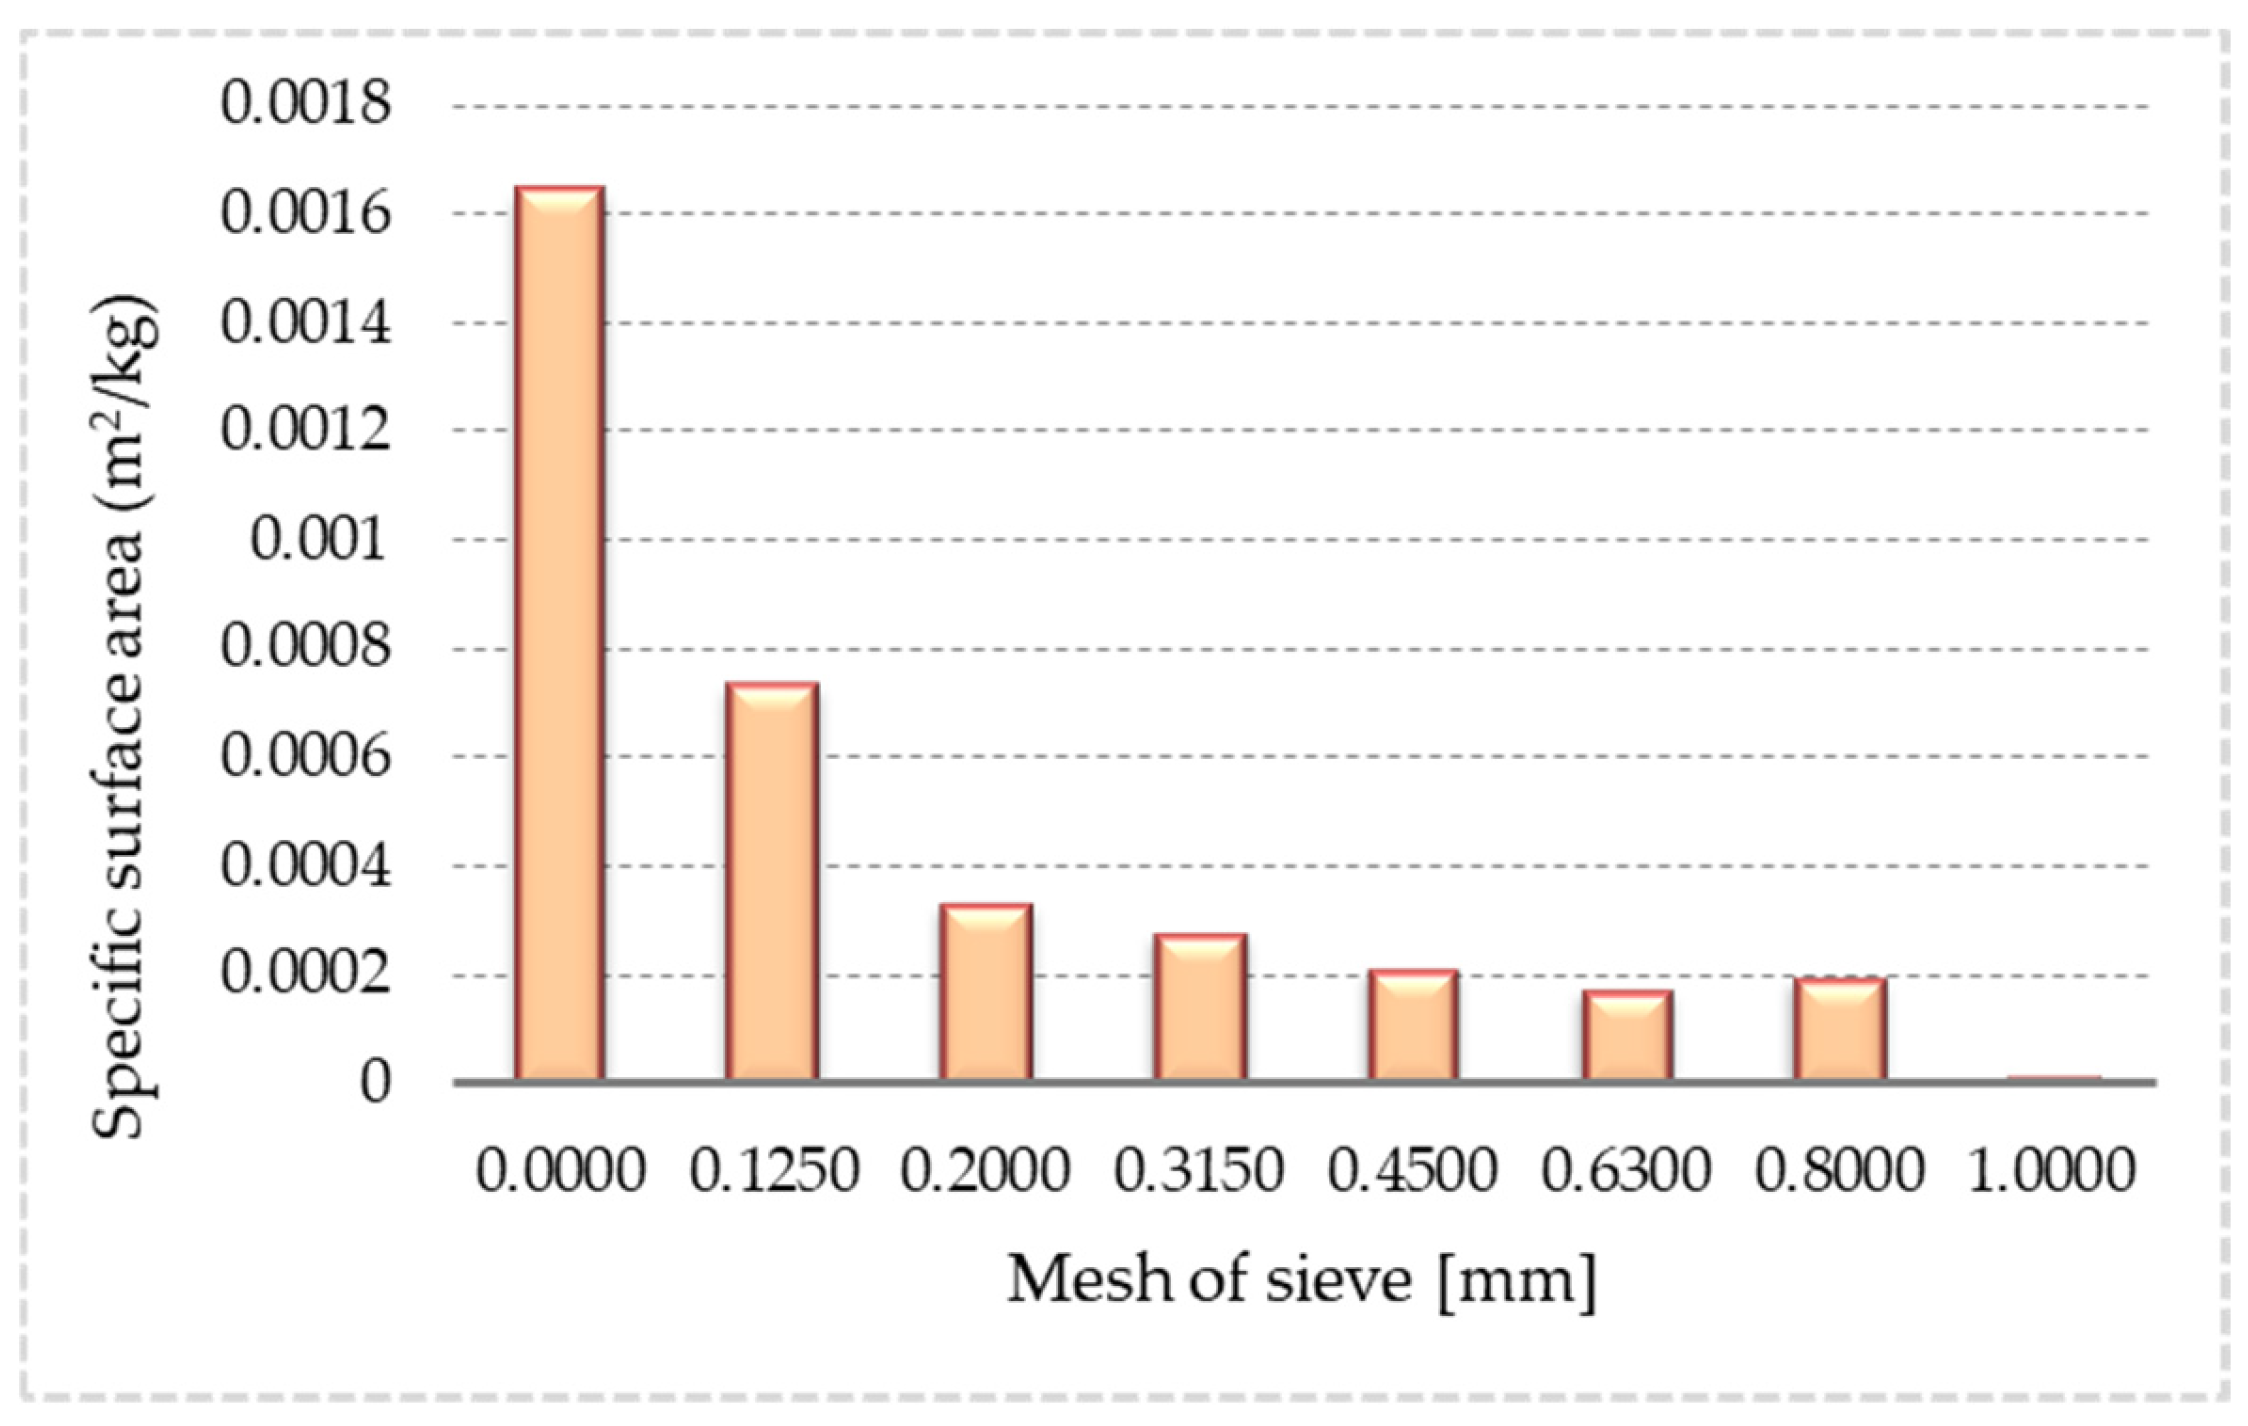
3.1. Particle Size Distribution of Samples
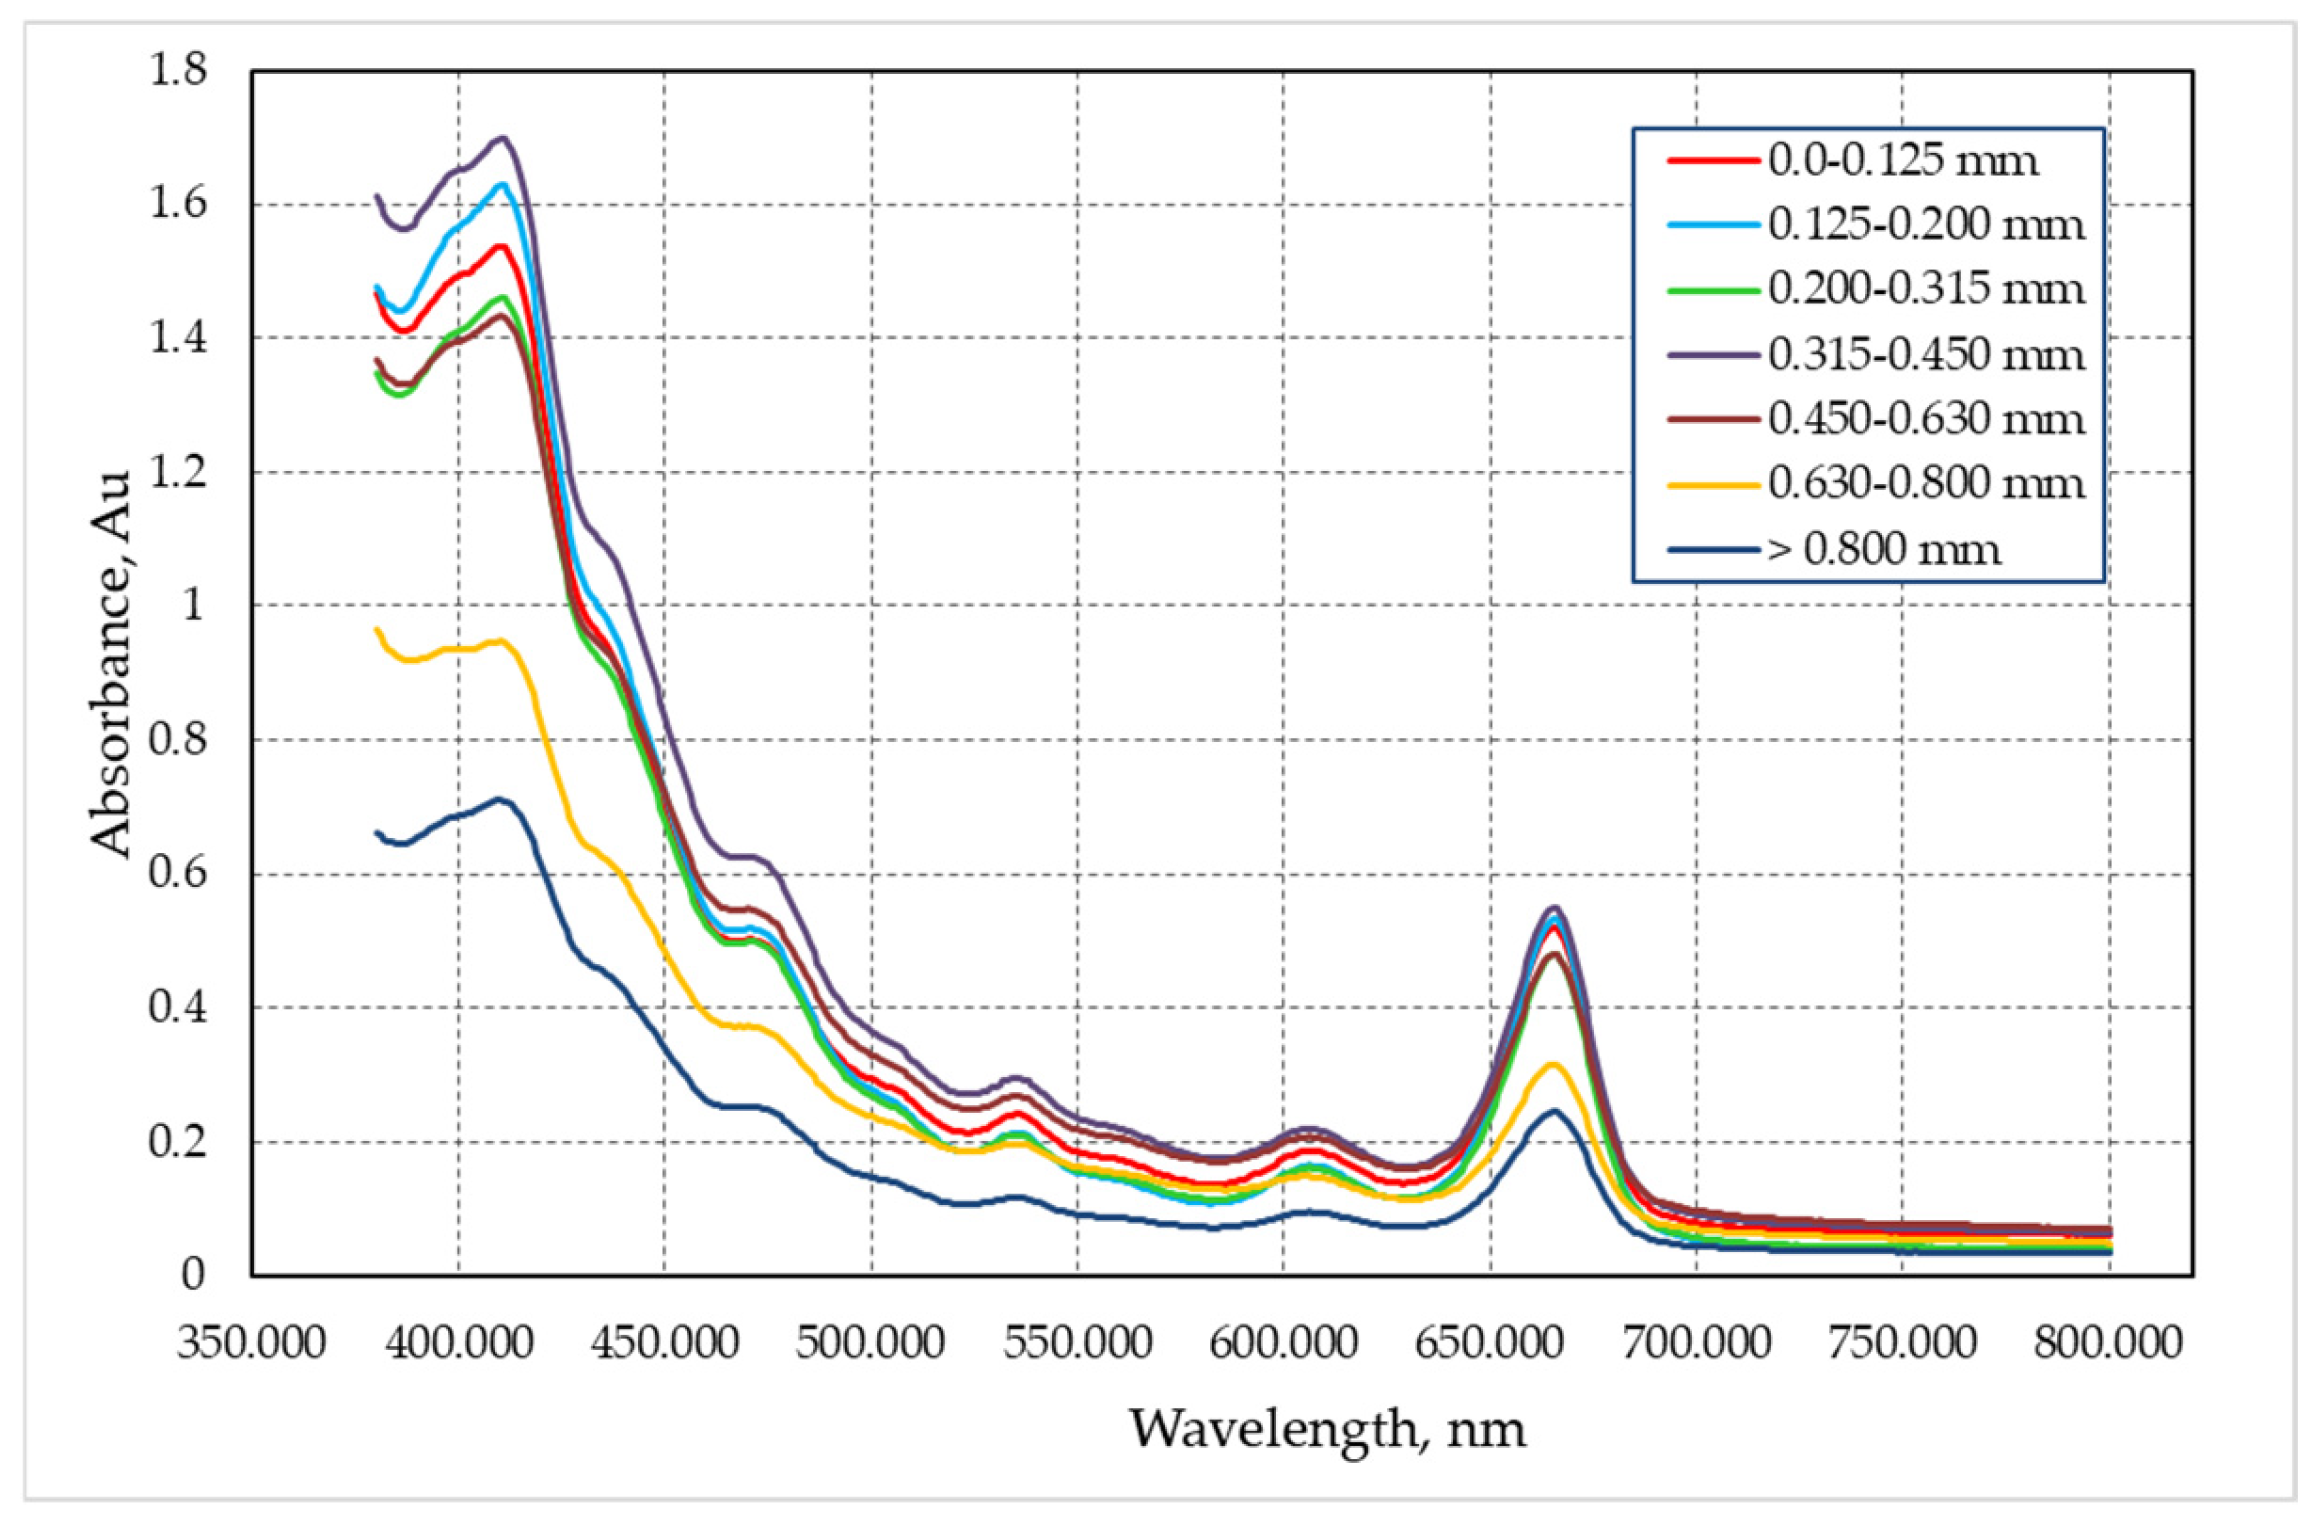
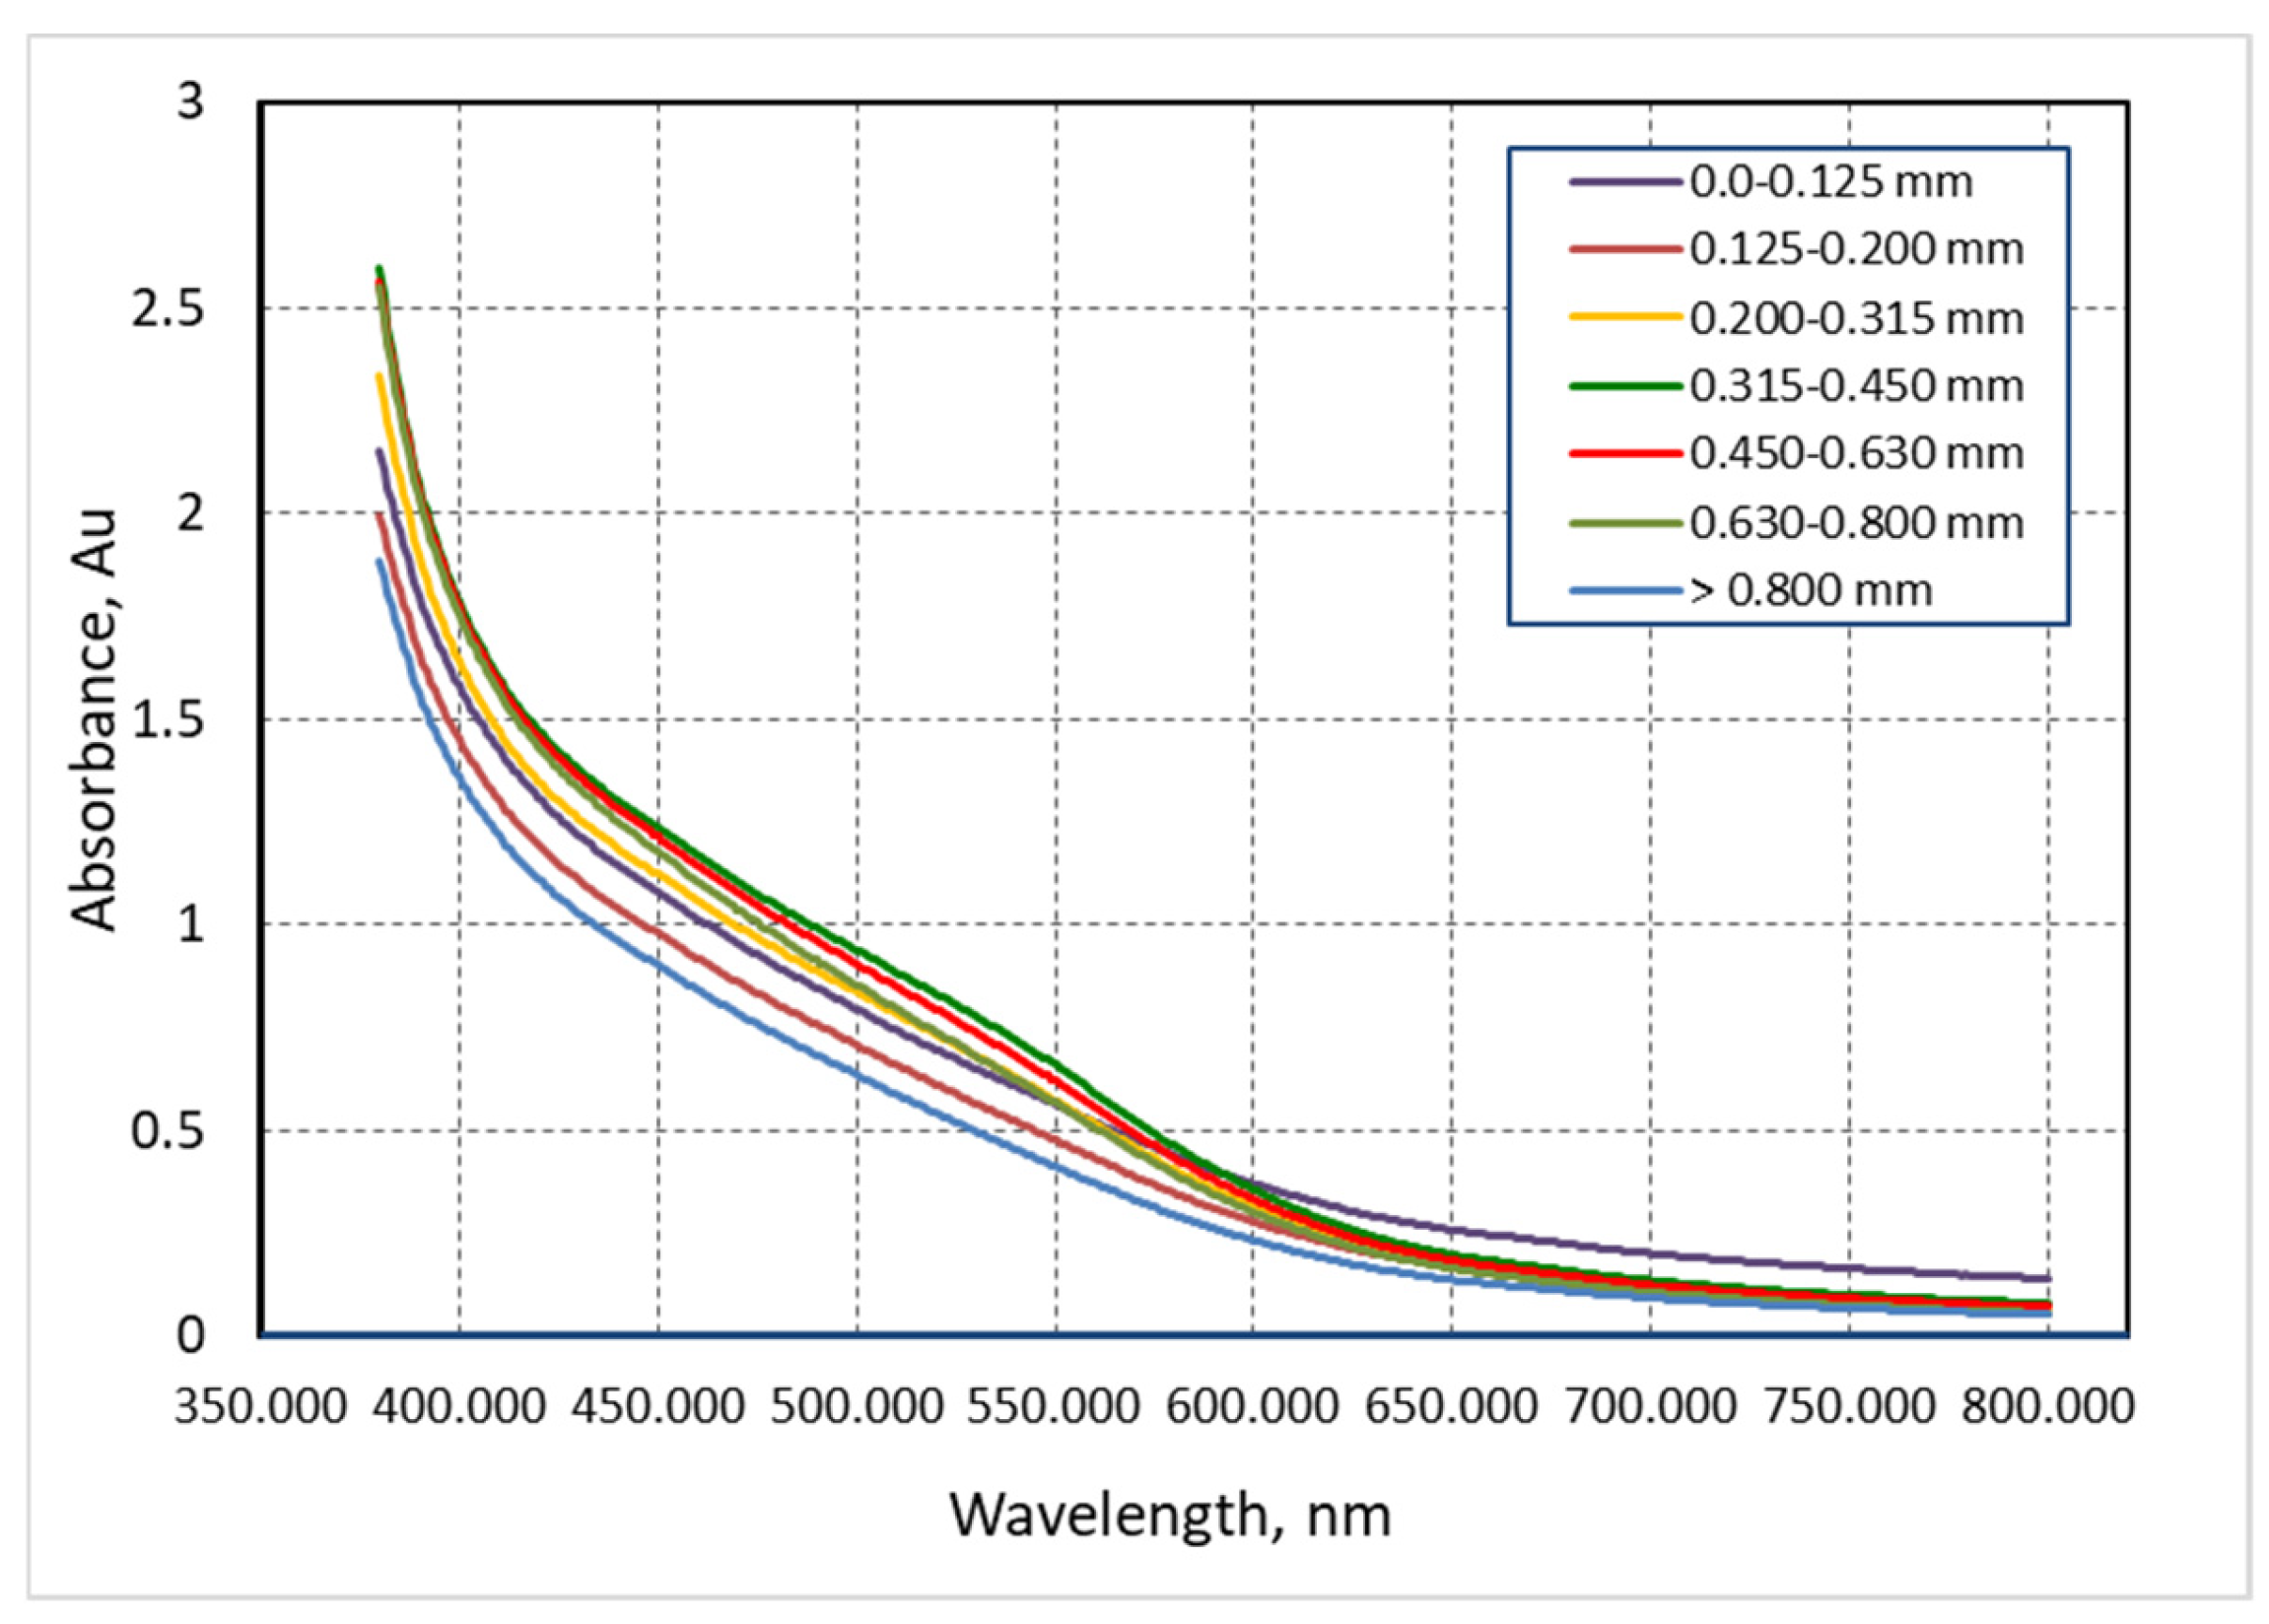
3.2. Analysis of the Absorption Spectrum of Extract
3.3. Moisture Content and Water Activity
3.4. Hydration Properties
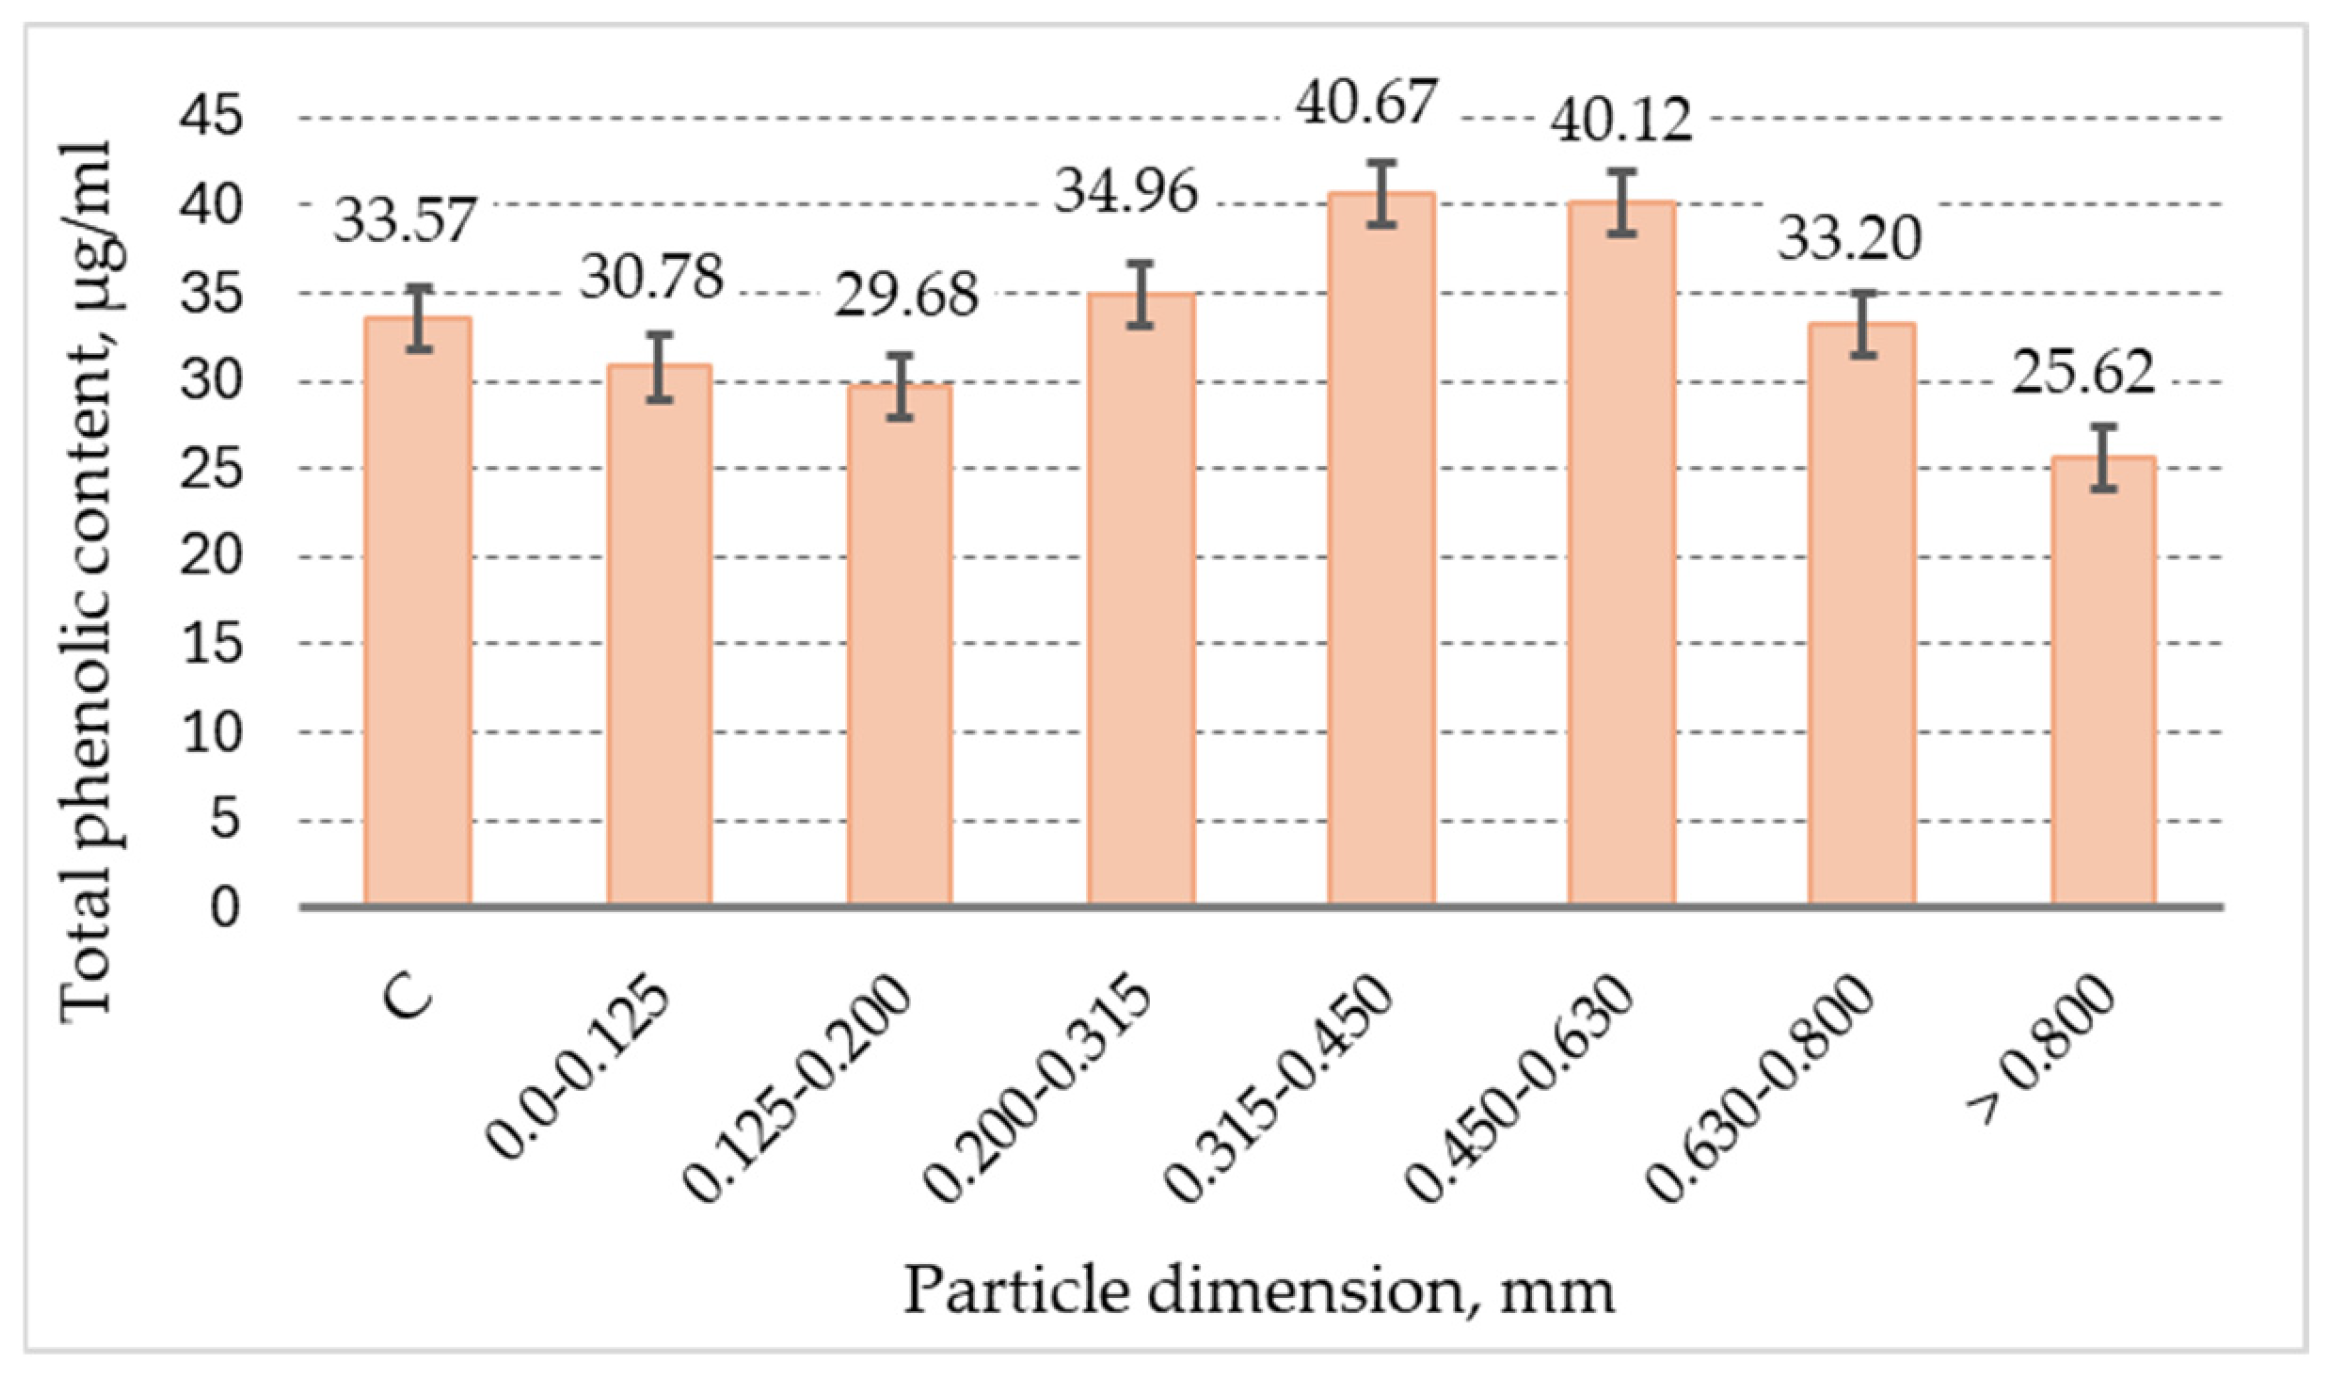
3.5. Total Phenolic Content
3.6. Antioxidant Activity
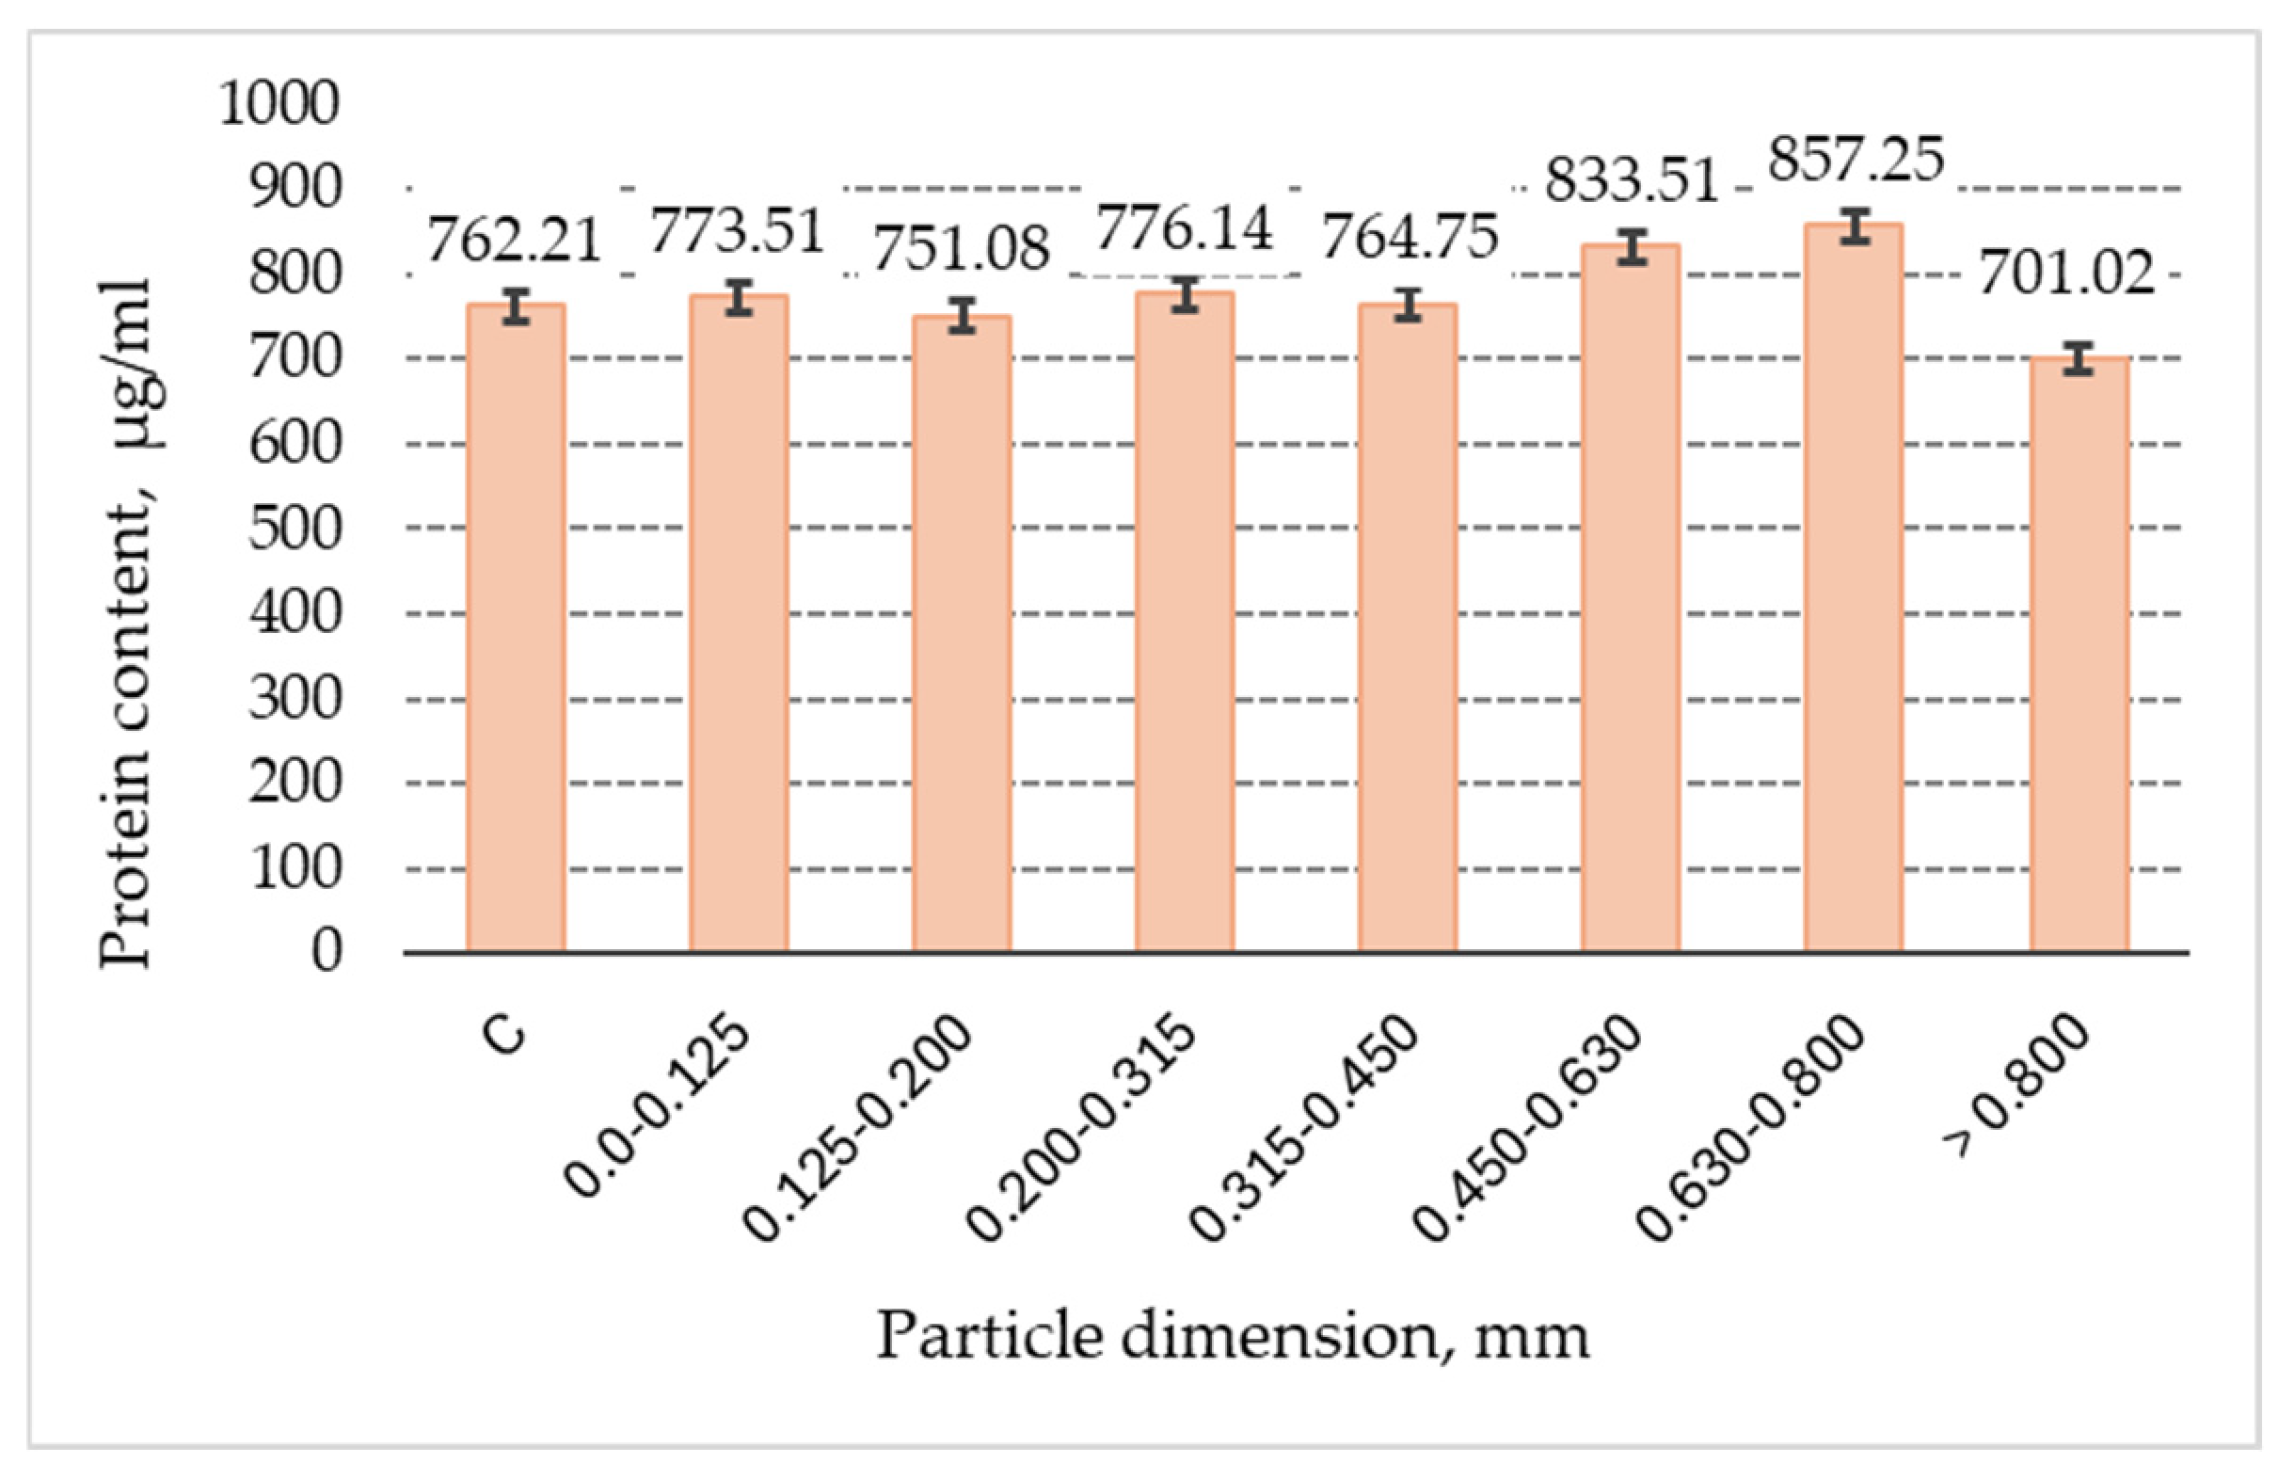
3.7. Proteins
3.8. Carbohydrates
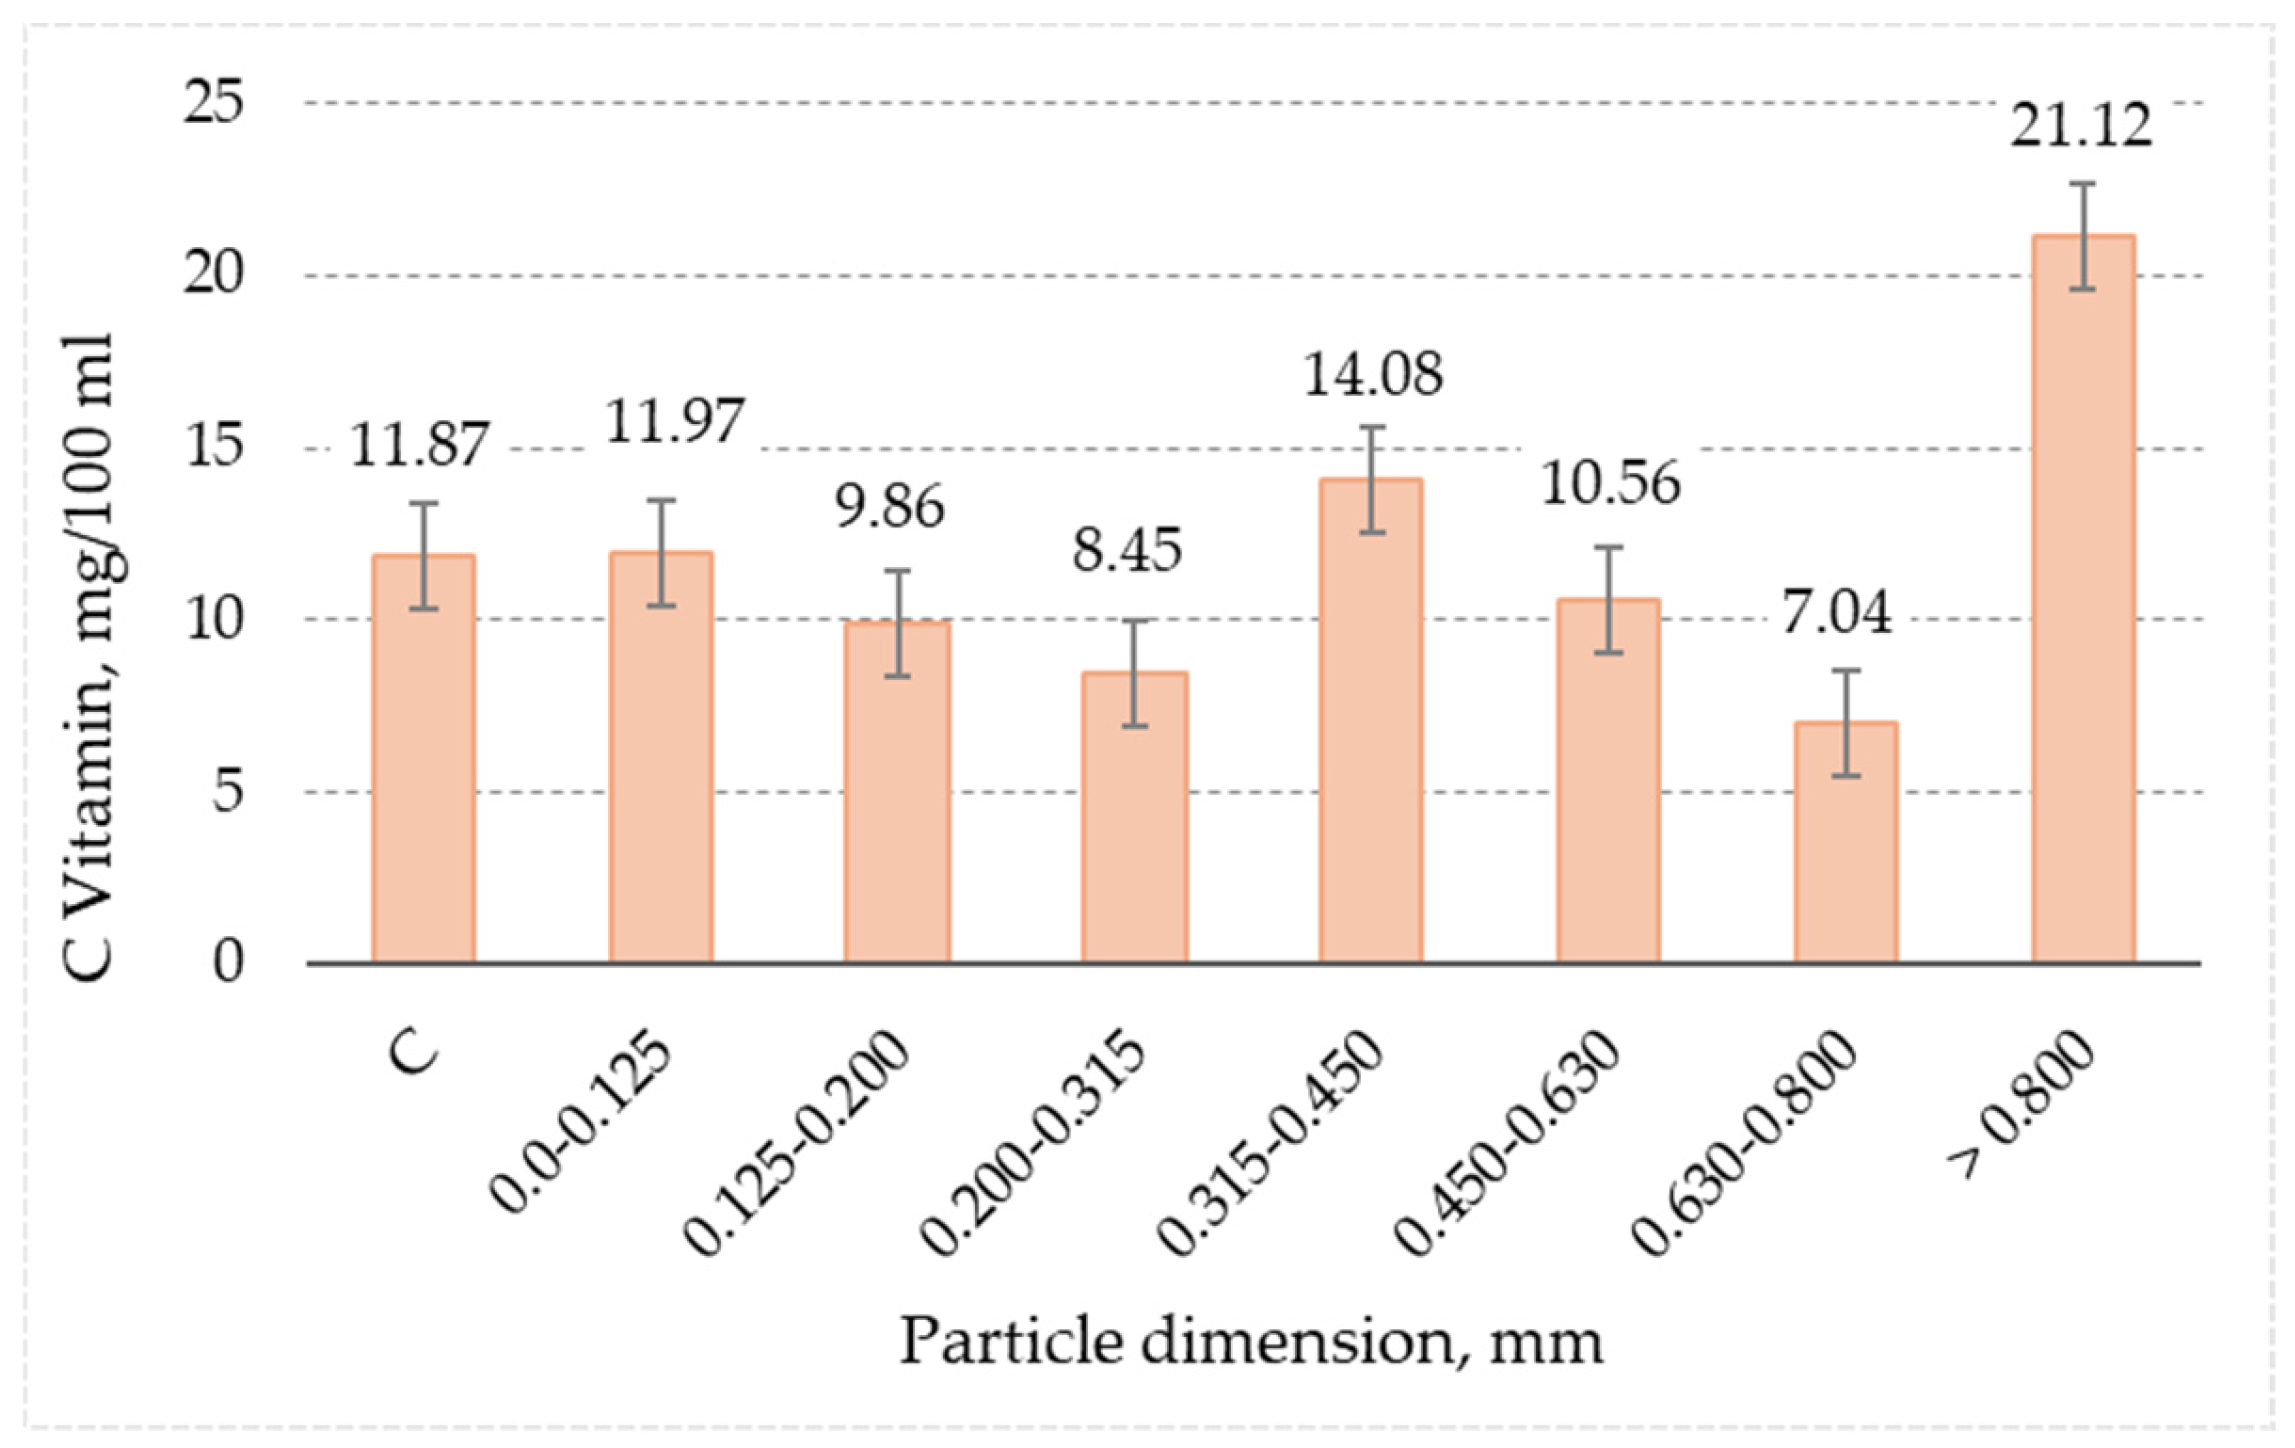
3.9. Vitamin C
3.10. Statistical Data Analysis
- ⮚
- Null hypothesis (H₀): there are no significant differences between group means (all means are equal).
- ⮚
- Alternative hypothesis (H₁): there is at least one significant difference between the group means.
4. Conclusions
Author Contributions
Funding
Institutional Review Board Statement
Informed Consent Statement
Data Availability Statement
Acknowledgments
Conflicts of Interest
References
- Magiera, A.; Czerwińska, M.E.; Owczarek, A.; Marchelak, A.; Granica, S.; Olszewska, M.A. Polyphenol-enriched extracts of Prunus spinosa fruits: Anti-inflammatory and antioxidant effects in human immune cells ex vivo in relation to phytochemical profile. Molecules 2022, 27, 1691. [Google Scholar] [CrossRef] [PubMed]
- Li, Y.; Zhang, J.J.; Xu, D.P.; Zhou, T.; Zhou, Y.; Li, S.; Li, H.B. Bioactivities and health benefits of wild fruits. Int. J. Mol. Sci. 2016, 17, 1258. [Google Scholar] [CrossRef]
- Fernández-Ruiz, V.; Morales, P.; Ruiz-Rodríguez, B.M.; Isasa, E.T. Nutrients and bioactive compounds in wild fruits through different continents. In Wild Plants, Mushrooms and Nuts: Functional Food Properties and Applications; Wiley: Hoboken, NJ, USA, 2016; pp. 263–314. [Google Scholar] [CrossRef]
- Bei, M.F.; Apahidean, A.I.; Budau, R.; Rosan, C.A.; Popovici, R.; Memete, A.R.; Domocos, D.; Vicas, S.I. An Overview of the Phytochemical Composition of Different Organs of Prunus spinosa L., Their Health Benefits and Application in Food Industry. Horticulturae 2023, 10, 29. [Google Scholar] [CrossRef]
- Kotsou, K.; Stoikou, M.; Athanasiadis, V.; Chatzimitakos, T.; Mantiniotou, M.; Sfougaris, A.I.; Lalas, S.I. Enhancing Antioxidant Properties of Prunus spinosa Fruit Extracts via Extraction Optimization. Horticulturae 2023, 9, 942. [Google Scholar] [CrossRef]
- Popovic, B.M.; Blagojević, B.; Pavlović, R.Z.; Micić, N.; Bijelić, S.; Bogdanović, B.; Misan, A.; Duarte, C.M.M.; Serra, A.T. Comparison between polyphenol profile and bioactive response in blackthorn (Prunus spinosa L.) genotypes from north Serbia-from raw data to PCA analysis. Food Chem. 2020, 302, 125373. [Google Scholar] [CrossRef] [PubMed]
- Babalau-Fuss, V.; Becze, A.; Roman, M.; Moldovan, A.; Cadar, O.; Tofana, M. Chemical and technological properties of blackthorn (Prunus spinosa) and rose hip (Rosa canina) fruits grown wild in Cluj-Napoca area. Agricultura 2020, 113, 110–115. [Google Scholar]
- Nistor, O.V.; Milea, S.A.; Pacularu-Burada, B.; Andronoiu, D.G.; Rapeanu, G.; Stanciuc, N. Technologically Driven Approaches for the Integrative Use of Wild Blackthorn (Prunus spinosa L.) Fruits in Foods and Nutraceuticals. Antioxidants 2023, 12, 1637. [Google Scholar] [CrossRef]
- Popescu, I.; Caudullo, G. Prunus spinosa in Europe: Distribution, habitat, usage and threats. In European Atlas of Forest Tree Species, Prunus Spinosa; San-Miguel-Ayanz, J., de Rigo, D., Caudullo, G., Houston Durrant, T., Mauri, A., Eds.; Publications Office of the EU: Luxembourg, 2016; p. e018f4e. [Google Scholar]
- Mitroi, C.L.; Gherman, A.; Gociu, M.; Bujanca, G.; Cocan, E.N.; Radulescu, L.; Megyesi, C.I.; Velciov, A. The antioxidant activity of blackthorn fruits (Prunus spinosa L.) review. J. Agroaliment. Process. Technol. 2022, 28, 288–291. [Google Scholar]
- Veličković, I.; Žižak, Ž.; Rajčević, N.; Ivanov, M.; Soković, M.; Marin, P.D.; Grujić, S. Prunus spinosa L. leaf extracts: Polyphenol profile and bioactivities. Not. Bot. Horti Agrobot. Cluj Napoca 2021, 49, 12137. [Google Scholar] [CrossRef]
- Capek, P.; Košťálová, Z. Isolation, chemical characterization and antioxidant activity of Prunus spinosa L. fruit phenolic polysaccharide-proteins. Carbohydr. Res. 2022, 515, 108547. [Google Scholar] [CrossRef]
- Gunes, R. A Study on Quality Properties of Blackthorn (Prunus spinosa L.) Fruit Powder Obtained by Different Drying Treatments. In BIO Web of Conferences; EDP Sciences: Les Ulis, France, 2024; Volume 85, p. 01011. [Google Scholar]
- Negrean, O.R.; Farcas, A.C.; Pop, O.L.; Socaci, S.A. Blackthorn—A Valuable Source of Phenolic Antioxidants with Potential Health Benefits. Molecules 2023, 28, 3456. [Google Scholar] [CrossRef]
- Magiera, A.; Kołodziejczyk-Czepas, J.; Skrobacz, K.; Czerwińska, M.E.; Rutkowska, M.; Prokop, A.; Michel, P.; Olszewska, M.A. Valorisation of the Inhibitory Potential of Fresh and Dried Fruit Extracts of Prunus spinosa L. towards Carbohydrate Hydrolysing Enzymes, Protein Glycation, Multiple Oxidants and Oxidative Stress-Induced Changes in Human Plasma Constituents. Pharmaceuticals 2022, 15, 1300. [Google Scholar] [CrossRef]
- Balta, I.; Sevastre, B.; Miresan, V.; Taulescu, M.; Raducu, C.; Longodor, A.L.; Maris, C.S.; Coroian, A. Protective effect of blackthorn fruits (Prunus spinosa) against tartrazine toxicity development in albino Wistar rats. BMC Chem. 2019, 13, 104. [Google Scholar] [CrossRef] [PubMed]
- Pinacho, R.; Cavero, R.Y.; Astiasarán, I.; Ansorena, D.; Calvo, M.I. Phenolic compounds of blackthorn (Prunus spinosa L.) and influence of in vitro digestion on their antioxidant capacity. J. Funct. Foods 2015, 19, 49–62. [Google Scholar] [CrossRef]
- Sabatini, L.; Fraternale, D.; Di Giacomo, B.; Mari, M.; Albertini, M.C.; Gordillo, B.; Colomba, M. Chemical composition, antioxidant, antimicrobial and anti-inflammatory activity of Prunus spinosa L. fruit ethanol extract. J. Funct. Foods 2020, 67, 103885. [Google Scholar] [CrossRef]
- Marchelak, A.; Owczarek, A.; Matczak, M.; Pawlak, A.; Kolodziejczyk-Czepas, J.; Nowak, P.; Olszewska, M.A. Bioactivity potential of Prunus spinosa L. flower extracts: Phytochemical profiling, cellular safety, pro-inflammatory enzymes inhibition and protective effects against oxidative stress in vitro. Front. Pharmacol. 2017, 8, 680. [Google Scholar] [CrossRef]
- Nguyen, T.L.; Ora, A.; Häkkinen, S.T.; Ritala, A.; Räisänen, R.; Kallioinen-Mänttäri, M.; Melin, K. Innovative extraction technologies of bioactive compounds from plant by-products for textile colorants and antimicrobial agents. Biomass Convers. Biorefinery 2023, 1–30. [Google Scholar] [CrossRef]
- Becker, L.; Zaiter, A.; Petit, J.; Zimmer, D.; Karam, M.C.; Baudelaire, E.; Dicko, A. Improvement of antioxidant activity and polyphenol content of Hypericum perforatum and Achillea millefolium powders using successive grinding and sieving. Ind. Crops Prod. 2016, 87, 116–123. [Google Scholar] [CrossRef]
- Deli, M.; Baudelaire, E.D.; Nguimbou, R.M.; Njintang Yanou, N.; Scher, J. Micronutrients and in vivo antioxidant properties of powder fractions and ethanolic extract of Dichrostachys glomerata Forssk. Fruits Food Sci. Nutr. 2020, 8, 3287–3297. [Google Scholar] [CrossRef] [PubMed]
- Zaiter, A.; Becker, L.; Petit, J.; Zimmer, D.; Karam, M.C.; Baudelaire, É.; Dicko, A. Antioxidant and antiacetylcholinesterase activities of different granulometric classes of Salix alba (L.) bark powders. Powder Technol. 2016, 301, 649–656. [Google Scholar] [CrossRef]
- Becker, L.; Zaiter, A.; Petit, J. How do grinding and sieving impact on physicochemical properties, polyphenol content, and antioxidant activity of Hieracium pilosella L. powders? J. Funct. Foods 2017, 35, 666–672. [Google Scholar] [CrossRef]
- Alsaud, N.; Farid, M. Insight into the influence of grinding on the extraction efficiency of selected bioactive compounds from various plant leaves. Appl. Sci. 2020, 10, 6362. [Google Scholar] [CrossRef]
- Miganeh Waiss, I.; Kimbonguila, A.; Mohamed Abdoul-Latif, F.; Nkeletela, L.B.; Scher, J.; Petit, J. Total phenolic content, antioxidant activity, shelf-life and reconstitutability of okra seeds powder: Influence of milling and sieving processes. Int. J. Food Sci. Technol. 2021, 56, 5139–5149. [Google Scholar] [CrossRef]
- Duguma, H.T.; Zhang, L.; Ofoedu, C.E.; Chacha, J.S.; Agunbiade, A.O. Potentials of superfine grinding in quality modification of food powders. CyTA J. Food 2023, 21, 530–541. [Google Scholar] [CrossRef]
- Deli, M.; Ndjantou, E.B.; Ngatchic Metsagang, J.T.; Petit, J.; Njintang Yanou, N.; Scher, J. Successive grinding and sieving as a new tool to fractionate polyphenols and antioxidants of plants powders: Application to Boscia senegalensis seeds, Dichrostachys glomerata fruits, and Hibiscus sabdariffa calyx powders. Food Sci. Nutr. 2019, 7, 1795–1806. [Google Scholar] [CrossRef]
- Koraqi, H.; Aydar, A.Y.; Pandiselvam, R.; Qazimi, B.; Khalid, W.; Petkoska, A.T.; Rustagi, S. Optimization of extraction condition to improve blackthorn (Prunus spinosa L.) polyphenols, anthocyanins and antioxidant activity by natural deep eutectic solvent (NADES) using the simplex lattice mixture design method. Microchem. J. 2024, 200, 110497. [Google Scholar]
- Damar, I.; Yilmaz, E. Ultrasound-assisted extraction of phenolic compounds in blackthorn (Prunus spinosa L.): Characterization, antioxidant activity and optimization by response surface methodology. J. Food Meas. Charact. 2023, 17, 1467–1479. [Google Scholar] [CrossRef]
- Ruiz-Rodríguez, B.M.; De Ancos, B.; Sánchez-Moreno, C.; Fernández-Ruiz, V.; de Cortes Sánchez-Mata, M.; Cámara, M.; Tardío, J. Wild blackthorn (Prunus spinosa L.) and hawthorn (Crataegus monogyna Jacq.) fruits as valuable sources of antioxidants. Fruits 2014, 69, 61–73. [Google Scholar] [CrossRef]
- Benković, M.; Belščak-Cvitanović, A.; Bauman, I.; Komes, D.; Srečec, S. Flow properties and chemical composition of carob (Ceratonia siliqua L.) flours as related to particle size and seed presence. Int. Food Res. 2017, 100, 211–218. [Google Scholar] [CrossRef]
- Ahmed, J.; Taher, A.; Mulla, M.Z.; Al-Hazza, A.; Luciano, G. Effect of sieve particle size on functional, thermal, rheological and pasting properties of Indian and Turkish lentil flour. J. Food Eng. 2016, 186, 34–41. [Google Scholar] [CrossRef]
- Bala, M.; Handa, S.; Mridula, D.; Singh, R.K. Physicochemical, functional and rheological properties of grass pea (Lathyrus sativus L.) flour as influenced by particle size. Heliyon 2020, 6, 11. [Google Scholar] [CrossRef]
- Ahmed, J.; Thomas, L.; Arfat, Y.A. Functional, rheological, microstructural and antioxidant properties of quinoa flour in dispersions as influenced by particle size. Int. Food Res. 2019, 116, 302–311. [Google Scholar] [CrossRef]
- Singleton, V.L.; Rossi, J.A. Colorimetry of total phenolics with phosphomolybdic-phosphotungstic acid reagents. Am. J. Enol. Vitic. 1965, 16, 144–158. [Google Scholar] [CrossRef]
- Roman, I.; Stănilă, A.; Stănilă, S. Bioactive compounds and antioxidant activity of Rosa canina L. biotypes from spontaneous flora of Transylvania. Chem. Cent. J. 2013, 7, 73. [Google Scholar] [CrossRef]
- Koczka, N.; Stefanovits-Bányai, É.; Ombódi, A. Total polyphenol content and antioxidant capacity of rosehips of some Rosa species. Medicines 2018, 5, 84. [Google Scholar] [CrossRef]
- Ciunculete, G.G.; Rău, I.; Iosub, I.; Geană, E.I.; Niculescu, V. Grape Ivy (Parthenocissus tricuspidata) extracts with bioactive compounds. UPB. Sci. Bull. Ser. B 2021, 83, 193–202. [Google Scholar]
- Chaves, N.; Santiago, A.; Alías, J.C. Quantification of the antioxidant activity of plant extracts: Analysis of sensitivity and hierarchization based on the method used. Antioxidants 2020, 9, 76. [Google Scholar] [CrossRef] [PubMed]
- Pourmorad, F.; Hosseinimehr, S.J.; Shahabimajd, N. Antioxidant activity, phenol and flavonoid contents of some selected Iranian medicinal plants. Afr. J. Biotechnol 2006, 5, 1142–1145. [Google Scholar]
- Artem, V.; Negreanu–Pirjol, T.; Ranca, A.; Ciobanu, C.; Bratu, M.M.; Popoviciu, D.R.; Moldovan, L.; Vasile, M.; Negreanu-Pirjol, B.S. Total phenolic content correlated with antioxidant activity of some grape pomace biomass hydroalcoholic extracts, white and red varieties. UPB. Sci. Bull. Ser. B 2021, 83, 61–72. [Google Scholar]
- Baliyan, S.; Mukherjee, R.; Priyadarshini, A.; Vibhuti, A.; Gupta, A.; Pandey, R.P.; Chang, C.M. Determination of anti-oxidants by DPPH radical scavenging activity and quantitative phytochemical analysis of Ficus religiosa. Molecules 2022, 27, 1326. [Google Scholar] [CrossRef]
- Winters, A.L.; Minchin, F.R. Modification of the Lowry assay to measure proteins and phenols in covalently bound complexes. Anal. Biochem. 2005, 346, 43–48. [Google Scholar] [CrossRef]
- Mæhre, H.K.; Dalheim, L.; Edvinsen, G.K.; Elvevoll, E.O.; Jensen, I.J. Protein determination-method matters. Foods 2018, 7, 5. [Google Scholar] [CrossRef]
- Wood, I.P.; Elliston, A.; Ryden, P.; Bancroft, I.; Roberts, I.N.; Waldron, K.W. Rapid quantification of reducing sugars in biomass hydrolysates: Improving the speed and precision of the dinitrosalicylic acid assay. Biomass Bioenergy 2012, 44, 117–121. [Google Scholar] [CrossRef]
- Lam, H.H.; Dinh, T.H.; Dang-Bao, T. Quantification of total sugars and reducing sugars of dragon fruit-derived sugar-samples by UV-Vis spectrophotometric method. In IOP Conference Series: Earth and Environmental Science; IOP Publishing: Bristol, UK, 2021; Volume 947, p. 012041. [Google Scholar]
- Miller, G.L. Use of dinitrosalicylic acid reagent for determination of reducing sugar. Anal. Chem. 1959, 31, 426–428. [Google Scholar] [CrossRef]
- Trifunschi, S.; Zugravu, C.A.; Munteanu, M.F.; Borcan, F.; Pogurschi, E.N. Determination of the Ascorbic Acid Content and the Antioxidant Activity of Different Varieties of Vegetables Consumed in Romania, from Farmers and Supermarkets. Sustainability 2022, 14, 13749. [Google Scholar] [CrossRef]
- Georgieva, S.; Angelov, G.; Boyadzhieva, S. Concentration of vitamin C and antioxidant activity of rosehip extracts. J. Chem. Technol. Metall. 2014, 49, 451–454. [Google Scholar]
- Şendil, O. Effect of some parameters on the extraction and decomposition of ascorbic acid in the rosehip. Turkish J. Pharm. Sci. 2006, 3, 61–72. [Google Scholar]
- Ezekiel, A.; Abiodun, O.; Justina, T.; Funmilayo, A.; Omolara, P. Evaluation of Ascorbic Acid Contents in Selected Fruits using Iodometric method and UV Spectrophotometer. Int. J. Adv. Appl. Sci. 2018, 12, 21–24. [Google Scholar]
- Voicu, G.; Stoica, D.; Ungureanu, N. Influence of oscillation frequency of a sieve on the screening process for a conical sieve with oscillatory circular motion. J. Agric. Sci. Technol. B 2011, 1, 1224–1231, ISSN 2161-6264. [Google Scholar]
- Li, Z.; Tong, X. A study of particles penetration in sieving process on a linear vibration screen. Int. J. Coal Sci. Technol. 2015, 2, 299–305. [Google Scholar] [CrossRef]
- Hadree, J.; Shahidi, F.; Mohebbi, M.; Abbaspour, M. Evaluation of effects of spray drying conditions on physicochemical properties of pomegranate juice powder enriched with pomegranate peel phenolic compounds: Modeling and optimization by RSM. Foods 2023, 12, 2066. [Google Scholar] [CrossRef]
- Deli, M.; Petit, J.; Nguimbou, R.M.; Beaudelaire Djantou, E.; Njintang Yanou, N.; Scher, J. Effect of sieved fractionation on the physical, flow and hydration properties of Boscia senegalensis Lam., Dichostachys glomerata Forssk. and Hibiscus sabdariffa L. powders. Food Sci. Biotechnol. 2019, 28, 1375–1389. [Google Scholar] [CrossRef] [PubMed]
- Dhillon, B.; Choudhary, G.; Sodhi, N.S. A study on physicochemical, antioxidant and microbial properties of germinated wheat flour and its utilization in breads. J. Food Sci. 2020, 57, 2800–2808. [Google Scholar] [CrossRef]
- Chen, X.D.; Özkan, N. Stickiness, functionality, and microstructure of food powders. Dry. Technol. 2007, 25, 959–969. [Google Scholar] [CrossRef]
- Mueed, A.; Shibli, S.; Al-Quwaie, D.A.; Ashkan, M.F.; Alharbi, M.; Alanazi, H.; El-Saadony, M.T. Extraction, characterization of polyphenols from certain medicinal plants and evaluation of their antioxidant, antitumor, antidiabetic, antimicrobial properties, and potential use in human nutrition. Front. Nutr. 2023, 10, 1125106. [Google Scholar] [CrossRef]
- Mieszczakowska-Frąc, M.; Celejewska, K.; Płocharski, W. Impact of innovative technologies on the content of vitamin C and its bioavailability from processed fruit and vegetable products. Antioxidants 2021, 10, 54. [Google Scholar] [CrossRef]


| Mesh Size of the Sieve (mm) | Sieve Mass (g) | The Sample Mass Found on the Sieve (g) | The Mass of the Sample Taken for Analysis (g) |
|---|---|---|---|
| 1.000 | 392.2 | 1.4 | 100 |
| 0.800 | 474.8 | 21.0 | |
| 0.630 | 458.6 | 14.7 | |
| 0.450 | 305.9 | 13.6 | |
| 0.315 | 413.9 | 12.5 | |
| 0.200 | 335.3 | 10.1 | |
| 0.125 | 391.9 | 14.3 | |
| 0 | 342.5 | 12.4 |
| Mesh Size of the Sieve li (mm) | The Average Particle Size of Fraction di (mm) | The Percentage of Material with a Size between Dimensions li and li+1 of the Adjacent Sieves ai (mm) | The Percentage of Material Smaller Than the Size of the Sieve Mesh Ti (%) | The Percentage of Material Larger Than the Size of the Sieve Mesh Ri (%) |
|---|---|---|---|---|
| 0 | 0.063 | 12.40 | 0.00 | 100.00 |
| 0.125 | 0.163 | 14.30 | 12.40 | 87.60 |
| 0.200 | 0.258 | 10.10 | 26.70 | 73.30 |
| 0.315 | 0.383 | 12.50 | 36.80 | 63.20 |
| 0.450 | 0.540 | 13.60 | 49.30 | 50.70 |
| 0.630 | 0.715 | 14.70 | 62.90 | 37.10 |
| 0.800 | 0.900 | 21.00 | 77.60 | 22.40 |
| 1.000 | 1.207 * | 1.40 | 86.20 | 13.80 |
| Mesh Size of the Sieve li (mm) | Mean of Intervals, (mm) | Moisture Content (%) | Water Activity(-) | Water Absorption Capacity, WAC (g/g) | Water Solubility Index, WSI (g/100 g) |
|---|---|---|---|---|---|
| Un-sieved sample | - | 4.52 | 0.241 | 4.905 | 32.672 |
| 0 | 0.063 | 3.31 | 0.232 | 5.883 | 41.284 |
| 0.125 | 0.163 | 3.79 | 0.234 | 5.688 | 40.676 |
| 0.200 | 0.258 | 4.34 | 0.237 | 3.892 | 42.272 |
| 0.315 | 0.383 | 4.71 | 0.242 | 3.958 | 37.920 |
| 0.450 | 0.540 | 5.10 | 0.243 | 3.868 | 35.544 |
| 0.630 | 0.715 | 5.11 | 0.244 | 3.847 | 38.912 |
| 0.800 | 1.131 | 5.61 | 0.250 | 3.837 | 36.828 |
| Groups | Count | Sum | Average | Variance |
|---|---|---|---|---|
| Phenolic content [µg GAE/mL] | 8 | 269.59 | 33.69 | 23.79 |
| Protein content [µg/mL] | 8 | 6219.53 | 777.44 | 2350.78 |
| Vitamin C [µg/100 mL] | 8 | 94.94 | 11.86 | 18.74 |
| Carbohydrates [µg/mL] | 8 | 37.06 | 4.63 | 0.34 |
| Source of Variation | SS | df | MS | F | p-Value | F Crit |
|---|---|---|---|---|---|---|
| Between Groups | 3,475,723.33 | 3 | 1,158,574 | 1936.07 | 1.48−32 | 2.94 |
| Within Groups | 16,755.63 | 28 | 598.41 | / | / | / |
| Total | 3,492,478.97 | 31 | / | / | / | / |
Disclaimer/Publisher’s Note: The statements, opinions and data contained in all publications are solely those of the individual author(s) and contributor(s) and not of MDPI and/or the editor(s). MDPI and/or the editor(s) disclaim responsibility for any injury to people or property resulting from any ideas, methods, instructions or products referred to in the content. |
© 2024 by the authors. Licensee MDPI, Basel, Switzerland. This article is an open access article distributed under the terms and conditions of the Creative Commons Attribution (CC BY) license (https://creativecommons.org/licenses/by/4.0/).
Share and Cite
Ionescu, A.-D.; Ferdeș, M.; Voicu, G.; Ipate, G.; Constantin, G.-A.; Ștefan, E.-M.; Begea, M. Effect of Grinding and Successive Sieving on the Distribution of Active Biological Compounds in the Obtained Fractions of Blackthorn Berries. Appl. Sci. 2024, 14, 7133. https://doi.org/10.3390/app14167133
Ionescu A-D, Ferdeș M, Voicu G, Ipate G, Constantin G-A, Ștefan E-M, Begea M. Effect of Grinding and Successive Sieving on the Distribution of Active Biological Compounds in the Obtained Fractions of Blackthorn Berries. Applied Sciences. 2024; 14(16):7133. https://doi.org/10.3390/app14167133
Chicago/Turabian StyleIonescu, Alina-Daiana, Mariana Ferdeș, Gheorghe Voicu, George Ipate, Gabriel-Alexandru Constantin, Elena-Mădălina Ștefan, and Mihaela Begea. 2024. "Effect of Grinding and Successive Sieving on the Distribution of Active Biological Compounds in the Obtained Fractions of Blackthorn Berries" Applied Sciences 14, no. 16: 7133. https://doi.org/10.3390/app14167133
APA StyleIonescu, A.-D., Ferdeș, M., Voicu, G., Ipate, G., Constantin, G.-A., Ștefan, E.-M., & Begea, M. (2024). Effect of Grinding and Successive Sieving on the Distribution of Active Biological Compounds in the Obtained Fractions of Blackthorn Berries. Applied Sciences, 14(16), 7133. https://doi.org/10.3390/app14167133