Abstract
In this study, we experimentally analyzed whether people can perceive the accuracy or smartness of AI judgments, and whether the judgment accuracy of AI and the level of confidence in those judgments affect people’s decision-making. The results showed that people may perceive an AI’s smartness even when it only presents information on the results of its judgments. The results also suggest that AI accuracy and confidence affect human decision-making, and that the magnitude of the effect of AI confidence varies with AI accuracy. We also found that when a person’s ability to make a decision is less than or equal to the AI’s ability to make a decision, the human performance in a binary decision task improves regardless of AI accuracy. The results obtained in this study are similar in some respects to relationships in which people make decisions while interacting, and the findings from research on human interactions may apply to the research and development of human–AI interactions.
1. Introduction
Many studies have been conducted regarding artificial intelligence (AI), and many research papers on its evolution have been published. According to the Stanford Institute for Human-Centered Artificial Intelligence (HAI), the number of papers on AI published in 2021 was double those published in 2010 [1]. In 2022, the percentage of organizations that have adopted AI is at approximately 50% [2]. One possible reason why AI use is not more widespread is the uncertainty of the results offered by AI. There is distrust emanating from AI suggestions because the basis for the suggestions is unknown.
Common AI ethical principles around the world include “transparency”, “justice and fairness”, “non-maleficence”, “responsibility”, and “privacy” [3]. Moreover, there is a growing trend worldwide toward explainability in AI. Explainable AI (XAI) research [4,5,6], which seeks to determine the basis for AI decisions, is actively being conducted in academia [7]. However, another factor that could affect our perception of AI and its suggestions is in the confidence it expresses and whether their previous answers agree with the user’s current knowledge.
This study aim to investigate the impact of AI confidence, which we define as an extension of the AI outcome information, on human decision-making. We elucidate the changes in human decision-making regarding the “AI smartness” and the “confidence level of the AI judgment”. In this study, “AI smartness” refers to the accuracy of AI decisions. We will focus on cases where this accuracy is higher than that of a human and at the same level as that of a human.
This study defines the “confidence level of the AI judgment” as an extension of the AI outcome information. This indicator is similar to the confidence, which is used in communication on humans, and is possible to be understandable for non-expert end users. This confidence level also varies between high and low cases. The above mentioned comparative verification of two types of “AI smartness” and two types of “AI confidence in judgment” is conducted under four conditions to clarify the question “does AI smartness and AI confidence in judgment affect human decision-making?”.
2. Related Work
Studies attempting to give AI with explanatory properties have been constantly developing, and studies are also being conducted to explore how AI with explanatory properties affects human decision-making. Often, these studies are in the medical and aviation fields, where safety is of critical importance and human error can pose crucial problems, so human operators work together under time pressure for safe and efficient operation. They found that AI with explanatory properties has been found to be effective under time pressure [8].
For example, in scenarios assuming the medical field, in detail, medical image analysis field, three XAI methods, LIME [9], SHAP [10], and CIU, as defined by Knapic et al., were compared and discussed, determining that all three AI explanatory properties improved participants’ task accuracy and shortened the time taken to finish the task [11]. In the aviation field, the effect of AI with explanatory properties on human decision-making has been also engaged in a lively debate [12].
However, Wang et al. found that the AI explanations are less effective in tasks in areas where the user has no expertise [13]. In this study, rather than proving explanations, we investigated the effects of an AI’s expressed confidence and its inferred smartness on the decisions made by the user.
3. Methods
3.1. AI Accuracy
In this study, AI accuracy is defined as an indicator of AI smartness. This is the correct answer rate for the questions, and can be obtained using Equation (1).
where A is the AI accuracy, is the number of correct responses, and q is the number of questions.
3.2. AI Confidence
In this study, AI confidence is defined as an indicator of the confidence level of AI judgments. It is the maximum value among the assigned values of a final layer of the neural network (NN) in the classification to the softmax function, and can be obtained using Equation (2). It should be noted that the AI confidence indicated to the participants in the experiment was rounded to two decimal places.
where C is the AI confidence level, is the value of the final NN layer, and k is the number of classes.
3.3. Participants
Thirty young adults from the Saga university community were voluntarily recruited to participate in this experiment (18 males and 12 females; 23 ± 4.4 years old). All participants provided written informed consent. The study was approved by the Faculty of Medicine Ethics Committee at Saga University, Japan, under Application No. R4-38.
3.4. Experiment Task
The participants were requested to evaluate whether the facial images shown on the monitor were actual photographs (real) or those generated by AI (fake). Some facial images are shown in Figure 1.
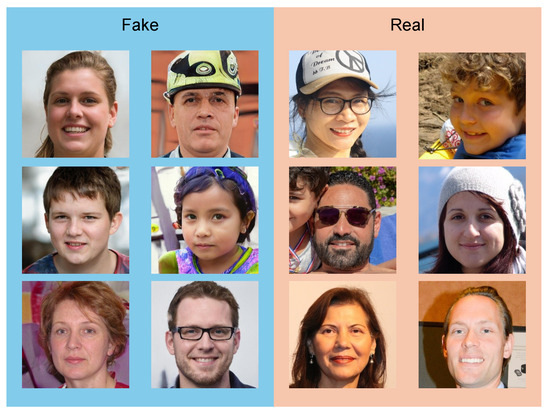
Figure 1.
Examples of facial images.
The task was prepared for this experiment by intentionally being designed so that it could be performed by anyone without special training and without requiring participants to achieve high performance. Participants performed the task using the user interface shown in Figure 2. The facial images displayed in the “Facial image” section in Figure 2A were evaluated as either real or fake by the participants. The “Suggestion” section below the “Facial image” section displays information regarding the AI’s decision. However, we varied this display method to examine the effect of the presence or absence of this information on human decision-making. The details of the suggestions from the AI are described in Section 3.5. Participants inputted their judgment and confidence level in that judgment via the “Choice” buttons at the bottom of the user interface. Figure 2B shows the details of the various “Choice” buttons. Furthermore, the participants could record their real or fake decisions and confidence levels by clicking the same buttons mentioned above. For example, if the participants thinks the presented image is real, he/she selects the confidence level that he/she thinks is real based on a scale from 55% to 100% from the real part of the selection button and clicks on it using a mouse. In contrast, if the subject thinks that the presented image is a fake, he/she selects the confidence level that he/she thinks is a fake based on a scale between 55% and 100% and clicks on it using a mouse. In this task, the participants must select either real or fake. Furthermore, the button with a confidence level of 50 cannot be selected for these task. The above mentioned confidence values were set based on the work of Schuldt et al. [14].
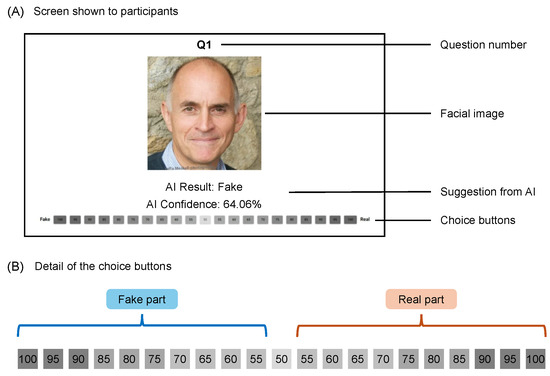
Figure 2.
User interface used in the experiment. (A) Screen shown for the participants. (B) Choice button.
3.5. Experiment Design
3.5.1. Part 1: Can People Determine How Smart AI Is?
To elucidate whether people can determine the “smartness of AI”, we conducted experiments using “smart AI” and “unintelligent AI”, that is, AI with high accuracy in judgment and AI with low accuracy in judgment. The accuracy of smart AI was set to 75%, whereas that of the unintelligent AI was set to 55%. These AI accuracies were not communicated to the participants. The screen presented to the participants is shown in Figure 3A. A real or fake facial image was displayed on the screen, and the result of determining whether the AI was real or fake was presented to the participants as information from the AI. Participants were requested to distinguish between real and fake facial images based on all the information presented to them. No feedback was provided regarding whether the participant’s response was correct or incorrect.
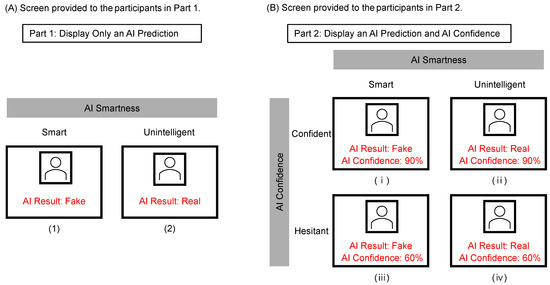
Figure 3.
How AI suggestions are shown to the participants. (A) Screen provided to the participants in Part 1. (B) Screen provided to the participants in Part 2.
3.5.2. Part 2: Does the Intelligence and Confidence in AI Influence Human Decision-Making?
Next, we conducted an experiment using these two factors to examine how “AI smartness” and “AI confidence” affect people’s acceptance of AI. For the “smartness of the AI”, we set two conditions (high accuracy and low accuracy), and for the “AI confidence”, we set two conditions (confident and hesitant). Moreover, we prepared an AI under four conditions by multiplying these conditions. The screen presented to the participants is shown in Figure 3B. As shown in Figure 3B, the participants were shown suggestions from () Smart and Confident AI, () Smart but Hesitant AI, () Unintelligent but Confident AI, and () Unintelligent and Hesitant AI, and they evaluated the facial images based on the suggestions. As suggested by the AI, the AI prediction result and confidence are displayed below the facial image. No feedback was provided regarding whether the participant’s response was correct or incorrect.
As in Part 1, the AI accuracy of the smart AI was set to 75%, and that of the unintelligent AI was set to 55%. These AI accuracies were not communicated to the participants. The mean confidence of the confident AI was set at 80.25% (SD = 13.38%), and that of the hesitant AI was set at 50.49% (SD = 0.38%).
3.6. Material
3.6.1. Dataset
The facial images used in this experiment were obtained from an open dataset uploaded on Kaggle [15]. The real images in the dataset were human face images extracted from the Flickr-Faces-HQ dataset [16] collected by NVIDIA and resized to 256 × 256 pixels from the original image size of 1024 × 1024 pixels. The fake images in the dataset were human face images created using StyleGAN [16], a generative AI with an image size of 256 × 256 pixels. In this experiment, it is desirable to have a dataset that will give participants some hesitation in deciding between real and fake images to ensure that AI suggestions are necessary. It is difficult to distinguish between real and fake images generated by StyaleGAN because of its high accuracy, and we believe that they are suitable targets that can confuse participants when making a judgment.
3.6.2. AI Model
The AIs used in this experiment distinguish between real and fake facial images. Furthermore, each model is a convolutional neural network (CNN) created using Pytorch [17]. Since an image classification task was examined in this experiment, the mainstream architecture, a CNN architecture, was used in our experiment [18,19]. The architecture of the CNN is shown in Figure 4.
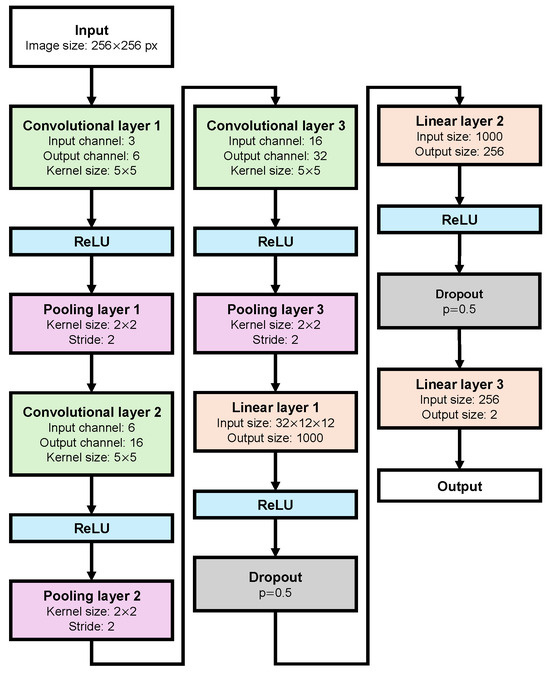
Figure 4.
Architecture of AI used.
The AIs consist of three convolution layers, three pooling layers, and three fully connected layers. The input image size is 256 × 256 pixels, and the number of channels is three, corresponding to an RGB image. The kernel size of the convolution layer is set to 5 × 5 for all three layers, with the number of channels set to 6 after the first layer convolution, 16 after the second layer convolution, and 32 after the third layer convolution. The kernel size of the pooling layer is 2 × 2 for all three layers, and the stride width is 2.
A rectified linear unit (ReLU) function was used as the activation function, and dropout was set with a probability of 0.5 between each fully connected layer. During training, the cross-entropy loss was used as the error function, and the momentum method was used as the optimization algorithm. We used 1000 randomly selected images from the dataset described in Section 3.6.1 for the training data. For the test data, four sets of 50 facial images different from the training data for a total of 200 images, were randomly selected from the dataset.
The hyperparameters during training were adjusted to obtain the four AIs desired for this experiment. The accuracy and confidence of the four AIs are mentioned in Section 3.5. The detailed values of the hyperparameters are listed in Table 1.

Table 1.
Value of Hyperparameter for Each AI.
3.7. Protocol
All experiments were conducted using an interface built on the Web, and each task described in Section 3.4 was provided to the participants.
A total of 50 facial images were presented to the participants, with 25 real images and 25 fake images per set. In addition, four separate sets were created for each of the four AI conditions. The experiments were conducted using all four sets of questions in Parts 1 and 2.
The experiment was conducted over three days, with at least 24 h between days 1 and 2 and between days 2 and 3. An interval of 24 h or more eliminated the influence of the experiment on the participants’ memory of facial images and the content of information presented by the AI. On day 1, the experiment was conducted with all four sets of problems without any information from the AI being displayed to obtain the participants’ baseline performance. This baseline was used to calculate the improvement in result accuracy. On day 2, four conditions were randomly selected for each participant from Parts 1 and 2. On day 3, the experiment was conducted under the remaining four conditions not selected on day 2.
3.8. Measurements
3.8.1. Concordance Rate
The concordance rate was defined as a measure of whether the presentation of information from the AI influenced human decision-making. This is the percentage of participants’ responses consistent with the AI’s judgment and is shown in Equation (3).
where M is the concordance rate, is the number of participants’ responses consistent with the AI judgments, and r is the number of questions.
3.8.2. Improvement in Result Accuracy
The improvement in result accuracy measures of whether AI information affects human performance. This is the percentage increase in the participant’s correct response from the baseline correct response, as shown in Equation (4). The baseline represents the performance of the participant when no information is fed back from the AI.
where I is the improvement in result accuracy, is the number of correct responses from the participant on Part 1 or Part 2, is the number of correct responses from the participant’s baseline performance, and r is the number of questions.
4. Results
4.1. Part 1
Figure 5A shows the concordance rate in Part 1 of the experiment. Corresponding t-tests for the concordance rates yielded significant differences between the AIs with high and low judgment accuracies (t(29) = −5.9986, p < 0.0001, r = 0.7861). Therefore, displaying the suggestions of the AI with higher accuracy resulted in higher concordance rate than displaying the suggestions of the AI with lower accuracy.
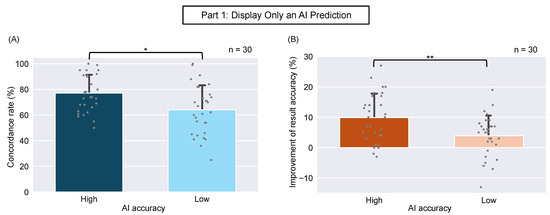
Figure 5.
(A) Concordance rate (Part 1). The values are means ± SD (n = 30). Paired t-test analyses suggested a significant difference in concordance rate between AI smartness. * p< 0.0001. (B) Improvement in accuracy (Part 1). The values are means ± SD (n = 30). Paired t-test analyses suggested a significant difference in accuracy improvement between AI smartness. ** p = 0.0030.
Figure 5B shows the improvement in result accuracy in Part 1. Corresponding t-tests for the improvement in result accuracy yielded significant differences between the AIs with high and low judgment accuracies (t(29) = −3.2343, p < 0.0030, r = 0.0652). Therefore, accuracy improvement was more significant when AI suggestions with higher accuracy were displayed than when those with lower accuracy.
4.2. Part 2
Figure 6A shows the concordance rate in Part 2 of the experiment. A two-way repeated measures ANOVA was conducted to examine the effects of “AI accuracy” and “AI confidence” on the concordance rate. Significant differences in AI accuracy (F = 21.3738, p < 0.0001), AI confidence (F = 24.0953, p < 0.0001), and interactions (F = 7.8415, p < 0.0060) were observed. The results of multiple comparisons using the Bonferroni method as a subtest showed a significant difference between confidence and hesitancy when the AI accuracy was low (p < 0.0001). Significant differences were observed between the AI with high accuracy and high confidence levels and the AI with low accuracy and low confidence levels, and between the AI with high accuracy but low confidence levels and the AI with low accuracy and low confidence levels (p < 0.0001).
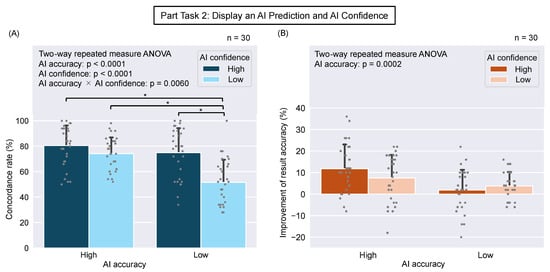
Figure 6.
(A) Concordance rate (Part 2). The values are means ± SD (n = 30). The p values of two-way repeated-measures ANOVA are shown in the top left corner. Pairwise comparisons with Bonferroni corrections showed significant differences between Unintelligent and Hesitant AI, and others (* p < 0.0001). (B) Improvement in accuracy (Part 2). The values are means ± SD (n = 30). The p value of two-way repeated-measures ANOVA is shown in the top left corner.
Figure 6B shows the improvement in result accuracy in Part 2. A two-way repeated measures ANOVA was conducted to examine the effects of “AI accuracy” and “AI confidence” on improving result accuracy. Significant differences were observed in AI accuracy (F = 15.0091, p = 0.0002). No significant differences were observed in AI confidence (F = 0.4375, p = 0.5096) and interactions (F = 3.0890, p = 0.0815).
5. Discussion
5.1. Can People Determine How Smart AI Is?
The concordance rate in Part 1 of the experiment suggests that people can perceive the AI smartness, i.e., the judgment accuracy of AI, even when the AI only presents information on whether the judgment is real or fake. Participants should adopt the AI suggestions when they feel that they are correct, and the increase in the concordance rate may indicate that the participants perceived the correctness of the AI judgments (in other words, some form of smartness from the information presented by the AI). The participants likely based their perception of the judgment accuracy of AI on their differences. Because the tasks in this experiment were set up such that the AI’s performance was as good as or higher than the participants’ performance, participants felt that the AI’s judgment accuracy was higher than their own; that is, they might be smarter than they were when their responses differed from the AI’s predictions. However, if the AI’s prediction was the same as their answer, they may have considered the AI’s judgment accuracy to be equal to or lower than their own; that is, they may have considered the AI to be unintelligent.
5.2. Does the Intelligence and Confidence in AI Influence Human Decision-Making?
The concordance rate in Part 2 of the experiment suggests that the accuracy and confidence level of AI judgments influence human decision-making, and that the influence of confidence level varies depending on the accuracy level. When the judgment accuracy of AI was high, changes in the confidence level had no significant effect on the concordance rate, but when the judgment accuracy of AI was low, changes in the confidence level caused significant differences in the concordance rate. The results showed that when the AI judgment accuracy was high, the effect of AI confidence tended to be small, and when the AI accuracy was low, the effect of AI confidence tended to be significant. As explained in Section 5.1, because participants tend to perceive AI accuracy as high when it is high, there is probably minimal requirement to employ AI confidence to indicate whether to trust the AI. Therefore, it can be inferred that the effect of AI confidence became smaller when the AI accuracy was high. Conversely, we believe that the effect of AI confidence was more significant when the AI accuracy was low. Participants might use AI confidence to indicate whether to trust the AI because they could not infer the correct answer, due to the low AI accuracy. This result also suggests that participants may perceive the smartness of AI with higher judgment accuracy than themselves but may have difficulty perceiving the stupidity of AI with lower judgment accuracy. There is still room for debate as to whether people can determine how smart AI is, as described in Section 5.1. In future studies, we would like to verify whether the concordance rate changes when participants are not informed of the AI accuracy, as in this experiment, or when participants are informed of the AI accuracy and to investigate in more detail the conditions under which people can perceive the AI accuracy.
However, when we examined the concordance rate focusing on AI confidence, it was higher when the AI was confident, regardless of AI accuracy, suggesting that the opinion of a confident AI was more likely to be accepted. It has been shown that when people interact to make decisions, more confident opinions are more likely to be accepted by the other person [20], and we found similarities between human–human interactions and human–AI interactions. People may feel a certain humanity toward AI.
5.3. Influence on Human Performance
The improvement in result accuracy for Parts 1 and 2 of the experiment was negative in some cases, but positive overall in all cases, suggesting that cooperation with AI tends to improve human performance. We believe that this was because of an increase in the amount of information available to participants when making decisions. In this experiment, when participants judged based on images alone (baseline), they could only make judgments based on their own opinions. However, when they cooperate with the AI, they can make judgments based on the AI’s opinions.
It has been shown that two people perform better than one in decision-making when interacting with each other [21,22]. Bahador et al. stated that pair performance improved when individuals communicate their confidence levels accurately in all trials [23]. The improvement in result accuracy in Part 2 replicates this, suggesting that there may be similarities between human–human and human–AI interactions. In contrast, the participants’ performance improved, even when the AI did not provide their confidence level, as shown by the improvement in the accuracy of the results in Part 1. We found that interactions between human and AI differ from those between human in that providing their confidence level does not necessarily affect their performance.
5.4. Limitations
This study has several limitations. The AI models referred to in this study were only models that perform two-class classification; other regression models, for example, have not been tested. Because of the limited AI models, the experimental tasks tested in this study were also binary decision tasks, and have not been tested on tasks requiring more sophisticated decision-making processes. Therefore, the discussion applies only in the limited model of a two-class classification task. It is possible that participants were able to perceive the AI accuracy (referred to in Section 5.1), even though they were not told the AI accuracy, because the task was a binary choice. Participants may feel that the AI was low accuracy when AI determined an image that was clearly fake was real. This situation is less likely to occur when there are more than three options, and the matters identified in this study may not be applied in multi-class classification tasks. In addition, feedback from the AI may also need to vary according to the AI model used and the task setting. we are planning to verify whether similar trends can be obtained for AI models that make regression predictions, and to compare them with the findings of this study. Furthermore, several feedback methods from the AI also need to be compared and investigated their impact on decision-making.
6. Conclusions
In this study, we experimentally analyzed the effect of AI smartness and confidence on human decision-making. More specifically, this paper was answering following questions:
- Can people determine how smart AI is?
- Does the intelligence and confidence in AI influence human decision-making?
- What are the influence on human performance?
The results showed that people may perceive an AI’s smartness, even when it only presents information on the results of its judgments. The results also suggest that AI accuracy and confidence affect human decision-making, and that the magnitude of the effect of AI confidence varies with AI accuracy. We also found that when a person’s ability to make a decision is less than or equal to the AI’s ability to make a decision, the performance improves regardless of AI accuracy. The results obtained in this study are similar in some respects to relationships in which people make decisions while interacting, and the findings from research on human interactions may apply to the research and development of human–AI interactions. In future studies, we will further verify this point.
Author Contributions
Conceptualization, O.F., W.L.Y., H.O. and N.I.; methodology, O.F., W.L.Y. and N.I.; software, W.L.Y. and N.I.; validation, O.F. and W.L.Y.; formal analysis, N.I.; investigation, N.I.; resources, N.I.; data curation, N.I.; writing—original draft preparation, N.I.; writing—review and editing, O.F. and W.L.Y.; visualization, N.I.; supervision, O.F. and H.O.; project administration, O.F.; funding acquisition, O.F. All authors have read and agreed to the published version of the manuscript.
Funding
This research was funded by the Japan Society for the Promotion of Science research fellowship, JSPS KAKENHI, grant number 23H03440 and 23K28130. https://kaken.nii.ac.jp/ja/grant/KAKENHI-PROJECT-23K28130 (accessed on 1 August 2024).
Institutional Review Board Statement
The study was conducted in accordance with the Declaration of Helsinki, and approved by the Ethics Committee of Faculty of Medicine at Saga University (Application No. R4-38, approval date 2 February 2023).
Informed Consent Statement
Informed consent was obtained from all subjects involved in the study.
Data Availability Statement
The raw data supporting the conclusions of this article will be made available by the authors on request.
Conflicts of Interest
The authors declare no conflicts of interest. The funders had no role in the design of the study; in the collection, analyses, or interpretation of data; in the writing of the manuscript; or in the decision to publish the results.
References
- Maslej, N.; Fattorini, L.; Brynjolfsson, E.; Etchemendy, J.; Ligett, K.; Lyons, T.; Manyika, J.; Ngo, H.; Niebles, J.C.; Parli, V.; et al. Artificial intelligence index report 2023. arXiv 2023, arXiv:2310.03715. [Google Scholar]
- Chui, M.; Hall, B.; Mayhew, H.; Singla, A.; Sukharevsky, A. The State of AI in 2022 and a Half Decade in Review. 2022. Available online: https://www.mckinsey.com/capabilities/quantumblack/our-insights/the-state-of-ai-in-2022-and-a-half-decade-in-review#/ (accessed on 3 April 2024).
- Ienca, M.; Vayena, E. Ai ethics guidelines: European and global perspectives. Towards Regul. AI Syst. 2020, 38–60. [Google Scholar]
- Lundberg, S.M.; Erion, G.; Chen, H.; DeGrave, A.; Prutkin, J.M.; Nair, B.; Katz, R.; Himmelfarb, J.; Bansal, N.; Lee, S.I. From local explanations to global understanding with explainable AI for trees. Nat. Mach. Intell. 2020, 2, 2522–5839. [Google Scholar] [CrossRef] [PubMed]
- Wang, H.; Wang, Z.; Du, M.; Yang, F.; Zhang, Z.; Ding, S.; Mardziel, P.; Hu, X. Score-CAM: Score-Weighted Visual Explanations for Convolutional Neural Networks. In Proceedings of the IEEE/CVF Conference on Computer Vision and Pattern Recognition (CVPR) Workshops, Seattle, WA, USA, 13–19 June 2020. [Google Scholar]
- Hendricks, L.A.; Rohrbach, A.; Schiele, B.; Darrell, T.; Akata, Z. Generating visual explanations with natural language. Appl. AI Lett. 2021, 2, e55. [Google Scholar] [CrossRef]
- Barredo Arrieta, A.; Díaz-Rodríguez, N.; Del Ser, J.; Bennetot, A.; Tabik, S.; Barbado, A.; Garcia, S.; Gil-Lopez, S.; Molina, D.; Benjamins, R.; et al. Explainable Artificial Intelligence (XAI): Concepts, taxonomies, opportunities and challenges toward responsible AI. Inf. Fusion 2020, 58, 82–115. [Google Scholar] [CrossRef]
- Theis, S.; Jentzsch, S.; Deligiannaki, F.; Berro, C.; Raulf, A.P.; Bruder, C. Requirements for Explainability and Acceptance of Artificial Intelligence in Collaborative Work. In Proceedings of the Artificial Intelligence in HCI; Degen, H., Ntoa, S., Eds.; Springer Nature: Cham, Switzerland, 2023; pp. 355–380. [Google Scholar]
- Ribeiro, M.T.; Singh, S.; Guestrin, C. “Why Should I Trust You?”: Explaining the Predictions of Any Classifier. In Proceedings of the 22nd ACM SIGKDD International Conference on Knowledge Discovery and Data Mining, New York, NY, USA, 13–17 August 2016; KDD ’16. pp. 1135–1144. [Google Scholar] [CrossRef]
- Lundberg, S.M.; Lee, S.I. A Unified Approach to Interpreting Model Predictions. In Proceedings of the Advances in Neural Information Processing Systems; Guyon, I., Luxburg, U.V., Bengio, S., Wallach, H., Fergus, R., Vishwanathan, S., Garnett, R., Eds.; Curran Associates, Inc.: New York, NY, USA, 2017; Volume 30. [Google Scholar]
- Knapič, S.; Malhi, A.; Saluja, R.; Främling, K. Explainable Artificial Intelligence for Human Decision Support System in the Medical Domain. Mach. Learn. Knowl. Extr. 2021, 3, 740–770. [Google Scholar] [CrossRef]
- Sutthithatip, S.; Perinpanayagam, S.; Aslam, S.; Wileman, A. Explainable AI in Aerospace for Enhanced System Performance. In Proceedings of the 2021 IEEE/AIAA 40th Digital Avionics Systems Conference (DASC), San Antonio, TX, USA, 3–7 October 2021; pp. 1–7. [Google Scholar] [CrossRef]
- Wang, X.; Yin, M. Are Explanations Helpful? A Comparative Study of the Effects of Explanations in AI-Assisted Decision-Making. In Proceedings of the 26th International Conference on Intelligent User Interfaces, New York, NY, USA, 9 September 2021; IUI ’21. pp. 318–328. [Google Scholar] [CrossRef]
- Schuldt, J.P.; Chabris, C.F.; Woolley, A.W.; Hackman, J.R. Confidence in Dyadic Decision Making: The Role of Individual Differences. J. Behav. Decis. Mak. 2017, 30, 168–180. [Google Scholar] [CrossRef]
- XHLULU. 140k Real and Fake Faces. 2019. Available online: https://www.kaggle.com/datasets/xhlulu/140k-real-and-fake-faces/data (accessed on 19 February 2024).
- Karras, T.; Laine, S.; Aila, T. A Style-Based Generator Architecture for Generative Adversarial Networks. IEEE Trans. Pattern Anal. & Mach. Intell. 2021, 43, 4217–4228. [Google Scholar] [CrossRef]
- Paszke, A.; Gross, S.; Massa, F.; Lerer, A.; Bradbury, J.; Chanan, G.; Killeen, T.; Lin, Z.; Gimelshein, N.; Antiga, L.; et al. PyTorch: An Imperative Style, High-Performance Deep Learning Library. In Proceedings of the Advances in Neural Information Processing Systems; Wallach, H., Larochelle, H., Beygelzimer, A., d’Alché-Buc, F., Fox, E., Garnett, R., Eds.; Curran Associates, Inc.: New York, NY, USA, 2019; Volume 32. [Google Scholar]
- Chen, L.; Li, S.; Bai, Q.; Yang, J.; Jiang, S.; Miao, Y. Review of Image Classification Algorithms Based on Convolutional Neural Networks. Remote Sens. 2021, 13, 4712. [Google Scholar] [CrossRef]
- Taye, M.M. Theoretical Understanding of Convolutional Neural Network: Concepts, Architectures, Applications, Future Directions. Computation 2023, 11, 52. [Google Scholar] [CrossRef]
- Koriat, A. When Are Two Heads Better than One and Why? Science 2012, 336, 360–362. [Google Scholar] [CrossRef] [PubMed]
- Laughlin, P.R.; Hatch, E.C.; Silver, J.S.; Boh, L. Groups perform better than the best individuals on letters-to-numbers problems: Effects of group size. J. Personal. Soc. Psychol. 2006, 90, 644–651. [Google Scholar] [CrossRef] [PubMed]
- Marquart, D.I. Group Problem Solving. J. Soc. Psychol. 1955, 41, 103–113. [Google Scholar] [CrossRef]
- Bahrami, B.; Olsen, K.; Latham, P.E.; Roepstorff, A.; Rees, G.; Frith, C.D. Optimally Interacting Minds. Science 2010, 329, 1081–1085. [Google Scholar] [CrossRef] [PubMed]
Disclaimer/Publisher’s Note: The statements, opinions and data contained in all publications are solely those of the individual author(s) and contributor(s) and not of MDPI and/or the editor(s). MDPI and/or the editor(s) disclaim responsibility for any injury to people or property resulting from any ideas, methods, instructions or products referred to in the content. |
© 2024 by the authors. Licensee MDPI, Basel, Switzerland. This article is an open access article distributed under the terms and conditions of the Creative Commons Attribution (CC BY) license (https://creativecommons.org/licenses/by/4.0/).