Article

Structure Analysis of the Fractionator Overhead Vapor Line of a Delayed Coker Unit

Department of Aeronautical Engineering, National Formosa University, Huwei, Yunlin 632, Taiwan
*
Author to whom correspondence should be addressed.
Appl. Sci. 2024, 14(16), 7193; https://doi.org/10.3390/app14167193
Submission received: 30 June 2024 / Revised: 5 August 2024 / Accepted: 12 August 2024 / Published: 15 August 2024
(This article belongs to the Topic Oil and Gas Pipeline Network for Industrial Applications)

Abstract

:
In view of the great impact of the pipeline system in a delayed coker unit (DCU) on production and operation safety, we applied computational fluid dynamics (CFD) to investigate the flow in a fractionator overhead vapor line connected to an air cooler in a previous study. The causes of the pipeline damage and the strategies to alleviate the occurrence of the damage were discussed. It is found that if two 24″ pipes are connected and five 18″ pipes are also connected, the force uniformity can be improved, and the forces on the caps, reducers, and T-junctions can be reduced. In this paper, we further applied the finite element method to perform structure analysis to confirm the strength of the original and the improved pipeline system. It is found that the static stress is larger when the pipelines are connected. The first four modes of the pipeline vibration are primarily affected by the vibration of the 30″ main pipe, while the fifth and the sixth modes are primarily affected by the vibration of the smaller pipes. In the case of a magnitude 1 earthquake (parallel mode) and a magnitude 2 wind, the maximum harmonic response stresses (stresses obtained from harmonic response analysis) occur at the same locations. After the pipelines are connected, some positions of the maximum harmonic response stresses are shifted from the 30″ main pipe to the 24″ pipe. In terms of the wind effect, the pipelines connected or unconnected can both withstand moderate typhoons of magnitude 13 without fatigue damage. In terms of the seismic effect, the pipelines connected can withstand a strong earthquake of magnitude 5(+) without fatigue damage, while the pipelines unconnected can withstand a very strong earthquake of magnitude 6(−) without fatigue damage, which is better than the pipelines connected. Under the action of a magnitude 17 severe typhoon, the stresses for the pipelines connected or unconnected are both lower than the yield strength and the ultimate tensile strength (UTS). There is no danger of immediate damage in terms of the wind effect. The pipelines connected or unconnected can withstand magnitude 7 earthquakes up to accelerations of 1718 gal (17.18 m/s2) and 2236 gal (22.36 m/s2), respectively, without exceeding the UTS. The pipelines unconnected are slightly better than the pipelines connected in terms of earthquake resistance. The purpose of this series study is to explore the flow development and the structural strength of the DCU pipeline system to improve its operational safety.

1. Introduction

Delayed coking is one of the important processes in refineries. It is used for the thermal cracking of high molecular weight feedstocks (usually vacuum tar in a vacuum oil producing unit), which are converted into acid gas, naphtha, light oil, heavy oil, and coke. Figure 1 illustrates the typical operation process of a Delayed Coker Unit (DCU). The feedstocks are first heated and then transported to the bottom of the fractionator to cool the superheated steam, and the preheated feedstocks from the bottom of the fractionator, together with the steam with higher water content, are pressurized by the pump into the radiant section of the furnace for rapid heating. After partial evaporation in the heater tube, the feedstocks are introduced into one of the coke drums for coking reaction, and then, high-pressure water is injected into the furnace tube to minimize the tar deposition and delay the coking reaction in the furnace tube. The superheated steam from the top of the coke drums is pumped back to the bottom of the fractionator and further separated into various products such as liquid natural gas, naphtha, light oil, and heavy oil, according to their boiling points. The gas at the top of the fractionator is cooled in an air cooler at the top of the fractionator [1].
Depew et al. [2] proposed a process model for simulating DCU operation. The authors used the simulation results to evaluate different control systems. Vatsal Kedia et al. [3] developed a numerical method to estimate the standard deviation reduction rate of the main control variables of DCU operation. The authors combined the method with MATLAB and applied it to the actual DCU process of refineries subject to periodic disturbances to demonstrate the effectiveness of the method. Zhang and Yu [4] used a radial basis function (RBF) neural network to establish a multivariate model for DCU liquid products. The model can provide the production ratio of gasoline, diesel, petroleum tar oil, etc., as well as the overall production proportion of liquid products. Chen and Wang [5] used the n-d-M, E-d-M, and hydrocarbon analysis methods to analyze the composition and properties of delayed coking feedstocks (vacuum oil residue, fluidized catalytic cracking slurry) and ethylene tar. Their results showed that mixing ethylene tar into delayed coking feedstocks would lead to a decrease in the saturation of the feedstocks and an increase in the aromatic hydrocarbon content in the feedstocks. Lei et al. [6] established a comprehensive optimization model for the hierarchical structure of the heat exchanger network, with heat removal in the complex fractionator as the main coupling variable. They compared the results of three optimization studies. The authors pointed out that it is better to consider steam generation in the comprehensive optimization. Ge Xin [7] successfully analyzed and solved the problem of waste oil blending through a technical optimization program and the results showed that the program could increase diesel production by 2.59% after blending waste oil. Deng et al. [8] solved the problem of the use of catalytic cracking slurry by testing the high proportion of catalytic cracking slurry. The results showed that when the mixing ratio of catalytic cracking slurry increased from 25% to 29%, the production of petroleum coke decreased significantly, while the production of kerosene, light oil, and the total production of liquid increased. Fan et al. [9] applied a thermal load automatic adjustment simulation method to explore the three-point steam injection of DCU, and analyzed the effect of three-point steam injection rate on the coking degree and heat consumption. The results showed that the steam injection rate affected the heat consumption and coking degree. The coking degree could be reduced by improving the steam injection rate. Paladino et al. [10] developed a CFD model that explores the DCU scrubbing zone (including steam and scrubbing liquid) and considers the heat and mass transfer among different phases to predict the region where the vapor reaches the desired temperature and to avoid the formation of coke in this region. The model can reproduce the complex phenomenon of interfacial heat and mass transfer in multi-component multiphase flow. Díaz et al. [11] applied CFD to simulate the DCU of a pilot plant. They simulated the cooling process of three different vacuum residue coking beds and compared the results with experimental data. Salma Abdalla Mohamed Ibrahim et al. [12] conducted computer simulations of two crude oils to obtain the ideal blending ratio of heavy crude oil as a crude oil substitute in DCU. The results of experimental tests and computer simulations showed that mixing 50% DAR blend with 50% Fula blend in DCU can significantly improve the quality and quantity of the product. Albers [13] developed models for predicting product quantity and quality. The authors tried to use three different methods, including kinetics, Monte Carlo, and empirical methods, to improve the control and optimization of the delayed coking process. Pedro Amorim Valenca et al. [14] used a two-dimensional axisymmetric numerical simulation to investigate an experimental coke furnace receiving nitrogen. Based on safety and process considerations, the device was preheated at a specific temperature. The results predicted a linear temperature profile, which was the same as the experimental trend. Samy Nabil Mohamed [15] used Aspen HYSYS modeling to optimize the DCU process parameters and compared them with the original design conditions to achieve maximum diesel production with process safety in consideration.
In terms of pipeline research, Dai et al. [16] discussed the types and causes of pipeline vibration, and proposed relevant anti-vibration methods to improve the safety of the pipelines. Chen et al. [17] discussed the deformation and overall stress of a pipeline under different wind speeds. They analyzed the stress distribution of a pipeline under the action of a magnitude 17 wind to confirm its safety under a strong wind. Wu et al. [18] discussed the influence of seismic action direction on the pipeline displacement direction. The authors used dynamic stress analysis to study the pipelines located in a seismic zone. The results showed that any seismic action direction would cause a significant effect on the lateral displacement of the pipelines. Zhou et al. [19] discussed the stress distribution of the pipelines. The authors introduced the pipeline stress classification and the content of the pipeline analysis, which are helpful in identifying the methods of the pipeline analysis more quickly. Ren et al. [20] used ANSYS to establish an elbow model. The simulation results showed that the maximum stress occurred at the elbow and changed with different lengths. Zhou [21] studied the problem of pipeline damage and used the finite element method to explore the dynamic characteristics of the pipelines under different conditions. Zhao et al. [22] discussed the vibration and the fatigue damage caused by the fluid flow in pipelines. They proposed vibration reduction methods in terms of the structure and fluid flow to improve the safety and service life of the pipelines. Yin et al. [23] discussed the vibration generated by the outlet valve of the oil pump. The authors used a spectrometer and analysis software to measure and optimize the pipeline system. Xu et al. [24] discussed the force distribution in pipes with different diameters and wall thicknesses under earthquakes. They found that the pipe wall thickness is the dominant factor of pipe damage. Terán et al. [25] applied the nonlinear finite element method (FEM) and 3-D pipeline models to investigate the pipeline failure pressure and mechanical behavior. The failure pressure was predicted by FEM and compared with the results of traditional methods to determine their applicability in considering the interaction of pitting corrosion defects.
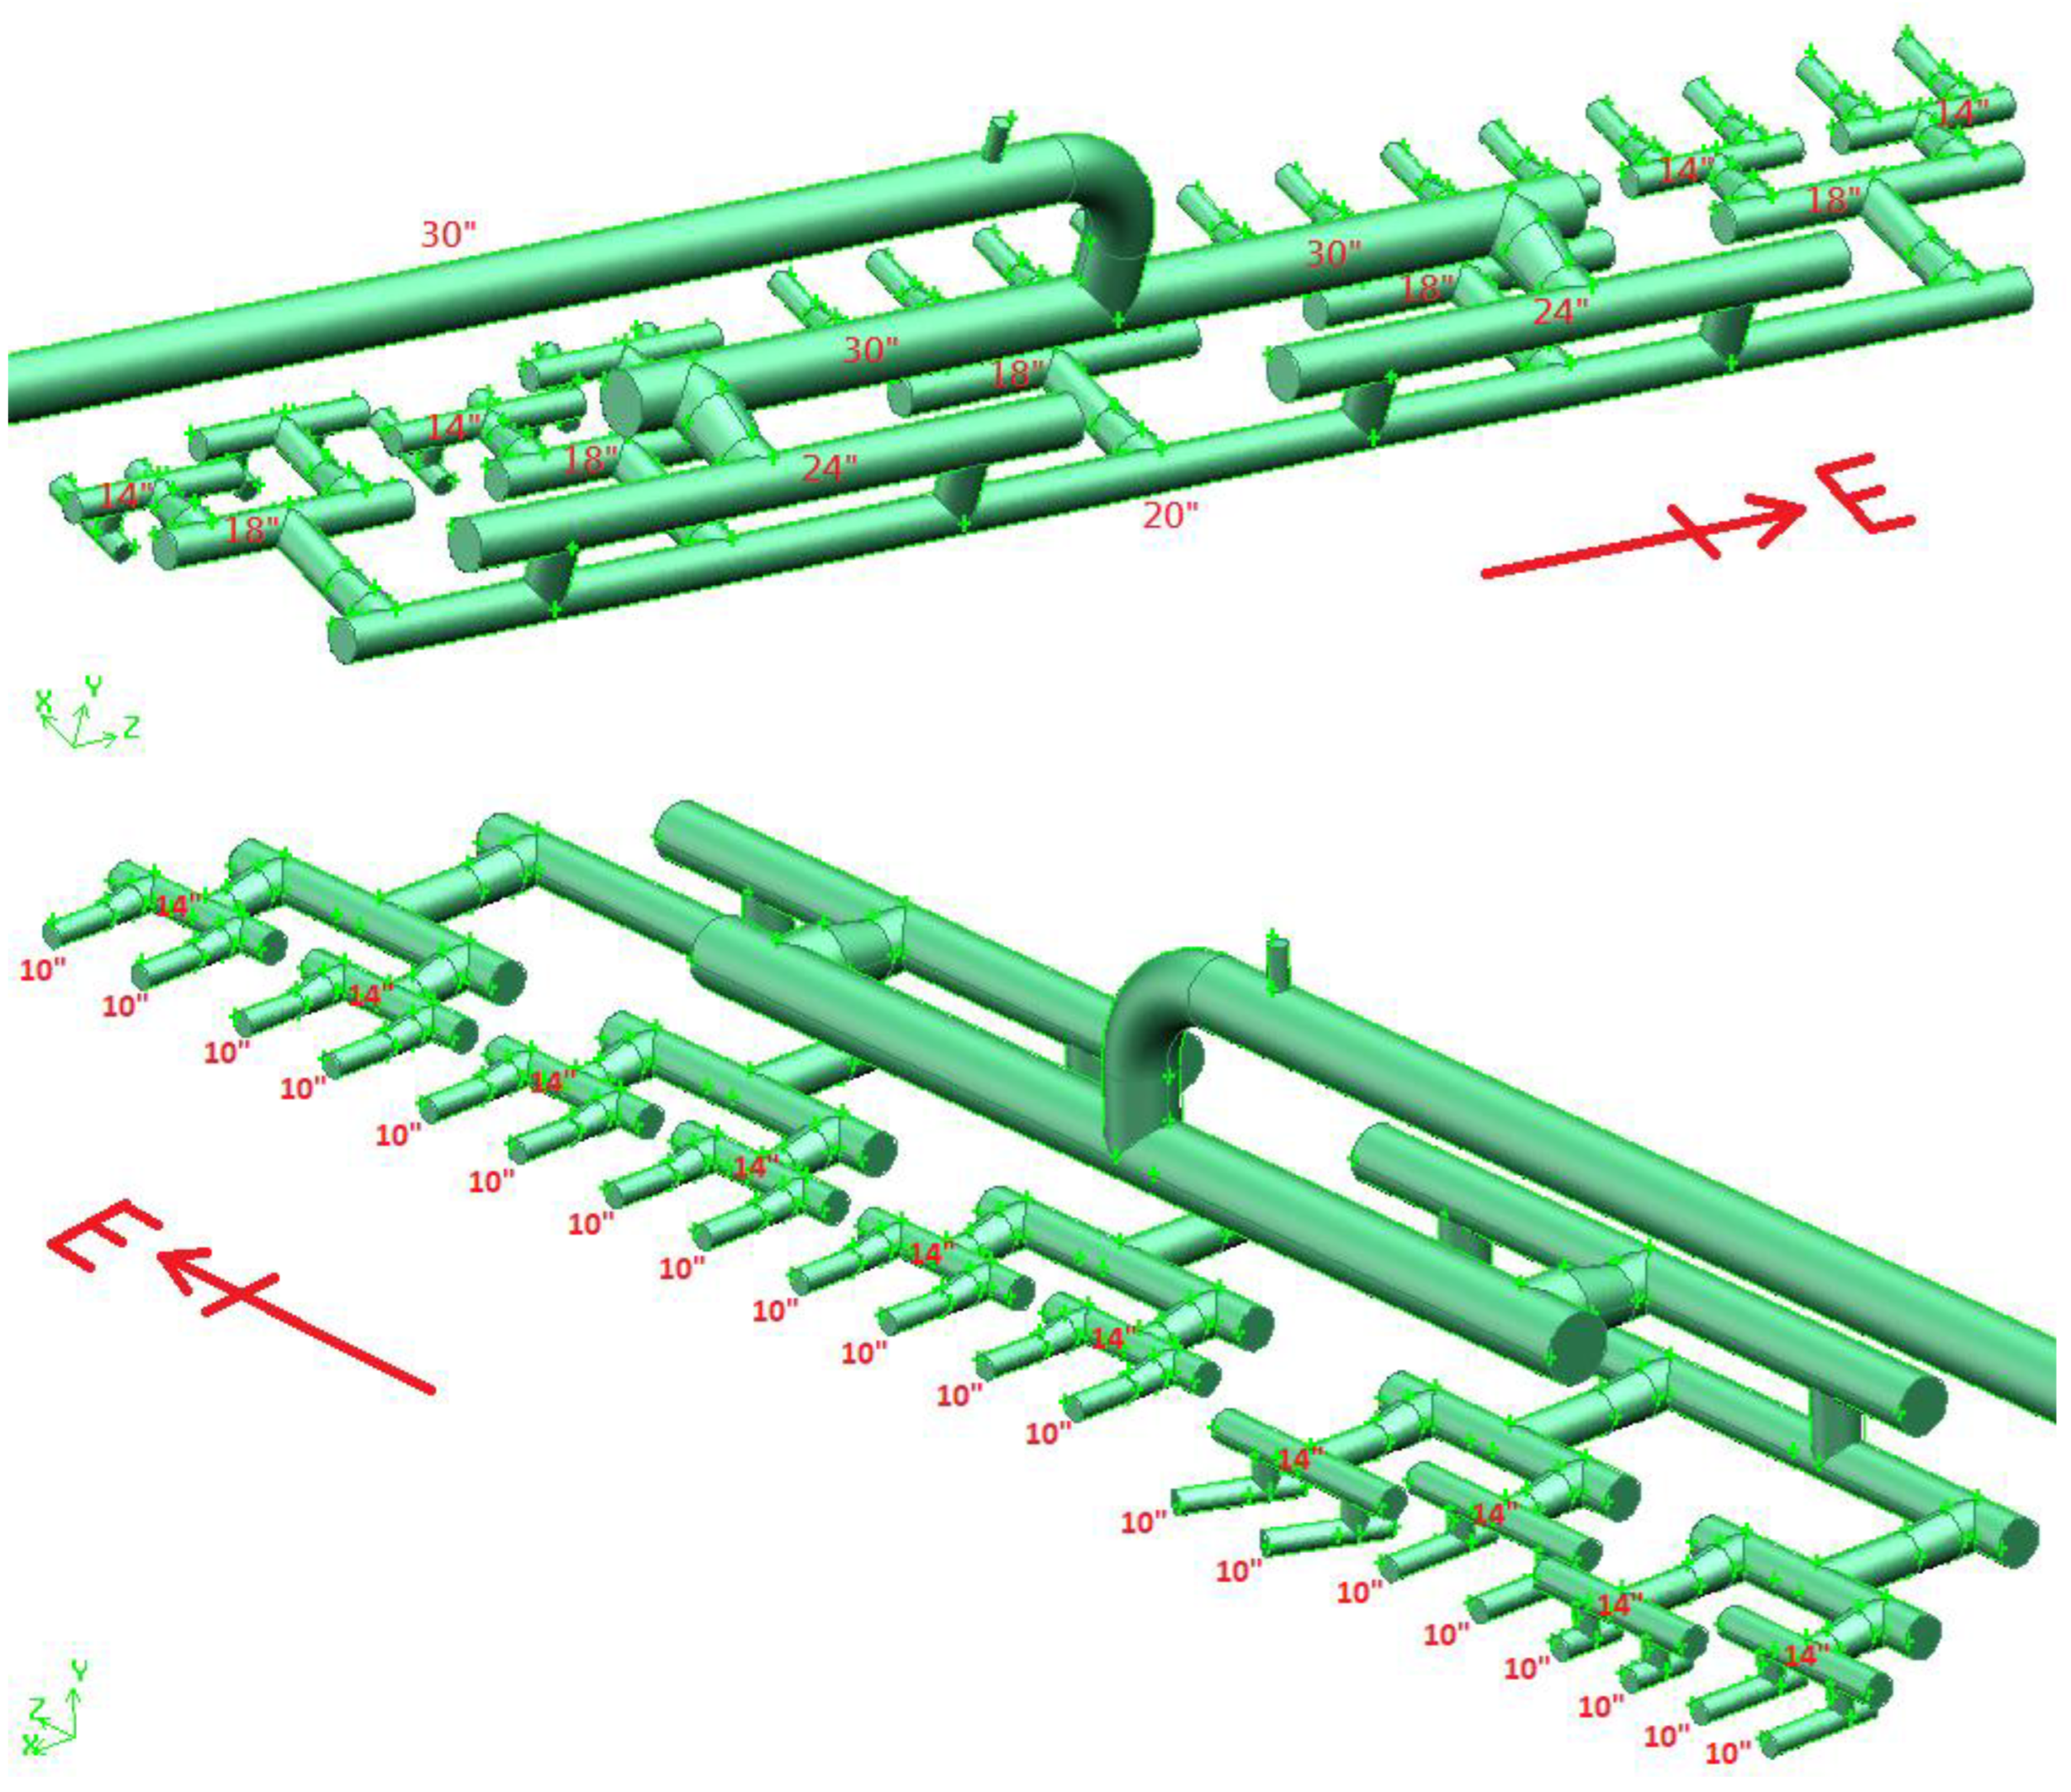
From the review of the above references, it can be seen that most of the DCU-relevant studies focus on optimizing DCU process parameters to improve yields. Very few studies discuss the abnormalities of DCU pipeline systems. In view of the great impact of the DCU pipeline system on production and operation safety, we applied CFD in a previous study [26] to investigate the flow in a DCU fractionator overhead vapor line connected to an air cooler, as shown in Figure 2. Because of the complex geometry and flow development in the pipelines, damage to the pipes has been found. For example, leakage near a T-junction at the east part of the pipeline system was found. Further, the pipe wall thickness at the east part of the pipeline system became thinner. Ref. [26] discussed the causes of the damage and the strategies to alleviate the occurrence of the damage. It is found that when two sections of 24″ pipes are connected and five sections of 18″ pipes are also connected, but the 30″ main pipe is not raised, better force uniformity and lower total force can be obtained. In this paper, we further apply the finite element method to analyze the structure of the DCU pipeline system to confirm the strength of the original and the improved pipeline systems. The purpose of this series study is to explore the flow development and the structural strength of the DCU pipeline system to improve its operational safety. The material of the pipeline system is A106 Gr. B carbon steel with density 7850 kg/m3, thermal expansion coefficient 1.2, Young’s modulus 200 GPa, Poisson ratio 0.3, yield strength 240 MPa, and UTS 415 MPa. The outside diameter (Do) and wall thickness (t) for the pipeline system are listed in Table 1.

2. Numerical Methods

In this study, the numerical model of the pipeline system is established by using SOLIDWORKS(R) Premium 2020 SP0.1 [27], and the ANSYS Workbench 2020 R1 [28] is employed for the stress analysis. SOLIDWORKS 2020 SP0.1 is a computer-aided design software developed by SOLIDWORKS, a subsidiary of DASSAULT SYSTÈMES in Vélizy-Villacoublay, France. It is mainly used in engineering design, product design, and modeling, and is widely used in many industries, including machinery, electronics, construction, automotive, aerospace, etc. ANSYS Workbench 2020 R1 is an engineering simulation software developed by Swanson Analysis Systems in the United States. It has extremely realistic simulation analysis capabilities and is widely used by engineers and designers in various fields, greatly reducing the time required to solve engineering problems.
Structure analysis has been widely used in industrial design. According to the nature of mechanics, structure analysis can be classified as static analysis and dynamic analysis. The latter includes modal analysis and harmonic response analysis. In structure design, static analysis is usually used to evaluate the displacement, strain, and stress of the structure due to inertial forces, e.g., gravity, centrifugal force, etc. Modal analysis is one of the methods of structure dynamic analysis. Mode is an intrinsic vibration characteristic of a linear system. Each mode has its own specific intrinsic vibration frequency, form, and damping ratio. Harmonic response analysis can be used to analyze the response of the structure to the time-variant harmonic wave. Through the solution of frequency domain, the frequency response of the structure to harmonic wave loadings can be obtained to examine if the system can alleviate the resonance, fatigue, or other harmful effects. The solutions of the equations for static and dynamic analyses of a structure can be found in books on structure engineering and mechanics, e.g., [29,30,31].

3. Seismic and Wind Load Analysis

3.1. Analysis Model and Boundary Conditions

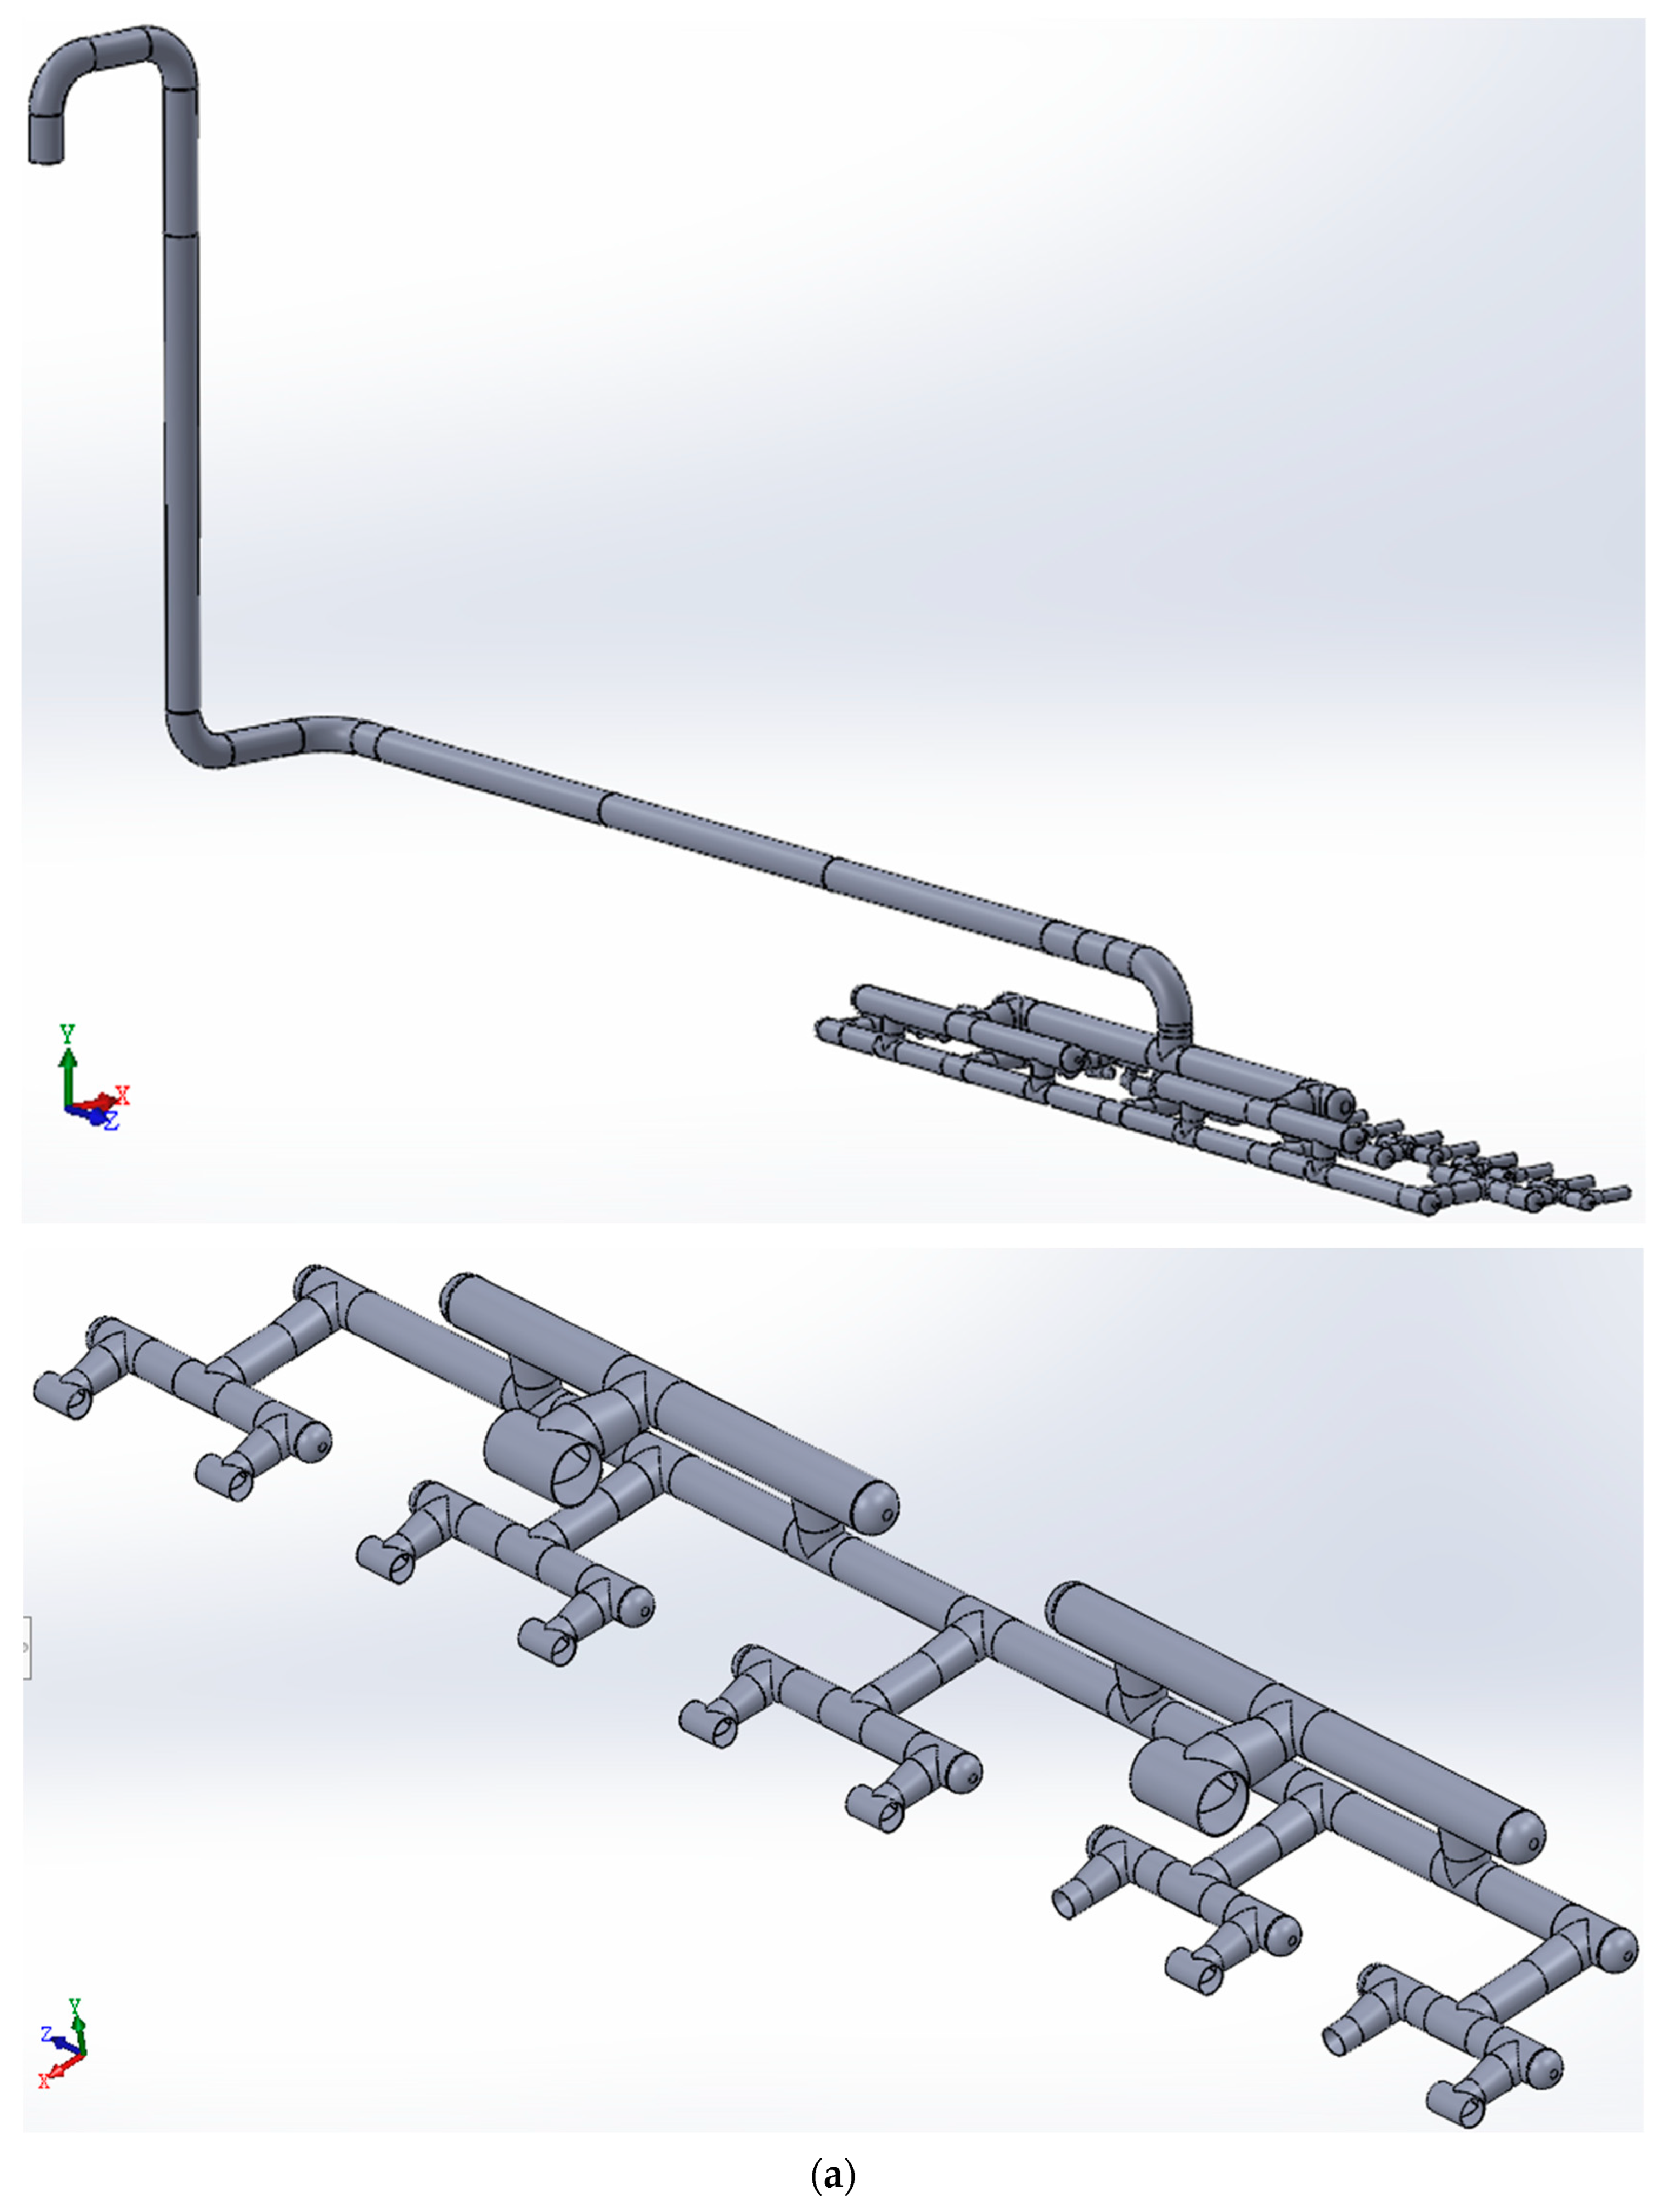
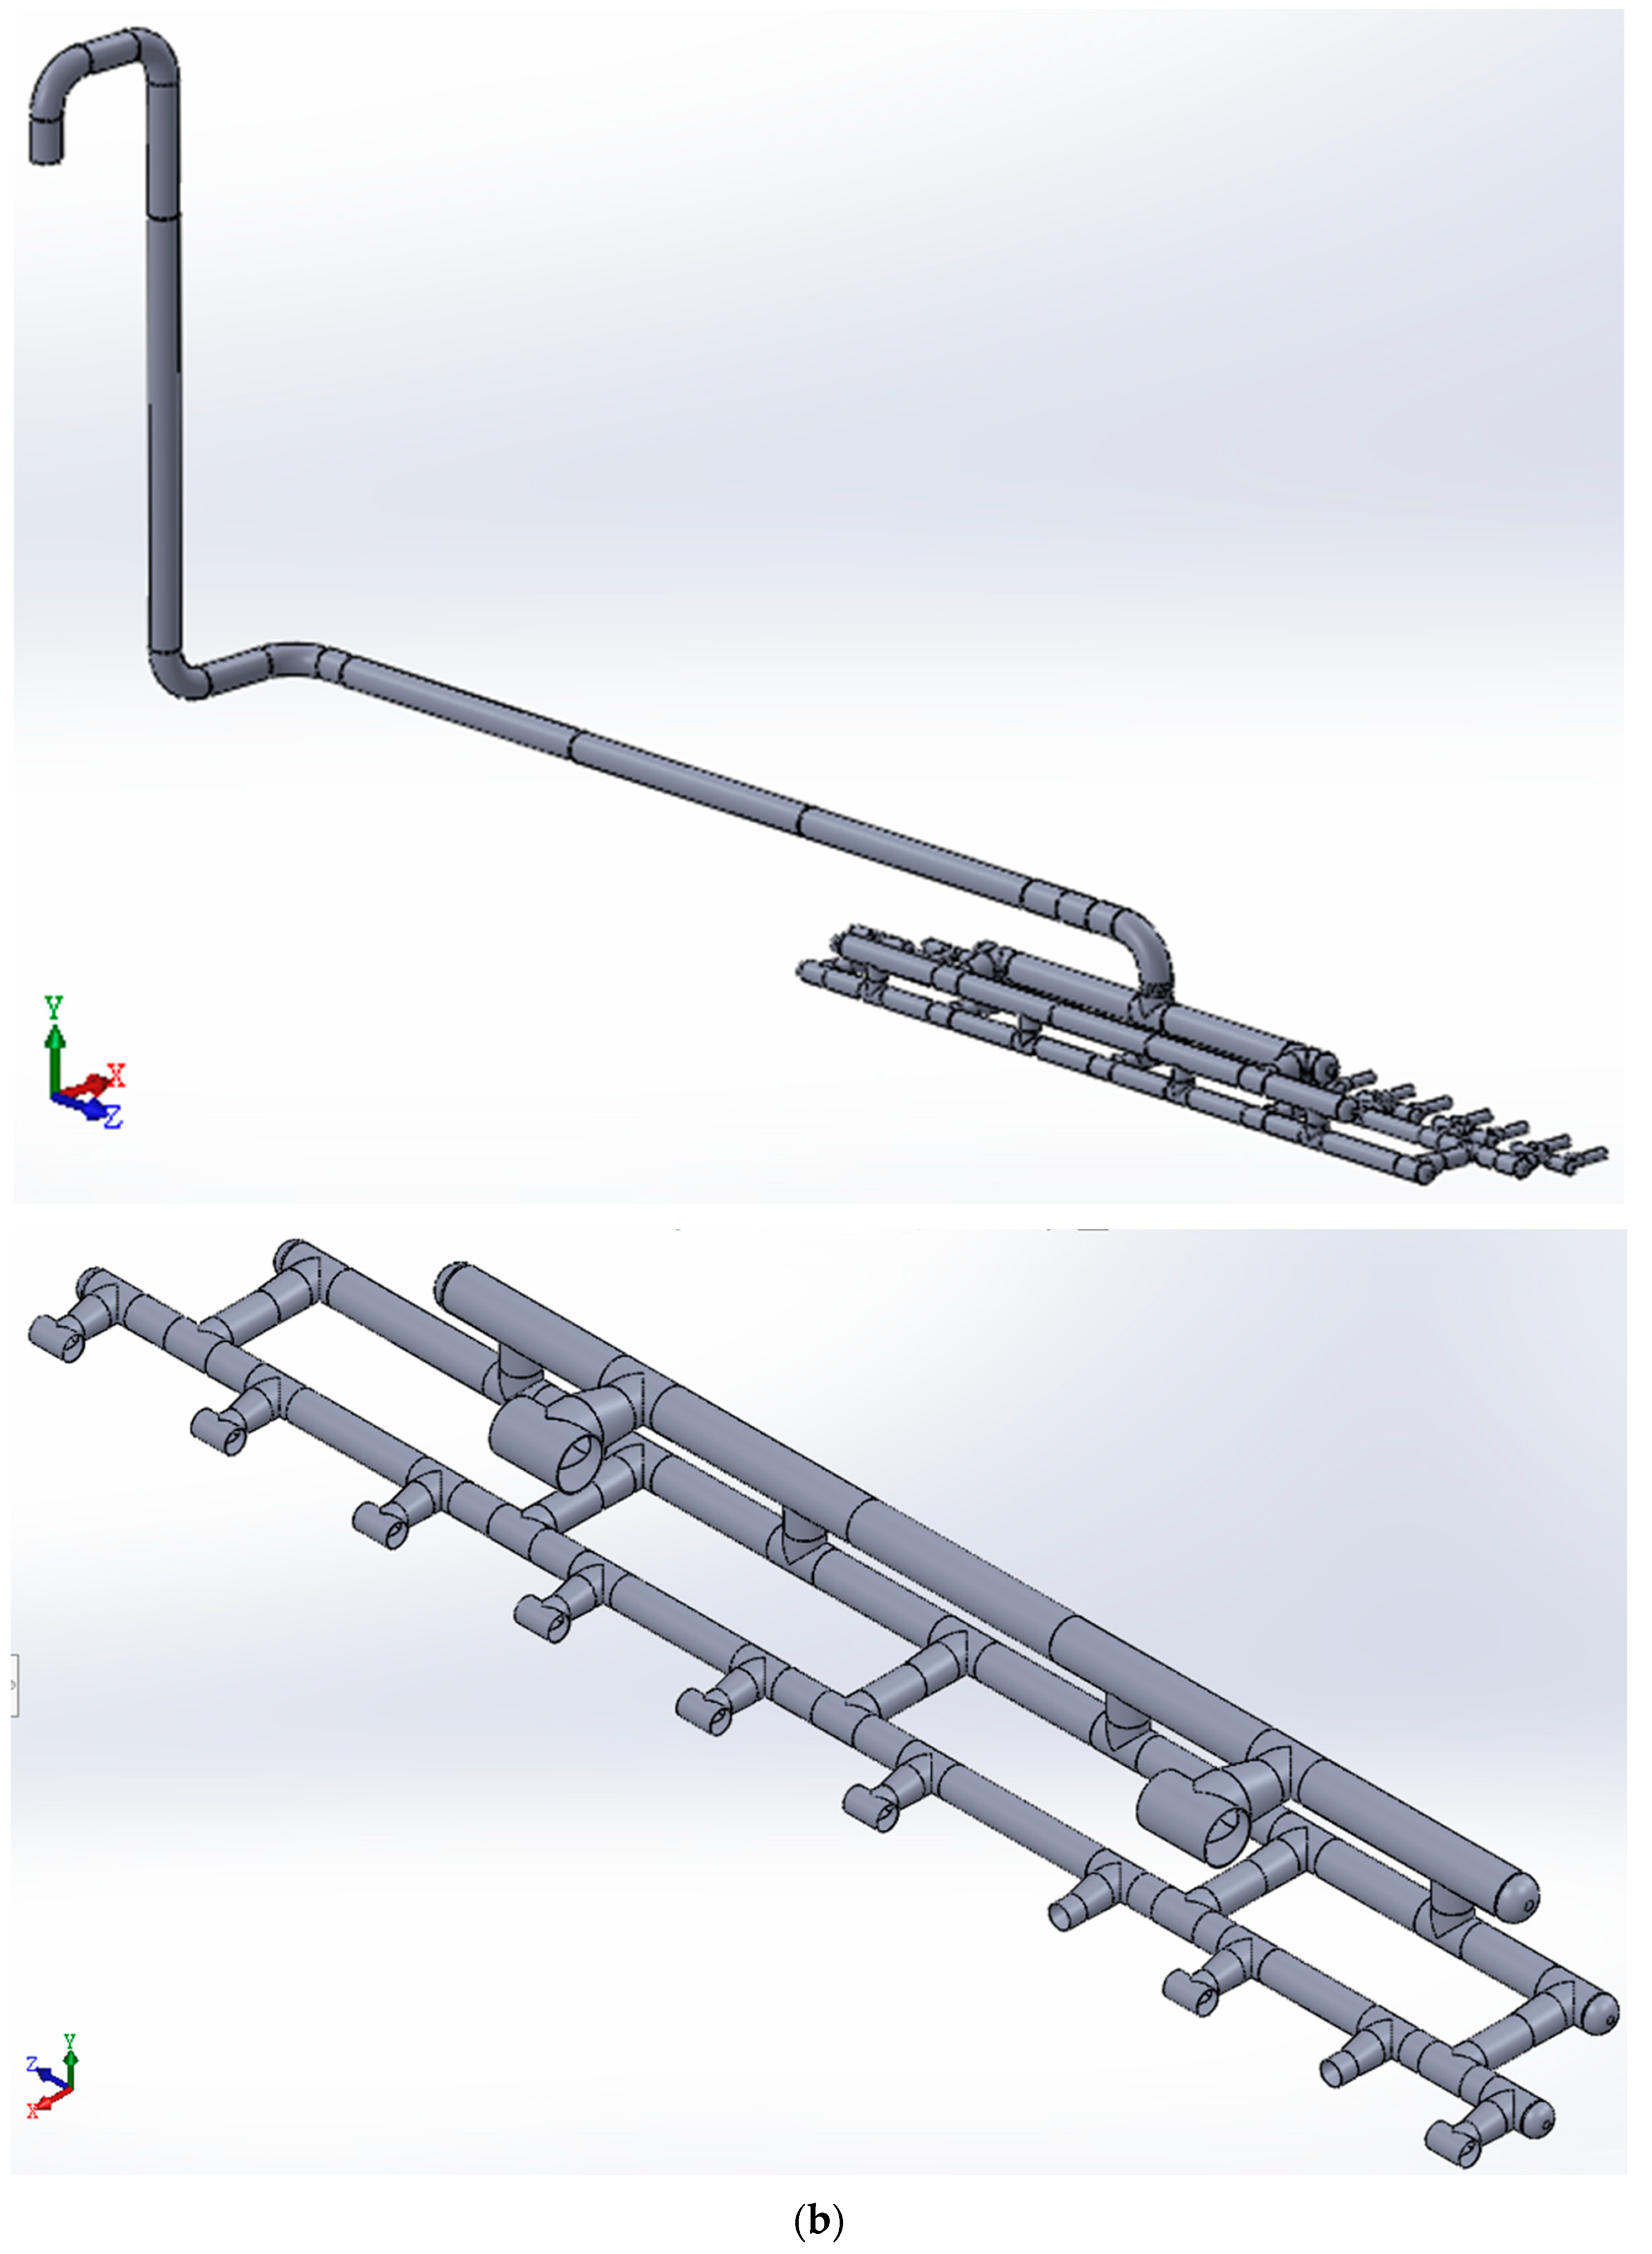
From the results of flow field analysis in our previous study [26], when the two sections of 24″ pipes are connected and the five sections of 18″ pipes are also connected, but the 30″ main pipe is not raised, better force uniformity and lower total force can be obtained. In order to confirm the influence of the connections of the two sections of 24″ pipes and the five sections of 18″ pipes on the vibration of the DCU overhead vapor line, structure analysis of the DCU pipeline system is performed. Figure 3 shows the analysis model of the DCU fractionator overhead vapor line.
In terms of the boundary conditions, the inlet of the pipeline system (large red circle in Figure 4) is connected to the fractionator outlet nozzle and is considered a fixed point, while the 20 pipeline outlets (small red circles in Figure 4) are connected to the inlet nozzles of the air cooler and are also considered as fixed points. In addition, the green marks indicate the support positions and are fixed points, too.

3.2. Analysis of Seismic and Wind Effects

There are three main factors that cause pipeline vibration: (1) wind, (2) earthquake, and (3) equipment (e.g., pump). Owing to the lack of actual data, the equipment factors are not considered in this study. The vibrations caused by earthquakes and winds are considered below.
In terms of the wind effect on the pipeline vibration, the main effect is the horizontal acceleration caused by the wind pressure on the pipeline system, as shown in Table 2.
The frontal area (in north–south direction) of the pipeline system is about 60.3 m2. The mass of the pipeline system is about 32,189 kg. The horizontal acceleration caused by the wind load above magnitude 2 (inclusive) is taken from the upper limit of the wind load for each wind magnitude, as listed in Table 3.
In terms of the seismic impact, the seismic classification is listed in Table 4.
In this study, the upper limit of the acceleration for each earthquake magnitude is used as the acceleration. For the magnitude 7 earthquake, 1000 gal (10 m/s2) is taken as the value of acceleration for the subsequent analysis.

3.2.1. Vibration Caused by a Magnitude 2 Wind or a Magnitude 1 Earthquake

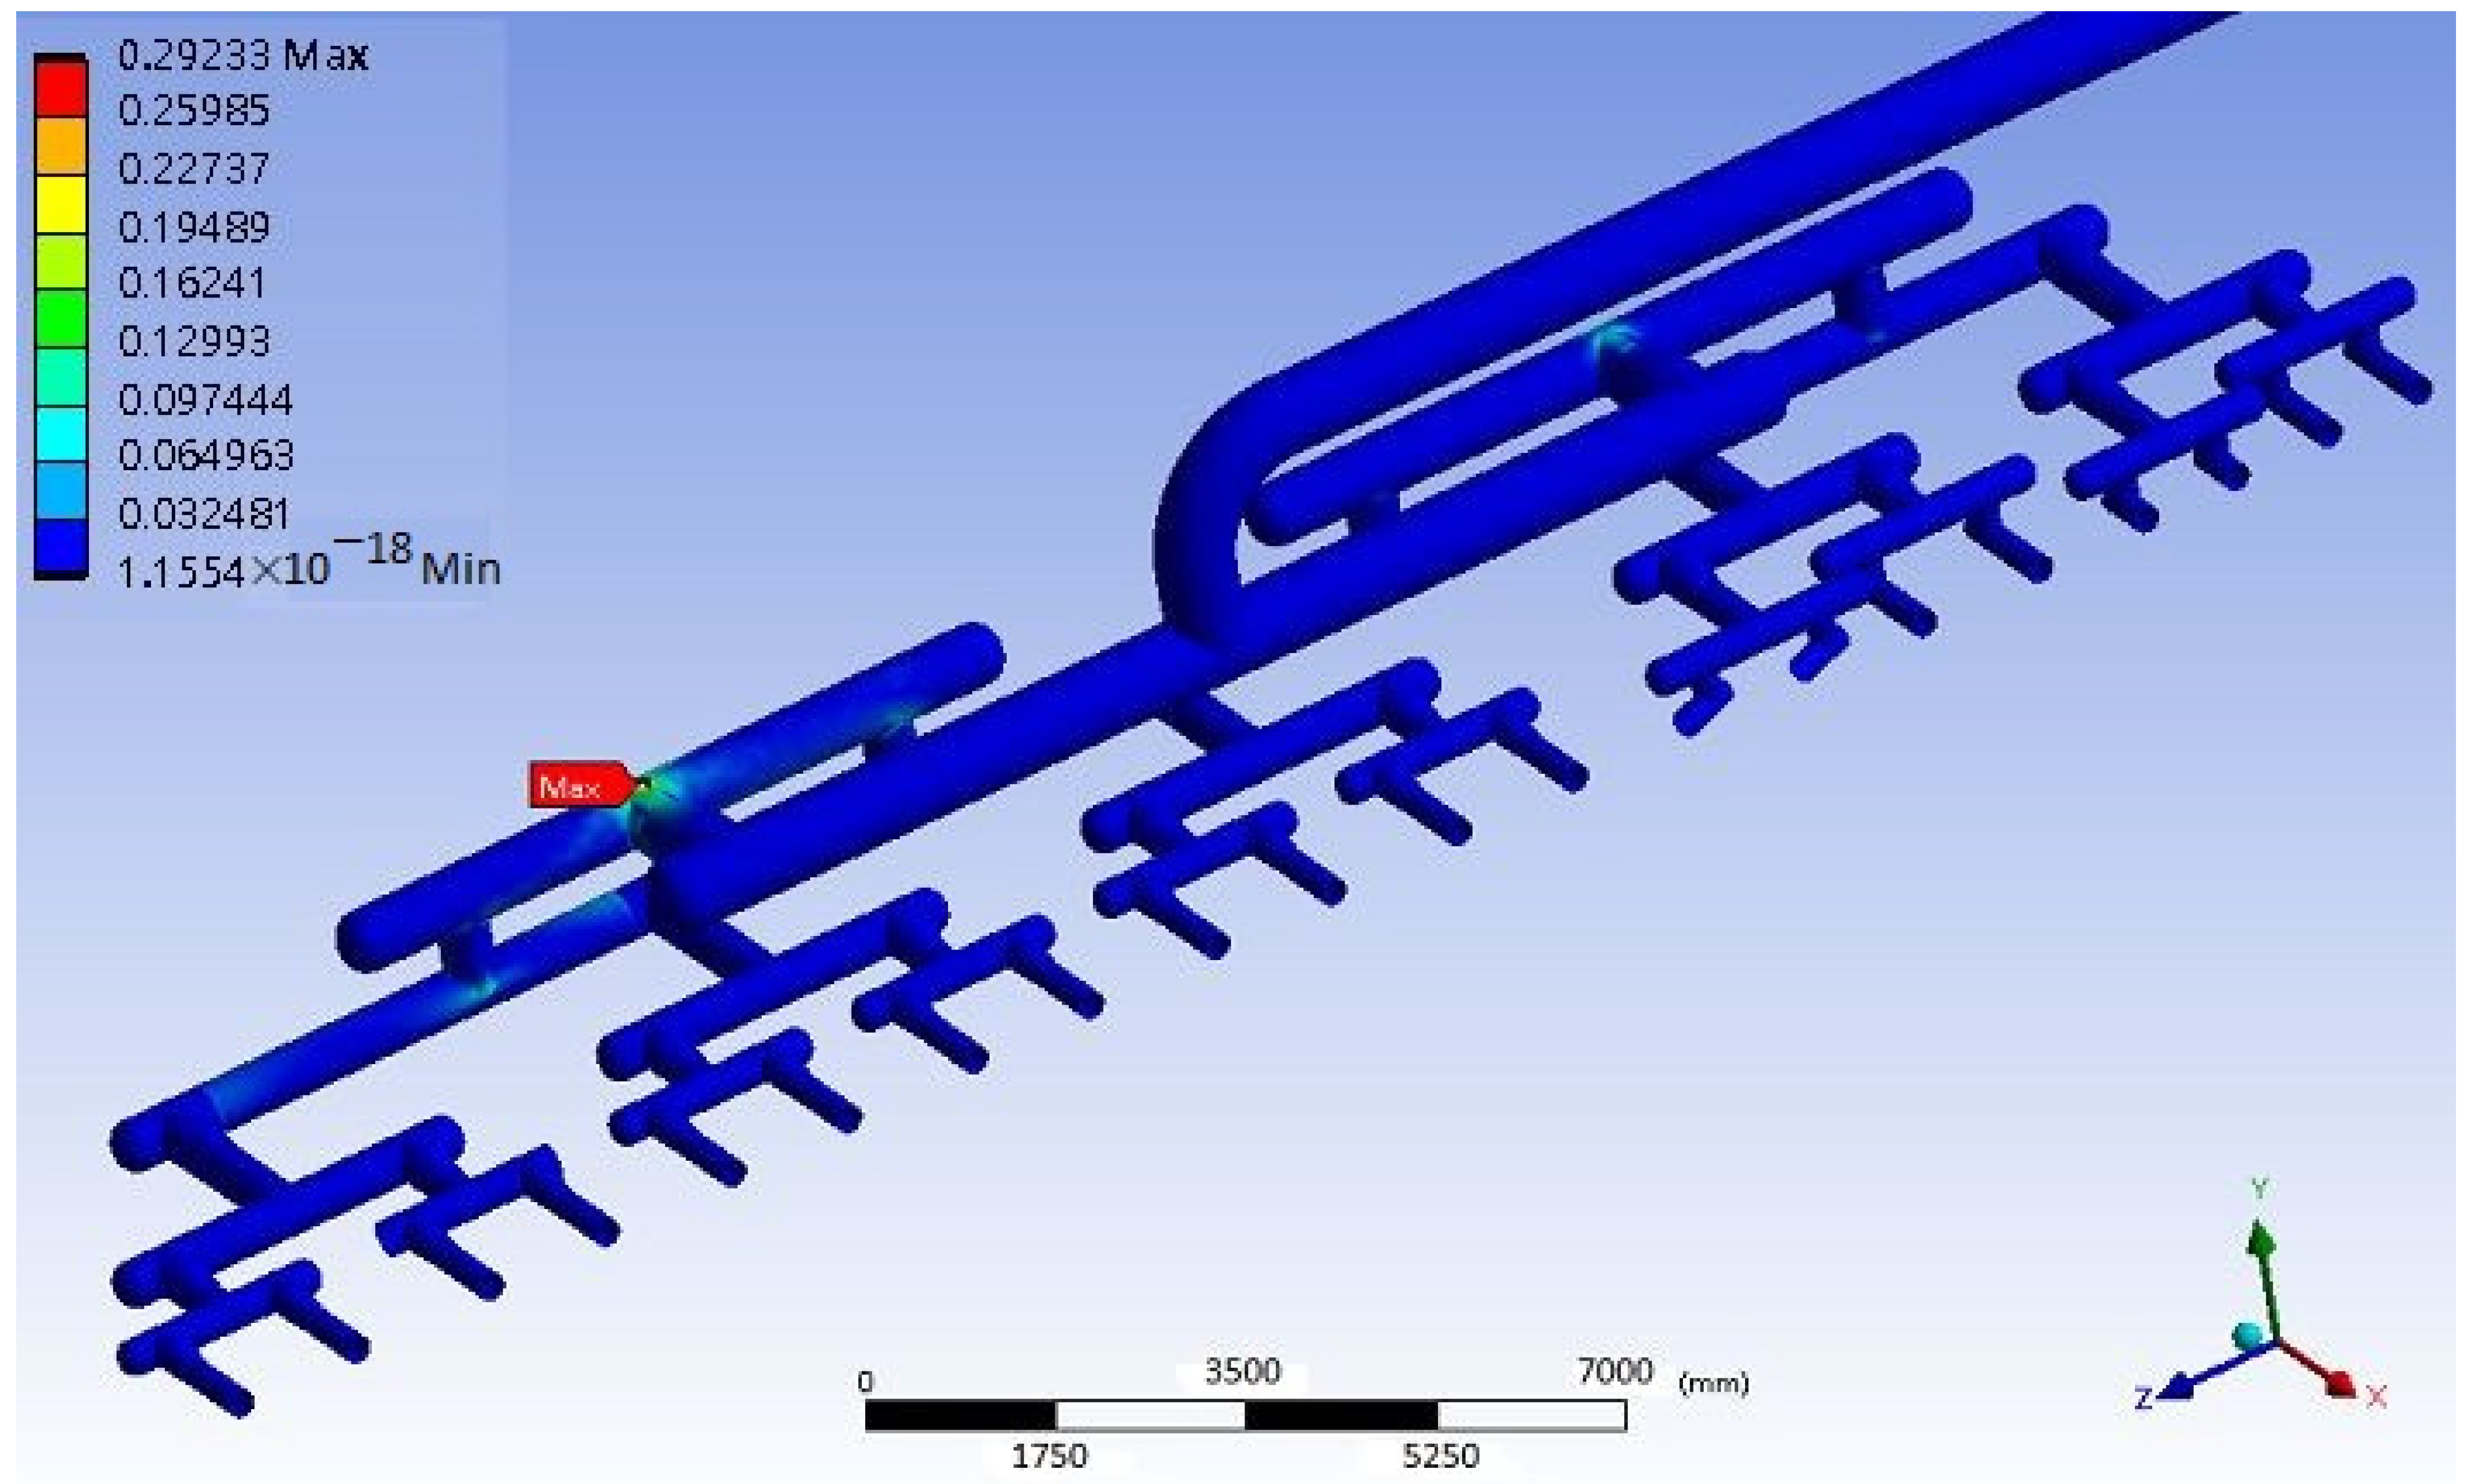
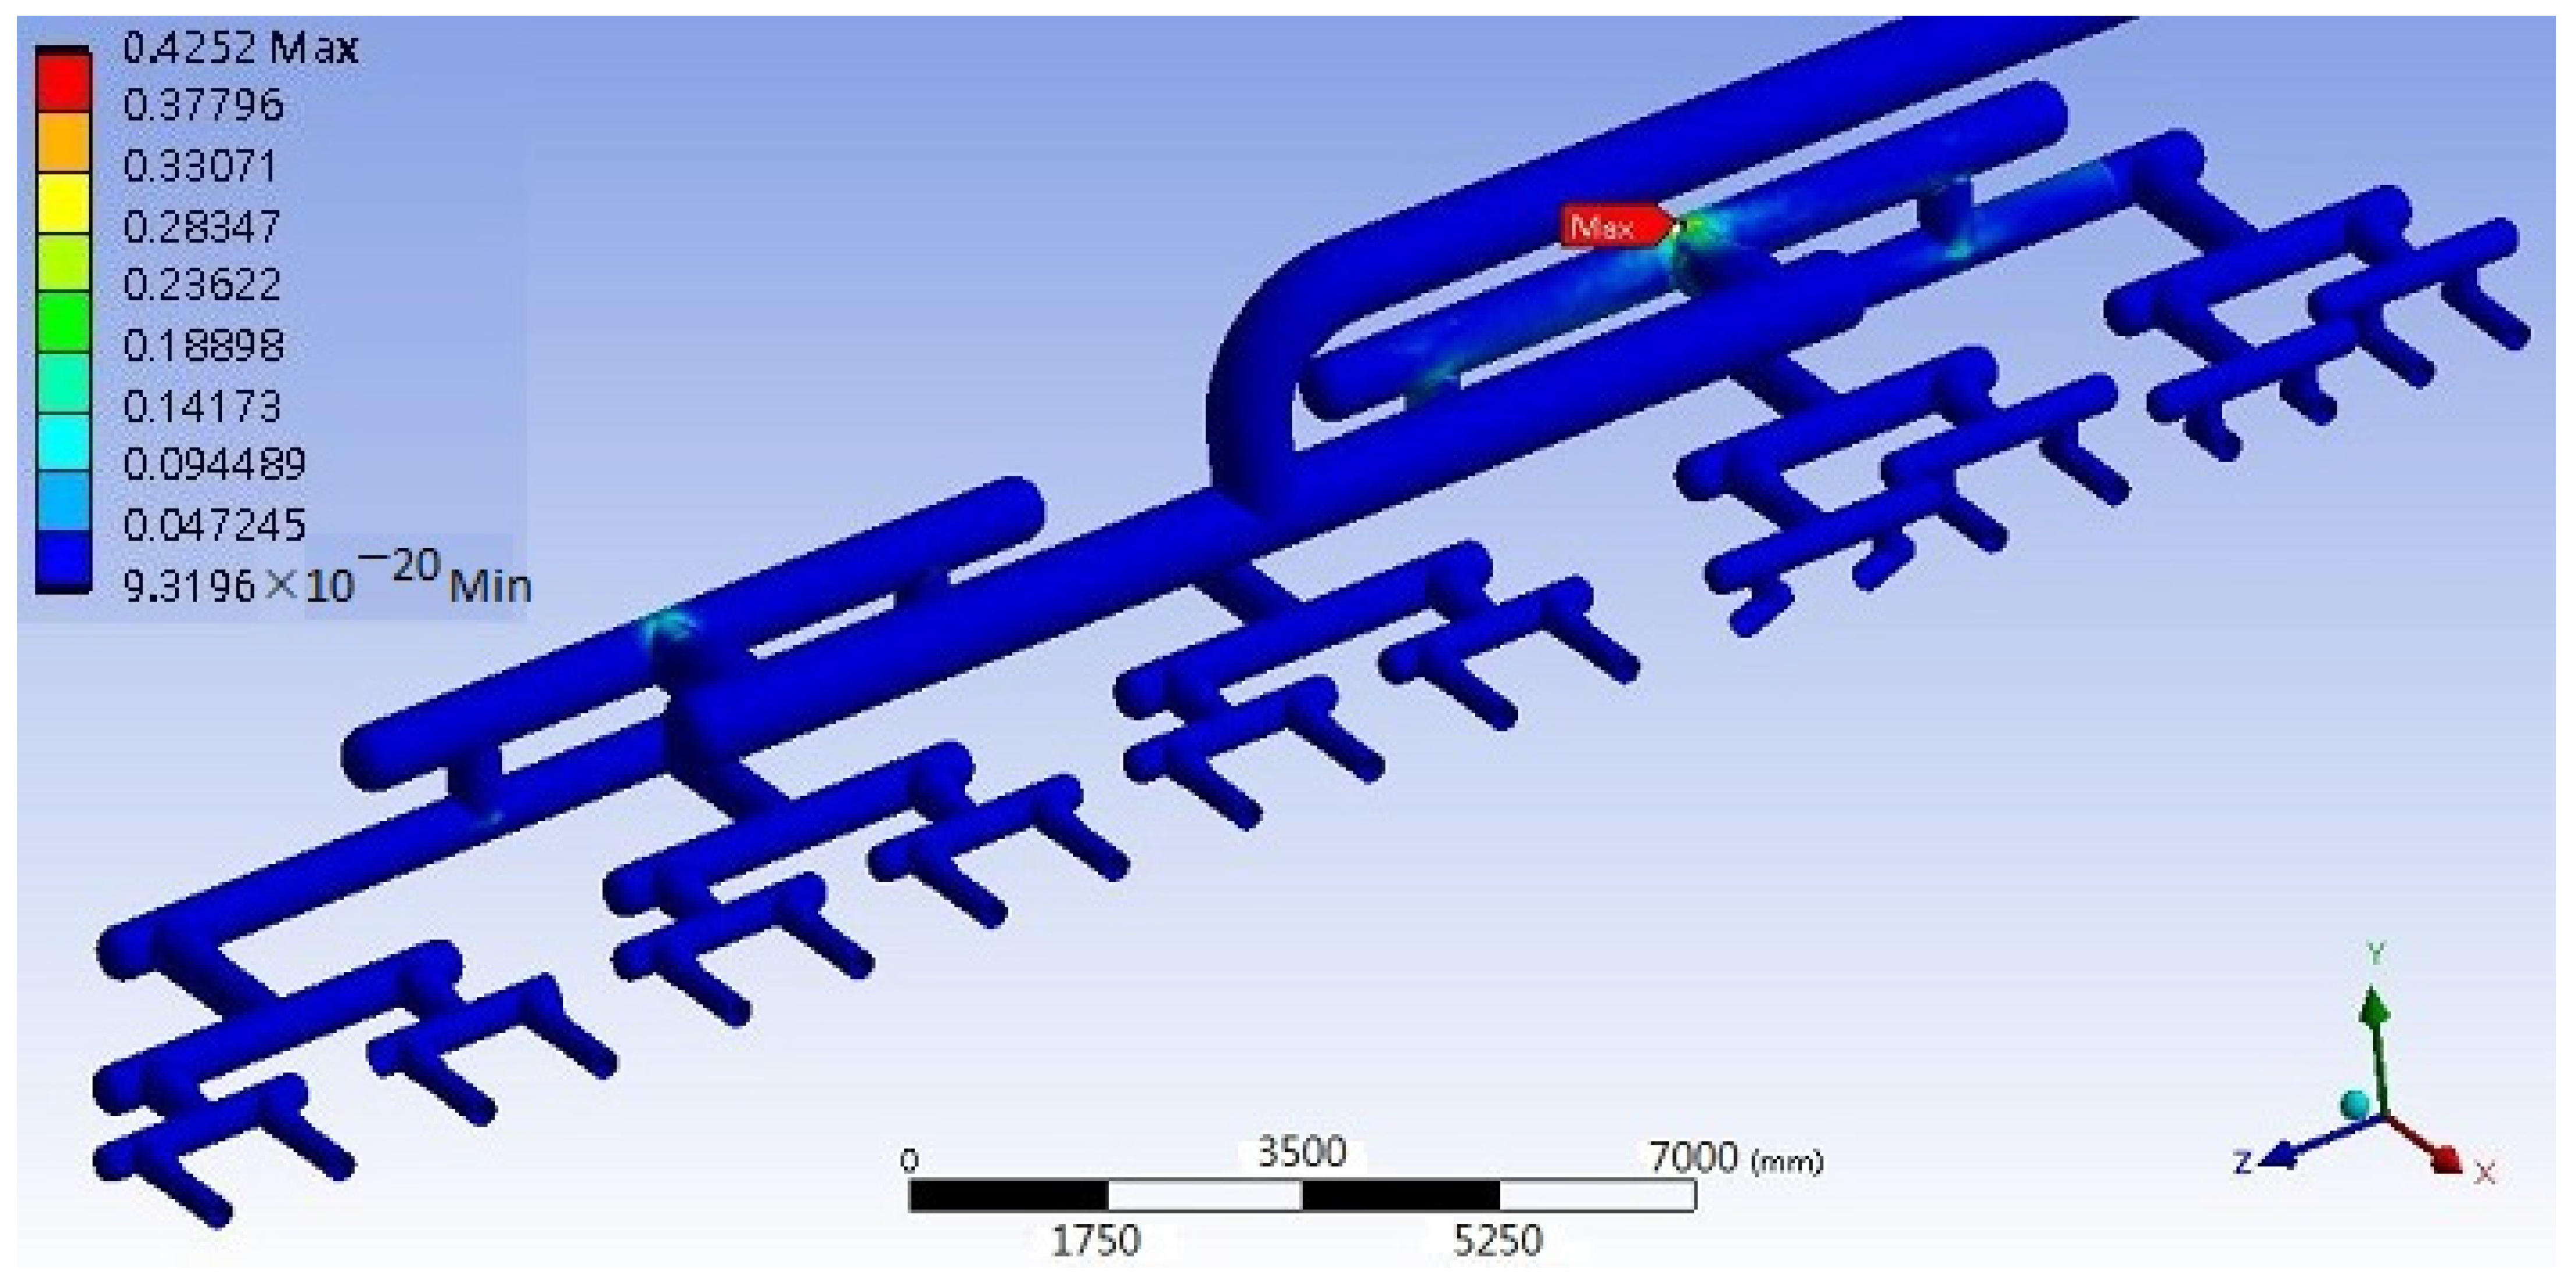
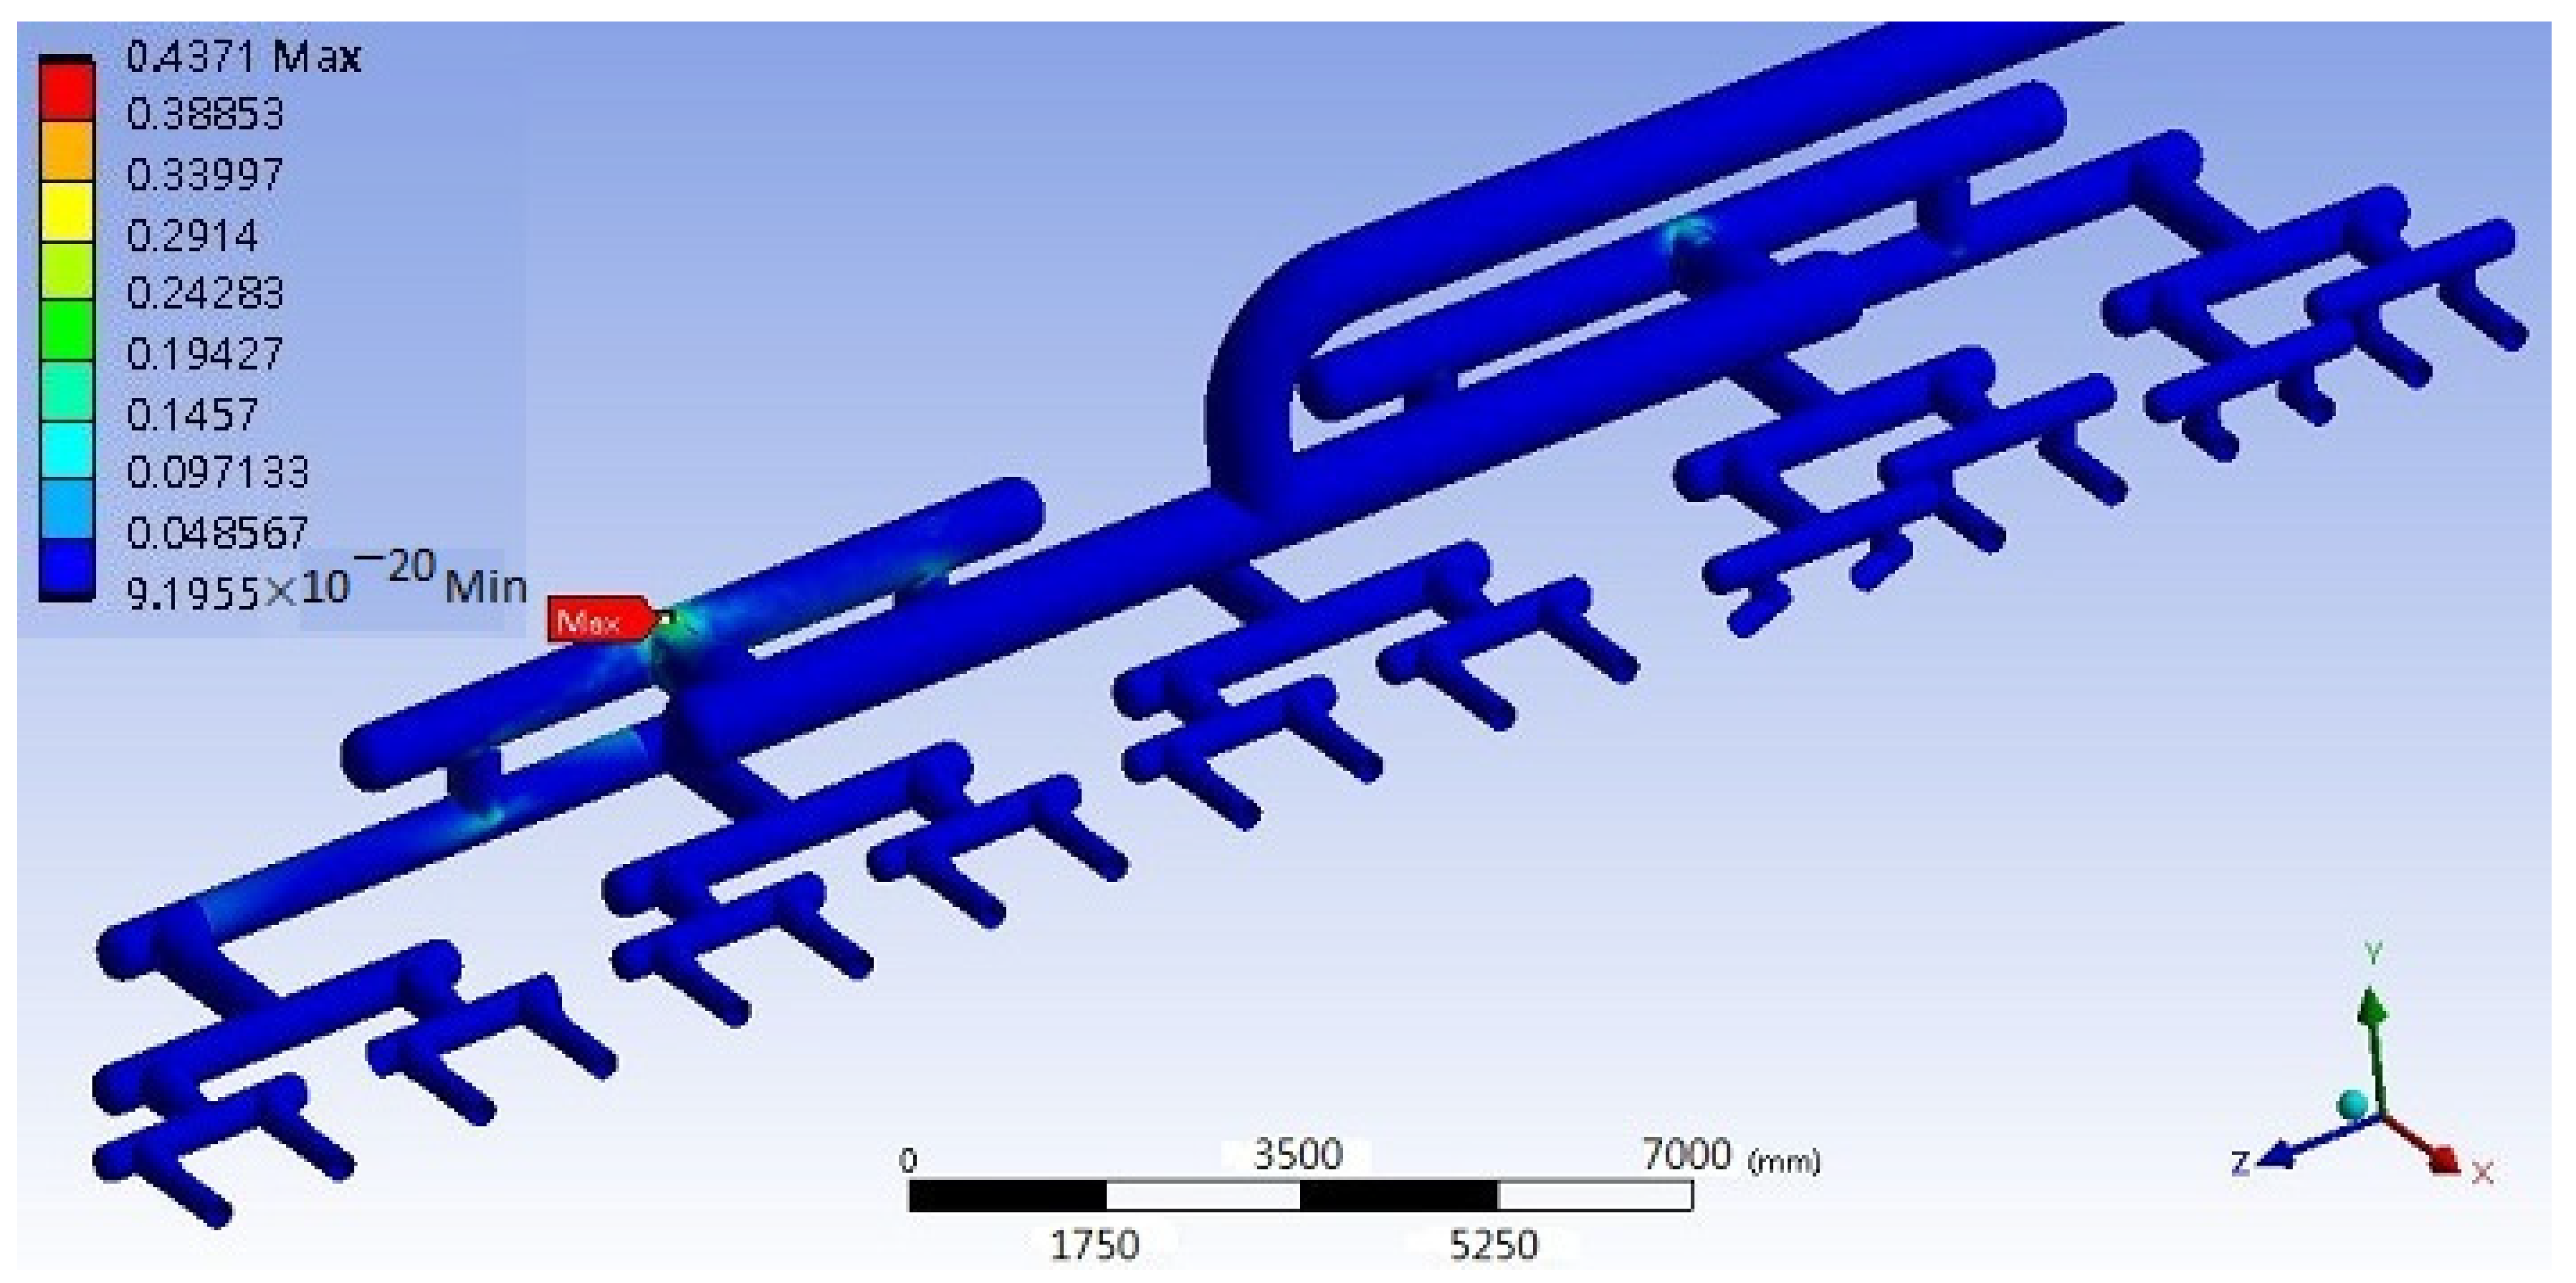
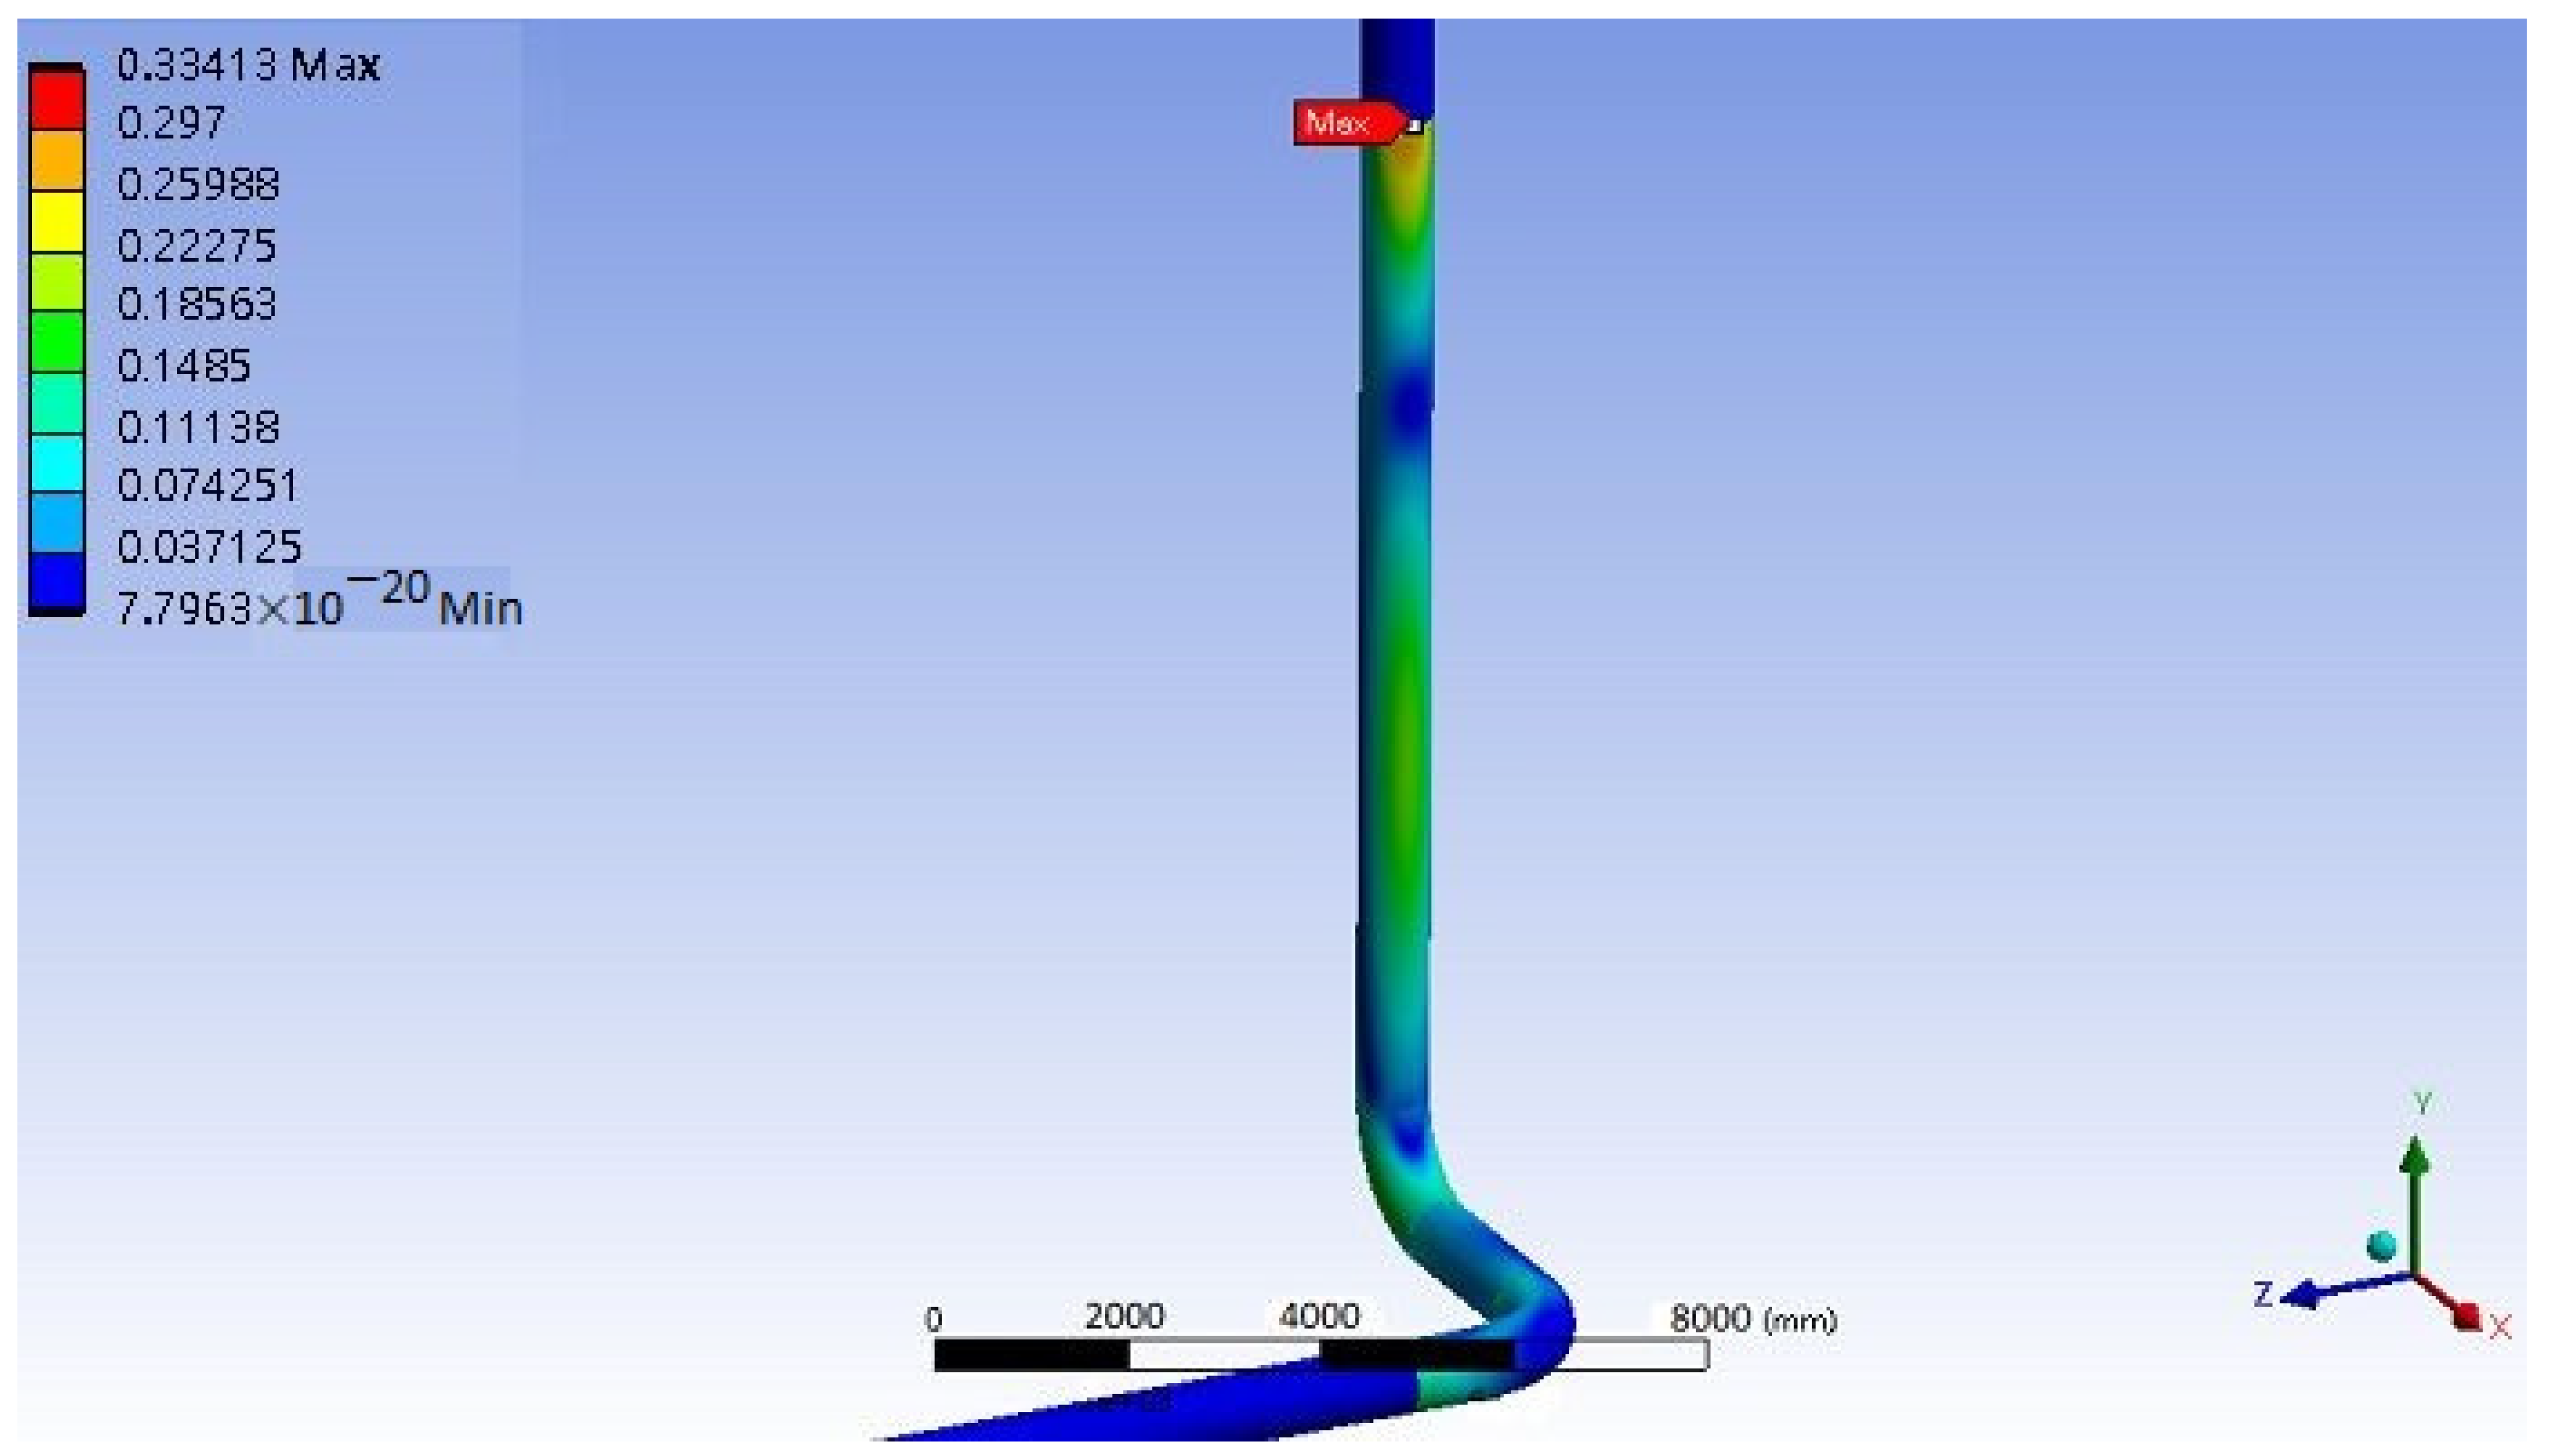
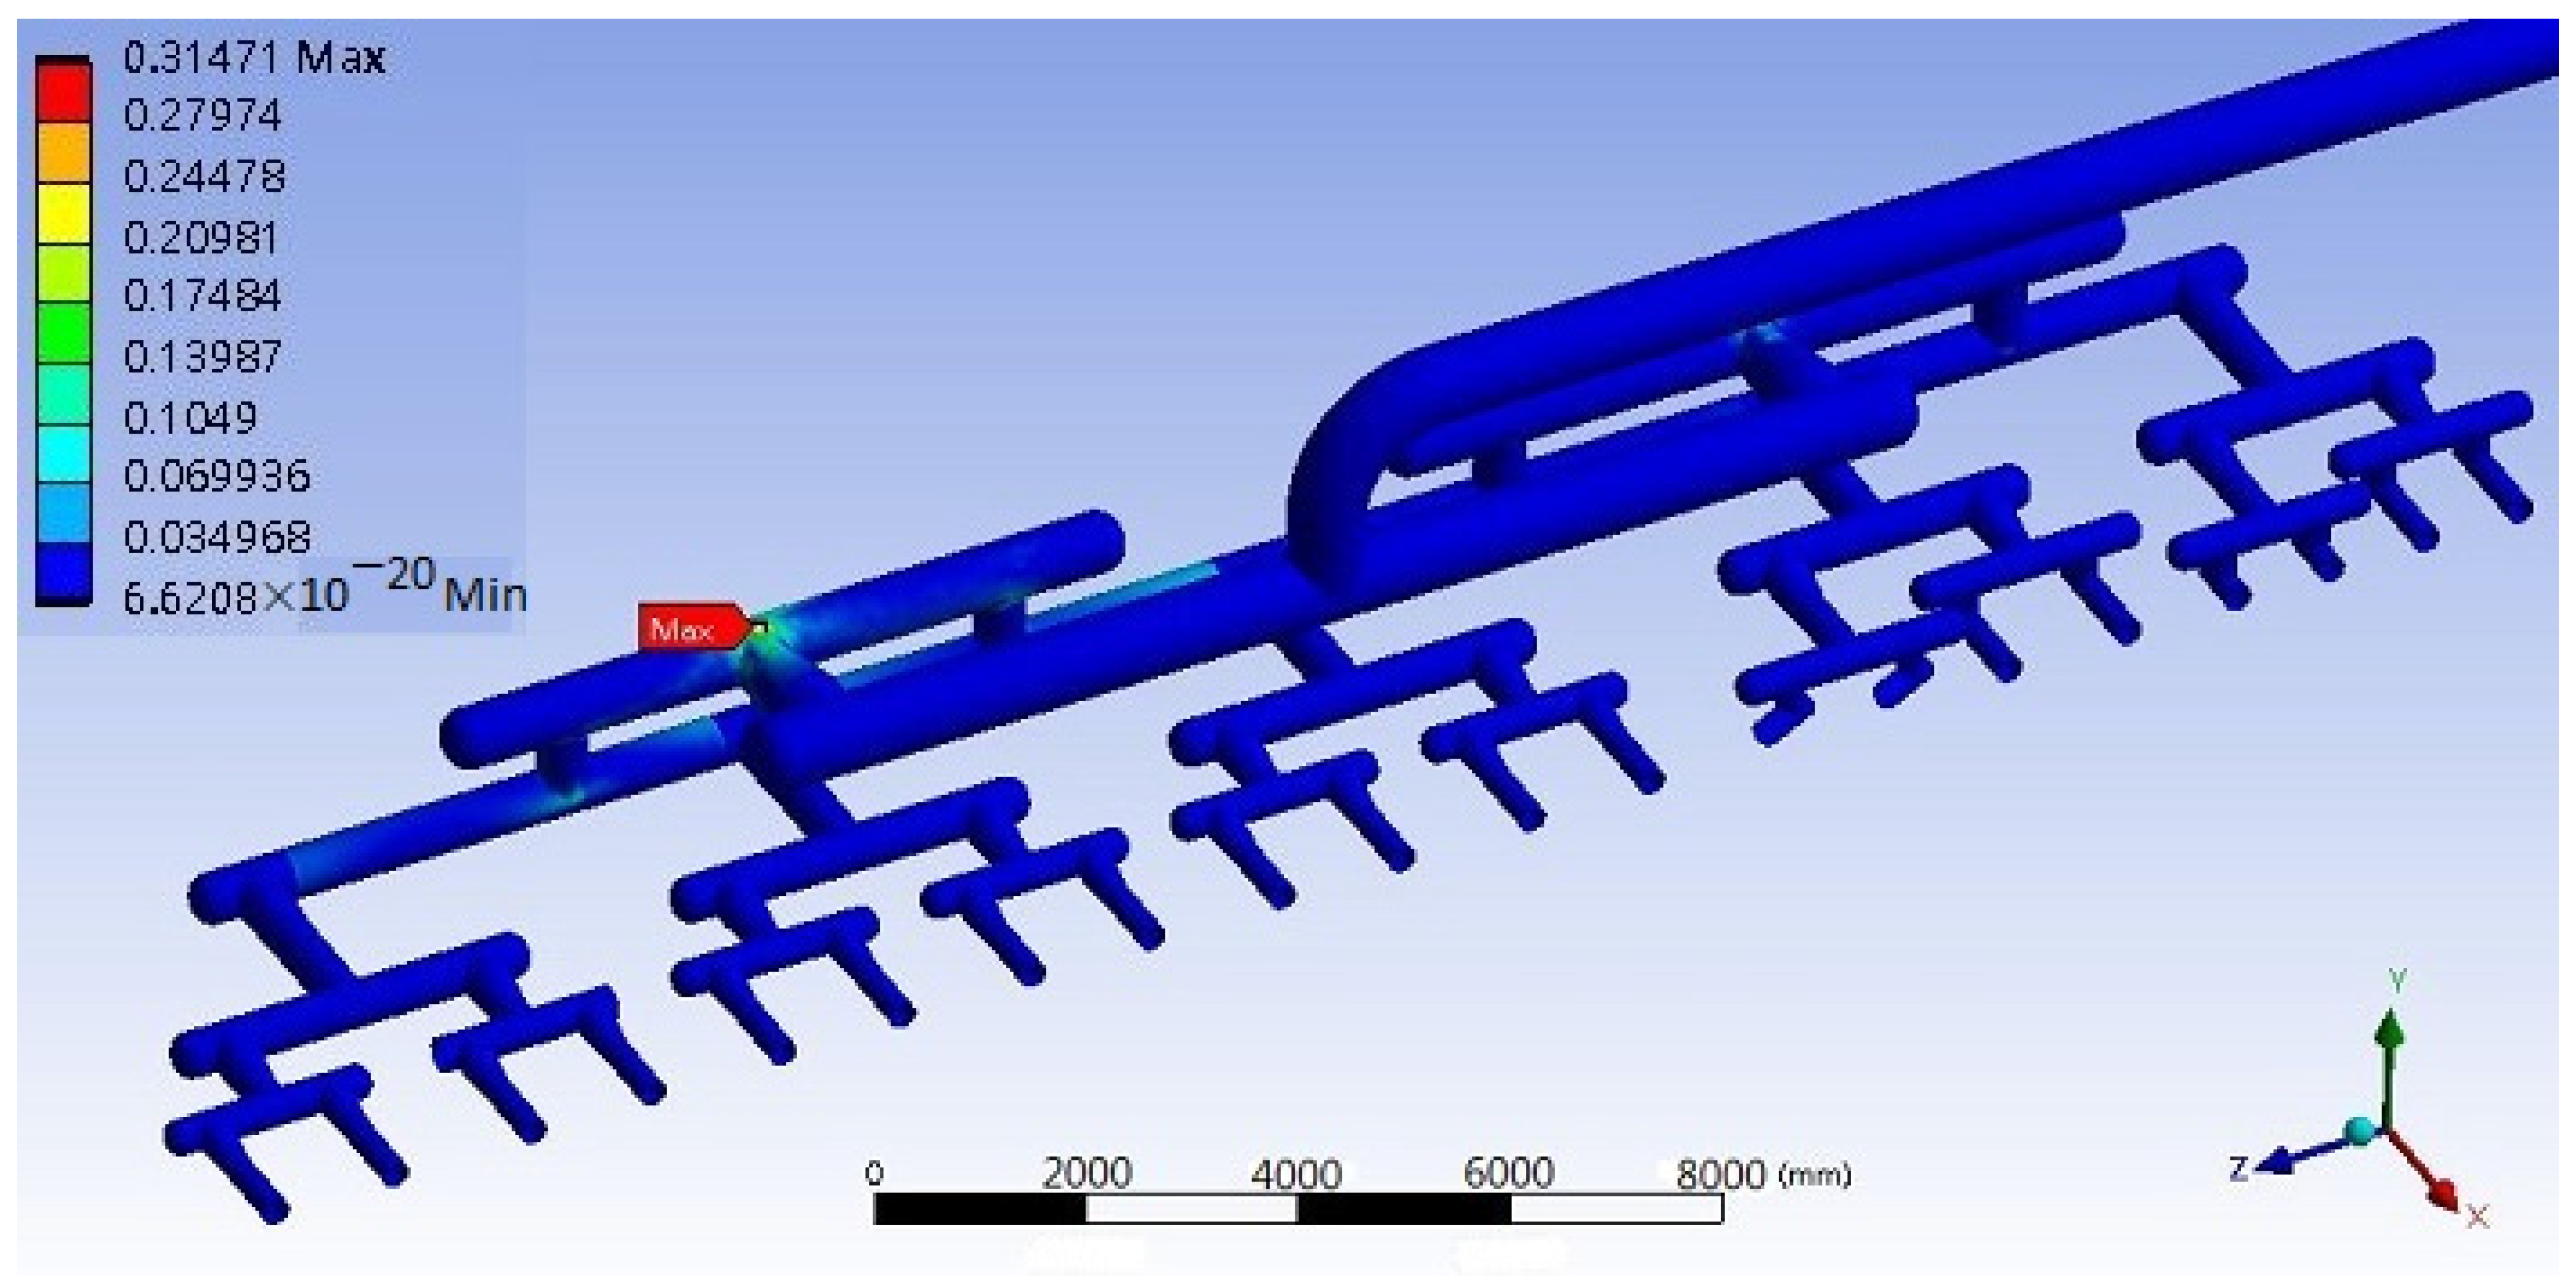
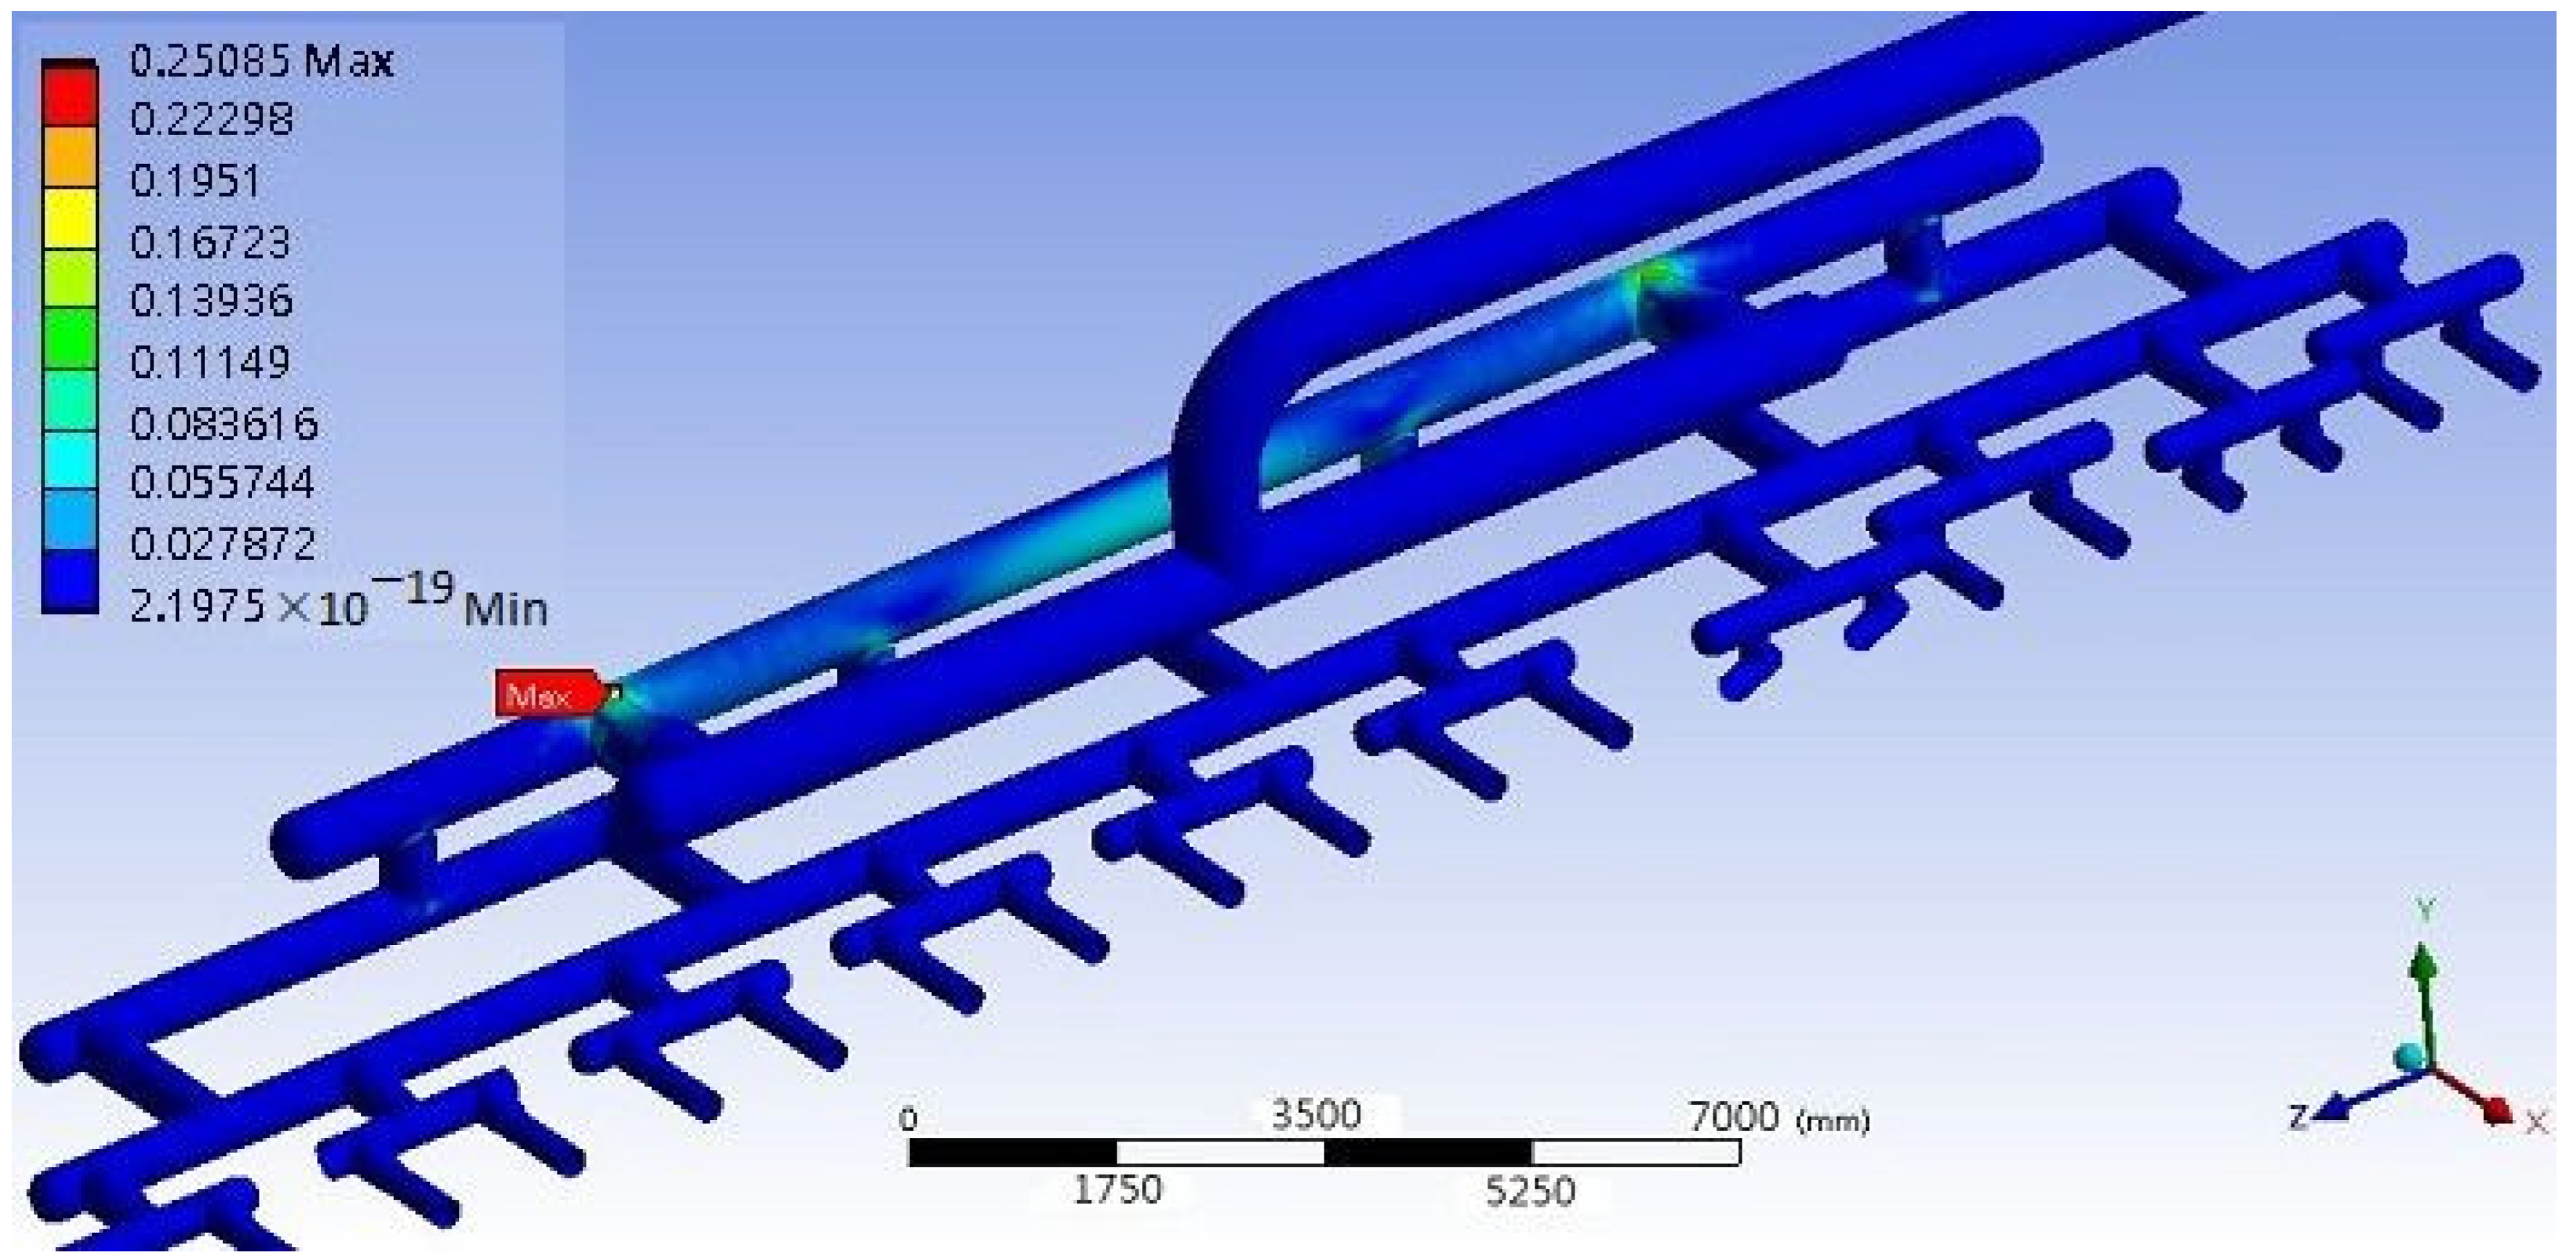
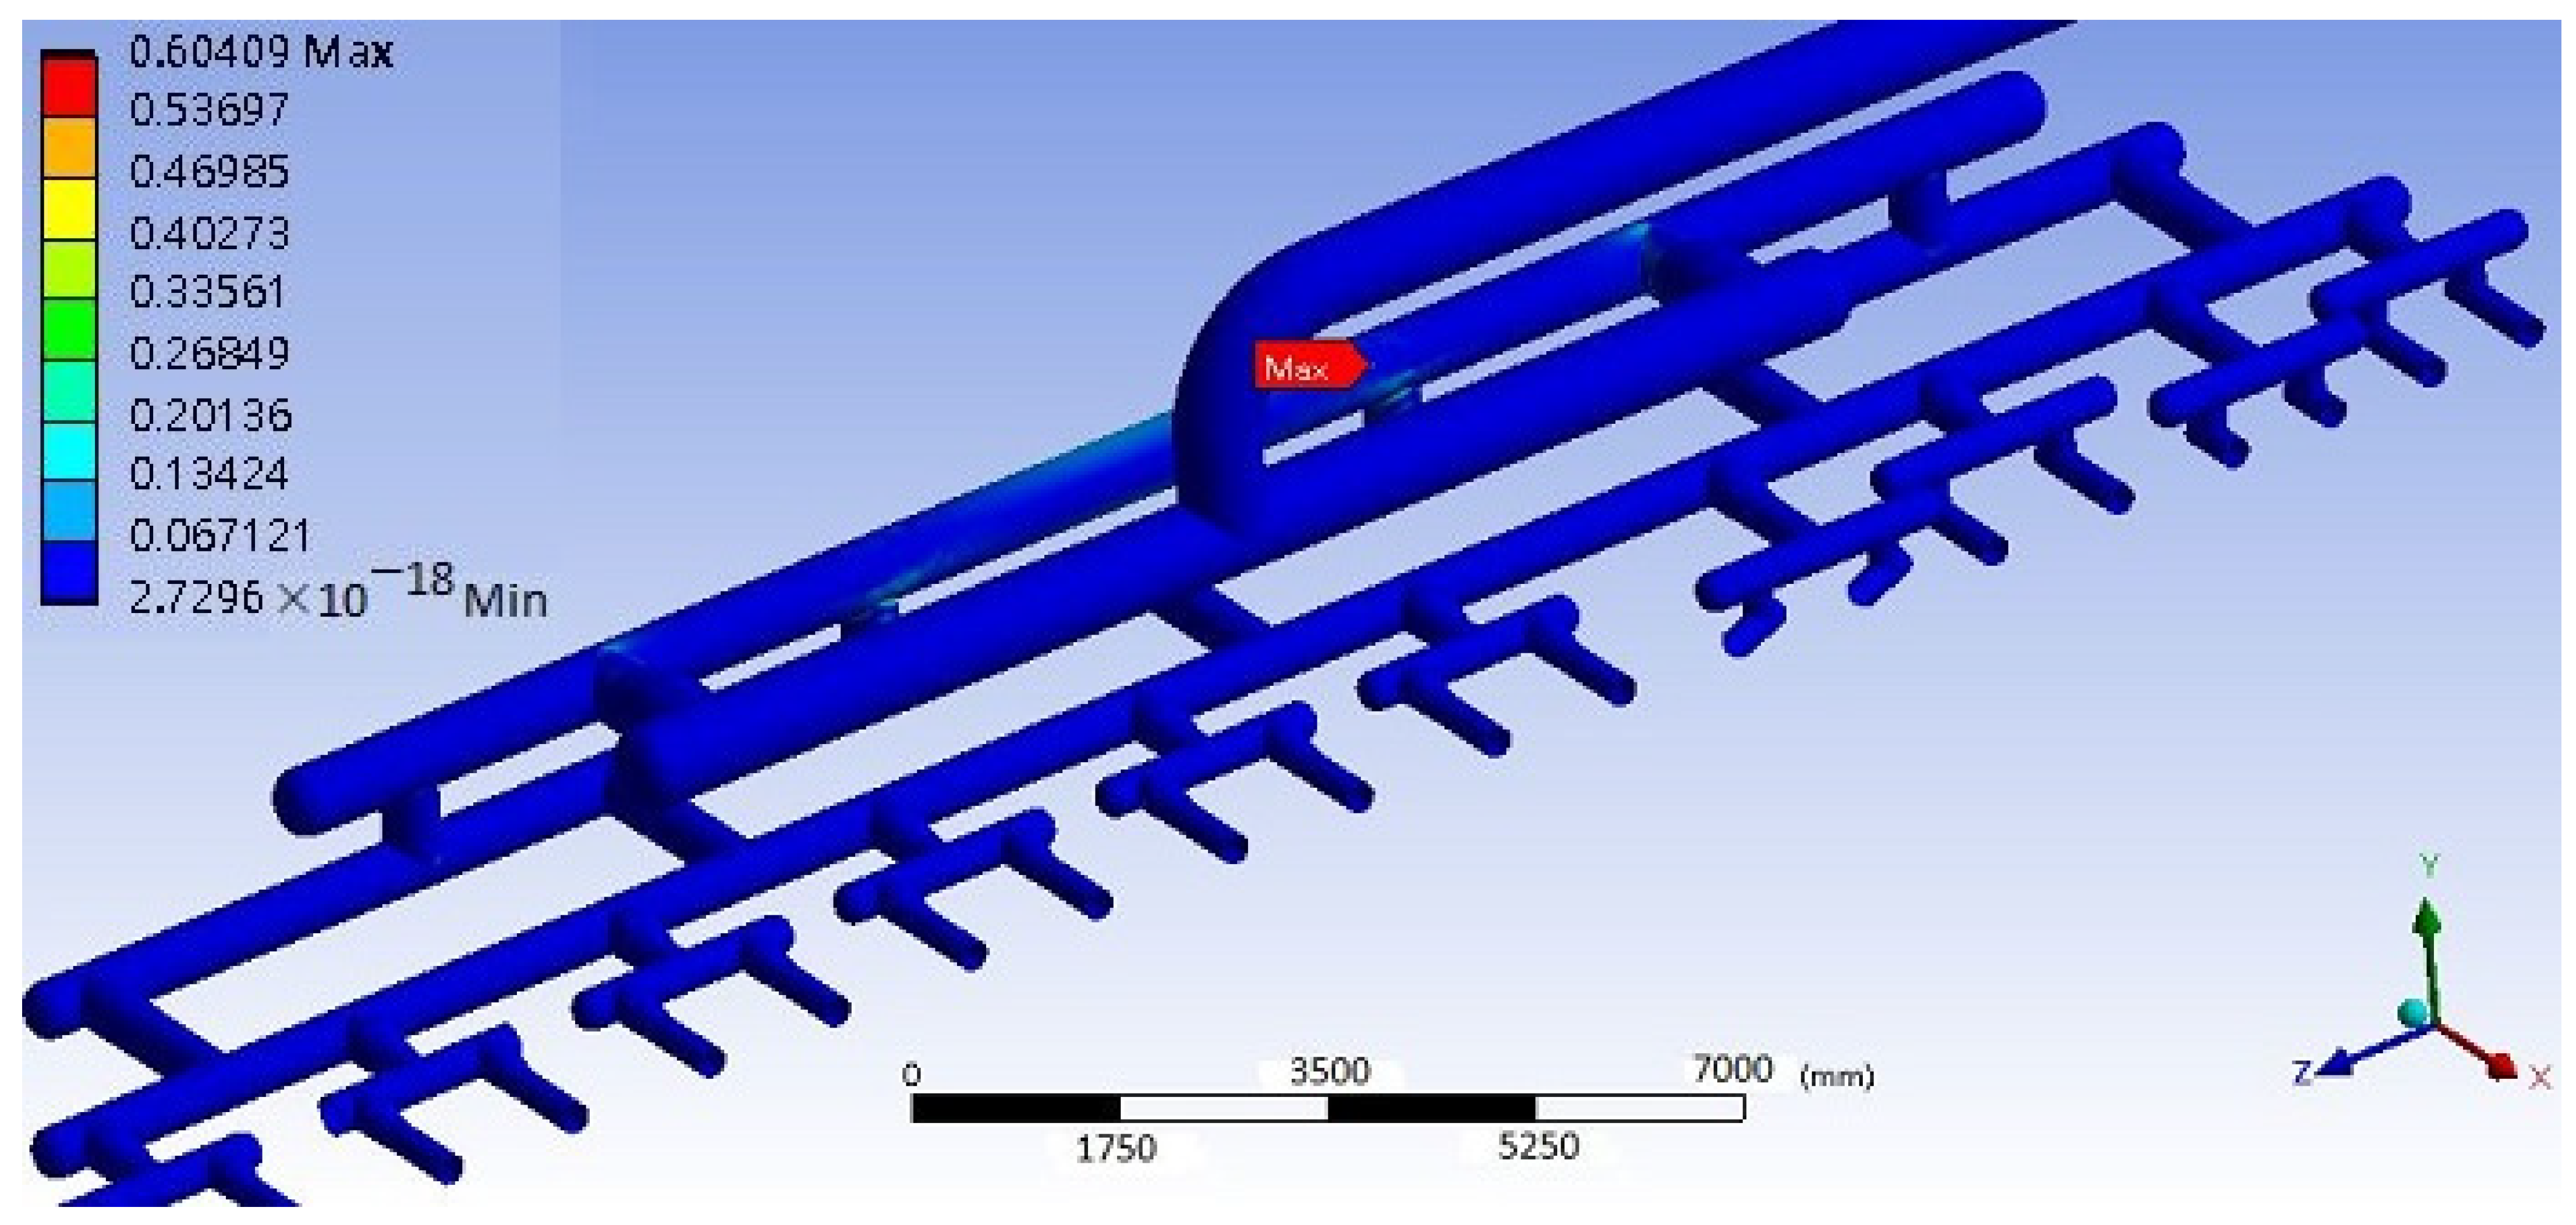
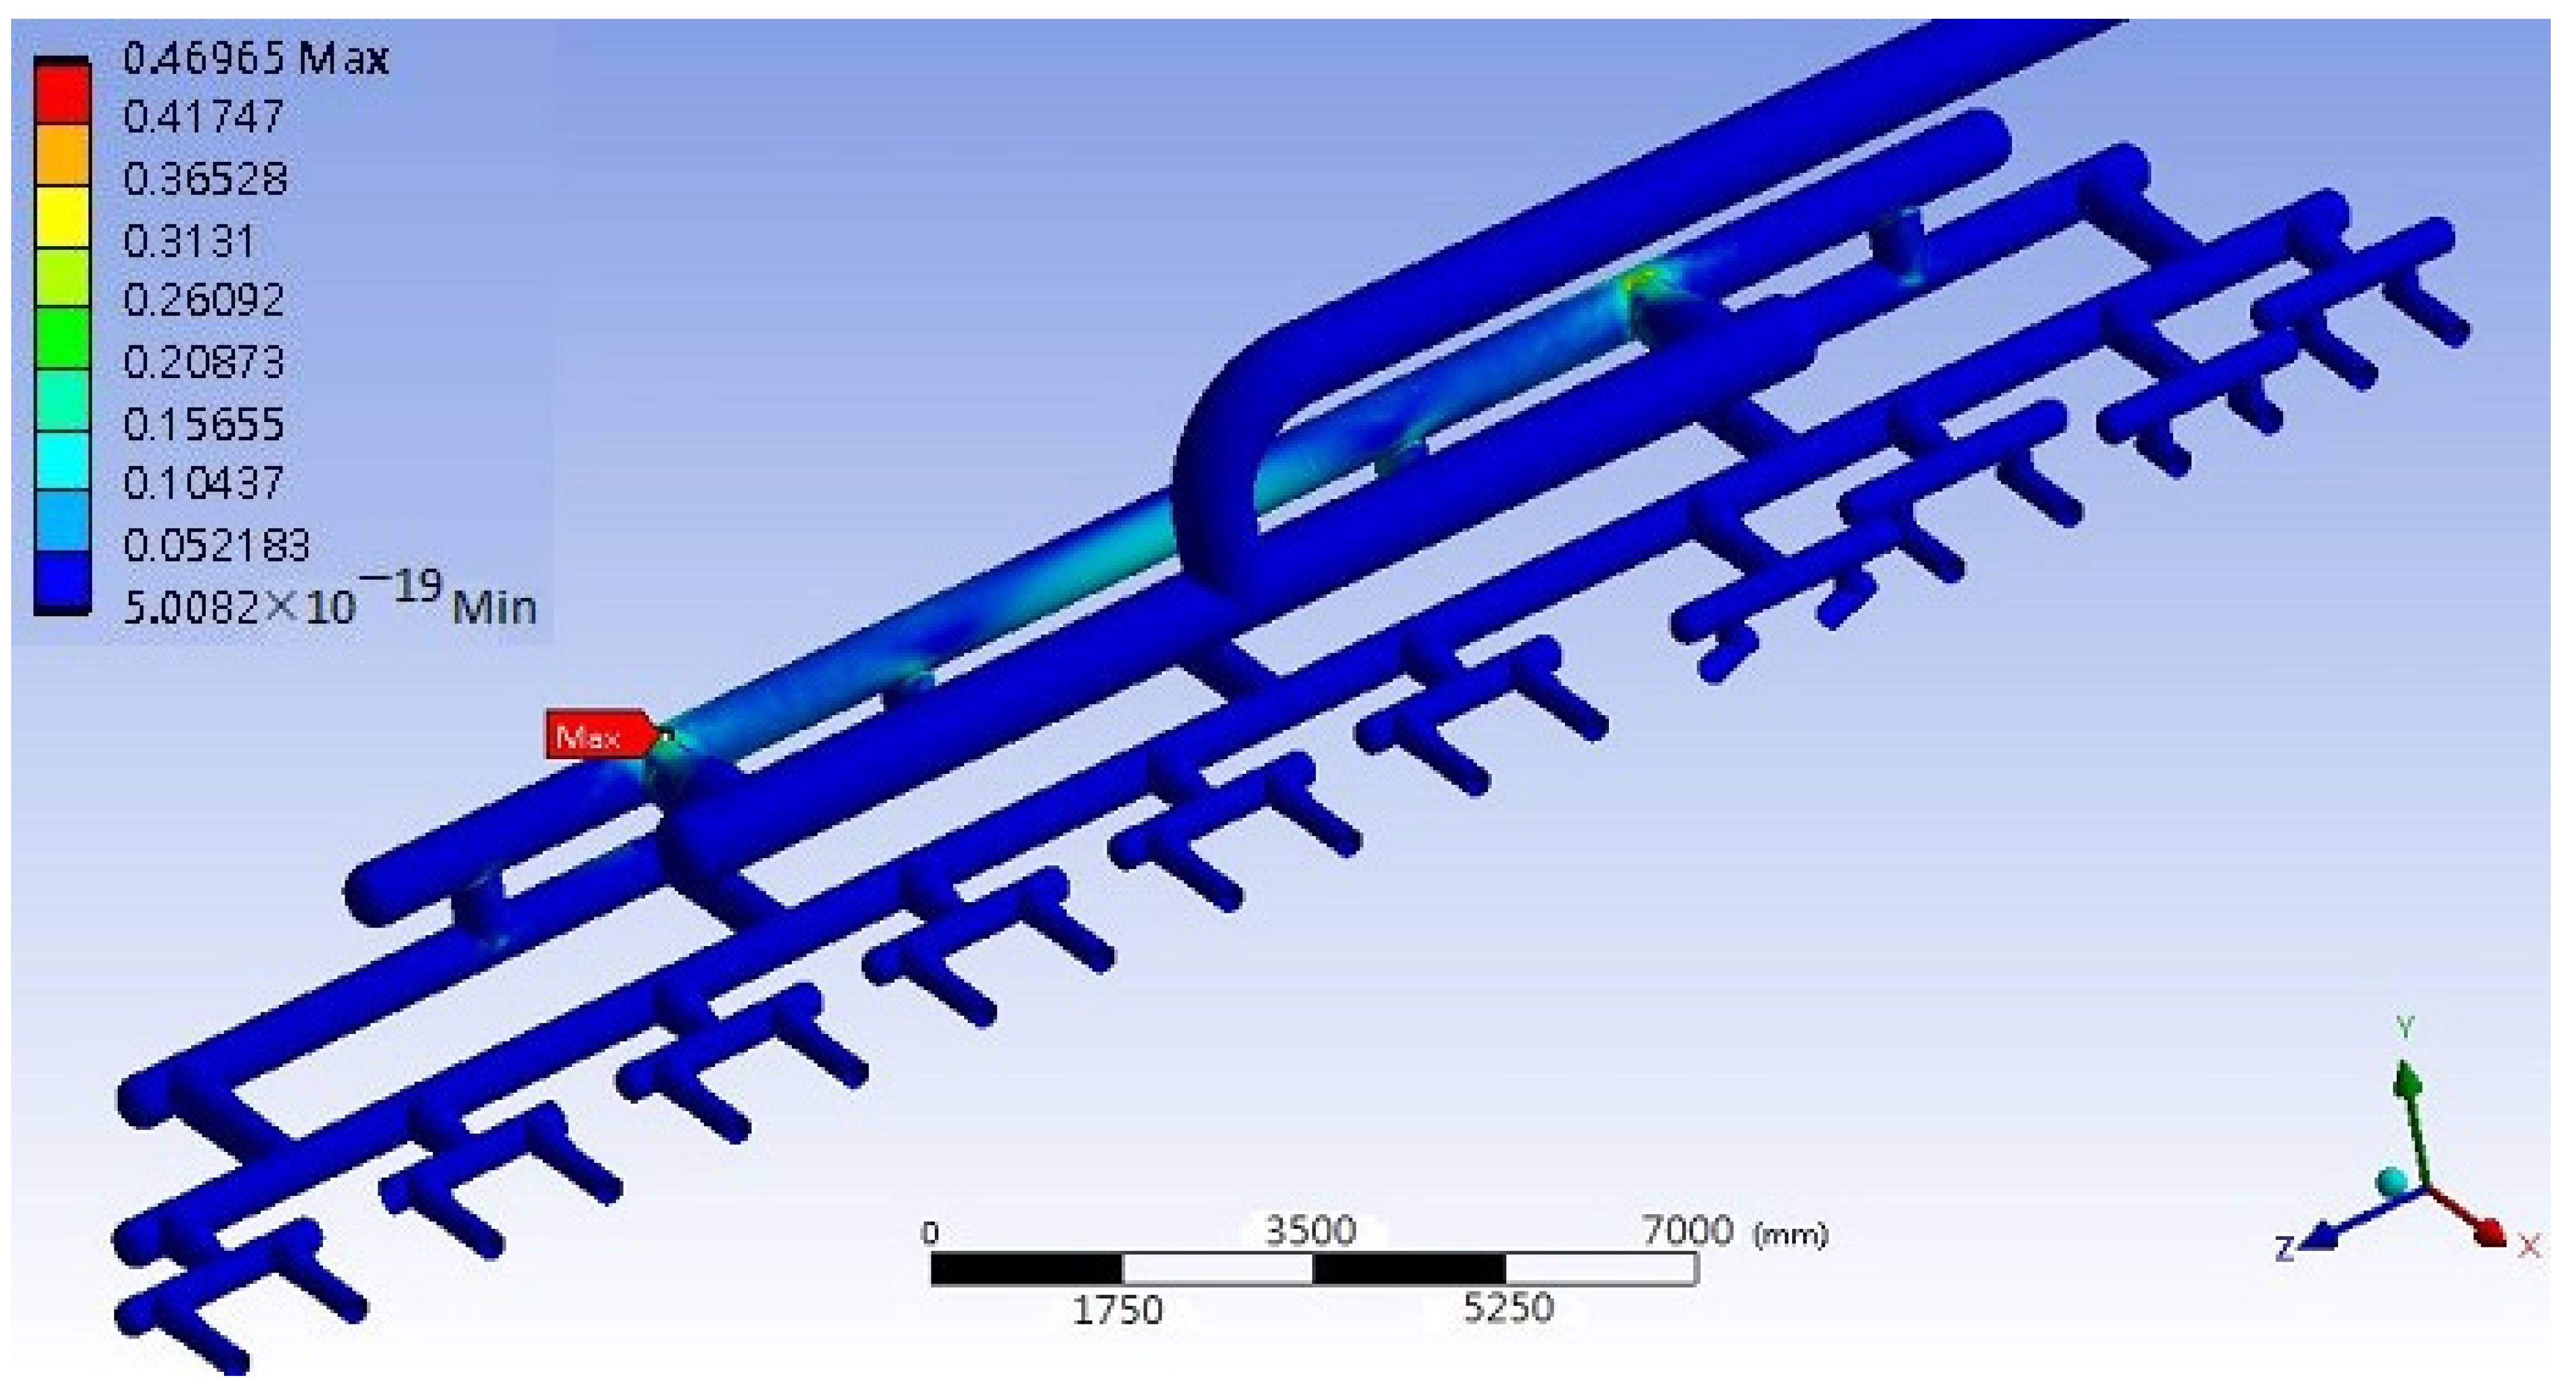
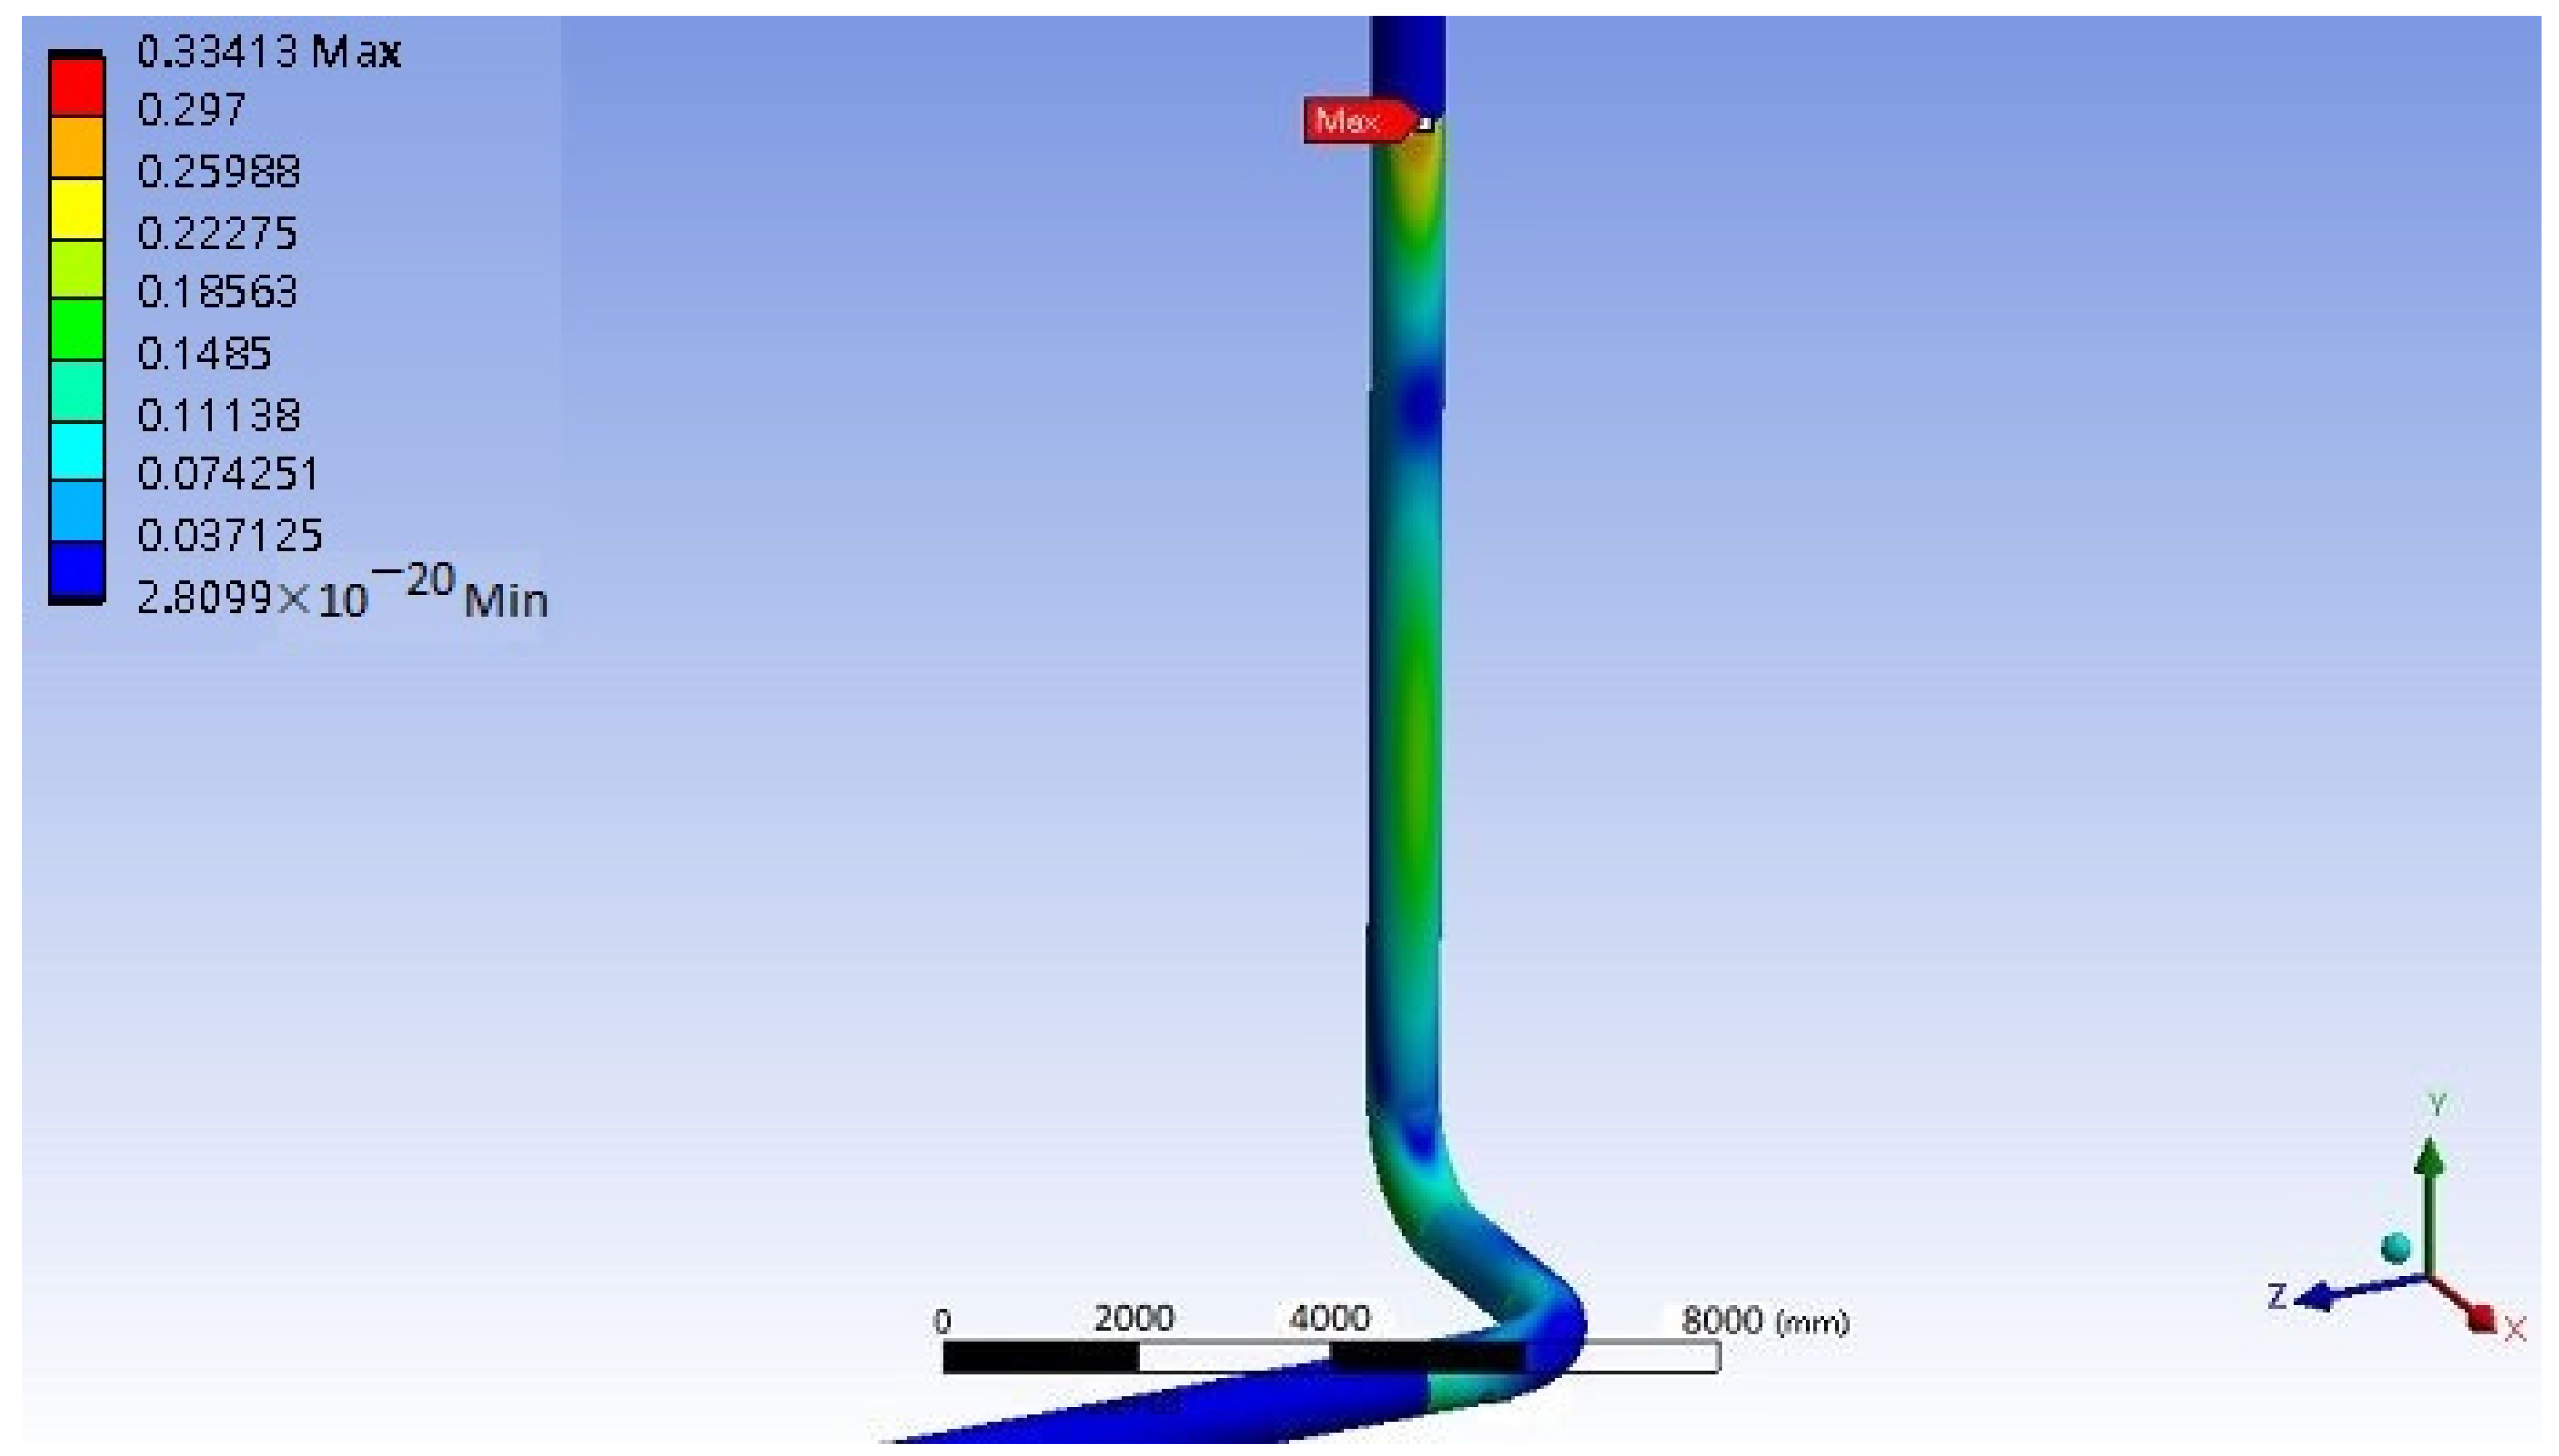
According to the structure analysis of the pipeline system, Table 5 shows the vibration mode frequencies and maximum harmonic response stresses of the pipeline system under a magnitude 2 wind or a magnitude 1 earthquake, and Figure 5, Figure 6, Figure 7, Figure 8, Figure 9, Figure 10, Figure 11, Figure 12, Figure 13, Figure 14, Figure 15 and Figure 16 show the stress distribution of the pipeline system. Because the region near the earth’s surface can be viewed as the boundary layer of the atmosphere, only the parallel mode of the wind load needs to be considered while the vertical mode does not need to be considered. However, the shaking motion due to the earthquake may include parallel mode or vertical mode, so the seismic part in Table 5 consists of parallel and vertical modes.
From Table 5 and Figure 5, Figure 6, Figure 7, Figure 8, Figure 9, Figure 10, Figure 11, Figure 12, Figure 13, Figure 14, Figure 15 and Figure 16, which show the modal frequencies and stresses of the pipeline system under a magnitude 2 wind or a magnitude 1 earthquake, the following three points can be drawn:
  • Since the static stress is primarily caused by the gravitational force when the pipelines are connected, the weight increases, and, therefore, the static stress is larger.
  • For the pipelines connected or unconnected, the vibration frequencies of modes 1 to 4 are identical under a magnitude 2 wind or a magnitude 1 earthquake, but the vibration frequencies of modes 5 and 6 are different. The primary difference in structures between the connected and the unconnected pipelines is whether the two sections of 24″ pipes are connected and the five sections of 18″ pipes are connected. Because the 30″ main pipe is not changed, it can be inferred that the first four vibration modes are primarily affected by the vibration of the 30″ main pipe, and the fifth and sixth vibration modes are primarily affected by the vibration of the smaller pipes.
  • The maximum harmonic response stresses for various vibration modes occur at the 30″ main pipe or the 24″ pipes, which include the support positions of the 30″ main pipe, the intersection positions of the 24″ pipes, and the 30″-to-24″ reducers, as well as the intersection positions of the 24″ pipes and the 20″ pipes. After statistics, two of the positions for the maximum harmonic response stresses are shifted from the 30″ main pipe to the 24″ pipes when the pipelines are connected.

3.2.2. Vibration Caused by Enhanced Winds or Earthquakes

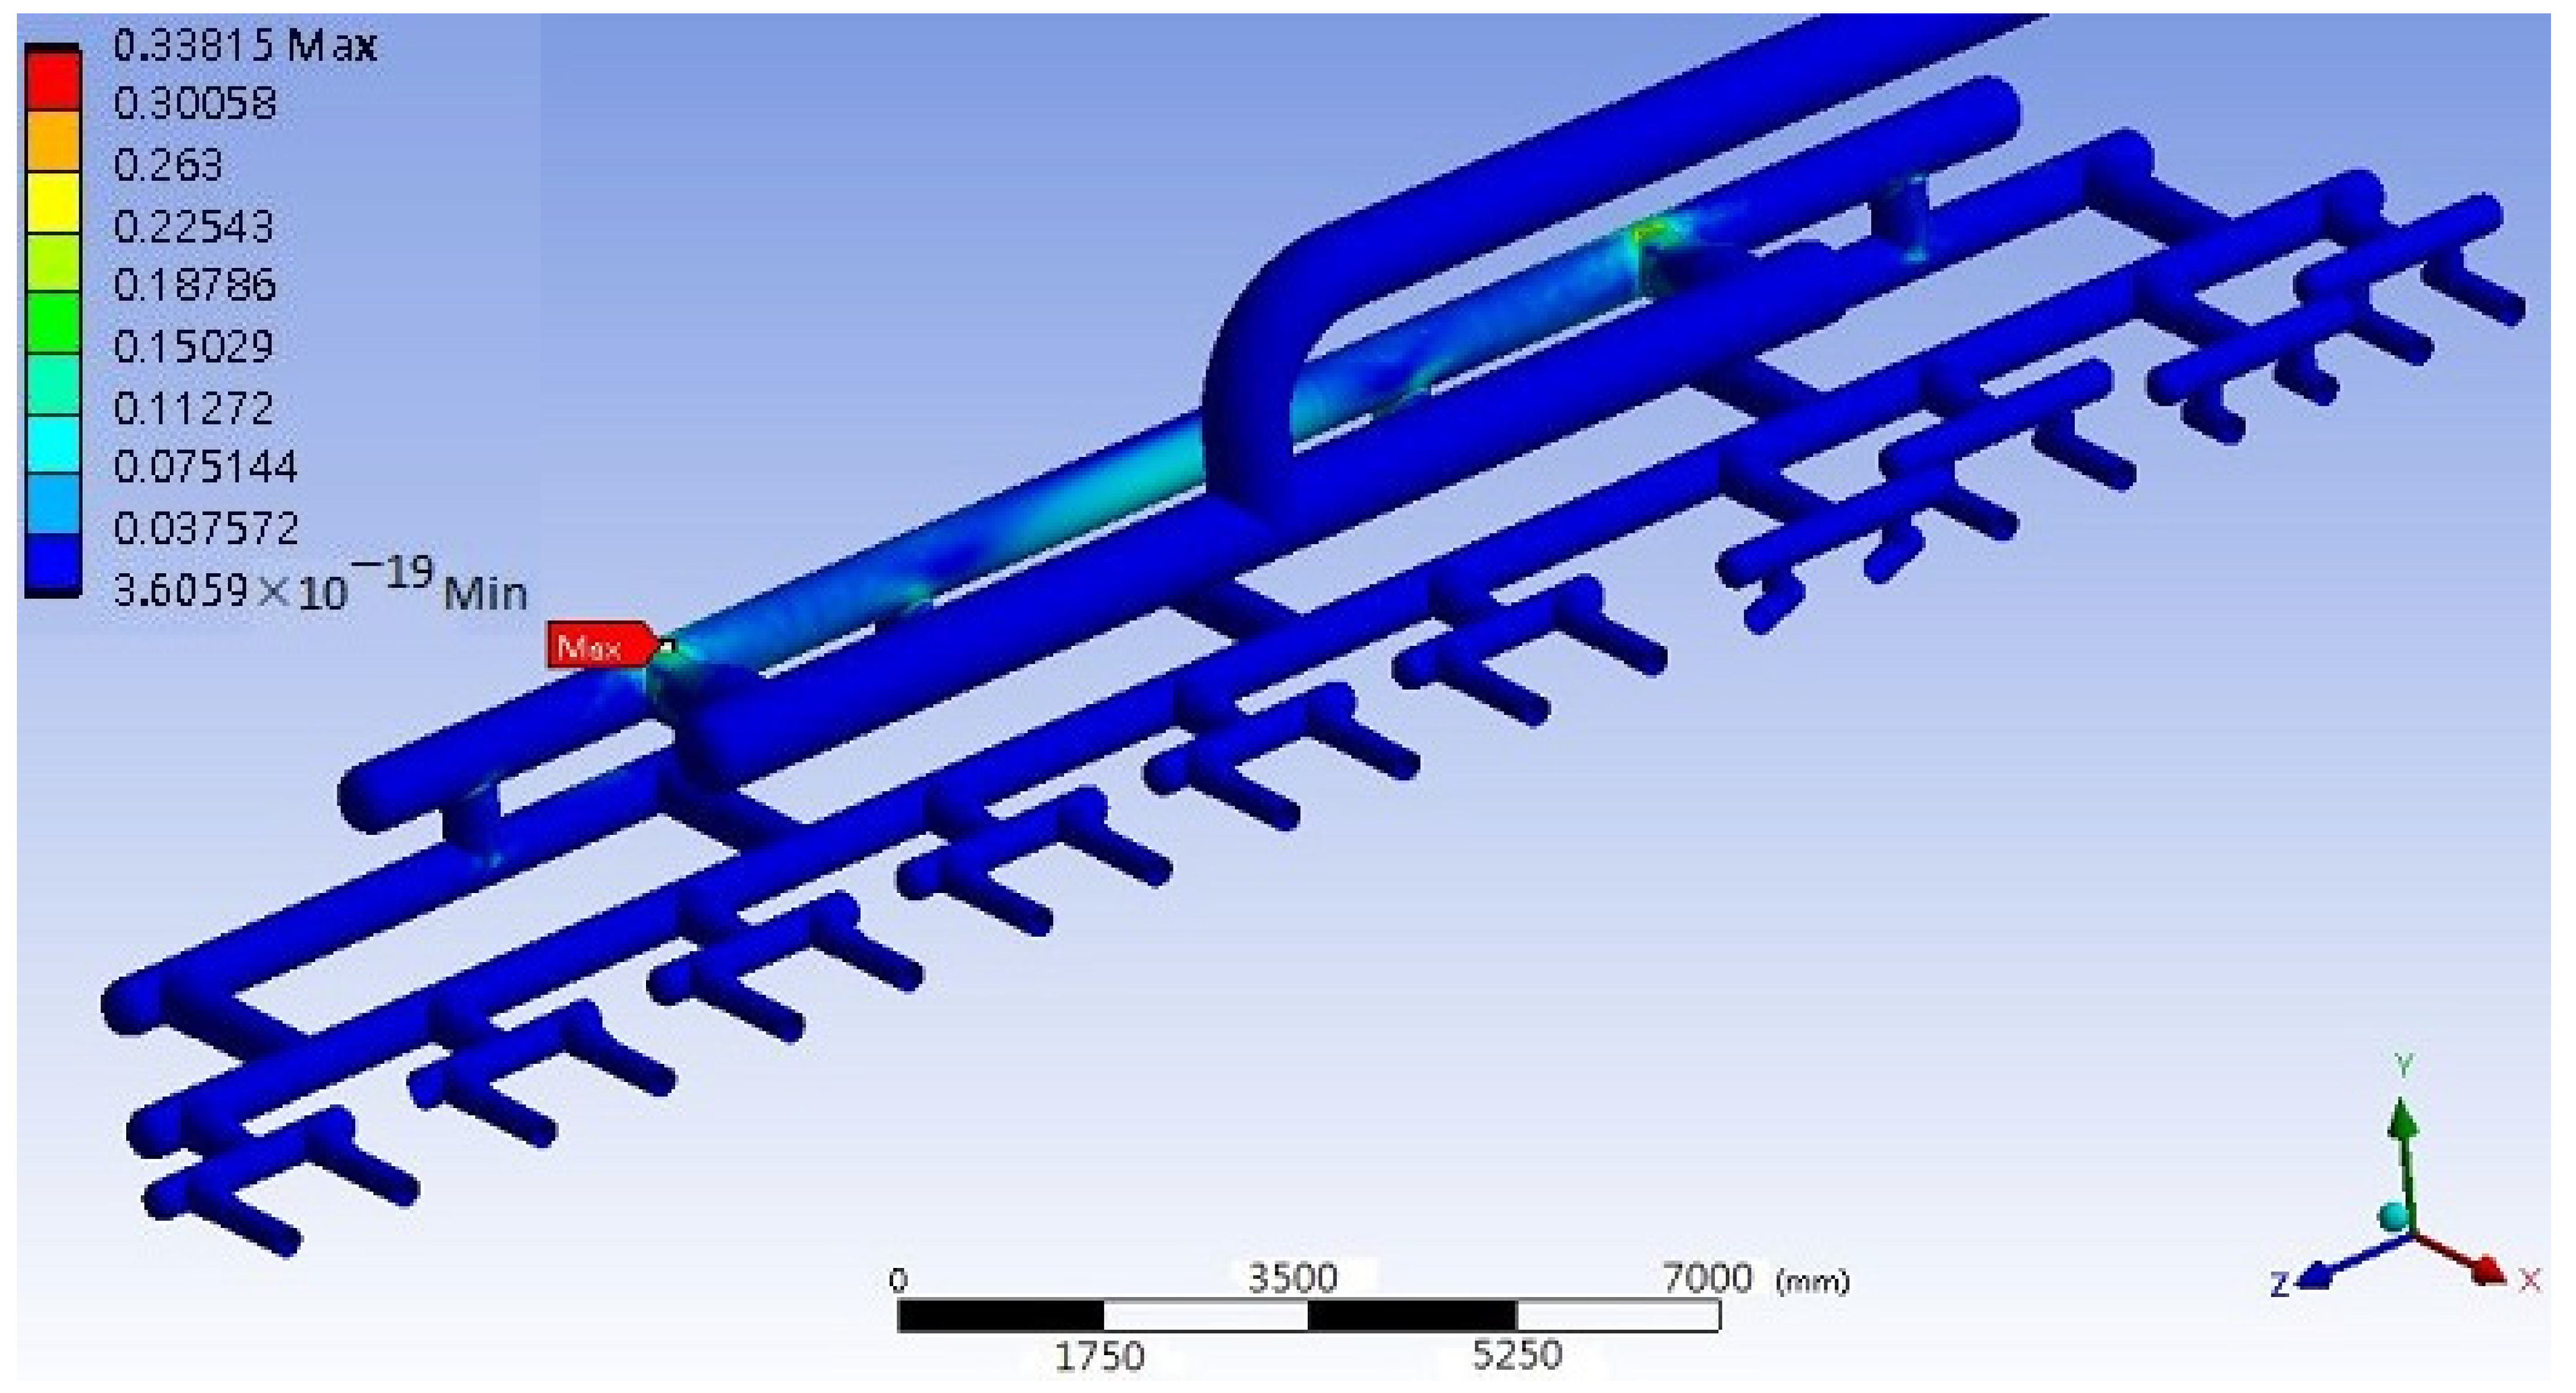
From Table 5, it can be observed that for vibration mode 1, the corresponding maximum harmonic response stresses for the pipelines connected or unconnected are identical for a magnitude 2 wind or a magnitude 1 earthquake (vertical or horizontal modes) while for the vibration modes 2 to 6, the corresponding maximum harmonic response stresses for the pipelines connected or unconnected are not completely identical, in which the maximum stress, 0.60409 MPa, occurs at the vibration mode 6 when the pipelines are connected and the earthquake (vertical mode) is of magnitude 1 (case 1 in Table 6). If the earthquakes and winds are enhanced, the maximum stresses of the pipeline system are listed in Table 6. When the earthquake is enhanced to magnitude 5(+) (strong earthquake), the maximum harmonic response stress of the earthquake (vertical mode) vibration mode 6 is increased to 60.409 MPa for the pipelines connected (case 9b), and when the earthquake is enhanced to magnitude 6(−) (very strong earthquake), the maximum harmonic response stress of the earthquake (vertical mode) vibration mode 6 is increased to 106.31984 MPa for the pipelines connected (case 11a). Because the fatigue limit stress of the pipeline system made of carbon steel is about 12 ksi (82.7 MPa), the pipelines connected can withstand a strong earthquake of magnitude 5(+) without fatigue failure. In addition, for the pipelines connected, the maximum harmonic response stress, 0.33815 MPa, caused by a magnitude 2 wind occurs at mode 5 (case 15). When the wind is enhanced to magnitude 13 (moderate typhoon), the maximum harmonic response stress of vibration mode 5 (case 26) is increased to 71.049 MPa. When the wind is further enhanced to magnitude 14, the maximum harmonic response stress of vibration mode 5 (case 27) is increased to 88.295 MPa. Therefore, the pipelines connected can withstand a moderate typhoon of magnitude 13 without fatigue damage. For the pipelines unconnected, the maximum stress, 0.46407 MPa, of the pipelines under a magnitude 1 earthquake (horizontal mode) occurs at vibration mode 2 (case 2). When the earthquake is enhanced to magnitude 6(−) (very strong earthquake; case 12a), the maximum harmonic response stress of the earthquake (horizontal mode) is increased to 81.67632 MPa, and when the earthquake magnitude is further enhanced to magnitude 6(+) (very strong earthquake; case 12b), the maximum harmonic response stress of the earthquake (horizontal mode) is increased to 148.5024 MPa. Therefore, the pipelines unconnected can withstand a magnitude 6(−) earthquake (horizontal mode) without fatigue damage. In addition, the maximum harmonic response stress for the pipelines unconnected, 0.33413 MPa, caused by a magnitude 2 wind occurs at mode 2 (case 15). When the wind is enhanced to magnitude 13 (moderate typhoon; case 26), the maximum harmonic response stress reaches 70.2044 MPa, and when the wind is further enhanced to magnitude 14 (case 27), the maximum harmonic response stress is 87.245 MPa. Therefore, the pipelines unconnected can withstand a moderate typhoon of magnitude 13 without fatigue damage.
From the above discussion, it can be seen that in terms of the wind effect, the pipelines connected or unconnected can both withstand a moderate typhoon of magnitude 13 without fatigue damage, but in terms of the seismic effect, the pipelines connected can withstand a strong earthquake of magnitude 5(+) without fatigue damage while the pipelines unconnected can withstand a very strong earthquake of magnitude 6(−) without fatigue damage, which is better than the pipelines connected. However, moderate typhoons of magnitude 13, strong earthquakes of magnitude 5(+), and very strong earthquakes of magnitude 6(−) rarely persist for a long time, and therefore their impacts on fatigue damage, which is caused by long-term alternating loads, are far less serious than that caused by a strong seasonal wind (such as the northeast monsoon). By comparison, when earthquakes or typhoons occur, whether the yield strength or the UTS of the material is exceeded is far more influential than whether the fatigue limit stress is exceeded. The yield strength of the pipeline material (carbon steel) is about 240 MPa, and the UTS is about 415 MPa. When the pipelines are connected, if the wind is enhanced to magnitude 17 (severe typhoon; case 30), the maximum harmonic response stress of vibration mode 5 increases to 172.1 MPa, which is still lower than the yield strength and much lower than the UTS while when the earthquake is enhanced to magnitude 7 (great earthquake) with an acceleration 1000 gal (10 m/s2), the maximum harmonic response stress of the earthquake (vertical mode) vibration mode 6 (case 13) increases to 241.636 MPa, which is slightly higher than the yield strength but is still much lower than the UTS. When the pipelines are not connected, if the wind is enhanced to magnitude 17 (severe typhoon; case 30), the maximum harmonic response stress of vibration mode 2 increases to 170.0536 MPa, which is still lower than the yield strength and much lower than the UTS, and when the earthquake is enhanced to magnitude 7 (great earthquake) with an acceleration 1000 gal (10 m/s2), the maximum harmonic response stress of the earthquake (horizontal mode) vibration mode 2 (case 14) increases to 185.628 MPa, which is still lower than the yield strength and much lower than the UTS. From the above discussion, it is observed that the pipelines unconnected are slightly better in terms of earthquake resistance.

3.2.3. Statistical Study

From the data of the Central Weather Administration, Taiwan, there are no earthquakes of magnitude above 6 occurring at the DCU location in the past 30 years (1994–2023), and there is only one earthquake of magnitude above 5(−) (occurring on 11 June 2000). Therefore, the pipeline system investigated does not have the risk of fatigue, yielding, or fracture in terms of the earthquakes in the past 30 years. Further, there have been 93 typhoons whose center speeds are above 37 m/s (magnitude 13 wind) in the past 30 years (1994–2023). However, the DCU is located in the west part of Taiwan, which is protected by the Central Mountain Range. No magnitude 17 wind may approach the DCU and, therefore, the pipelines investigated do not have the risk of yielding or fracture in terms of the wind in the past 30 years. Although magnitude 13 or stronger winds due to typhoons may approach the DCU, they rarely persist for a long time and therefore their impacts on fatigue damage, which is caused by long-term alternating loads, are far less serious than that caused by a strong seasonal wind (such as the northeast monsoon). Owing to the lack of detailed stress data during strong seasonal winds, the remaining life of the pipeline system cannot be estimated at present.
As mentioned above, 1000 gal (10 m/s2) is taken as the value of acceleration for the analysis of a magnitude 7 earthquake. If a stronger magnitude 7 earthquake (>1000 gal) occurs, the UTS of the pipeline material may be exceeded. For example, the 1960 Great Chilean Earthquake (Valdivia Earthquake) on 22 May 1960 was the most powerful earthquake ever recorded. Its peak acceleration is 2.93 g (28.73 m/s2). If it occurs at the location of the DCU investigated in this study, the maximum harmonic response stresses will be 694.22 MPa and 533.31 MPa for the pipelines connected or unconnected, respectively, which both exceed the UTS of the pipeline material and, hence, fracture of the pipeline system will occur. Fortunately, as mentioned above, such powerful earthquakes have never occurred at the DCU location in the past 30 years. The pipelines connected or unconnected can both withstand magnitude 7 earthquakes up to accelerations of 1718 gal (17.18 m/s2) and 2236 gal (22.36 m/s2), respectively, without exceeding the UTS.
The above analysis results are summarized in Table 7.

4. Conclusions

In this paper, we analyze the structural strength of a DCU fractionator overhead vapor line connected to an air cooler. The stress of the pipeline system under the action of earthquakes or winds as well as the possibility of damage is discussed.

4.1. Main Findings

From the analysis results, the following 12 points may be drawn:
  • The static stress is larger when the pipelines are connected.
  • The first four modes of the pipeline vibration are primarily affected by the vibration of the 30″ main pipe while the fifth, and the sixth modes are primarily affected by the vibration of the smaller pipes.
  • For the cases of a magnitude 1 earthquake (parallel mode) and a magnitude 2 wind, the maximum harmonic response stresses occur at the same locations.
  • The maximum harmonic response stresses for various vibration modes occur at the support positions of 30″ main pipe, the intersection positions of the 24″ pipes, and the 30″-to-24″ reducers, or the intersection positions of the 24″ pipes and the 20″ pipes.
  • Two of the positions for the maximum harmonic response stresses are shifted from the 30″ main pipe to the 24″ pipes after the pipelines are connected.
  • In terms of the wind effect, the pipelines connected or unconnected can both withstand a moderate typhoon of magnitude 13 without fatigue damage.
  • In terms of the seismic effect, the pipelines connected can withstand a strong earthquake of magnitude 5(+) without fatigue damage, while the pipelines unconnected can withstand a very strong earthquake of magnitude 6(−) without fatigue damage, which is better than the pipelines connected.
  • Under the action of a magnitude 17 severe typhoon, the stresses for pipelines connected or unconnected are both lower than the yield strength and the UTS. There is no danger of immediate damage in terms of the wind effect.
  • The pipelines connected or unconnected can both withstand magnitude 7 earthquakes up to accelerations of 1718 gal (17.18 m/s2) and 2236 gal (22.36 m/s2), respectively, without exceeding the UTS.
  • The pipelines unconnected are slightly better than the pipelines connected in terms of earthquake resistance.
  • From the previous study [26] and the present study, the primary cause of the pipeline abnormality is the asymmetry of the flow development, which is not closely connected with the pipeline structure.
  • The methods for analyzing the wind effect and the seismic effect used in this study can be applied to other equipment to evaluate its operation safety under the action of wind or earthquake.

4.2. Future Work

In the above discussion, the yield strength and the UTS are discussed in more detail as compared to the fatigue limit stress, which is closely relevant to the pipeline service life. From the analysis results, it is found that the fatigue limit stress will be exceeded for wind of magnitude above 13. During the northeast monsoon period from October to March in Taiwan, the wind speed often exceeds magnitude 13 and the pipeline service life will be consumed. An assessment of the equipment’s remaining life is important in the petrochemical industry. We suggest performing detailed stress motoring during the northeast monsoon period to evaluate the remaining life of the pipeline system.

Author Contributions

Conceptualization, C.-L.Y.; methodology, C.-L.Y.; software, Y.-H.C.; validation, C.-L.Y.; formal analysis, C.-L.Y.; investigation, C.-L.Y. and Y.-H.C.; resources, C.-L.Y.; data curation, Y.-H.C.; writing—original draft preparation, C.-L.Y.; writing—review and editing, C.-L.Y.; visualization, C.-L.Y. and Y.-H.C.; supervision, C.-L.Y.; project administration, C.-L.Y.; funding acquisition, C.-L.Y. All authors have read and agreed to the published version of the manuscript.

Funding

This research was funded by Formosa Petrochemical Corporation, Taiwan, under the contract 111-AF-226.

Institutional Review Board Statement

Not applicable.

Informed Consent Statement

Not applicable.

Data Availability Statement

The data presented in this study are available on request from the corresponding author.

Conflicts of Interest

The authors declare no conflicts of interest.

References

  1. Rahman, N.A. Steady State Simulation of a Delayed Coker Unit. Bachelor’s Thesis, Universiti Teknologi Petronas, Bandar Seri Iskandar, Perak Darul Ridzuan, Malaysia, 2009. [Google Scholar]
  2. Depew, C.A.; Hashemi, M.H.; Davis, J. Evaluation of alternative control strategies for delayed coker by dynamic simulation. In Proceedings of the 1988 American Control Conference, Atlanta, GA, USA, 15–17 June 1988; pp. 240–246. [Google Scholar]
  3. Kedia, V.; Nallasivam, U.; Ambati, S.R. Disturbance modelling based benefit estimation from advanced process control: Case study on delayed coker unit. In Proceedings of the 2019 Fifth Indian Control Conference, IIT Delhi, India, 9–11 January 2019. [Google Scholar]
  4. Zhang, K.; Yu, J. Modeling delayed coking plant via RBF neural networks. In Proceedings of the International Joint Conference on Neural Networks, Washington, DC, USA, 10–16 July 1999; Volume 5, pp. 3483–3486. [Google Scholar]
  5. Chen, W.; Wang, J. Effects of blending ethylene tar on colloidal stability of delayed coker feedstock and pyrolysis process. Pet. Process. Petchem. 2020, 35, 61–64. [Google Scholar]
  6. Lei, Y.; Chen, X.; Zhang, B.; Chen, Q. Integrated optimization of the fractionation and heat exchange processes in delayed coker with considering steam generation. Acta Pet. Sin. 2015, 31, 572–582. [Google Scholar]
  7. Ge, X. Technical analysis of reprocessing mixed waste oil into delayed coker. Pet. Process. Petchem. 2022, 58, 13–18. [Google Scholar]
  8. Deng, Z.; Cai, G.; Li, Y. Influence of high proportion blending catalytic cracking slurry on delayed coker. Pet. Process. Petchem. 2022, 58, 8–12. [Google Scholar]
  9. Fan, Y.; Lu, Q.; Wu, Z.; Ma, S. Intelligent optimization of three-point steam injection rate in delayed coker furnace based on automatic regulation of heat load. Pet. Process. Petchem. 2022, 51, 86–91. [Google Scholar]
  10. Paladino, E.E.; Ribeiro, D.; Reis, M.V.; Geraldelli, W.O.; Barros, F.C.C. A CFD model for the washing zone in coker fractionators. In Proceedings of the 2005 AICHE Annual Meeting, Cincinnati, OH, USA, 10–14 April 2005. [Google Scholar]
  11. Díaz, F.A.; Chaves-Guerrero, A.; Gauthier-Maradei, P.; Fuentes, D.; Guzmán, A.; Picón, H. CFD Simulation of a pilot plant delayed coking reactor using an in-house CFD code. CTF Cienc. Tecnol. Y Futuro 2017, 7, 85–100. [Google Scholar] [CrossRef]
  12. Ibrahim, S.A.M.; Abdalla, B.K.; Mohamed, A.A.; Elbasher, H.A. Evaluation and simulation of different crude oil in delayed cocker unit (DCU) in Khartoum refinery. Eur. Acad. Res. 2022, 4, 1410–1421. [Google Scholar]
  13. Albers, J.E. Modeling of a Delayed Coker. Master’s Thesis, Texas Tech University, Lubbock, TX, USA, 1996. [Google Scholar]
  14. Valenca, P.A.; Waturuocha, A.; Wisecarver, K. 2D axisymmetric temperature profile modelling of a delayed coking drum during pre-run warm up. In Proceedings of the 2015 COMSOL Conference, Boston, MA, USA, 7–9 October 2015. [Google Scholar]
  15. Mohamed, S.N.; ElSayed, N.A.; Abdallah, S.M.; ElSokary, M. Maximize the gas oil yield from delayed coker unit by optimization between process variables. J. Univ. Shanghai Sci. Technol. 2022, 24, 95–109. [Google Scholar]
  16. Dai, Q. Vibration-proof measures in the design of pressure piping. Nonferrous Met. Des. 2002, 29, 66–68. [Google Scholar]
  17. Chen, C.; Hou, Y.; Jiao, Q.; Su, J.; Zhang, S. Stress analysis of suspension bridge long span oil and gas pipeline under wind load. Pipeline Technol. Equip. 2018, 1, 45–50. [Google Scholar]
  18. Wu, X.; Lu, H.; Huang, K.; Tang, X.; Wu, S.; Shen, G.; Fu, H. Stress analysis of gas pipelines at seismic belts based on the spectrum analysis. Nat. Gas Ind. 2014, 34, 152–157. [Google Scholar]
  19. Zhou, C. Pipeline stress analysis in petrochemical design. Shandong Chem. Ind. 2017, 20, 129–130. [Google Scholar]
  20. Ren, S.; Ma, G.; Wang, H. Stress analysis of gas pipeline in tunnel based on ANSYS. Contemp. Chem. Ind. 2015, 44, 2652–2654. [Google Scholar]
  21. Zhou, B. Analysis of dynamic characteristics of straight pipe under foundation vibration. Mech. Eng. 2020, 6, 26–28. [Google Scholar]
  22. Zhao, Z.; Li, S.; Xu, D.; Wu, S. Damping program of pipeline vibration and engineering application. Pipeline Technol. Equip. 2011, 3, 54–56. [Google Scholar]
  23. Yin, H.; Yan, B.; Fang, J. Analysis and calculation of pipeline vibration at outlet valve of oil feed pump. Pipeline Technol. Equip. 2019, 5, 18–20. [Google Scholar]
  24. Xu, J.; Liao, H.; Dong, F.; Du, G. Numerical analysis of high-drop and long-distance pipeline under earthquake action. Pipeline Technol. Equip. 2018, 6, 5–9. [Google Scholar]
  25. Capula-Colindres, S.; Terán, G.; Velázquez, J.C.; Caballero-Rosas, A.; Torres-Santillán, E.; Angeles-Herrera, D. Mechanical behavior of X60 pipelines containing pitting corrosion defects based on finite element method. Forces Mech. 2024, 16, 100278. [Google Scholar] [CrossRef]
  26. Yeh, C.L. Numerical Analysis of the flow in a delayed coker unit fractionator overhead vapor line. J. Chin. Soc. Mech. Eng. 2024, 45, 103–113. [Google Scholar]
  27. Dassault Systèmes SolidWorks Corporation, 175 Wyman Street, Waltham, MA 02451, USA. Available online: https://www.solidworks.com/support/resource-center (accessed on 15 April 2022).
  28. ANSYS, Inc. Southpointe, 2600 Ansys Drive, Canonsburg, PA 15317, USA. Available online: https://www.ansys.com/products#t=ProductsTab&sort=relevancy&layout=card&f:@products=[Workbench] (accessed on 15 April 2022).
  29. Thomson, W.T. Theory of Vibration with Applications, 3rd ed.; CBS Publishers & Distributors: New Delhi, India, 2002. [Google Scholar]
  30. Fung, Y.C. Foundation of Solid Mechanics; Prentice Hall: Lebanon, IN, USA, 1985. [Google Scholar]
  31. ANSYS Inc. Theory Reference for the Mechanical APDL and Mechanical Applications, Release 12.0; ANSYS Inc.: Canonsburg, PA, USA, 2009. [Google Scholar]
  32. Tamkang University, Taiwan. Available online: https://windexpert.ce.tku.edu.tw/newcode/windtable.php (accessed on 31 May 2024).
  33. Central Weather Administration, Taiwan. Available online: https://www.cwa.gov.tw/Data/service/Newsbb/CH/1081218earthquakepress.pdf (accessed on 31 May 2024).
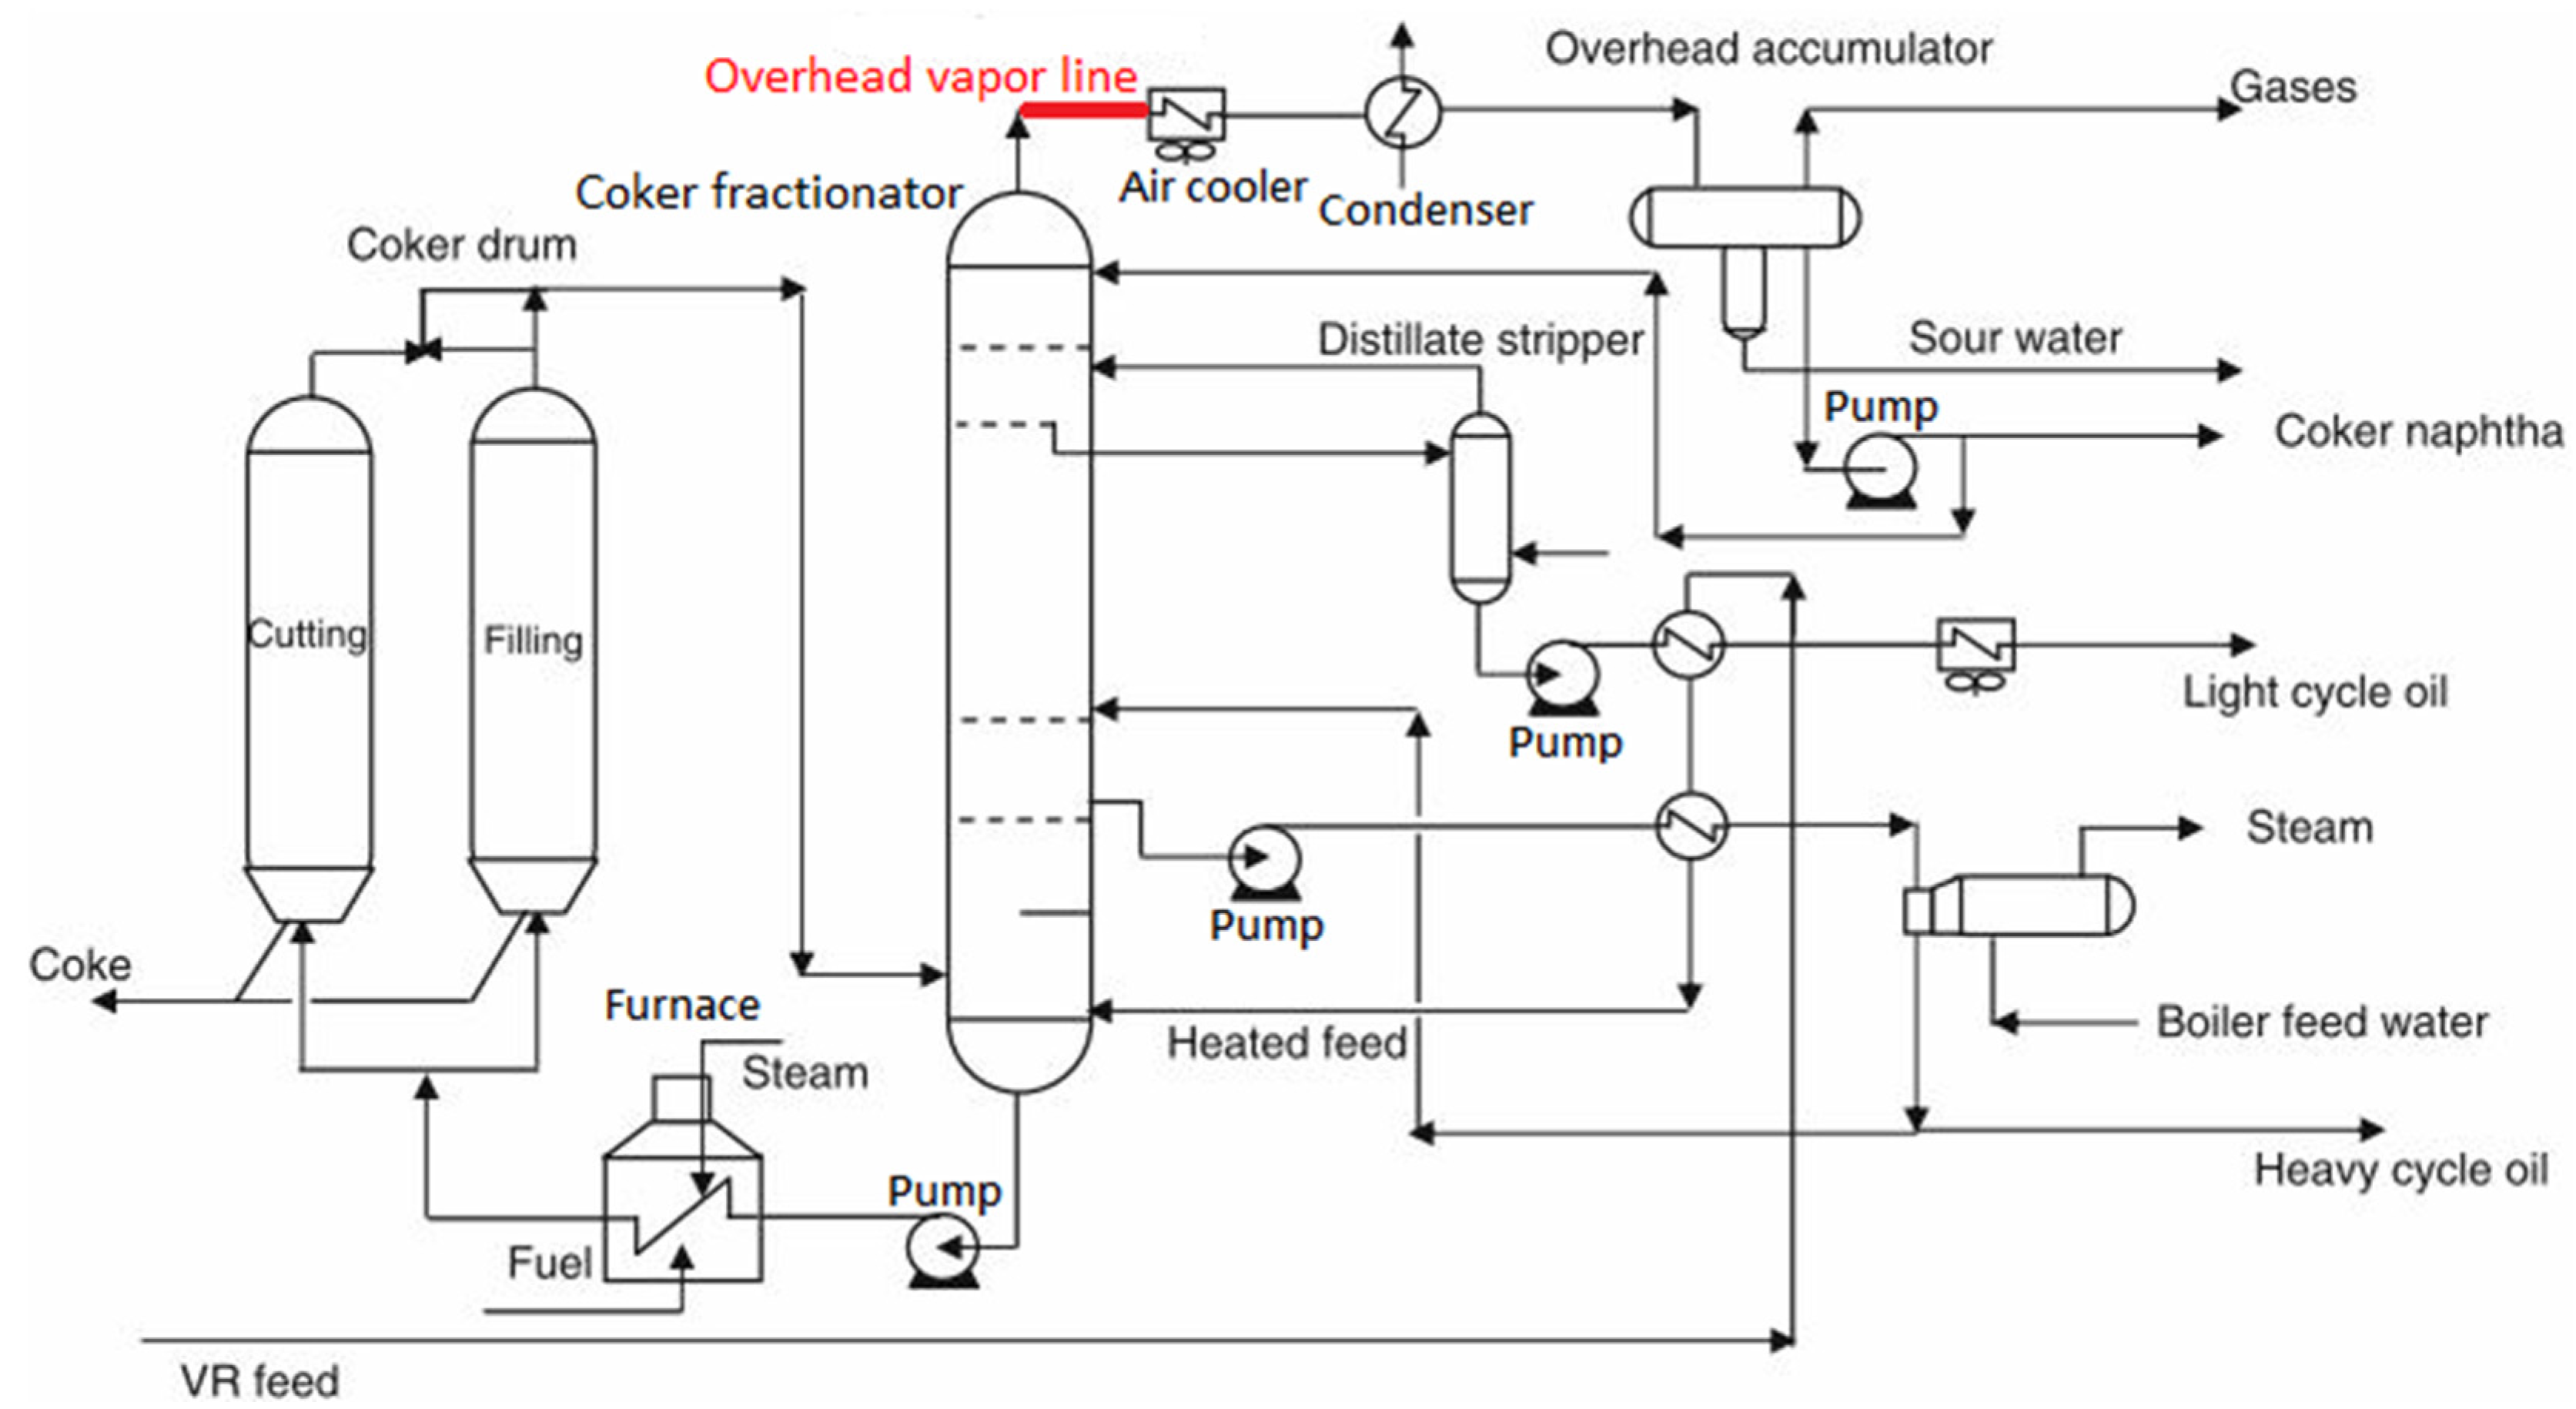
Figure 1. Illustration of a Delayed Coker Unit.
Applsci 14 07193 g001
Figure 2. A DCU fractionator overhead vapor line connected to an air cooler.
Applsci 14 07193 g002aApplsci 14 07193 g002b
Figure 3. Analysis model of the DCU fractionator overhead vapor line: (a) The two sections of 24″ pipes are unconnected and the five sections of 18″ pipes are unconnected; (b) The two sections of 24″ pipes are connected and the five sections of 18″ pipes are connected.
Applsci 14 07193 g003aApplsci 14 07193 g003b
Figure 4. Fixed points for stress analysis of the pipeline system.
Applsci 14 07193 g004
Figure 5. Stress distribution of the vibration mode 5 under magnitude 1 earthquake (vertical mode) for unconnected pipeline system.
Applsci 14 07193 g005
Figure 6. Stress distribution of the vibration mode 6 under magnitude 1 earthquake (vertical mode) for unconnected pipeline system.
Applsci 14 07193 g006
Figure 7. Stress distribution of the vibration mode 5 under magnitude 1 earthquake (parallel mode) for unconnected pipeline system.
Applsci 14 07193 g007
Figure 8. Stress distribution of the vibration mode 6 under magnitude 1 earthquake (parallel mode) for unconnected pipeline system.
Applsci 14 07193 g008
Figure 9. Stress distribution of the vibration mode 2 under magnitude 2 wind for unconnected pipeline system.
Applsci 14 07193 g009
Figure 10. Stress distribution of the vibration mode 6 under magnitude 2 wind for unconnected pipeline system.
Applsci 14 07193 g010
Figure 11. Stress distribution of the vibration mode 5 under magnitude 1 earthquake (vertical mode) for connected pipeline system.
Applsci 14 07193 g011
Figure 12. Stress distribution of the vibration mode 6 under magnitude 1 earthquake (vertical mode) for connected pipeline system.
Applsci 14 07193 g012
Figure 13. Stress distribution of the vibration mode 5 under magnitude 1 earthquake (parallel mode) for connected pipeline system.
Applsci 14 07193 g013
Figure 14. Stress distribution of the vibration mode 6 under magnitude 1 earthquake (parallel mode) for connected pipeline system.
Applsci 14 07193 g014
Figure 15. Stress distribution of the vibration mode 2 under magnitude 2 wind for connected pipeline system.
Applsci 14 07193 g015
Figure 16. Stress distribution of the vibration mode 5 under magnitude 2 wind for connected pipeline system.
Applsci 14 07193 g016
Table 1. The outside diameter (Do) and wall thickness (t) for the pipeline system.
SizeDo (mm)t (mm)
30″76215.88
24″6109.53
20″5089.53
18″4579.53
14″355.69.53
10″2739.27
Table 2. Beaufort wind scale [32].
Beaufort Scale NumberDescriptionWind Speed (m/s)Wind Load (kgf/m2)
1Light air0.0~1.5 <1
2Light breeze1.6~3.31
3Gentle breeze3.4~5.41~3
4Moderate breeze5.5~7.93~7
5Fresh breeze8.0~10.77~14
6Strong breeze10.8~13.814~23
7Near gale13.9~17.123~35
8Gale (Mild typhoon)17.2~20.735~52
9Severe gale (Mild typhoon)20.8~24.452~72
10Storm (Mild typhoon)24.5~28.472~97
11Violent storm (Mild typhoon)28.5~32.697~128
12Hurricane (Moderate typhoon)32.7~36.9128~164
13Moderate typhoon37.0~41.4164~206
14Moderate typhoon41.5~46.1206~256
15Moderate typhoon46.2~50.9256~312
16Severe typhoon51.0~56.0312~377
17Severe typhoon56.1~61.2377~499
Table 3. Horizontal acceleration caused by the wind load.
MagnitudeDerivationAcceleration
(m/s2)
21 kgf/m2 × 60.3 m2 × 9.8 N/kgf ÷ 32,189 kg0.018
33 kgf/m2 × 60.3 m2 × 9.8 N/kgf ÷ 32,189 kg0.055
47 kgf/m2 × 60.3 m2 × 9.8 N/kgf ÷ 32,189 kg0.129
514 kgf/m2 × 60.3 m2 × 9.8 N/kgf ÷ 32,189 kg0.257
623 kgf/m2 × 60.3 m2 × 9.8 N/kgf ÷ 32,189 kg0.422
735 kgf/m2 × 60.3 m2 × 9.8 N/kgf ÷ 32,189 kg0.643
852 kgf/m2 × 60.3 m2 × 9.8 N/kgf ÷ 32,189 kg0.955
972 kgf/m2 × 60.3 m2 × 9.8 N/kgf ÷ 32,189 kg1.322
1097 kgf/m2 × 60.3 m2 × 9.8 N/kgf ÷ 32,189 kg1.781
11128 kgf/m2 × 60.3 m2 × 9.8 N/kgf ÷ 32,189 kg2.35
12164 kgf/m2 × 60.3 m2 × 9.8 N/kgf ÷ 32,189 kg3.011
13206 kgf/m2 × 60.3 m2 × 9.8 N/kgf ÷ 32,189 kg3.782
14256 kgf/m2 × 60.3 m2 × 9.8 N/kgf ÷ 32,189 kg4.7
15312 kgf/m2 × 60.3 m2 × 9.8 N/kgf ÷ 32,189 kg5.728
16377 kgf/m2 × 60.3 m2 × 9.8 N/kgf ÷ 32,189 kg6.921
17499 kgf/m2 × 60.3 m2 × 9.8 N/kgf ÷ 32,189 kg9.161
Table 4. Seismic classification [33].
MagnitudeDescriptionAccelerationUpper Limit (m/s2)
0Micro earthquake0~0.8 gal0.008
1Very minor earthquake0.8~2.5 gal0.025
2Minor earthquake2.5~8 gal0.08
3Light earthquake8~25 gal0.25
4Moderate earthquake25~80 gal0.8
5(−)Strong earthquake80~140 gal1.4
5(+)Strong earthquake140~250 gal2.5
6(−)Very strong earthquake250~440 gal4.4
6(+)Very strong earthquake440~800 gal8
7Great earthquake>800 gal>8
Table 5. The vibration mode frequencies and maximum harmonic response stresses of the pipeline system under a magnitude 1 earthquake (Case 1: vertical mode, Case 2: horizontal mode) or a magnitude 2 wind (Case 3).
Pipelines ConnectedPipelines Unconnected
Case 1Case 2Case 3Case 1Case 2Case 3
Static stress (MPa)
11.8549.0853
ModeVibration frequency (Hz)
19.2239.2239.2239.2239.2239.223
223.02723.02723.02723.02723.02723.027
329.08429.08429.08429.08429.08429.084
429.39829.39829.39829.39829.39829.398
537.6737.6737.6743.65743.65743.657
645.41845.41845.41845.83545.83545.835
Maximum harmonic response stress (MPa)
10.00256490.298220.214720.00256490.298220.21472
20.0436760.464070.334130.029160.464070.33413
30.0579380.0483230.0347930.0353530.0339570.024449
40.0591030.0498410.0358850.0358080.0321130.023122
50.250850.469650.338150.292930.42520.30615
60.604090.192790.138810.292330.43710.31471
Table 6. The maximum harmonic response stresses of the pipeline system at enhanced earthquakes or winds: (1) Earthquake of magnitude 1 (vertical mode); (2) Earthquake of magnitude 1 (horizontal mode); (3) Earthquake of magnitude 2 (vertical mode); (4) Earthquake of magnitude 2 (horizontal mode); (5) Earthquake of magnitude 3 (vertical mode); (6) Earthquake of magnitude 3 (horizontal mode); (7) Earthquake of magnitude 4 (vertical mode); (8) Earthquake of magnitude 4 (horizontal mode); (9a) Earthquake of magnitude 5(−) (vertical mode); (9b) Earthquake of magnitude 5(+) (vertical mode); (10a) Earthquake of magnitude 5(−) (horizontal mode); (10b) Earthquake of magnitude 5(+) (horizontal mode); (11a) Earthquake of magnitude 6(−) (vertical mode); (11b) Earthquake of magnitude 6(+) (vertical mode); (12a) Earthquake of magnitude 6(−) (horizontal mode); (12b) Earthquake of magnitude 6(+) (horizontal mode); (13) Earthquake of magnitude 7 (vertical mode); (14) Earthquake of magnitude 7 (horizontal mode); (15) Wind speed of magnitude 2; (16) Wind speed of magnitude 3; (17) Wind speed of magnitude 4; (18) Wind speed of magnitude 5; (19) Wind speed of magnitude 6; (20) Wind speed of magnitude 7; (21) Wind speed of magnitude 8; (22) Wind speed of magnitude 9; (23) Wind speed of magnitude 10; (24) Wind speed of magnitude 11; (25) Wind speed of magnitude 12; (26) Wind speed of magnitude 13; (27) Wind speed of magnitude 14; (28) Wind speed of magnitude 15; (29) Wind speed of magnitude 16; (30) Wind speed of magnitude 17; a: Acceleration (m/s2).
Maximum Harmonic Response Stress (MPa) for the Pipelines Connected
caseaMode-1Mode-2Mode-3Mode-4Mode-5Mode-6
10.0250.0025650.0436760.0579380.0591030.250850.60409
20.0250.298220.464070.0483230.0498410.469650.19279
30.080.0082080.1397630.1854020.189130.802721.933088
40.080.9543041.4850240.1546340.1594911.502880.616928
50.250.0256490.436760.579380.591032.50856.0409
60.252.98224.64070.483230.498414.69651.9279
70.80.0820771.3976321.8540161.8912968.027219.33088
80.89.5430414.850241.5463361.59491215.02886.16928
9a1.40.143632.445863.244533.3097714.047633.82904
9b2.50.256494.36765.79385.910325.08560.409
10a1.416.7003225.987922.706092.791126.300410.79624
10b2.529.82246.4074.83234.984146.96519.279
11a4.40.451427.6869810.1970910.4021344.1496106.31984
11b80.8207713.9763218.5401618.9129680.272193.3088
12a4.452.4867281.676328.504858.7720282.658433.93104
12b895.4304148.502415.4633615.94912150.28861.6928
13101.0259617.470423.175223.6412100.34241.636
1410119.288185.62819.329219.9364187.8677.116
150.0180.214720.334130.0347930.0358850.338150.13881
160.0550.6560891.0209530.1063120.1096491.0332360.424142
170.1291.5388272.3945980.249350.2571762.4234080.994805
180.2573.0657244.7706340.4967670.5123584.8280311.981898
190.4225.0339917.8334920.8157030.8413047.9277393.254323
200.6437.67027611.935871.2428831.28189212.079474.958602
210.95511.3920917.727451.8459621.90389917.940747.364642
221.32215.7699924.539992.5553532.63555424.8352410.19482
231.78121.2453533.060313.4425743.55062133.4580613.73448
242.3528.0328943.622534.5424194.68498644.1473618.12242
253.01135.9178855.892525.8200966.00276356.5649823.21983
263.78245.1150670.204437.3103967.53983771.0490729.16552
274.756.0657887.245069.0848399.36997288.2947236.24483
285.72868.32868106.327611.0719111.4194107.606844.17243
296.92182.55984128.47313.3779113.79778130.018753.37245
309.161109.2806170.053617.707718.26347172.099670.64658
Maximum harmonic response stress (MPa) for the pipelines unconnected
caseaMode-1Mode-2Mode-3Mode-4Mode-5Mode-6
10.0250.0025650.029160.0353530.0358080.292930.29233
20.0250.298220.464070.0339570.0321130.42520.4371
30.080.0082080.0933120.113130.1145860.9373760.935456
40.080.9543041.4850240.1086620.1027621.360641.39872
50.250.0256490.29160.353530.358082.92932.9233
60.252.98224.64070.339570.321134.2524.371
70.80.0820770.933121.1312961.1458569.373769.35456
80.89.5430414.850241.0866241.02761613.606413.9872
9a1.40.143631.632961.979772.0052516.4040816.37048
9b2.50.256492.9163.53533.580829.29329.233
10a1.416.7003225.989721.901591.7983323.811224.4776
10b2.529.82246.4073.39573.211342.5243.71
11a4.40.451425.132166.222136.3022151.5556851.45008
11b80.820779.331211.3129611.4585693.737693.5456
12a4.452.4867281.676325.976435.6518974.835276.9296
12b895.4304148.502410.8662410.27616136.064139.872
13101.0259611.66414.141214.3232117.172116.932
1410119.288185.62813.582812.8452170.08174.84
150.0180.214720.334130.0244490.0231220.306150.31471
160.0550.6560891.0209530.0747050.0706510.9354580.961614
170.1291.5388272.3945980.1752180.1657082.1940752.255422
180.2573.0657244.7706340.3490770.3301314.3711424.493359
190.4225.0339917.8334920.5731930.5420827.1775177.378201
200.6437.67027611.935870.8733730.82596910.9363611.24214
210.95511.3920917.727451.2971551.22675116.2429616.69711
221.32215.7699924.539991.7956431.69818222.4850223.1137
231.78121.2453533.060312.4190932.28779330.2918431.13881
242.3528.0328943.622533.1919533.01870639.9695841.08714
253.01135.9178855.892524.0897743.86779751.2120952.64399
263.78245.1150670.204435.1370074.85818964.3255266.12407
274.756.0657887.245066.3839066.03741179.9391782.17428
285.72868.32868106.32767.7802157.35793497.42373100.1477
296.92182.55984128.4739.4006418.890409117.7147121.006
309.161109.2806170.053612.4431811.76781155.8133160.1699
Table 7. Summary of the analysis results.
Resistance to Fatigue
-Pipelines ConnectedPipelines UnconnectedBetter Case
Windup to magnitude 13up to magnitude 13equal
Earthquakeup to magnitude 5(+)up to magnitude 6(−)unconnected
Resistance to yielding (permanent deformation)
-Pipelines connectedPipelines unconnectedBetter case
Windup to magnitude 17up to magnitude 17equal
Earthquakeup to magnitude 6(+)up to magnitude 7unconnected
Resistance to fracture
-Pipelines connectedPipelines unconnectedBetter case
Windup to magnitude 17up to magnitude 17equal
Earthquakeup to magnitude 7 (1718 gal (17.18 m/s2))up to magnitude 7 (2236 gal (22.36 m/s2))unconnected
Disclaimer/Publisher’s Note: The statements, opinions and data contained in all publications are solely those of the individual author(s) and contributor(s) and not of MDPI and/or the editor(s). MDPI and/or the editor(s) disclaim responsibility for any injury to people or property resulting from any ideas, methods, instructions or products referred to in the content.