Article

A Methodology for Identifying Coastal Cultural Heritage Assets Exposed to Future Sea Level Rise Scenarios

by
Sevasti Chalkidou
*,
Charalampos Georgiadis
,
Themistoklis Roustanis
and
Petros Patias
School of Rural and Surveying Engineering, Aristotle University of Thessaloniki, 541 24 Thessaloniki, Greece
*
Author to whom correspondence should be addressed.
Appl. Sci. 2024, 14(16), 7210; https://doi.org/10.3390/app14167210
Submission received: 9 July 2024 / Revised: 11 August 2024 / Accepted: 13 August 2024 / Published: 16 August 2024
(This article belongs to the Special Issue Advanced Technologies in Digitizing Cultural Heritage Volume II)

Abstract

:
Coastal areas are currently exposed to numerous hazards exacerbated by climate change, including erosion, flooding, storm surges, and other sea level rise phenomena. Mediterranean countries, in particular, are facing a constant shrinking of coastal areas. This region also hosts significant cultural heritage assets, including several UNESCO World Heritage Sites. The present research demonstrates a methodological approach to assess the current and future exposure of Mediterranean coastal areas and heritage assets to Sea Level Rise using open access data regarding elevation, vertical ground motion, and Sea Level Change factors (e.g., ice sheets, glaciers, etc.). The future projections regard 2050 and 2100 and are based on RCP scenarios 2.6, 4.5 and 8.5. The datasets used include Copernicus GLO-30 DSM, the European Ground Motion Service’s dataset on Vertical Ground Motion, the Sea Level Change Projections’ Regional Dataset by NASA, and a hybrid coastline dataset created for the present research purposes to assist in delineating the study area. The research results demonstrate that Greece, Italy, and France’s mainland and cultural heritage assets already face SLR-related hazards but are expected to be further exposed in the future, always taking into consideration the high level of uncertainty regarding SLR projections and RCP scenarios’ hypotheses.

1. Introduction

Coastal areas have always been a place of settlement, infrastructure, provision of ecosystem services, and prosperity for nations [1,2,3]. However, over the recent decades, these areas have been exposed to a variety of natural and man-made hazards, many of which are related to climate change impacts (e.g., erosion, flooding, weather extremes) [1,4]. Recent research has provided concrete evidence that coastal areas, including urban centers, river deltas and wetlands, islands, coastal plains, etc., face the danger of area shrinking, particularly in low tidal range seas such as the Mediterranean [5,6,7,8].
Many tangible cultural heritage assets (e.g., archeological sites and excavations, built heritage, monuments, etc.) are located in coastal areas, providing evidence of the nations’ history and historic transformation and thus attributing a sense of identity to each location [9]. These monuments also provide a significant source of income via tourism, particularly to the local population [10]. In that context, efforts should be made to protect and shield these assets from possible climate-change-related risks as they are, by definition, non-renewable resources. These dangers include potential structural damage or exacerbation of material decay due to severe pattern changes in rainfall and global temperatures [11,12].
To assess the vulnerability of cultural heritage assets to climate change, one has to determine their current and future exposure to potential threats, including extreme variations in precipitation, temperature, Sea Level Rise, their sensitivity to each hazard according to their type, structural and material characteristics, and already inflicted damage, and to prepare a proper and tailored made adaptation and mitigation strategy [9,13,14,15,16]. IPCC [17] and MA [18] define adaptivity as “the ability of systems, institutions, humans and other organisms to adjust to potential damage, to take advantage of opportunities or to respond to consequences”.
Water is a major contributing factor to the structural decay of buildings, and especially cultural heritage by accelerating the physical and chemical degradation cycle of the monuments [19,20]. Water can ingress structures either through extreme precipitation and subsequent flooding phenomena [21,22] or due to Sea Level Rise, in which case the salinity of the water creates other structural threats including crystallization [23,24]. Sea Level Rise (SLR) has been acknowledged as an imminent threat to coastal monuments, with research focusing on the impact of different global warming scenarios on the sea level and the subsequent inundation of coastal monuments and archeological sites providing evidence that several UNESCO WHSs are in danger [8,25], as well as individual archeological sites and excavations, indigenous sites, etc. [26,27,28,29].
The thermal expansion of the oceans along with the major and continuous mass loss of ice sheets, glaciers, and ice caps are the key contributing factors to SLR [30]. Sea Level Rise scenarios are constructed around representative concentration pathways (RCPs) which provide a range of possible alternatives for the future atmospheric composition [31,32], mainly RCP 2.6 (strict mitigation scenario), 4.5 (intermediate scenario), and 8.5 (very high greenhouse gas emissions (GHG) [33]. However, the RCP scenarios contain an inherent level of uncertainty stemming from incomplete knowledge of the impacts and responses of the proposed GHG emissions mitigation policies, and the lack of uniform and regularly updated data [34], which, in response, led to increased uncertainty in the calculation of mass loss of the ice sheets located in Greenland and Antarctica exacerbated by the use of global rather than regional models [35], the limited consideration of the vertical movement effect on current and future elevations, e.g., tectonic movement, groundwater extraction [5,35,36,37], and, of course, the explicitly dynamic character of the natural phenomena [38]. Sea Level Rise has progressed rapidly from an average rate of 1.2 mm/year between 1901 and 1990 to 3 mm/year between 1993 and 2010 [39,40]. Recent Sea Level Rise studies have demonstrated an expected average global increase of 1–2 m until 2100 under different scenarios [3,41,42].
The ongoing TRIQUETRA research project, funded by the European Union, aims to design a toolbox for the assessment and mitigation of climate-related risks and natural hazards affecting Cultural Heritage Assets [43,44]. That will be achieved through the implementation of a knowledge repository on the effects of climate change and related geohazards on CH, the drafting of a new methodological approach to identify potential risks and hazards, the quantification of threats to CH through the implementation of cutting-edge technologies and, finally, the dissemination of the results to the scientific community and the general public to increase awareness on the issue and enable citizen participation in the decision-making process [43,44].
The present research demonstrates the methodological approach followed in the TRIQUETRA Project to assess the current and future exposure of cultural heritage assets to Sea Level Rise scenarios, by presenting the development of necessary workflows, using open access data to produce SLR-affected area maps for 2050 and 2100 based on the 2019 IPCC report for RCP 2.6, 4.5, 8.5 and to determine the CH assets that face imminent threat due to SLR by 2100.

2. Materials and Methods

2.1. Study Area

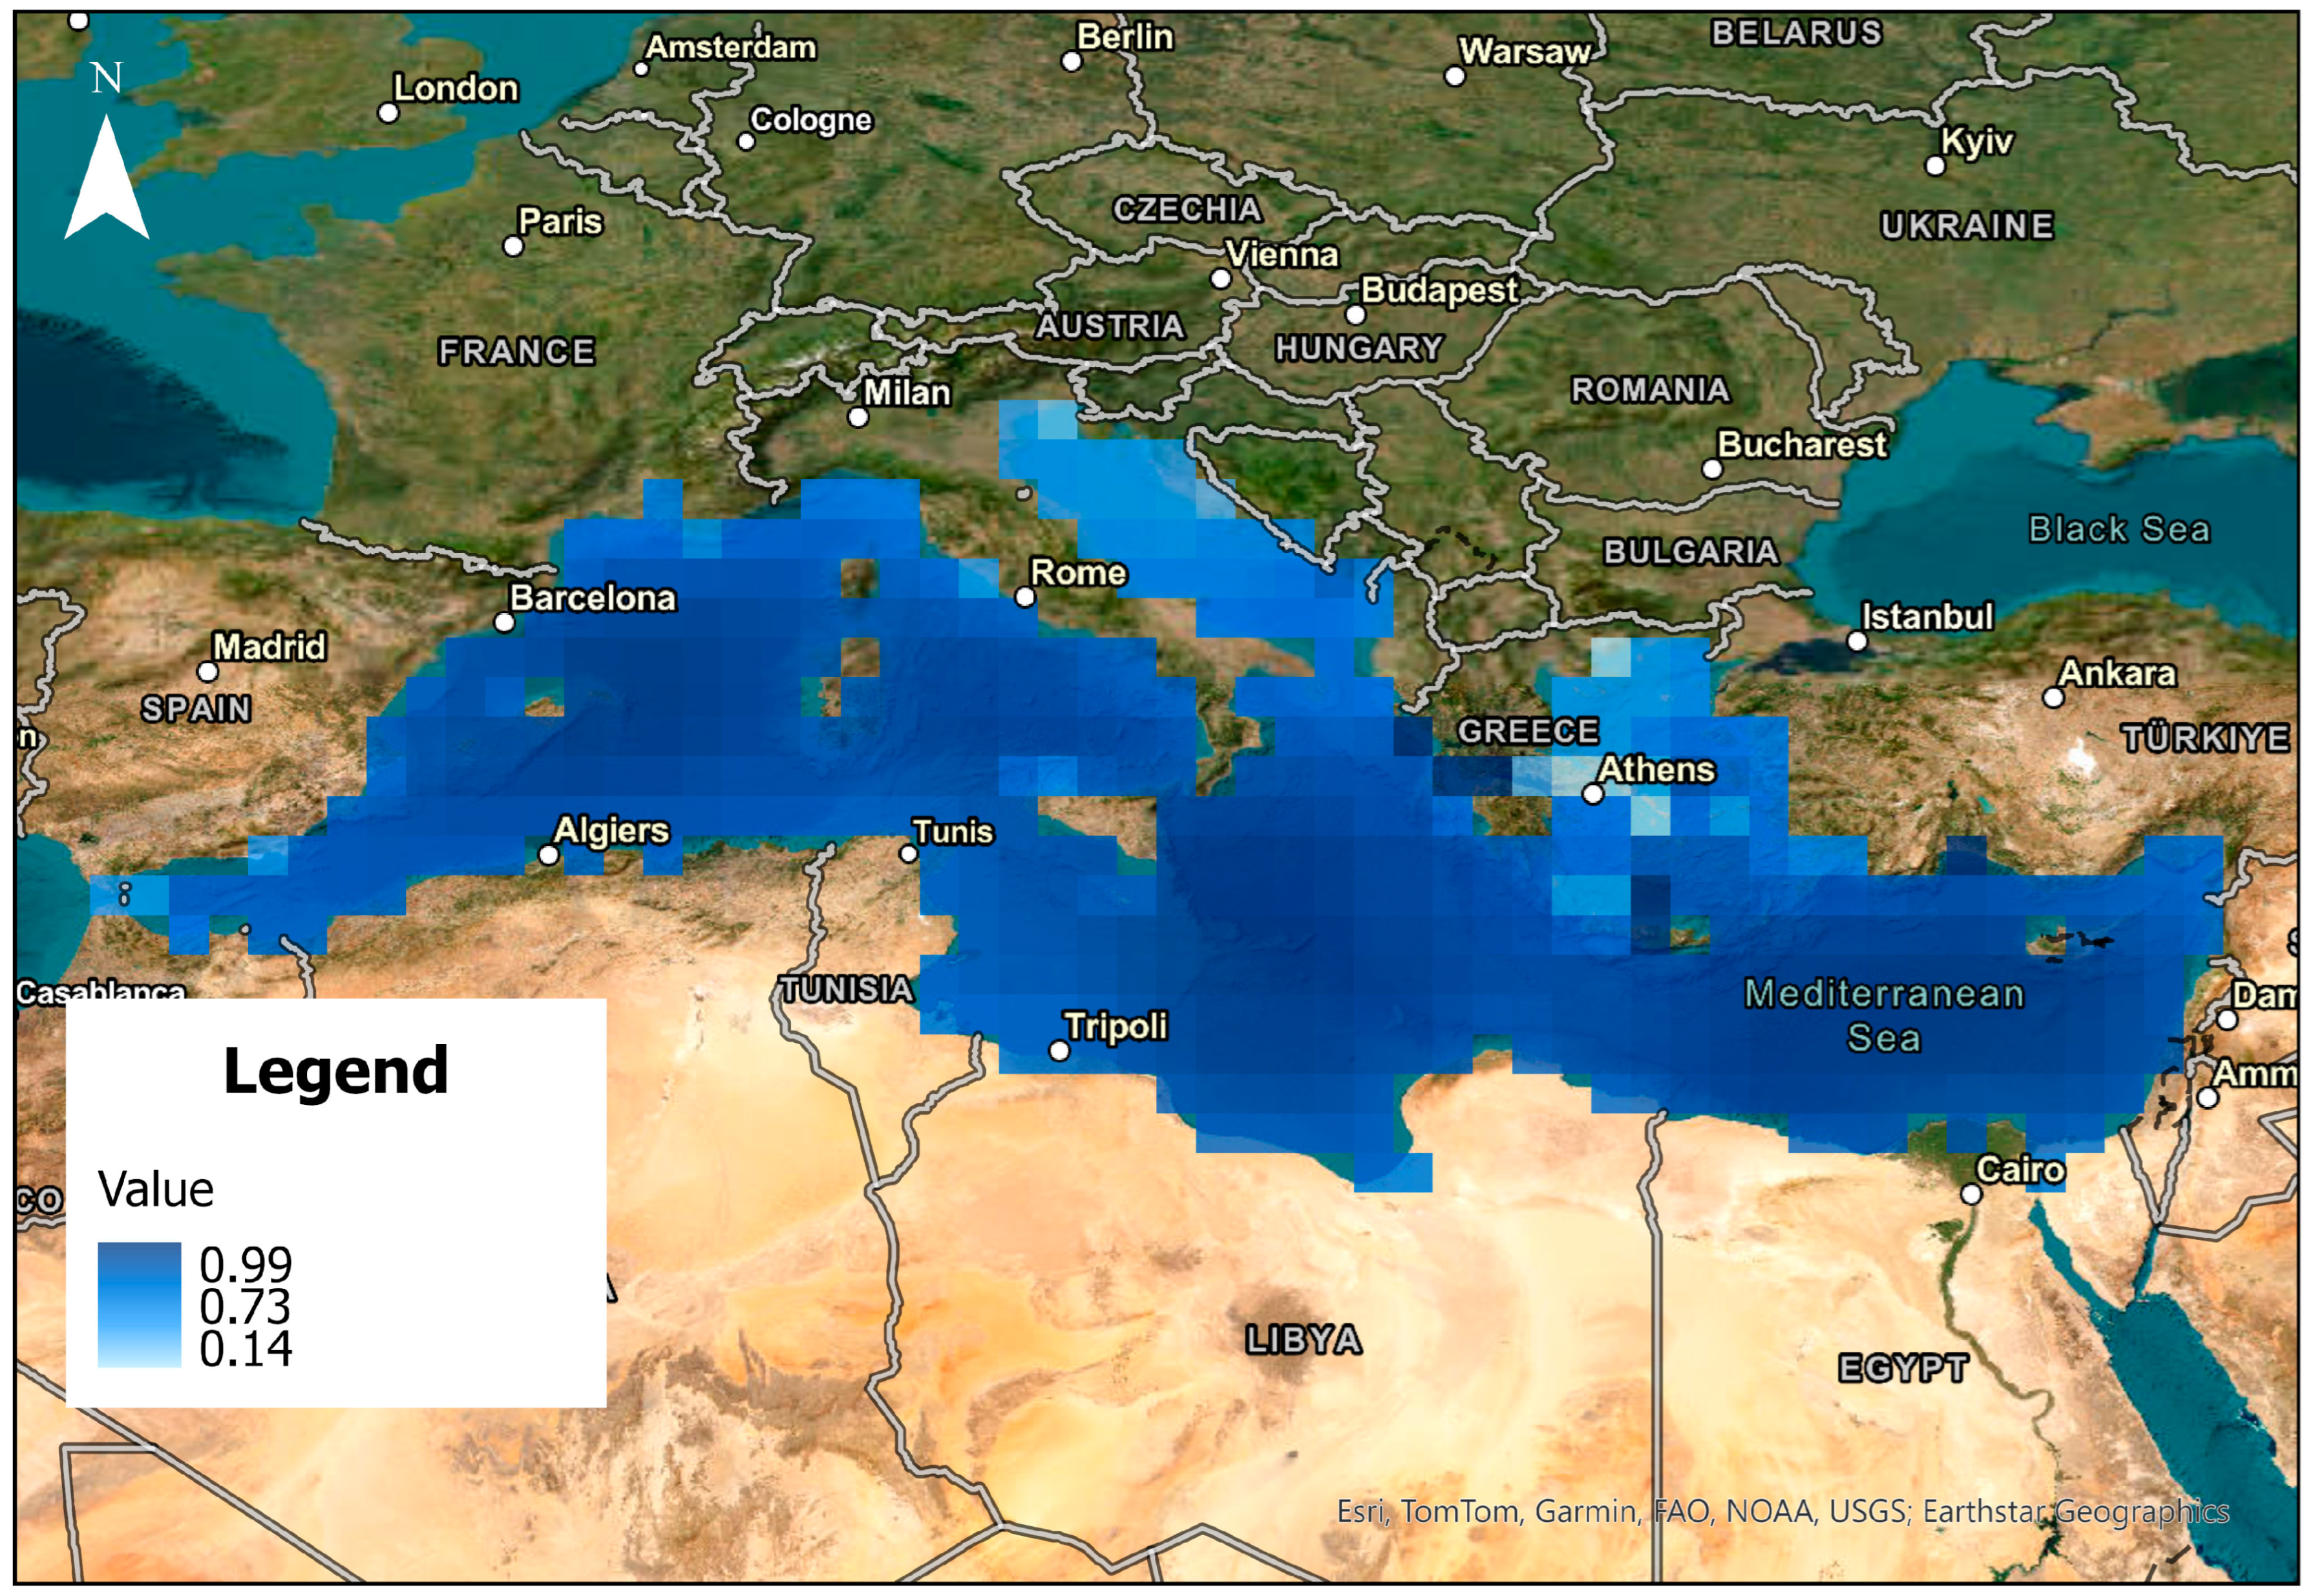
The study area in the present research is the European Union’s (EU-27) coastal Mediterranean Region, which can be a prime case study for measuring the impact of Sea Level Rise on coastal heritage assets. The broader Mediterranean Coast Area hosts approximately 150 UNESCO World Heritage Sites (Figure 1) and more than 6700 other heritage sites, including excavation sites, ancient monuments, and ruins, fortresses, Medieval castles, modern monuments, etc., in countries including Greece, Italy, Spain, France, Cyprus, Malta, Croatia, and Slovenia.
The study area is defined as a 2 km buffer zone from the coastline to the mainland of the countries, which is considered a sufficient zone to study and monitor the potential effects of sea level rise on the CH assets. As expected, the border extension, the morphology of the region, and the insular character of some countries contribute significantly to different levels of exposure to sea level change. Greece and Italy have more than double the coastline extension of the other EU countries (Table 1).

2.2. Data Collection and Preprocessing

Four main sources of data are needed to identify and assess risk-prone areas from Sea Level Change in the Mediterranean Coasts:
  • A vector file depicting the coastline of Mediterranean European countries.
  • Digital Elevation Information/Digital Elevation Model.
  • Information on vertical ground movement in the area of interest.
  • Information on the projections of Sea Level Change for 2050 and 2100 under IPCC scenarios 2.6, 4.5 and 8.5.
The data used for the present research are open-source and available for download (sometimes following a simple registration process).

2.2.1. Coastline Information

Several global and European-level datasets are available depicting coastline information, including the Global Self-consistent, Hierarchical, High-Resolution Geography Database (GSHHG) [45], the USGS Global Shoreline Vector and the European Environment’s Agency Polygon Coastline Dataset for Analysis. (EEA). GSHHG is a global dataset that combines information on shorelines from two geographical databases, namely the World Vector Shorelines produced by N.O.A.A regarding shoreline data and the CIA World Data Bank II for lake and river boundaries, as well as political boundaries [45]. Its information is organized around four discrete levels: boundaries between land and ocean (L1), lake and land (L2), island-in-lake and lake (L3), and pond-in-island and island (L4) [45]. The USGS Global Shoreline Vector developed by the United States Geological Survey (USGS) is a 30 m spatial resolution dataset developed by using annual composites of Landsat satellite imagery from 2014 [46]. The classification of the imagery was performed in a semi-automated way through the manual selection of the training sites representing water or non-water bodies along the coastline [46]. The result of this process was the classification into two three distinct classes, namely continental mainland polygons (5 entries), islands smaller than 1 km2 (318,868 entries), and islands larger than 1 km2 (21,818 entries). Finally, the European Environment Agency (EEA) provides a polygon coastline dataset for analysis. These data are a composite product that combines satellite information from two distinct projects, namely, EUHYDRO (Pan-European Hydrographic and Drainage Database, link: https://land.copernicus.eu/en/products/eu-hydro, accessed on 6 May 2024) and GSHHG (A Global Self-Consistent, Hierarchical, High-resolution geography database, link: https://www.soest.hawaii.edu/pwessel/gshhg/, accessed on 5 May 2024) [47]. The combined dataset was further modified to comply with the requirements and several policy documents, including the EU Nature Directives, Water Framework Directive, etc. [47].
Although these datasets have been used in similar studies, it was noticed that they present significant deviations from the coastal ground truth—at least in the Mediterranean Sea Coasts (Figure 2). As a result, finer-scale open-source coastline data were retrieved from national geoportals, including Greece, France, Italy, Spain, Malta, and Cyprus, thus creating a hybrid coastline vector dataset combining the different coastline vectors and the EEA coastline file in the case of Slovenia and Croatia. All data were reprojected into a common Coordinate Reference System (i.e., EPSG: 3035-ETRS89/LAEA) and the hybrid coastline was buffered at a 2 km distance to the mainland to create the area of interest for the current research.

2.2.2. Digital Elevation Models

Digital Elevation Models (DEMs) and their derived products (e.g., slope, hillshade) are a crucial source of data regarding spatial and environmental analysis, including coastal vulnerability to sea level rise scenarios [48,49,50,51]. Several global Digital Elevation Models (DEM) or Digital Terrain Models (DTM) are openly available at a resolution of approximately 30 m, including global models, for example, ASTER-GDEM [52,53], NASADEM [54], AW3D30, SRTM 1-arcsecond v.3, Copernicus DEM.
The ASTER-GDEM is a cooperation product between the United States National Aeronautics and Space Administration (NASA), and the Japanese Ministry of Economy, Trade and Industry (METI) [55]. It covers 99% of the land surface of the Earth from latitude 83° North to 83° South. In 2019, GDEM v.3 was published, using a thorough automated and manual anomaly correction program in addition to several hundred thousand extra scenes that were incorporated to enhance quality and accuracy [55]. Its positional accuracy varies between 18 and 20 m, while its vertical accuracy varies between 15 and 16 m.
NASADEM is an updated version of the DEM product generated through the Shuttle Radar Topography Mission, initially published in January 2019. Using enhanced algorithms, the SRTM raw signal data were reprocessed, combined with additional information mainly from the Advanced Spaceborne Thermal Emission and Reflection Radiometer (ASTER) and Ice, Cloud and Land Elevation Satellite (ICESat) Geoscience Laser Altimeter System (GLAS) instruments [54]. These cover 80% of the land surface of the Earth from latitude 61° North to 56° South. Their positional accuracy is around 20 m, while their vertical accuracy is around 10 m [56].
The Advanced Land Observing Satellite (ALOS)-AW3D30 was produced by the Japanese Aerospace Exploration Agency (JAXA). The ALOS world 3D generated the ALOS world 3D-30 m mesh. With a grid size of 5 m, the ALOS world 3D is a high-resolution DSM that spans the latitude regions of +/−80 degrees. Resampling 7 × 7 pixels from the AW3D DSM dataset produced the ALOS World 3D 30 m DSM [57]. AW3D30DSM’s attained accuracy and found that it can produce a height RMSE of 4.4 m [57]. The 5 m dataset is available under a commercial license; however, a 30 m resolution dataset is openly available (AW3D30).
The Shuttle Radar Topography Mission (SRTM) was carried out on 11–22 February 2000 using the space shuttle Endeavour. The first nearly worldwide set of land elevations was created through the participation of the National Aeronautics and Space Administration (NASA), the National Geospatial-Intelligence Agency (NGA), and several international partners to acquire radar data. The SRT Mission used two Synthetic Aperture Radars (SAR), a C band system (5.6 cm/C radar), and an X band system (3.1 cm, X radar) [58]. The mission completed 176 orbits around the Earth (16 orbits per day for 11 days) and collected data points per every 1-arc second (approximately 30 m) covering 80% of the Earth’s surface between 60° North and 56° South latitude [58]. SRTM’s absolute geolocation error varies from 7.2 to 12.6 m, and the absolute height error varies from 5.6 to 9.0 m, while the relative height error varies between 4.7 and 9.8 m [59].
Copernicus DEM is a Digital Surface Model depicting the Earth’s entire surface, including buildings, vegetation, and infrastructure [60]. The DEM was developed based on an edited DSM, entitled WorldDEMTM, which includes flattening water bodies and consistent river flows. An additional editing process has been applied regarding features such as airports, shores, coastlines, etc. A public–private cooperation between Airbus Defence and Space and the German Aerospace Center led to the collection of radar satellite data used to create the WorldDEM product [61]. Although Copernicus DEM is a rather recent dataset and its accuracy has not been extensively studied, some researchers have demonstrated that its vertical accuracy ranges between 2 and 6 m [61,62].
Several studies have tried to assess and compare the accuracy between freely available DEMs using either GPS-measured ground control points or finer-scale DEMs produced through photogrammetric processes [63,64,65,66,67,68,69]. The vertical accuracy of the world DEM files depends on the geomorphology of the ground and the terrain of each specific region, but, generally speaking, Copernicus GLO-30 and AW3D30 appear to outperform NASADEM, SRTM, and ASTERGDEM [67,70]. As a result, the Copernicus GLO-30 DEM was selected as the primary source of elevation information in the present research. The dataset’s tiles were converted into a mosaic raster file, projected from WGS84 to ETRS89, and clipped to the area of interest’s extent. The elevation in the area of interest varies from −23 to 1175 m, with the more mountainous locations found in Greece and the Mediterranean complex of islands, while mainland France, Spain, and the Adriatic Sea present lower elevation combined with shallow water locations and major river deltas.

2.2.3. Vertical Ground Motion Data

The European Ground Motion Service (EGMS) is based on Earth observation products using Synthetic Aperture Radar Interferometry (InSAR) data from the Sentinel-1 mission [71,72]. Its goal is to determine and measure vertical ground movements across the European Territory caused by natural phenomena including tectonic activity, groundwater extraction, mining activities, etc. It is expected that the EGMS can assist a variety of interdisciplinary stakeholders in monitoring potential structural hazards in constructions (e.g., dams, buildings, road infrastructure, bridges), as well as promote data-driven decision-making in the fields of spatial planning and natural hazard risk mitigation [73,74].
The EGMS provides consistent, reliable, and interoperable information on ground motion phenomena through three different levels of products that are updated on an annual basis [71,72]:
  • Basic/L2a: This category provides line-of-sight velocity maps—in descending and ascending satellite orbits—including geolocalization and quality measures per point. These products refer to a local reference point.
  • Calibrated/L2b: Compared to the basic level of products, the calibrated ones are absolute in value since they do not refer to a local reference point. They include line-of-sight velocity maps referenced to a model derived from GNSS time-series data.
  • Ortho/L3: This level of products includes components of motion (horizontal and vertical) anchored to the reference geodetic model. These products follow a raster format of 100 m resolution.
EGMS’s initial dataset covered the period between 2015 and 2021 [75]. Its results were verified for usability in a variety of applications according to documented user requirements and the quality and consistency of the provided data with the technical specifications of various application scenarios [76].
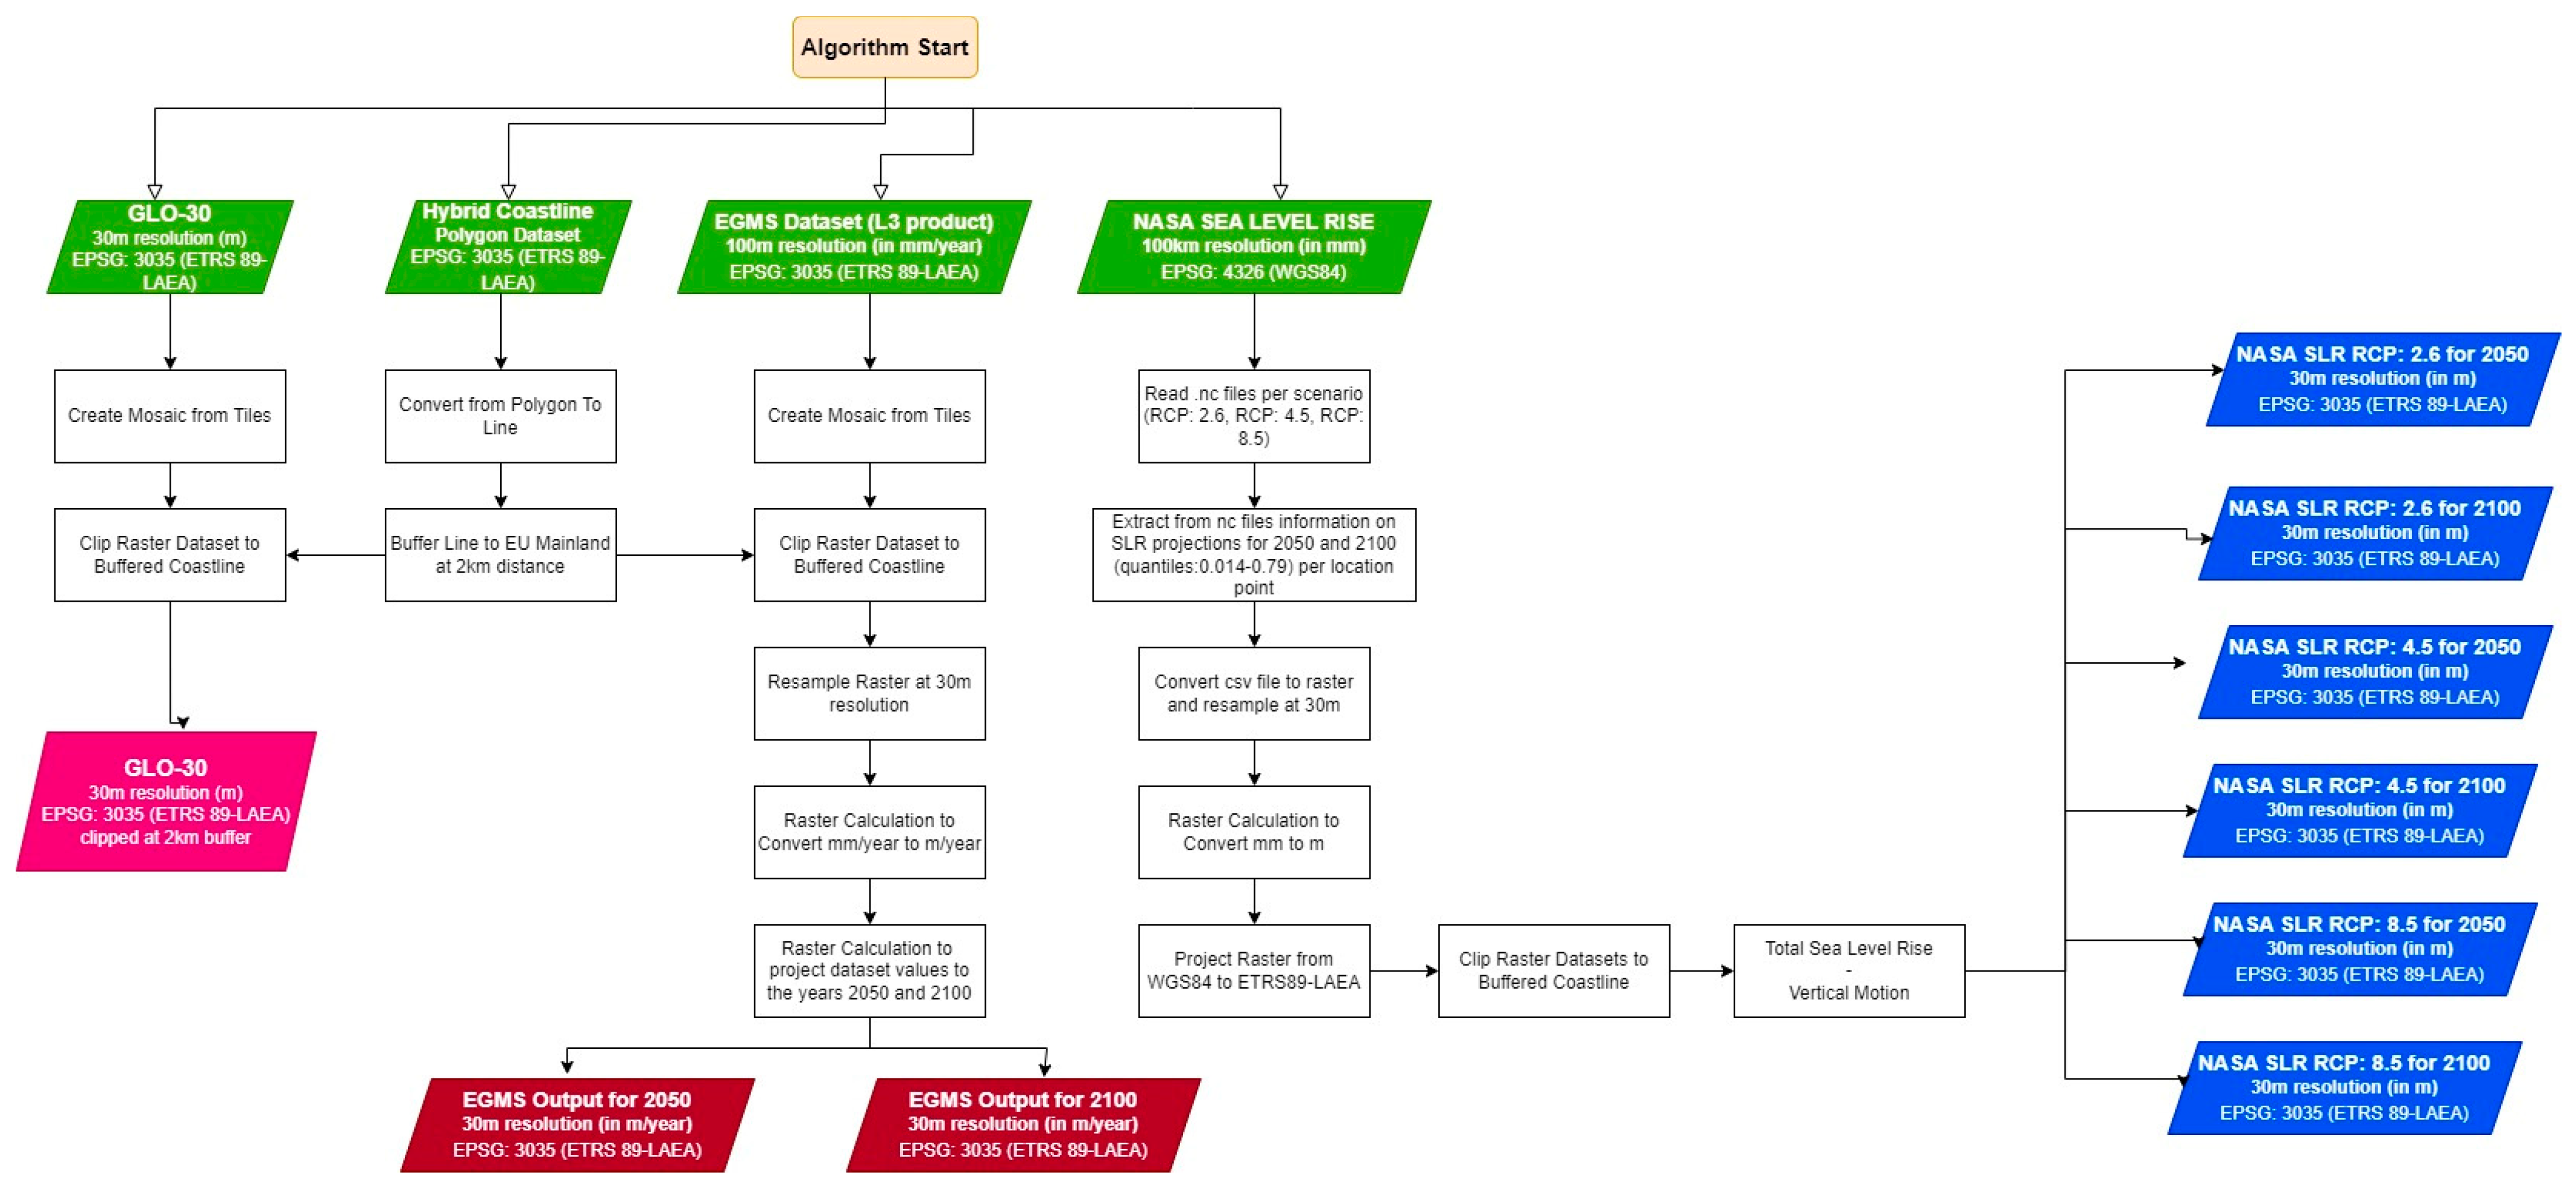
The present research used the EGMS L3 product as it provides a raster version of the intended dataset that is easier to process. As can be seen, in the Mediterranean Coastal Zone, the recorded vertical ground motion using SAR algorithms varies from −91 mm/year (located particularly in the Southern parts of Greece) to +63 mm/year (Figure 3). The preprocessing stage included the mosaicking of the necessary tiles that were downloaded from the EGMS portal and the conversion of the mean velocity value from mm/year to m/year. The data were resampled from 100 m resolution to 30 m to match the pixel size of GLO-30 DEM and were clipped to the area of interest’s extent. The annual mean values were considered constant and projected to the target years of study, i.e., 2050 and 2100, by applying a simple raster calculation.

2.2.4. Sea Level Change Projections

NASA’s Sea Level Projection Tool (https://sealevel.nasa.gov/ipcc-ar6-sea-level-projection-tool, accessed on 2 May 2024) was used to measure the potential impact of Sea Level Change on the coastal regions and heritage assets in the Mediterranean Sea. The data are based on the findings of IPCC’s 6th Assessment Report for Working Group 1 [77]. The tool incorporates all five RCP or SSP (Shared Socioeconomic Pathways) and five Global Mean Surface Temperatures. All data can be downloaded for further analysis and processing in a NetCDF format with a separate file for each IPCC scenario [77,78]. The datasets are split into different contributing components, i.e., Antarctic Ice Sheet, Greenland Ice Sheet, Glaciers, Land Water Storage, Ocean Dynamics, Vertical Land Motion (non-climatic processes), and total expected Sea Level Rise (integrating all individual components) [41,77]. The dimensions of the NetCDF file include the location where the SLR projection is calculated, the years at which projection data are available (i.e., from 2020 to 2150 using a 10-year increment), and the quantiles which refer to the quantile probability box of the SLR with 107 available values ranging from 0.0 to 1.0 in 0.01 increments. The “Sea Level Change” variable refers to SLR since the AR6 reference period, in millimeters. The “Sea Level Change Rate” variable depicts 10-year average rates in mm/year.
The pre-processing of NASA’s Sea Level Rise datasets involves reading the NetCDF files per scenario (e.g., RCP: 2.6, 4.5, 8.5) and extracting information on SLR projections for 2050 and 2100 per location point (expressed as the median value of the quantile intervals between 0.14 and 0.79), using Python Scripts in Google Colab Notebooks. The extracted data are saved in csv format and converted to a raster mosaic of 30 resolution using desktop GIS software (QGIS v.3.28) The mosaic is then re-projected from WGS84 to ETRS89-LAEA. A raster calculation is performed to convert SLR units from mm/year to m/year. The output of this process consists of six individual raster files that refer to different RCP scenarios for the two target years (2050, 2100). Each output raster is clipped to the area of interest boundaries to depict the expected SLR in meters. The process is repeated for both Total Sea Level Rise and vertical motion datasets. The two are then subtracted, and the vertical motion value is replaced by EGMS’s datasets’ set values, which are more accurate and precise at the local level of the Mediterranean Sea. Figure 4 provides information on SLR projection for the target year 2100 under RCP 8.5 scenario.

2.2.5. Coastal Cultural Heritage

The final dataset refers to the location of the coastal cultural heritage assets in the Mediterranean countries of EU-27. Two distinct data sources were used, i.e., UNESCO’s World Heritage Sites (WHSs) point locations (https://whc.unesco.org/en/list/, accessed on 15 May 2024) and data extracted from OpenStreetMap (OSM) using Python scripts and keywords to identify place markers (i.e., “heritage”, “archaeology”). The OSM dataset returned point, line, and polygon findings. Both datasets were reprojected from WGS84 to ETRS89-LAEA and through a spatial selection limited to the area of interest. In the case of point geometry heritage assets, a buffer zone of 50 m was applied to ensure that the monuments would not be omitted from the endangered assets due to Sea Level Rise.
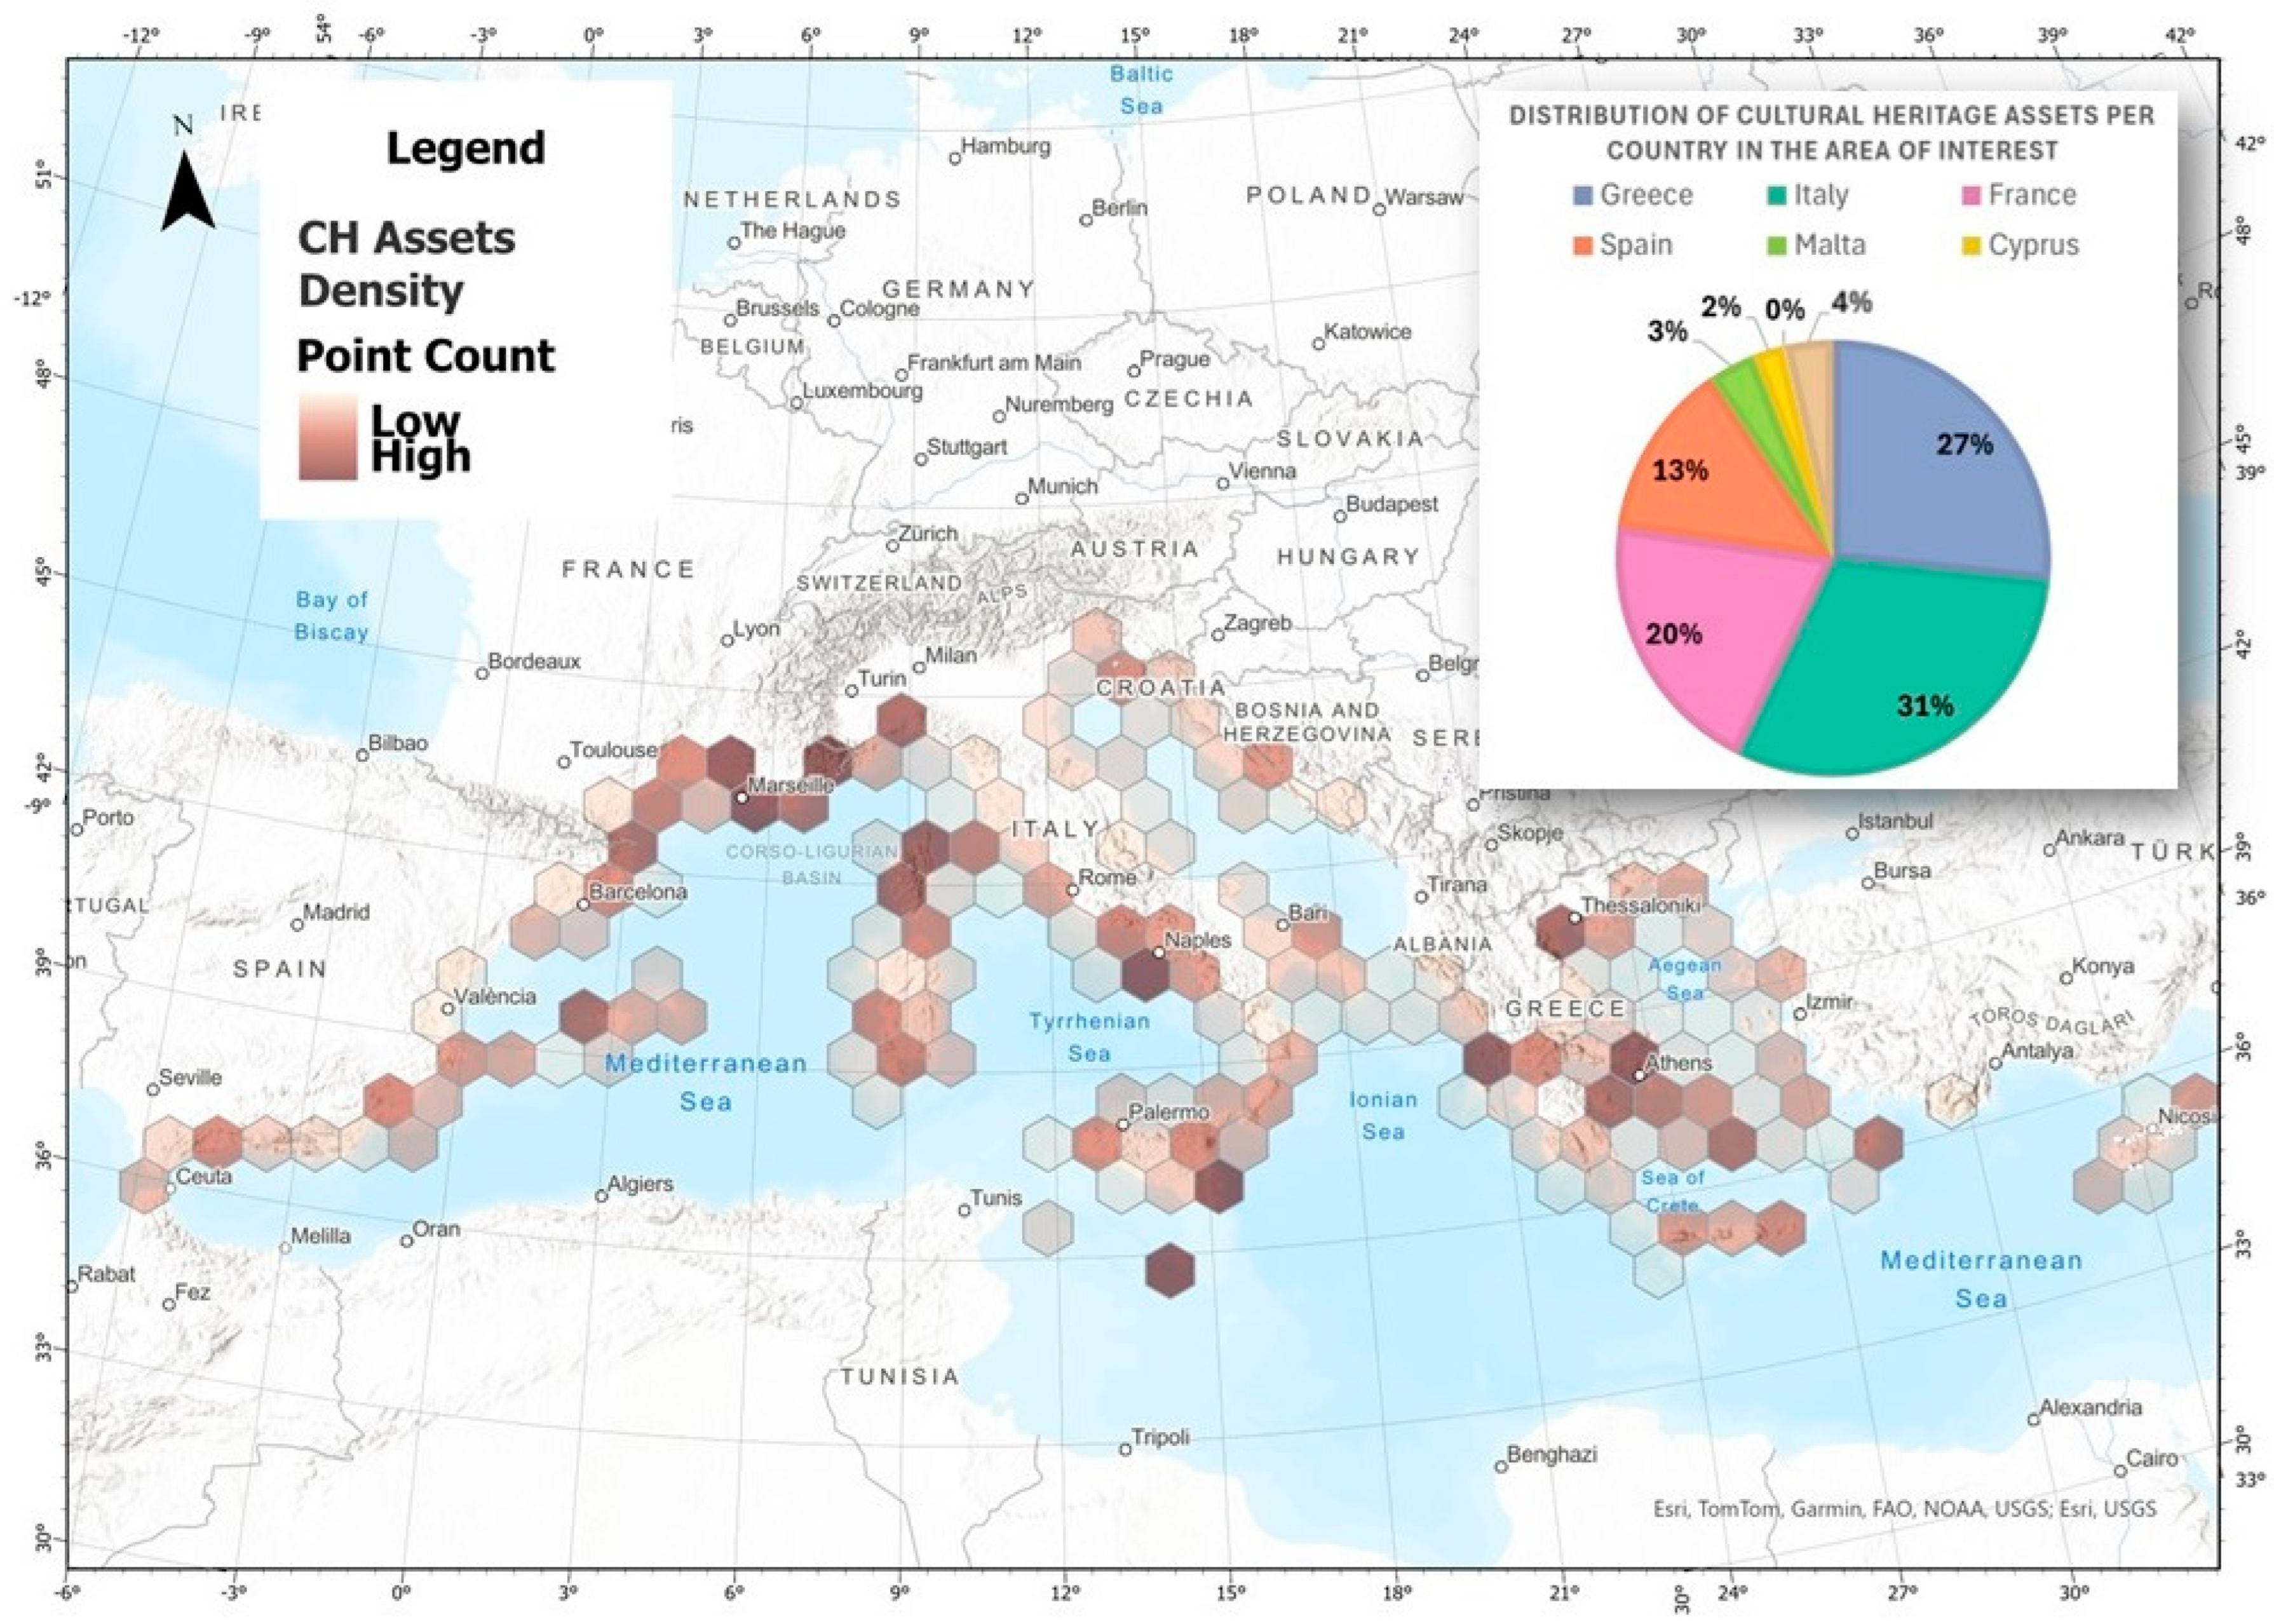
Twenty-eight UNESCO WHSs are located in the area of interest (e.g., Delos in Greece, the old city of Dubrovnik in Croatia, the City of Valetta in Malta, etc.). Furthermore, 3512 heritage point locations were retrieved from OpenStreetMap, presenting a very dense distribution in the coastal areas of Greece, Italy, France, and Spain (Figure 5).
The final pre-processing algorithm can be seen in Figure 6.

2.3. Methodology Workflow

Once the pre-processing stage finishes, the algorithm proceeds to raster calculations to determine the AOI’s elevation for target years 2050 and 2100 under the three RCP scenarios of interest. Through an automated raster calculation process, the algorithm adds GLO-30 DEM values and EGMS vertical land movement values and, finally, subtracts NASA’s SLR Projection Values (Figure 7). This step will provide six new raster layers depicting elevation value under RCP scenarios 2.6, 4.5, and 8.5 for the target years.
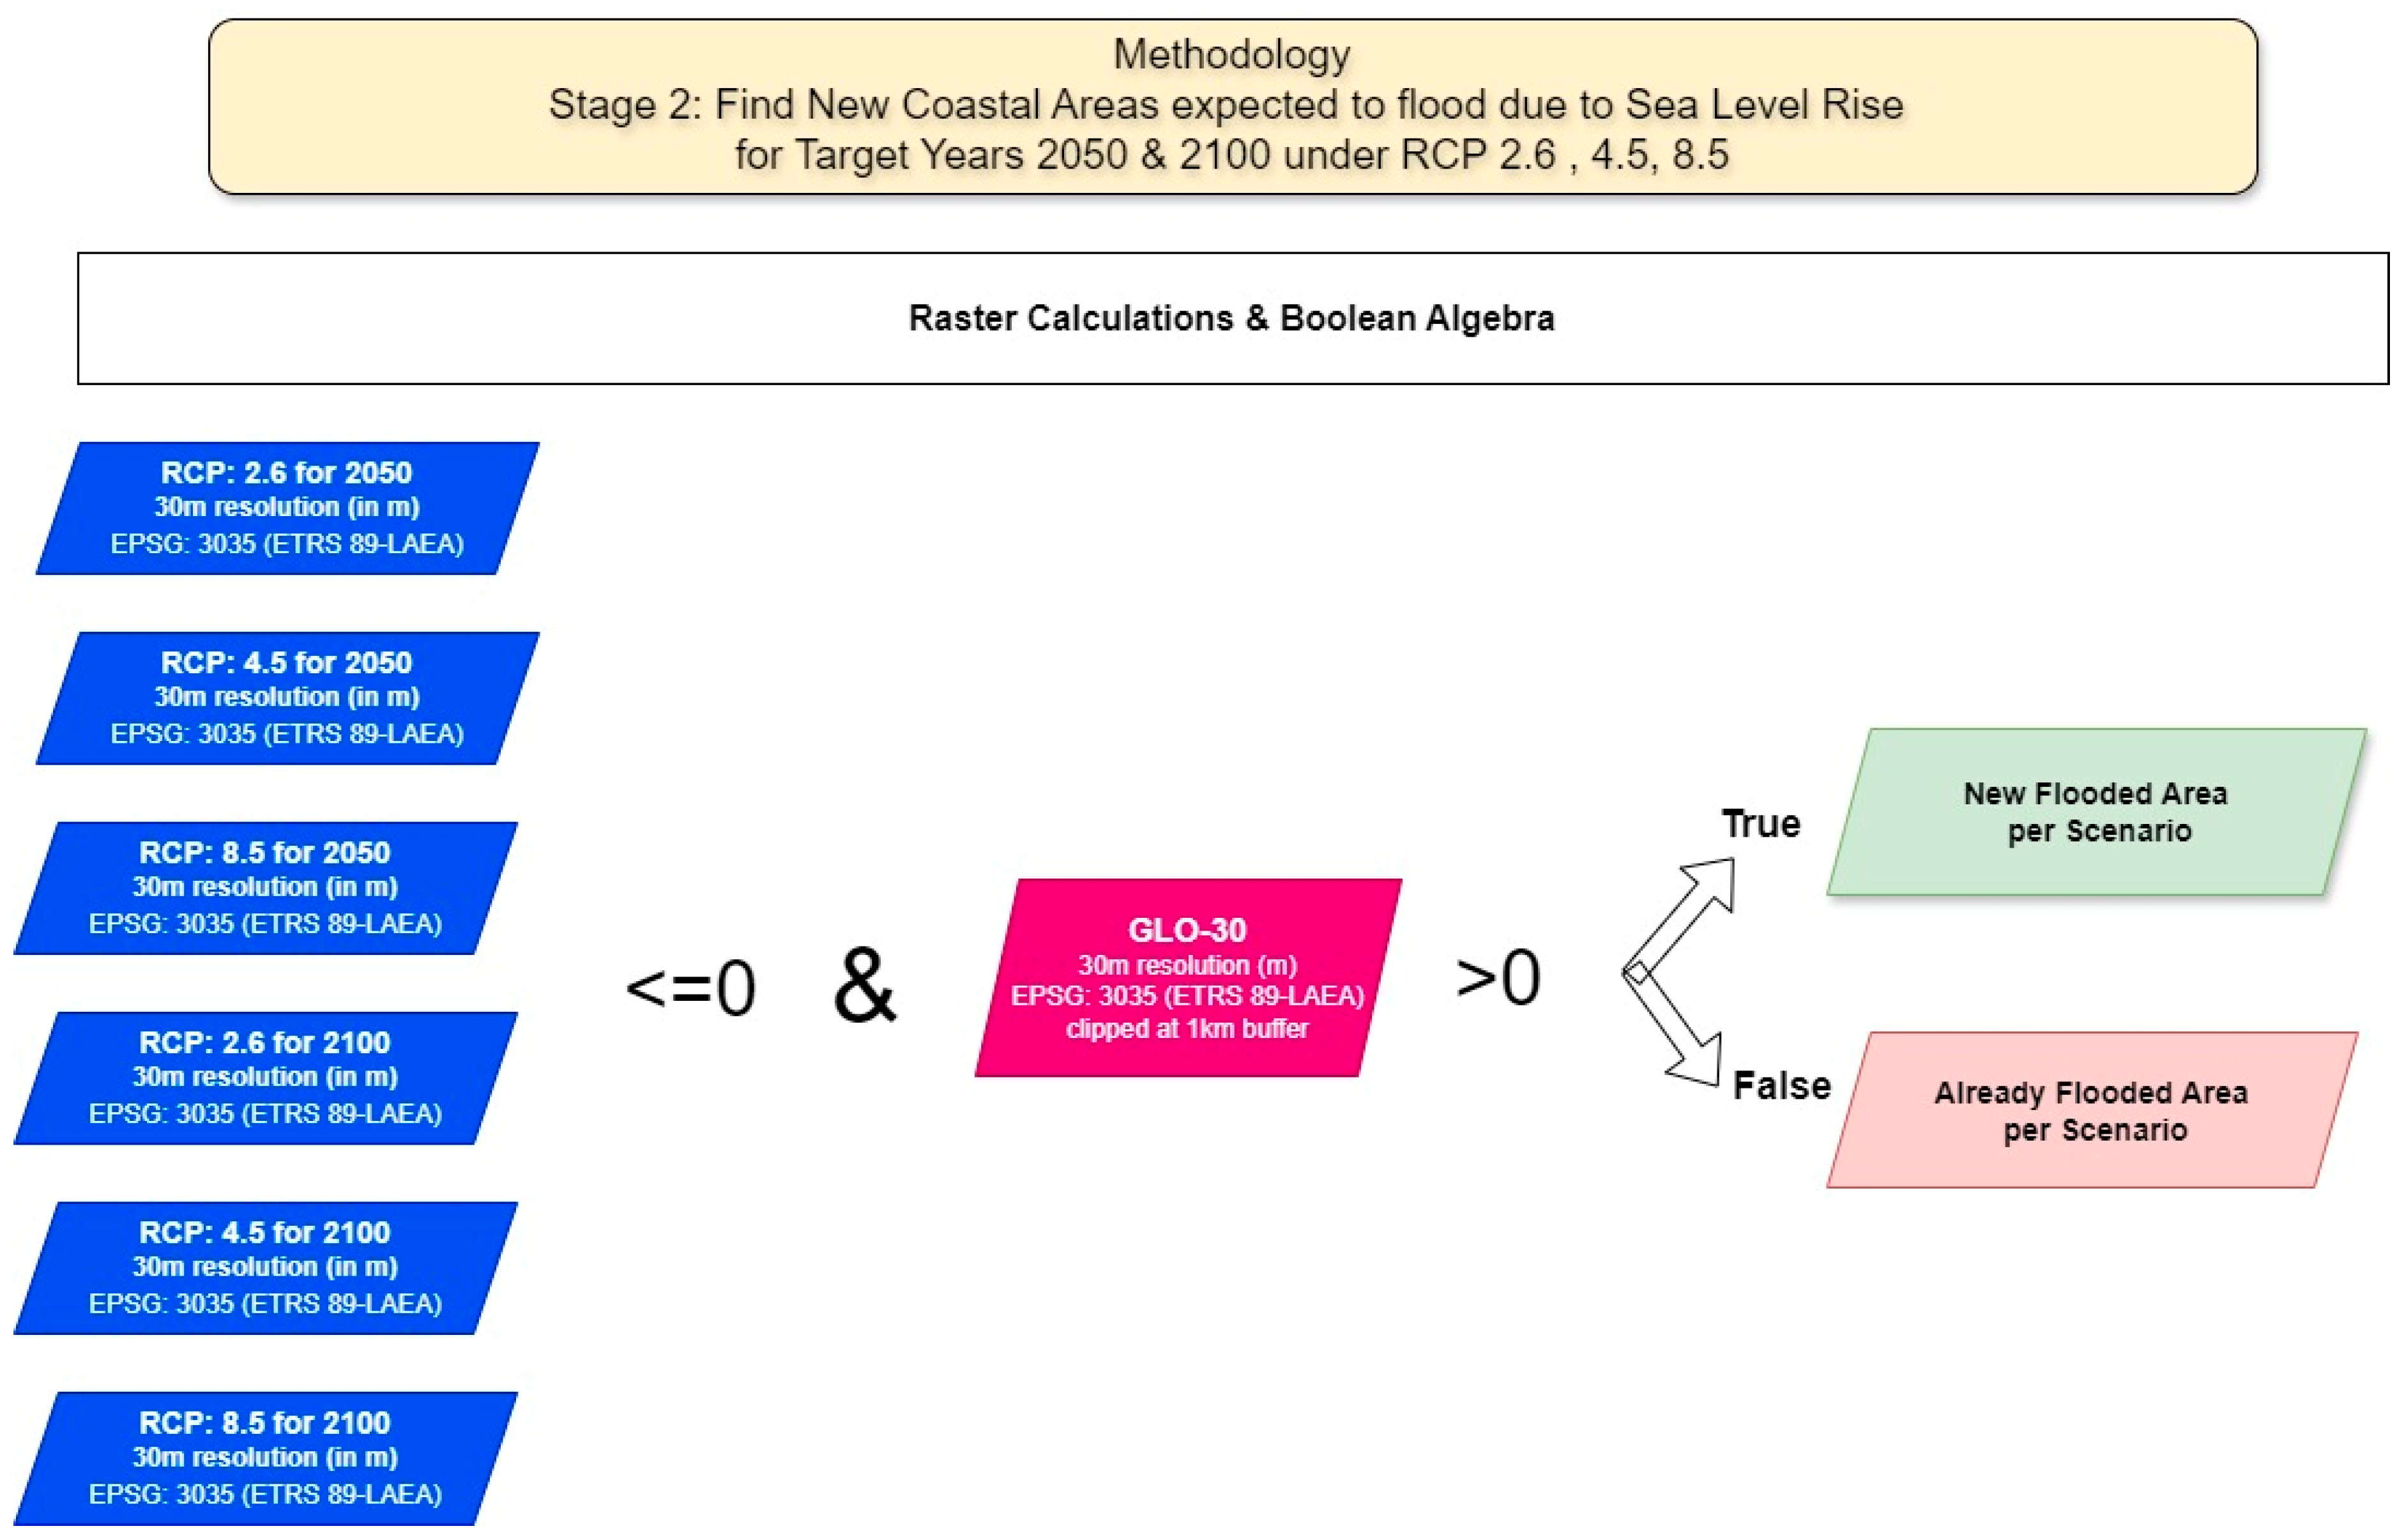
The next algorithmic step involves using raster calculations and Boolean algebra to select and extract the sub-areas in the area of interest that are affected by the different RCP scenarios for target years 2050 and 2100, i.e., the areas that at present have an elevation value greater than zero but in the future—according to the available data and calculations performed at previous algorithmic steps—have a negative or equal to zero elevation value (Figure 8). The output of this stage is six raster files delineating affected areas by the RCP scenarios under consideration for the target years 2050 and 2100. These files can be converted into vector features for further processing, i.e., area calculation, statistics calculation per country, proximity analysis to known heritage sites, etc. The final step involves performing spatial queries to identify the coastal heritage sites expected to be affected by Sea Level Rise under the studied scenarios and organize this information per type of monument (i.e., UNESCO World Heritage Site or Cultural Heritage Site) and per country to assess the level of vulnerability that each Mediterranean EU-27 country’s heritage faces.

3. Results

The algorithmic process described above was applied in the Mediterranean EU-27 countries to identify heritage assets under probable threat due to Sea Level Rise under RCP 2.6, 4.5, and 8.5 in 2050 and 2100. The area of interest was defined as an internal 2 km buffer zone from the hybrid coastline that was drafted. This zone contains very heterogeneous landscapes, including major ports (e.g., Barcelona, Marseille), mountainous regions, farmland, estuaries, environmentally protected sites, etc.
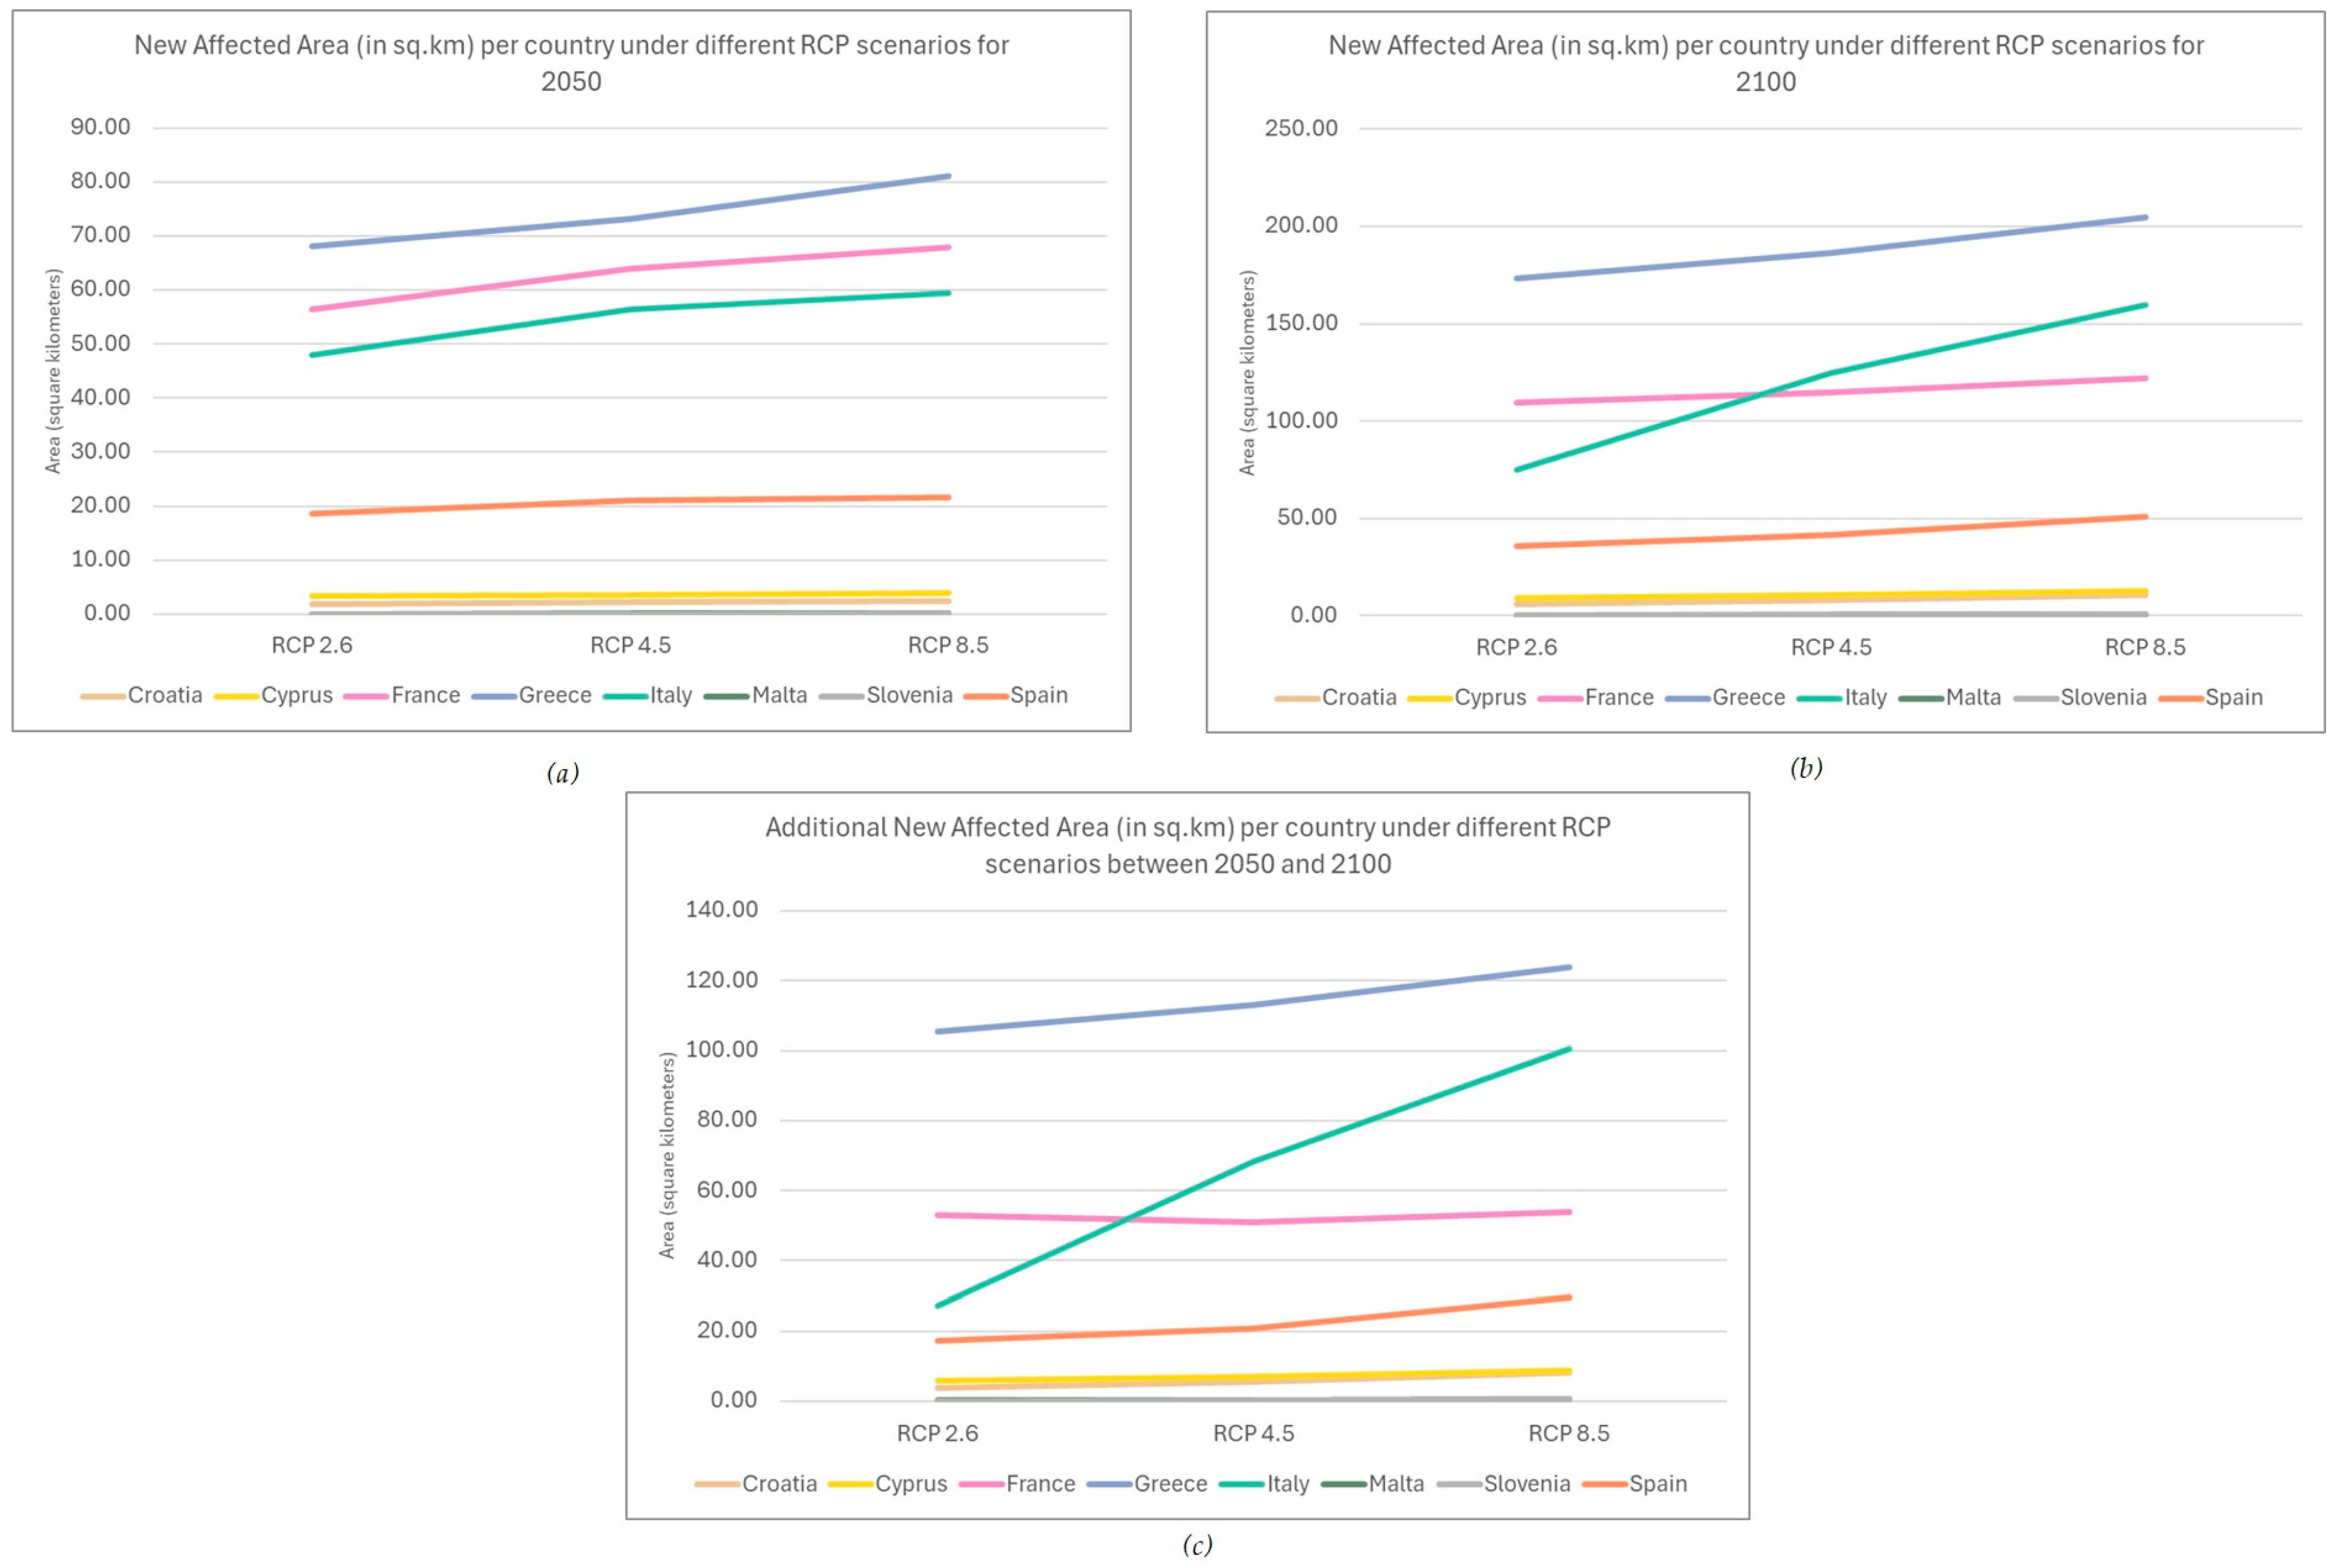
Table 2 presents the calculated area, in square kilometers, expected to be affected by SLR per country. As can be seen in Figure 9, the coastal areas of Greece, France, and Italy are expected to be more affected by Sea Level Rise scenarios. At the same time, Malta, Slovenia, and Croatia do not seem to face significant threats and the effect of the different RCP scenarios remains rather constant per target year. That can be attributed to the extensive coastline of Greece and Italy but also to the geomorphology and elevation of certain parts of France, since France ranks 5th in terms of coastline length but surpasses Spain and Croatia in the extent of the SLR-affected area (Table 2). Finally, it can be noted in Figure 9c that the effect of SLR is expected to be more prominent in Greece and Italy between 2050 and 2100 under the different RCP scenarios, while France, Cyprus, Croatia, Slovenia, and Malta will present a rather constant number of additional coastal flooded land under the three scenarios.
Four UNESCO World Heritage Sites face significant danger from Sea Level Rise: the island of Delos, the Medieval City of Rhodes, Pythagoreion and Heraion of Samos in Greece, and the Amalfi Coast in Italy. Delos appears to be more sensitive as it is expected to be partially flooded under all three RCP scenarios for 2050 and 2100. In contrast, the other three sites are expected to present additional flooded areas only in 2100 and not 2050. With regard to the CH assets that were retrieved from OpenStreetMap, a total of 246 locations (out of a total of 3512 in the area of interest) are expected to be affected by SLR under one or more RCP scenarios in 2050 or 2100, more than 80% of which are located in the Greek and Italian coasts (Figure 10).
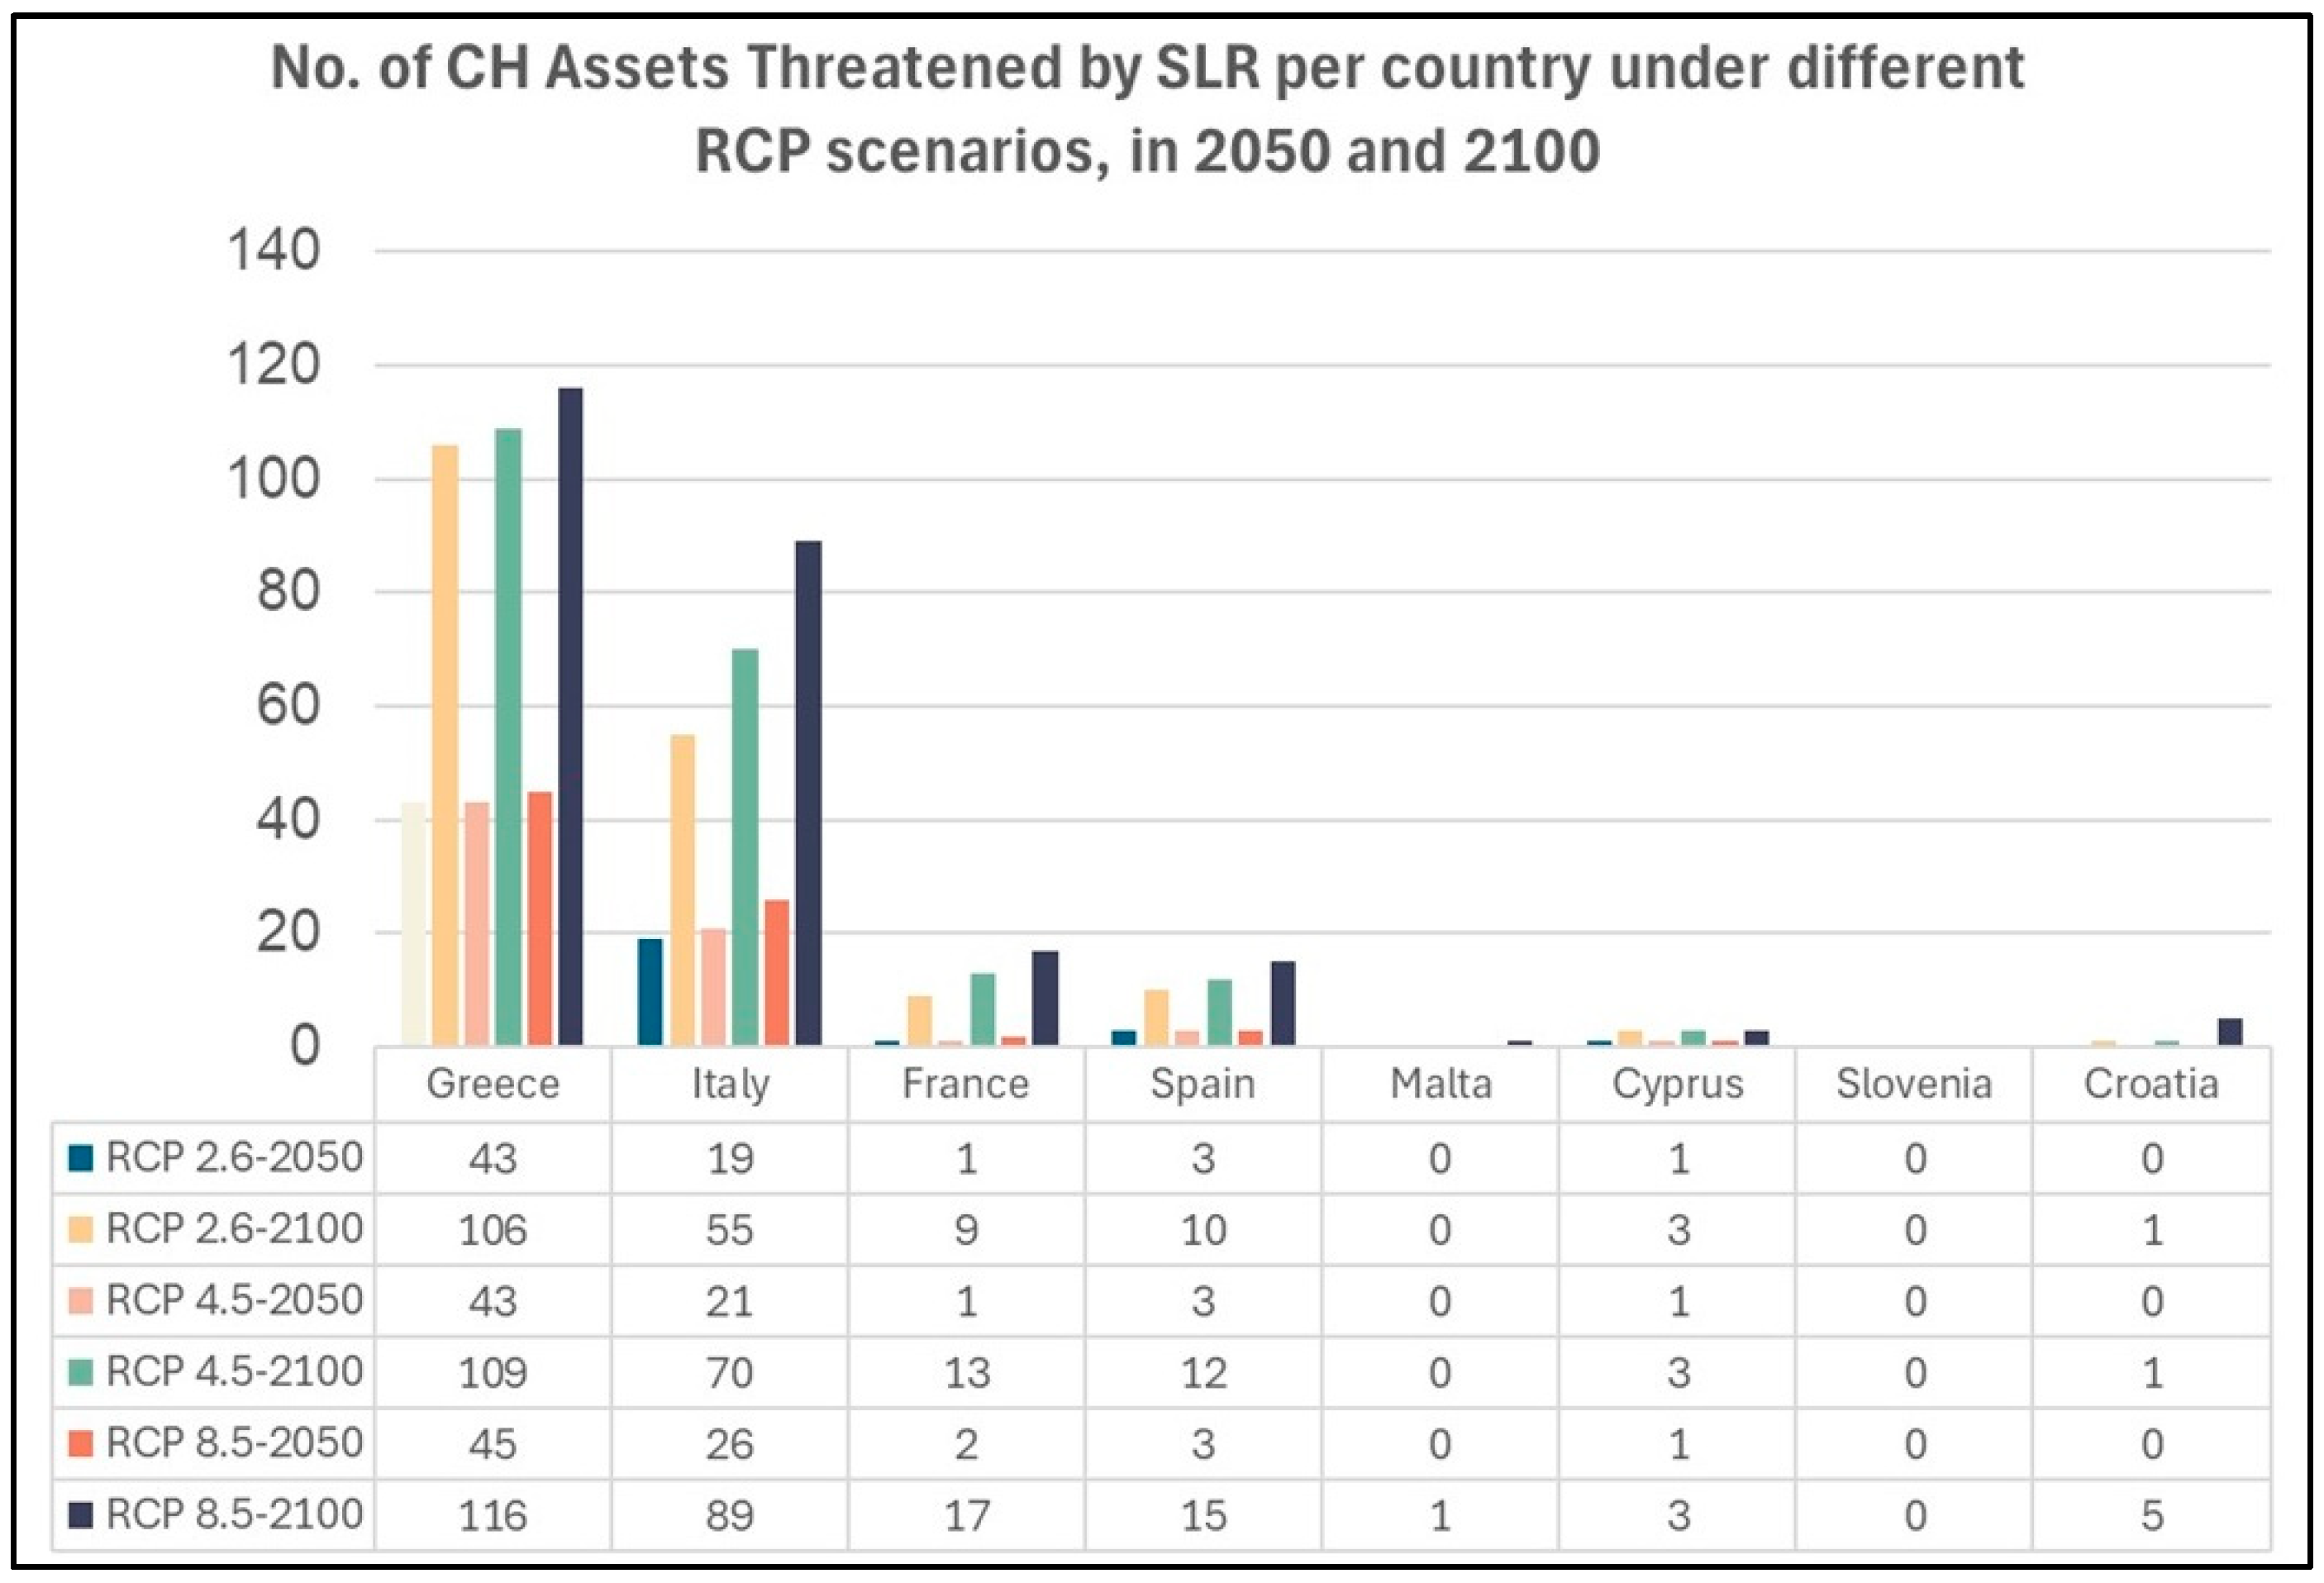
The effect of different RCP scenarios does not appear significant at least for the 2050 projections. The number of CH assets under probable inundation risk, however, doubles and sometimes triples between 2050 and 2100, with Italy, France, and Spain also presenting high sensitivity under the different RCP scenarios (Figure 11). On the contrary, the coastal heritage assets of Croatia, Malta, Slovenia, and Cyprus seem to be more protected from SLR.

4. Discussion

The present research showcases a methodology framework for identifying coastal cultural heritage assets potentially exposed to Sea Level Rise under RCP scenarios 2.6, 4.5, and 8.5 for the target years 2050 and 2100. The algorithm uses open access data and was applied in the Mediterranean EU-27 countries, which present an ideal case study as numerous heritage assets of different historic periods can be located near the coasts of countries such as Greece, Italy, France, Spain, Croatia, etc. The main concept of the proposed algorithm is to study the evolution of the terrain relief—as currently rendered by Copernicus GLO-30 DEM—by adding the projected values of parameters such as the mean vertical ground motion and the components that have been universally identified as major contributing factors to Sea Level Change (e.g., Antarctic Ice Sheet, Greenland Ice Sheet, Glaciers, Land Water Storage, Ocean Dynamic). Finally, the algorithm filters the areas that are not currently exposed to Sea Level Change but are expected to be in 2050 or 2100. This filtering is performed so that the output of the algorithm does not provide a falsely aggravated image of the effect that Sea Level Rise scenarios will have in the future, as this climate-change-related danger is already evident in the present time.
In addition, the elevation information (i.e., GLO-30 DEM), through the European Ground Motion Service dataset, was also used to address the issue of constant vertical motion observed on different ground points using SAR technologies. The mean velocity value per pixel (expressed in mm/year and calculated using time series residuals and a seasonal sinusoidal component in addition to a first-order polynomial regression model [79]) was used and projected to the target years 2050 and 2100, based on the assumption that this rate of subsidence or rise will remain more or less constant in the years to come. Although these vertical motion values are produced using cutting-edge SAR algorithms and through time series analysis (i.e., they are expected to be robust estimates of the actual mean values), one has to consider the seismic-prone character of the Eastern Mediterranean Sea (e.g., Greece and Italy), which can lead to significant modifications in the vertical ground motion rate [80,81] and thus introduce an additional source of uncertainty at a more regional extent. The EGMS dataset partially reveals this non-uniform geological behavior when comparing the calculated time-series standard deviation of the mean velocity values in earthquake-prone areas of Greece and Italy to that of Spain and France, where seismic activity is limited. As can be seen in Table 3, the calculated mean velocity standard deviation in the selected locations of France and Spain ranges from 0.01 to 0.05, while in Greece and Italy, it ranges from 0.17 to 1.62. This can be attributed—but not limited—to the continuous geological movements recorded in seismic-prone countries. The dynamic validation and monitoring of the EGMS dataset is crucial for the regular updating of the necessary projections for the target study years. The installation of a permanent Global Navigation Satellite System (GNSS) network in key coastal heritage sites would be an important step forward in validating EGMS data through ground measurements. In any case, the annual SLR projection update based on incoming and validated EGMS data is proposed to minimize potential over- or underestimation of the vertical ground movement impact.
The second external source of information used in the algorithm is the Sea Level Change Projections dataset produced by NASA based on the findings of IPCC’s 6th Assessment Report for Working Group 1. This dataset is—similarly to the EGMS Vertical Ground Motion dataset—a product of time series analysis but at a larger scale; so, it cannot capture any potential region-specific characteristics. Furthermore, the generalized nature of the projected SLC dataset is evident when comparing the vertical motion values of this dataset with the ones of the EGMS dataset. NASA’s projection on vertical motion provides a horizontal value of −0.382 m for 2050 and −0.807 m for 2100 for the area of interest, while the EGMS service produces a range between −2.963 to 1.673 m for 2050 and −7.5932 to 4.288 m for 2100. This discrepancy between the two datasets reveals that when solely using the Sea Level Change estimation projections of NASA, the vertical ground motion values will be, in places, severely overestimated or underestimated, thus introducing more uncertainty in the projection values.
The results of the algorithm reveal that Greece, Italy, and France are the countries that are expected to be more exposed to future Sea Level Rise scenarios by 2050 and 2100. Regarding Greece and Italy, the results appear reasonable due to their extensive coastline in the Mediterranean Sea and their insular morphology. On the other hand, France ranks 5th in coastline extension among the eight EU-27 countries that were studied (Table 1). However, if we combine the data on coastline length (km) and additional affected areas by Sea Level Change Scenario for 2050 and 2100 (sq. km.), it can be observed that France has 0.02 sq. km. of new affected land per km of coastline, while the same metric for Greece and Italy is around 0.01 sq.km/km. This can be attributed to the more lowland morphology of the Mediterranean French Coast in conjunction with the major river deltas found in the area such as the Rhône Delta in the region of Camargue.
Concerning cultural heritage assets, at present, only five UNESCO World Heritage Sites present a negative minimum elevation value, i.e., the Amalfi Coast and Venice in Italy, and, the island of Delos, the Medieval City of Rhodes and Pythagoreion and Heraion of Samos in Greece. These WHSs will face further exposure to Sea Level Rise in the future according to the results of the proposed algorithm, as no other records appear to be affected by SLR. However, no exact polygon information on the complete extent of the designated UNESCO WHSs was retrieved; so, a buffer zone of 50 m was created around the point coordinate information, which, in some cases, can be very restricted. The findings of the present research concerning UNESCO WHSs correspond to those of previous studies [8,15] that, however, include even more records of sites under SLR threat according to their data and proposed methodology. Finally, concerning the remaining coastal heritage assets as retrieved from OpenStreetMap, it can be noted that, currently, 243 records present a minimum elevation value of less than 0, the majority of which are in Greece (72), France (62), Italy (46) and Spain (40). The present research demonstrated that an additional sum of approximately 215 records will be added to the CH assets exposed to SLR by 2050 or 2100 under the three RCP scenarios, the vast majority of which are in Greece (102) and Italy (80).
The identification of Cultural Heritage Assets under Sea Level Rise threat—or climate-related hazards threats in general, including air pollution, extreme temperature variations, severe winds, extreme precipitation, etc.—is a crucial step in beginning to discuss potential adaptation and mitigation measures to enhance the resilience of these monuments. It is generally considered best practice that the mitigation measures should follow a more holistic approach since—especially in the Mediterranean Sea—the coastal archeological sites are usually located near settlements and contribute to an area’s identity, touristic product, employment, and economy [82,83]. The strong connection between tourism and cultural heritage is revealed by the fact that approximately 40% of tourists select their travel destination considering the cultural product offered in each location [84]. Tourism and climate change interaction has also been studied independently, and four distinct pathways have been identified, including the direct climatic impact on the duration of the touristic seasons, the indirect environmental changes that transform the landscape of each destination, indirect socioeconomic changes including slower economic growth, increased spending on civil protection measurements, changing traveling behaviors, and policymakers’ responses to the issue, including mitigation and adaptation measures [85]. It could be argued that the cross-sectoral response to climate-change-related hazards is based on the same principles of monitoring and implementation of mitigation and adaptation measures. In the case of C.H assets, however, such measures or projects should not interfere with the character or the structural and historic integrity of the monuments. Mitigation and adaptation measures can be broadly divided into offshore or mainland protective structures and broader area or monument-specific structures. In the case of Venice, the recent flooding events of 2018 and 2019 damaged significant cultural monuments (e.g., St. Mark’s Basilica) and many businesses, including shops and cafes [86]. The Italian Government has responded to the flooding risk of Venice with an investment of more than 6 billion euros, which includes the construction of a series of 78 floating mobile barriers that have been placed in the three channels that connect the lagoon of the city to the Adriatic Sea, thus isolating the lagoon from the sea [87,88,89]. The so-called Project Mo.S.E (Experimental Electromechanical Module) was designed to address existing and documented flooding protection needs and its performance over the past years appears very effective [90]. Some studies have demonstrated that the economic benefits of this tailored response will largely outweigh the original and expected operational and maintenance costs [90]. Mo.S.E’s approach, however, has also created some disruptions regarding inbound and outbound marine traffic [91] but also in the lagoon’s ecosystem capacity to renew its waters and balance its sediment distribution [87,92]. In the case of Scotland, individual coastal defense structures were employed to protect sites, including the Neolithic settlement at Skara Brae (UNESCO’s W.H.S) [93]; however, it was once again noticed that in addition to their increased cost, they also caused disruptions in the marine and coastal ecosystems and, in some cases, exacerbated the flooding consequences in adjacent areas [94]. In that regard, scientists have questioned the capacity to save all coastal monuments from the erosion and flooding threats they face due to a lack of time, resources, and technical solutions [95]. Several research groups have proposed protocols, indices, and metrics such as the Cultural Heritage Risk Index (CHRI), the Cultural Heritage Vulnerability Index (CHVI) or the Risk Mapping Tool for Cultural Heritage Protection, which analyze and assign weights to the hazard, exposure, and vulnerability that a monument faces and thus can assist in prioritizing mitigation action plans [13,14,96,97]. The application of cutting-edge technology, artificial intelligence algorithms, blockchain technologies [98], and IoT [99,100] has already been extensively used to document, monitor, and preserve CH [101,102], including 3D scanning, modeling, and visualization [103,104,105,106], and more sophisticated applications to enhance safety measures of site visits include indoor air quality monitoring, pathogen detection, visitor flow management [107], etc. This growing cross-sectoral body of research aims to inform CH authorities, civil protection institutions, urban planners, and policymakers on the increased data availability and algorithms concerning climate-related hazards and allow them to proceed toward participatory and data-driven decisions on mitigation actions.
All the above results, examples, and conclusions verify that Sea Level Rise is a major climate-change-related hazard to the heritage assets of the Mediterranean EU-27 countries. In many cases, however, Sea Level Rise can already be noticed in more plain coastal regions, thus affecting existing land uses and potentially heritage assets. Future projections of SLR trends are extremely data-sensitive, in terms of resolution and accuracy, but also contain an inherent uncertainty regarding major geological events, and the actual evaluation and quantification of RCP scenario hypotheses. As a result, constant monitoring and new regional time-series datasets using Differential Synthetic Aperture Radar Interferometry (DInSAR) should be produced to calculate more accurate mean and median values at different quantiles in order to not underestimate the existing danger of SLR but also not massively overestimate it. The TRIQUETRA project will proceed with the validation of the open access data (e.g., D.E.M/D.S.M, coastline, vertical ground motion data) used in the proposed methodology with finer-scale local and historic datasets in three case study areas (Aegina and Epidaurus in Greece, and Ventotene in Italy) to demonstrate its robustness or highlight any potential weaknesses. The validation process will allow for an assessment of data quality and accuracy and could further enhance the proposed methodology with the introduction of new spatial analysis and interpolation algorithms.

Author Contributions

Conceptualization, C.G. and P.P.; methodology, C.G. and S.C.; validation, C.G. and P.P.; formal analysis, S.C. and T.R. investigation, C.G.; resources, C.G. and T.R.; writing—original draft preparation, S.C.; writing—review and editing, P.P. and C.G.; visualization, S.C. and T.R. All authors have read and agreed to the published version of the manuscript.

Funding

This work is based on procedures and tasks implemented within the project “Toolbox for assessing and mitigating Climate Change risks and natural hazards threatening cultural heritage—TRIQUETRA”, which is a project funded by the EU HE research and innovation program under GA No. 101094818.

Data Availability Statement

Data will be made available through the project’s official website https://triquetra-project.eu/ (accessed on 10 August 2024) according to the deliverable timetable.

Acknowledgments

We acknowledge all partners of the TRIQUETRA EU research project for their valuable contribution to the ongoing research.

Conflicts of Interest

The authors declare no conflicts of interest.

References

  1. Zanuttigh, B. Coastal flood protection: What perspective in a changing climate? The THESEUS approach. Environ.Sci. Policy 2011, 14, 845–863. [Google Scholar] [CrossRef]
  2. Pantusa, D.; D’Alessandro, F.; Frega, F.; Francone, A.; Tomasicchio, G.R. Improvement of a coastal vulnerability index and its application along the Calabria Coastline, Italy. Sci. Rep. 2022, 12, 21959. [Google Scholar] [CrossRef] [PubMed]
  3. Kopp, R.E.; Horton, R.M.; Little, C.M.; Mitrovica, J.X.; Oppenheimer, M.; Rasmussen, D.J.; Strauss, B.H.; Tebaldi, C. Probabilistic 21st and 22nd-century sea-level projections at a global network of tide-gauge sites. Earth’s Future 2014, 2, 383–406. [Google Scholar] [CrossRef]
  4. Sesana, E.; Gagnon, A.S.; Ciantelli, C.; Cassar, J.; Hughes, J.J. Climate Change Impacts on Cultural Heritage: A Literature Review. WIREs Clim. Chang. 2021, 12, e710. [Google Scholar] [CrossRef]
  5. Abadie, L.M.; Jackson, L.P.; Sainz de Murieta, E.; Jevrejeva, S.; Galarraga, I. Comparing urban coastal flood risk in 136 cities under two alternative sea-level projections: RCP 8.5 and an expert opinion-based high-end scenario. Ocean Coast. Manag. 2020, 193, 105249. [Google Scholar] [CrossRef]
  6. Tragaki, A.; Gallousi, C.; Karymbalis, E. Coastal hazard vulnerability assessment based on geomorphic, oceanographic and demographic parameters: The case of Peloponnese (Southern Greece). Land 2018, 7, 56. [Google Scholar] [CrossRef]
  7. Karymbalis, E.; Chalkias, C.; Chalkias, G.; Grigoropoulou, E.; Manthos, G.; Ferentinou, M. Assessment of the sensitivity of the southern coast of the Gulf of Corinth (Peloponnese, Greece) to sea-level rise. Centr. Eur. J. Geosci. 2012, 4, 561–577. [Google Scholar] [CrossRef]
  8. Reimann, L.; Vafeidis, A.T.; Brown, S.; Hinkel, J.; Tol, R.S.J. Mediterranean UNESCO World Heritage at risk from coastal flooding and erosion due to sea-level rise. Nat. Commun. 2018, 9, 4161. [Google Scholar] [CrossRef] [PubMed]
  9. Phillips, H. Adaptation to climate change at UK world heritage sites: Progress and challenges. Hist. Environ. Policy Pract. 2014, 5, 288–299. [Google Scholar] [CrossRef]
  10. Orbasli, A. Architectural Conservation: Principles and Practice; Blackwell Science: Oxford, UK, 2008. [Google Scholar]
  11. Bertolin, C. Preservation of Cultural Heritage and Resources Threatened by Climate Change. Geosciences 2019, 9, 250. [Google Scholar] [CrossRef]
  12. Cassar, M. Climate Change and the Historic Environment. 2005. Available online: https://discovery.ucl.ac.uk/id/eprint/2082/1/2082.pdf (accessed on 5 June 2024).
  13. Bonazza, A.; Sardella, A. Climate change and cultural heritage: Methods and approaches for damage and risk assessment addressed to a practical application. Heritage 2023, 6, 3578–3589. [Google Scholar] [CrossRef]
  14. Ravan, M.; Revez, M.J.; Pinto, I.V.; Brum, P.; Birkmann, J. A vulnerability assessment framework for cultural heritage sites: The case of the Roman ruins of Tróia. Int. J. Disaster Risk Sci. 2023, 14, 26–40. [Google Scholar] [CrossRef]
  15. Valagussa, A.; Frattini, G.; Crosta, G.; Spizzichino, D.; Leoni, G.; Margottini, C. Multi-risk analysis on European Cultural and Natural UNESCO heritage sites. Nat. Hazards 2021, 105, 2659–2676. [Google Scholar] [CrossRef]
  16. Briz, E.; Garmendia, B.E.; Garmendia, L.; Marcos, I.; Gandini, A. Improving the resilience of historic areas coping with natural and climate change hazards: Interventions based on multi-criteria methodology. Int. J. Archit. Herit. 2023, 18, 1235–1262. [Google Scholar] [CrossRef]
  17. IPCC. Glossary Working Group II: Impacts, adaptation and vulnerability. Impacts, adaptation and vulnerability. In Contribution of Working Group II to the Fourth Assessment Report of the Intergovernmental Panel on Climate Change; IPCC: Geneva, Switzerland, 2007; Volume 828. [Google Scholar]
  18. Assessment (MA). Ecosystems and Human Well–being: Current States and Trends. In Findings of the Condition and Trends Working Group in Millennium Ecosystem; Hassan, R., Scholes, R., Ash, N., Eds.; Assessment (MA), Island Press: Washington, DC, USA, 2005; pp. 893–900. [Google Scholar]
  19. Dassanayake, D.R.; Burzel, A.; Oumeraci, H. Methods for the evaluation of intangible flood losses and their integration in flood risk analysis. Coast. Eng. J. 2018, 57, 1540007-1–1540007-35. [Google Scholar] [CrossRef]
  20. Sabbioni, C.; Cassar, M.; Brimblecombe, P.; Lefevre, R.A. Vulnerability of Cultural Heritage to Climate Change. 2008. Available online: https://www.coe.int/t/dg4/majorhazards/activites/2009/Ravello15-16may09/Ravello_APCAT2008_44_Sabbioni-Jan09_EN.pdf (accessed on 10 May 2024).
  21. Mazurczyk, T.; Piekielek, N.; Tansey, E.; Goldman, B. American archives and climate change: Risks and adaptation. Clim. Risk Manag. 2018, 20, 111–125. [Google Scholar] [CrossRef]
  22. Balica, S.F.; Wright, N.G.; van der Meulen, F. A flood vulnerability index for coastal cities and its use in assessing climate change impacts. Nat. Hazards 2012, 64, 73–105. [Google Scholar] [CrossRef]
  23. Howard, A.J.; Challis, K.; Holden, J.; Kincey, M.; Passmore, D.G. The impact of climate change on archaeological resources in Britain: A catchment scale assessment. Clim.Chang. 2008, 91, 405–422. [Google Scholar] [CrossRef]
  24. Camuffo, D.; Bertolin, C.; Schenal, P. Climate change, sea level rise and impact on monuments in Venice. In Second International Congress on Science and Technology for the Conservation of Cultural Heritage; Rogerio-Candelera, M.A., Ed.; CRC Press: Boca Raton, FL, USA, 2014. [Google Scholar]
  25. Marzeion, B.; Levermann, A. Loss of cultural world heritage and currently inhabited places to sea-level rise. Environ. Res. Lett. 2014, 9, 034001. [Google Scholar] [CrossRef]
  26. Ravanelli, R.; Riguzzi, F.; Anzidei, M.; Vecchio, A.; Nigro, L.; Spagnoli, F.; Crespi, M. Sea level rise scenario for 2100 A.D. for the archaeological site of Motya. Rend. Lincei. Sci. Fis. Nat. 2019, 30, 747–757. [Google Scholar] [CrossRef]
  27. Henriques, R.J.; de Oliveira, F.S.; Schaefer, C.E.G.R.; Lopes, P.R.C.; Senra, E.O.; Lourenço, V.R.; Francelino, M.R. Impacts of anthropocene sea-level rise on people, environments, and archaeological sites in Marajó Island, Brazilian Amazonia. J. S. Am. Earth. Sci. 2024, 136, 104836. [Google Scholar] [CrossRef]
  28. Sánchez, F.G.; Sánchez, H.G.; Ribalaygua, C. Cultural heritage and sea level rise threat: Risk assessment of coastal fortifications in the Canary Islands. J. Cult. Herit. 2020, 44, 211–217. [Google Scholar] [CrossRef]
  29. Anzidei, M.; Doumaz, F.; Vecchio, A.; Serpelloni, E.; Pizzimenti, L.; Civico, R.; Greco, M.; Martino, G.; Enei, F. Sea Level Rise Scenario for 2100 A.D. in the Heritage Site of Pyrgi (Santa Severa, Italy). J. Mar. Sci. Eng. 2020, 8, 64. [Google Scholar] [CrossRef]
  30. Church, J.A.; Clark, P.U.; Cazenave, A.; Gregory, J.M.; Jevrejeva, S.; Levermann, A.; Merrifield, M.A.; Milne, G.A.; Nerem, R.S.; Nunn, P.D.; et al. Sea level change. In Climate Change 2013: The Physical Science Basis. Contribution of Working Group I to the Fifth Assessment Report of the Intergovernmental Panel on Climate Change; Stocker, T.F., Qin, T.F., Plattner, G.K., Tignor, M., Allen, S.K., Boschung, J., Nauels, A., Xia, Y., Bex, V., Midgley, P.M., Eds.; Cambridge University Press: Cambridge, UK, 2013; pp. 1137–1216. [Google Scholar]
  31. Meinshausen, M.; Smith, S.J.; Calvin, K.; Daniel, J.S.; Kainuma, M.L.T.; Lamarque, J.F.; Matsumoto, K.; Montzka, S.A.; Raper, S.C.B.; Riahi, K.; et al. The RCP greenhouse gas concentrations and their extensions from 1765 to 2300. Clim. Chang. 2011, 109, 213–241. [Google Scholar] [CrossRef]
  32. Moss, R.H.; Edmonds, J.A.; Hibbard, K.A.; Manning, M.R.; Rose, S.K.; van Vuuren, D.P.; Carter, T.R.; Emori, S.; Kainuma, M.; Kram, T.; et al. The next generation of scenarios for climate change research and assessment. Nature 2010, 463, 747–756. [Google Scholar] [CrossRef]
  33. IPCC. Climate Change 2014: Synthesis Report. Contribution of Working Groups I, II and III to the Fifth Assessment Report of the Intergovernmental Panel on Climate Change; Core Writing Team, Pachauri, R.K., Meyer, L.A., Eds.; IPCC: Geneva, Switzerland, 2014; Volume 151. [Google Scholar]
  34. Reisinger, A.; Howden, M.; Vera, C.; Garschagen, M.; Hurlbert, M.; Kreibiehl, S.; Mach, K.J.; Mintenbeck, K.; O’Neill, B.; Pathak, M.; et al. The Concept of Risk in the IPCC Sixth Assessment Report: A Summary of Cross-Working Group Discussions; Intergovernmental Panel on Climate Change: Geneva, Switzerland, 2020; Volume 15, Available online: https://www.ipcc.ch/site/assets/uploads/2021/02/Risk-guidance-FINAL_15Feb2021.pdf (accessed on 10 June 2024).
  35. Slangen, A.B.A.; Carson, M.; Katsman, C.A.; van de Wal, R.S.W.; Köhl, A.; Vermeersen, L.L.A.; Stammer, D. Projecting twenty-first century regional sea-level changes. Clim. Chang. 2014, 124, 317–332. [Google Scholar] [CrossRef]
  36. Rovere, A.; Raymo, M.E.; Vacchi, M.; Lorscheid, T.; Stocchi, P.; Gómez-Pujol, L.; Harris, D.L.; Casella, E.; O’Leary, M.J.; Hearty, P.J. The analysis of Last Interglacial (MIS 5e) relative sea-level indicators: Reconstructing sea-level in a warmer world. Earth Sci. Rev. 2016, 159, 404–427. [Google Scholar] [CrossRef]
  37. Wada, Y.; van Beek, L.P.H.; Sperna Weiland, F.C.; Chao, B.F.; Wu, Y.H.; Bierkens, M.F.P. Past and future contribution of global groundwater depletion to sea-level rise. Geophys. Res. Lett. 2012, 39, L09402. [Google Scholar] [CrossRef]
  38. Stammer, D.; Cazenave, A.; Ponte, R.M.; Tamisiea, M.E. Causes for contemporary regional sea level changes. Ann. Rev. Mar. Sci. 2013, 5, 21–46. [Google Scholar] [CrossRef] [PubMed]
  39. Church, J.A.; White, N.J. A 20th century acceleration in global sea-level rise. Geophys. Res. Lett. 2006, 33, L01602. [Google Scholar] [CrossRef]
  40. Hay, C.C.; Morrow, E.; Kopp, R.E.; Mitrovica, J.X. Probabilistic reanalysis of twentieth-century sea-level rise. Nature 2015, 517, 481–484. [Google Scholar] [CrossRef]
  41. Oppenheimer, M.; Glavovic, B.C.; Hinkel, J.; Van de Wal, R.; Magnan, A.K.; Abd-Elgawad, A.; Cai, R.; Cifuentes-Jara, M.; DeConto, R.M.; Ghosh, T.; et al. Sea Level Rise and Implications for Low-Lying Islands, Coasts and Communities. In IPCC Special Report on the Ocean and Cryosphere in a Changing Climate; Pörtner, H.O., Roberts, D.C., Masson-Delmotte, V., Zhai, P., Tignor, M., Poloczanska, E., Mintenbeck, K., Alegría, A., Nicolai, M., Okem, A., et al., Eds.; Cambridge University Press: Cambridge, UK; New York, NY, USA, 2019; Available online: https://www.ipcc.ch/site/assets/uploads/sites/3/2022/03/06_SROCC_Ch04_FINAL.pdf (accessed on 3 June 2024).
  42. Bamber, J.L.; Oppenheimer, M.; Kopp, R.E.; Aspinall, W.P.; Cooke, R.M. Ice sheet contributions to future sea-level rise from structured expert judgment. Proc. Natl. Acad. Sci. USA 2019, 116, 11195–11200. [Google Scholar] [CrossRef]
  43. TRIQUETRA Project: Toolbox for Assessing and Mitigating Climate Change Risks and Natural Hazards Threatening Cultural Heritage. Available online: https://triquetra-project.eu/ (accessed on 25 May 2024).
  44. Ioannidis, C.; Verykokou, S.; Soile, S.; Istrati, D.; Spyrakos, C.; Sarris, A.; Akritidis, D.; Feidas, H.; Georgoulias, A.K.; Tringa, E.; et al. Safeguarding Our Heritage—The TRIQUETRA Project Approach. Heritage 2024, 7, 758–793. [Google Scholar] [CrossRef]
  45. Wessel, P.; Smith, W.H.F. A Global Self-Consistent, Hierarchical, High-resolution Shoreline Database. J. Geophys. Res. 1996, 101, 8741–8743. [Google Scholar] [CrossRef]
  46. Sayre, R.; Noble, S.; Hamann, S.; Smith, R.; Wright, D.; Breyer, S.; Butler, K.; Van Graafeiland, K.; Frye, C.; Karagulle, D.; et al. A new 30-meter resolution global shoreline vector and associated global islands database for the development of standardized ecological coastal units. J. Oper. Oceanogr. 2019, 12 (Suppl. S2), 47–56. [Google Scholar] [CrossRef]
  47. EEA Coastline for Analysis. Available online: https://www.eea.europa.eu/en/datahub/datahubitem-view/af40333f-9e94-4926-a4f0-0a787f1d2b8f (accessed on 10 June 2024).
  48. Emmendorfer, I.B.; de Almeida, L.P.M.; Alves, D.C.L.; Emmendorfer, L.R.; Arigony-Neto, J. Accuracy assessment of global DEMs for the mapping of coastal flooding on a low-lying sandy environment: Cassino Beach, Brazil. Reg. Stud. Mar. Sci. 2024, 74, 103535. [Google Scholar] [CrossRef]
  49. Sánchez-García, E.A.; Yañez-Arenas, C.; Lindig-Cisneros, R.; Lira-Noriega, A.; Ibarra, R.M.; Moreno-Casasola, P. The expected impacts of sea level on the Mexican Atlantic coast. Sci. Total Environ. 2023, 903, 166317. [Google Scholar] [CrossRef]
  50. Distefano, S.; Gamberi, F. Preservation of Transgressive System Tract Geomorphic Elements during the Holocene Sea Level Rise in the South-Eastern Sicilian Tyrrhenian Margin. J. Mar. Sci. Eng. 2022, 10, 1013. [Google Scholar] [CrossRef]
  51. Fandé, M.B.; Ponte Lira, C.; Penha-Lopes, G. Using TanDEM-X Global DEM to Map Coastal Flooding Exposure under Sea-Level Rise: Application to Guinea-Bissau. ISPRS Int. J. Geo-Inf. 2022, 11, 225. [Google Scholar] [CrossRef]
  52. Abrams, M.; Yamaguchi, Y.; Crippen, R. Aster Global Dem (GDEM) Version 3. Int. Arch. Photogramm. Remote Sens. Spat. Inf. Sci. 2022, 43, 593–598. [Google Scholar] [CrossRef]
  53. Gesch, D.; Oimoen, M.; Danielson, J.; Meyer, D. Validation of the ASTER global digital elevation model version 3 over the conterminous Unites States. Int. Arch. Photogramm. Remote Sens. Spat. Inf. Sci. 2016, 41, 143–148. [Google Scholar] [CrossRef]
  54. Crippen, R.; Buckley, S.; Agram, P.; Belz, E.; Gurrola, E.; Hensley, S.; Kobrick, M.; Lavalle, M.; Martin, J.; Neumann, M.; et al. Nasadem Global Elevation Model: Methods and Progress. Int. Arch. Photogramm. Remote Sens. Spat. Inf. Sci. 2016, 41, 125–128. [Google Scholar] [CrossRef]
  55. Abrams, M.; Crippen, R.; Fujisada, H. ASTER Global Digital Elevation Model (GDEM) and ASTER Global Water Body Dataset (ASTWBD). Remote Sens. 2020, 12, 1156. [Google Scholar] [CrossRef]
  56. Buckley, S.M.; Agram, P.S.; Belz, J.E.; Crippen, R.E.; Gurrola, E.M.; Hensley, S.; Kobrick, M.; Lavalle, M.; Martin, J.M.; Neumann, M.; et al. NASADEM: UserGuide, NASA/Jpl. 2020, 48. Available online: https://lpdaac.usgs.gov/documents/592/NASADEM_User_Guide_V1.pdf (accessed on 5 May 2024).
  57. Tadono, T.; Nagai, H.; Ishida, H.; Oda, F.; Naito, S.; Minakawa, K.; Iwamoto, H. Generation of the 30 m-mesh global digital surface model by ALOS PRISM. Int. Arch. Photogramm. Remote Sens. Spat. Inf. Sci. 2016, 41, 157–162. [Google Scholar] [CrossRef]
  58. Farr, T.G.; Rosen, P.A.; Caro, E.; Crippen, R.; Duren, R.; Hensley, S.; Kobrick, M.; Paller, M.; Rodriquez, E.; Roth, L.; et al. The shuttle radar topography mission. Rev. Geophys. 2007, 45, 1–33. [Google Scholar] [CrossRef]
  59. Rodriguez, E.; Morris, C.S.; Belz, J.E. A global assessment of the SRTM performance. Photogramm. Eng. Remote Sens. 2006, 72, 249–260. [Google Scholar] [CrossRef]
  60. Wessel, B.; Huber, M.; Wohlfart, C.; Marschalk, U.; Kosmann, D.; Roth, A. Accuracy Assessment of the global TanDEM-X Digital Elevation Model with GPS Data. ISPRS J. Photogramm. 2018, 139, 171–182. [Google Scholar] [CrossRef]
  61. Ghannadi, M.A.; Alebooye, S.; Izadi, M.; Ghanadi, A. Vertical accuracy assessment of Copernicus DEM (case study: Tehran and Jam cities). ISPRS Ann. Photogramm. Remote Sens. Spat. Inf. Sci. 2023, 10, 209–214. [Google Scholar] [CrossRef]
  62. Krdžalić, D.; Ćatić, J.; Vrce, E.; Omićević, D. Evaluating the accuracy of the digital models (DEMs) within the Territory of Bosnia and Herzegovina. Remote Sens. Appl. Soc. Environ. 2024, 34, 101187. [Google Scholar] [CrossRef]
  63. Hu, Z.; Peng, J.; Hou, Y.; Shan, J. Evaluation of recently released open global digital elevation models of Hubei, China. Remote Sens. 2017, 9, 262. [Google Scholar] [CrossRef]
  64. Dong, Y.; Chang, H.C.; Chen, W.; Zhang, K.; Feng, R. Accuracy assessment of GDEM, SRTM, and DLR-SRTM in Northeastern China. Geocarto Int. 2015, 30, 779–792. [Google Scholar] [CrossRef]
  65. Purinton, B.; Bookhagen, B. Validation of digital elevation models (DEMs) and comparison of geomorphic metrics on the southern Central Andean Plateau. Earth Surf. Dyn. 2017, 5, 211–237. [Google Scholar] [CrossRef]
  66. Varga, M.; Bašić, T. Accuracy validation and comparison of global digital elevation models over Croatia. Int. J. Remote Sens. 2015, 36, 170–189. [Google Scholar] [CrossRef]
  67. Moudrý, V.; Lecours, V.; Gdulová, K.; Gábor, L.; Moudrá, L.; Kropáček, J.; Wild, J. On the use of global DEMs in ecological modelling and the accuracy of new bare-earth DEMs. Ecol. Modell. 2018, 383, 3–9. [Google Scholar] [CrossRef]
  68. Bolkas, D.; Fotopoulos, G.; Braun, A.; Tziavos, I.N. Assessing digital elevation model uncertainty using GPS survey data. J. Surv. Eng. 2016, 142, 04016001. [Google Scholar] [CrossRef]
  69. Carrera-Hernandez, J.J. Not all DEMs are equal: An evaluation of six globally available 30m resolution DEMs with geodetic benchmarks and LiDAR in Mexico. Remote Sens. Environ. 2021, 261, 112474. [Google Scholar] [CrossRef]
  70. Uuemaa, E.; Ahi, S.; Montibeller, B.; Muru, M.; Kmoch, A. Vertical Accuracy of Freely Available Global Digital Elevation Models (ASTER, AW3D30, MERIT, TanDEM-X, SRTM, NASADEM). Remote Sens. 2020, 12, 3482. [Google Scholar] [CrossRef]
  71. Constantini, M.; Minati, F.; Trillo, F.; Ferretti, A.; Novali, F.; Passera, E.; Dehls, J.; Larsen, Y.; Marinkovic, P.; Eineder, M.; et al. European Ground Motion Service. In Proceedings of the 2021 IEEE International Geoscience and Remote Sensing Symposium IGARSS, Brussels, Belgium, 11–16 July 2021; Institute of Electrical and Electronics Engineers (IEEE): Piscataway, NJ, USA, 2021; pp. 3293–3296. [Google Scholar] [CrossRef]
  72. Crosetto, M.; Solari, L.; Mróz, M.; Balasis-Levinsen, J.; Casagli, N.; Frei, M.; Oyen, A.; Moldestad, D.A.; Bateson, L.; Guerrieri, L.; et al. The Evolution of Wide-Area DInSAR: From Regional and National Services to the European Ground Motion Service. Remote Sens. 2020, 12, 2043. [Google Scholar] [CrossRef]
  73. Crosetto, M.; Solari, L.; Balasis-Levinsen, J.; Casagli, N.; Frei, M.; Oyen, A.; Molestad, D.A. Ground Deformation monitoring at continental scale: The european ground motion service. Int. Arch. Photogramm. Remote Sens. Spat. Inf. Sc. 2020, 43, 293–298. [Google Scholar] [CrossRef]
  74. Barra, A.; Reyes-Carmona, C.; Herrera, G.; Galve, J.P.; Solari, L.; Mateos, R.M.; Azañón, J.M.; Béjar-Pizarro, M.; López-Vinielles, J.; Palamà, R.; et al. From satellite interferometry displacements to potential damage maps: A tool for risk reduction and urban planning. Remote Sens. Environ. 2022, 282, 113294. [Google Scholar] [CrossRef]
  75. Crosetto, M.; Solari, L.; Balasis-Levinsen, J.; Bateson, L.; Casagli, N.; Frei, M.; Oyen, A.; Molestad, D.A.; Mróz, M. Deformation monitoring at european scale: The copernicus ground motion service. Int. Arch. Photogramm. Remote Sens. Spat. Inf. Sc. 2021, 43, 141–146. [Google Scholar] [CrossRef]
  76. Sala Calero, J.; Vöge, M.; Esteves Martins, J.; Raucoules, D.; de Michelle, M.; Vradi, A.; Vecchiotti, F. Validation Report-Services Supporting the European Environment Agency’s (EEA) Implementation of the Copernicus European Ground Motion Service-Product Validation v.2.0. Available online: https://land.copernicus.eu/en/technical-library/validation-report-2015-2021-dataset/@@download/file (accessed on 15 June 2024).
  77. IPCC. Climate Change 2021: The Physical Science Basis. Contribution of Working Group I to the Sixth Assessment Report of the Intergovernmental Panel on Climate Change; Masson-Delmotte, V., Zhai, P., Pirani, A., Connors, S.L., Péan, C., Berger, S., Caud, N., Chen, Y., Goldfarb, L., Gomis, M.I., et al., Eds.; Cambridge University Press: Cambridge, UK; New York, NY, USA, 2021; Volume 2391, in press. [Google Scholar] [CrossRef]
  78. Kopp, R.E.; Garner, G.G.; Hermans, T.H.J.; Jha, S.; Kumar, P.; Reedy, A.; Slangen, A.B.A.; Turilli, M.; Edwards, T.L.; Gregory, J.M.; et al. The Framework for Assessing Changes To Sea-level (FACTS) v1.0: A platform for characterizing parametric and structural uncertainty in future global, relative, and extreme sea-level change. Geosci. Model Dev. 2023, 16, 7461–7489. [Google Scholar] [CrossRef]
  79. Crosetto, M.; Solari, L. Chapter 3—InSAR technical aspects. In Satellite Interferometry Data Interpretation and Exploitation; Crosetto, M., Solari, L., Eds.; Elsevier: Amsterdam, The Netherlands, 2023; pp. 27–62. [Google Scholar] [CrossRef]
  80. Chiarabba, C.; De Gori, P.; Mele, F.M. Recent seismicity of Italy: Active tectonics of the central Mediterranean region and seismicity rate changes after the Mw 6.3 L’Aquila earthquake. Tectonophysics 2015, 638, 82–93. [Google Scholar] [CrossRef]
  81. Yolsal-Çevikbilen, S.; Taymaz, T. Earthquake source parameters along the Hellenic subduction zone and numerical simulations of historical tsunamis in the Eastern Mediterranean. Tectonophysics 2012, 536, 61–100. [Google Scholar] [CrossRef]
  82. Panzera, E.; de Graaff, T.; de Groot, H.L.F. European cultural heritage and tourism flows: The magnetic role of superstar World Heritage Sites. Pap. Reg. Sci. 2021, 100, 101–123. [Google Scholar] [CrossRef]
  83. García-Hernández, M.; De la Calle-Vaquero, M.; Yubero, C. Cultural Heritage and Urban Tourism: Historic City Centres under Pressure. Sustainability 2017, 9, 1346. [Google Scholar] [CrossRef]
  84. Richards, G.W. Tourism and Culture Synergies; UNWTO: Madrid, Spain, 2018; 160 p. [Google Scholar]
  85. Scott, D.; Lemieux, C. Weather and Climate Information for Tourism. Procedia Environ. Sci. 2010, 1, 146–183. [Google Scholar] [CrossRef]
  86. Ferranin, C.; Lionello, P.; Orlić, M.; Raicich, F.; Salvadori, G. Venice as a paradigm of coastal flooding under multiple compound drivers. Sci. Rep. 2022, 12, 5754. [Google Scholar] [CrossRef]
  87. Leonardi, N. The barriers of Venice. Nat. Geosci. 2021, 14, 881–882. [Google Scholar] [CrossRef]
  88. Mel, R.; Carniello, L.; D’Alpaos, L. Addressing the effect of the Mo.S.E barriers closure on wind setup within the Venice Lagoon. Estuar. Coast. Shelf Sci. 2019, 225, 106249. [Google Scholar] [CrossRef]
  89. Mel, R.A.; Viero, D.P.; Carniello, L.; Defina, A.; D’ Alpaos, L. The first operations of the Mo.S.E system to prevent the flooding of Venice: Insights on the hydrodynamics of a regulated lagoon. Estuar. Coast. Shelf Sci. 2021, 261, 107547. [Google Scholar] [CrossRef]
  90. Giupponi, C.; Bidoia, M.; Breil, M.; Di Corato, L.; Gain, A.K.; Leoni, V.; Fard, B.M.; Pesenti, R.; Umgiesser, G. Boon and burden: Economic performance and future perspectives of the Venice flood protection system. Reg. Environ. Chang. 2024, 24, 44. [Google Scholar] [CrossRef]
  91. Vergano, L.; Umgiesser, G.; Nunes, P.A.L.D. An economic assessment of the impacts of the MOSE barriers on Venice port activities. Transp. Res. Part D Transp. Environ. 2010, 15, 343–349. [Google Scholar] [CrossRef]
  92. Tognin, D.; D’Alpaos, A.; Marani, M.; Carnielo, L. Marsh Resilience to sea-level rise reduced by storm-surge barriers in the Venice Lagoon. Nat. Geosci. 2021, 14, 906–911. [Google Scholar] [CrossRef]
  93. Dawson, T. Taking the middle path to the coast: How community collaboration can help save threatened sites. In The Future of Heritage as Climates Change: Loss, Adaptation and Creativity; Harvey, D., Perry, J., Eds.; Routledge: London, UK, 2015; pp. 248–267. [Google Scholar]
  94. Graham, E.; Hambly, J.; Dawson, T. Learning from Loss: Eroding Coastal Heritage in Scotland. Humanities 2017, 6, 87. [Google Scholar] [CrossRef]
  95. Fatoric, S.; Seekamp, E. Are cultural heritage and resources threatened by climate change? A systematic literature review. Clim. Chang. 2017, 142, 227–254. [Google Scholar] [CrossRef]
  96. Forino, G.; MacKee, J.; von Meding, J. A proposed assessment index for climate-related risk for cultural heritage protection in Newcastle (Australia). Int. J. Disaster Risk Red. 2016, 19, 235–248. [Google Scholar] [CrossRef]
  97. Giglio, F.; Frontera, P.; Malara, A.; Armocida, F. Materials and Climate Change: A Set of Indices as the Benchmark for Climate Vulnerability and Risk Assessment for Tangible Cultural Heritage in Europe. Sustainability 2024, 16, 2067. [Google Scholar] [CrossRef]
  98. Trček, D. Cultural heritage preservation by using blockchain technologies. Herit. Sci. 2022, 10, 6. [Google Scholar] [CrossRef]
  99. Colace, F.; Elia, C.; Guida, C.G.; Lorusso, A.; Marongiu, F.; Santaniello, D. An IoT-based Framework to Protect Cultural Heritage Buildings. In Proceedings of the IEEE International Conference on Smart Computing (SMARTCOMP), Irvine, CA, USA, 23–27 August 2021; pp. 377–382. [Google Scholar] [CrossRef]
  100. Casillo, M.; Colace, F.; Gaeta, R.; Lorusso, A.; Santaniello, D.; Valentino, C. Revolutionizing cultural heritage preservation: An innovative IoT-based framework for protecting historical buildings. Evol. Intell. 2024. [CrossRef]
  101. Sampaio, A.Z.; Gomes, A.M.; Sánchez-Lite, A.; Zulueta, P.; González-Gaya, C. Analysis of BIM Methodology Applied to Practical Cases in the Preservation of Heritage Buildings. Sustainability 2021, 13, 3129. [Google Scholar] [CrossRef]
  102. Castellazzi, G.; Cardillo, E.; Lo Presti, N.; D’Altri, A.M.; de Miranda, S.; Bertani, G.; Ferretti, F.; Mazzotti, C. Advancing Cultural Heritage Structures Conservation: Integrating BIM and Cloud-Based Solutions for Enhanced Management and Visualization. Heritage 2023, 6, 7316–7342. [Google Scholar] [CrossRef]
  103. Sestras, P.; Ros, S.; Bilas, S.; Nas, S.; Buru, S.M.; Kovacs, L.; Spalevic, V.; Sestras, A.F. Feasibility assessments using unmanned aerial vehicle technology in heritage buildings: Rehabilitation-restoration, spatial analysis and tourism potential analysis. Sensors 2020, 20, 2054. [Google Scholar] [CrossRef] [PubMed]
  104. Moise, C.; Lazar, A.-M.; Mihalache, C.E.; Dedulescu, L.A.; Negula, I.F.D.; Badea, A.; Poenaru, V.D.; Moise, R.; Ortan, A.R. Geomatics Technologies in the Framework of Multidisciplinary Project for Integrated Management of Cultural Heritage Sites. Int. Arch. Photogramm. Remote Sens. Spat. Inf. Sci. 2020, 43, 1477–1484. [Google Scholar] [CrossRef]
  105. Antón, D.; Pineda, P.; Medjdoub, B.; Iranzo, A. As-built 3D heritage city modelling to support numerical structural analysis: Application to the assessment of an archaeological remain. Remote Sens. 2019, 11, 1276. [Google Scholar] [CrossRef]
  106. Kolokoussis, P.; Skamantzari, M.; Tapinaki, S.; Karathanassi, S.; Georgopoulos, A. 3D and hyperspectral data integration for assessing material degradation in medieval masonry heritage buildings. Int. Arch. Photogramm. Remote Sens. Spat. Inf. Sci. 2021, 43, 583–590. [Google Scholar] [CrossRef]
  107. Greco, E.; Gaetano, A.S.; De Spirt, A.; Semeraro, S.; Piscitelli, P.; Miani, A.; Mecca, S.; Karaj, S.; Trombin, R.; Hodgton, R.; et al. AI-Enhanced Tools and Strategies for Airborne Disease Prevention in Cultural Heritage Sites. Epidemiologia 2024, 5, 267–274. [Google Scholar] [CrossRef]
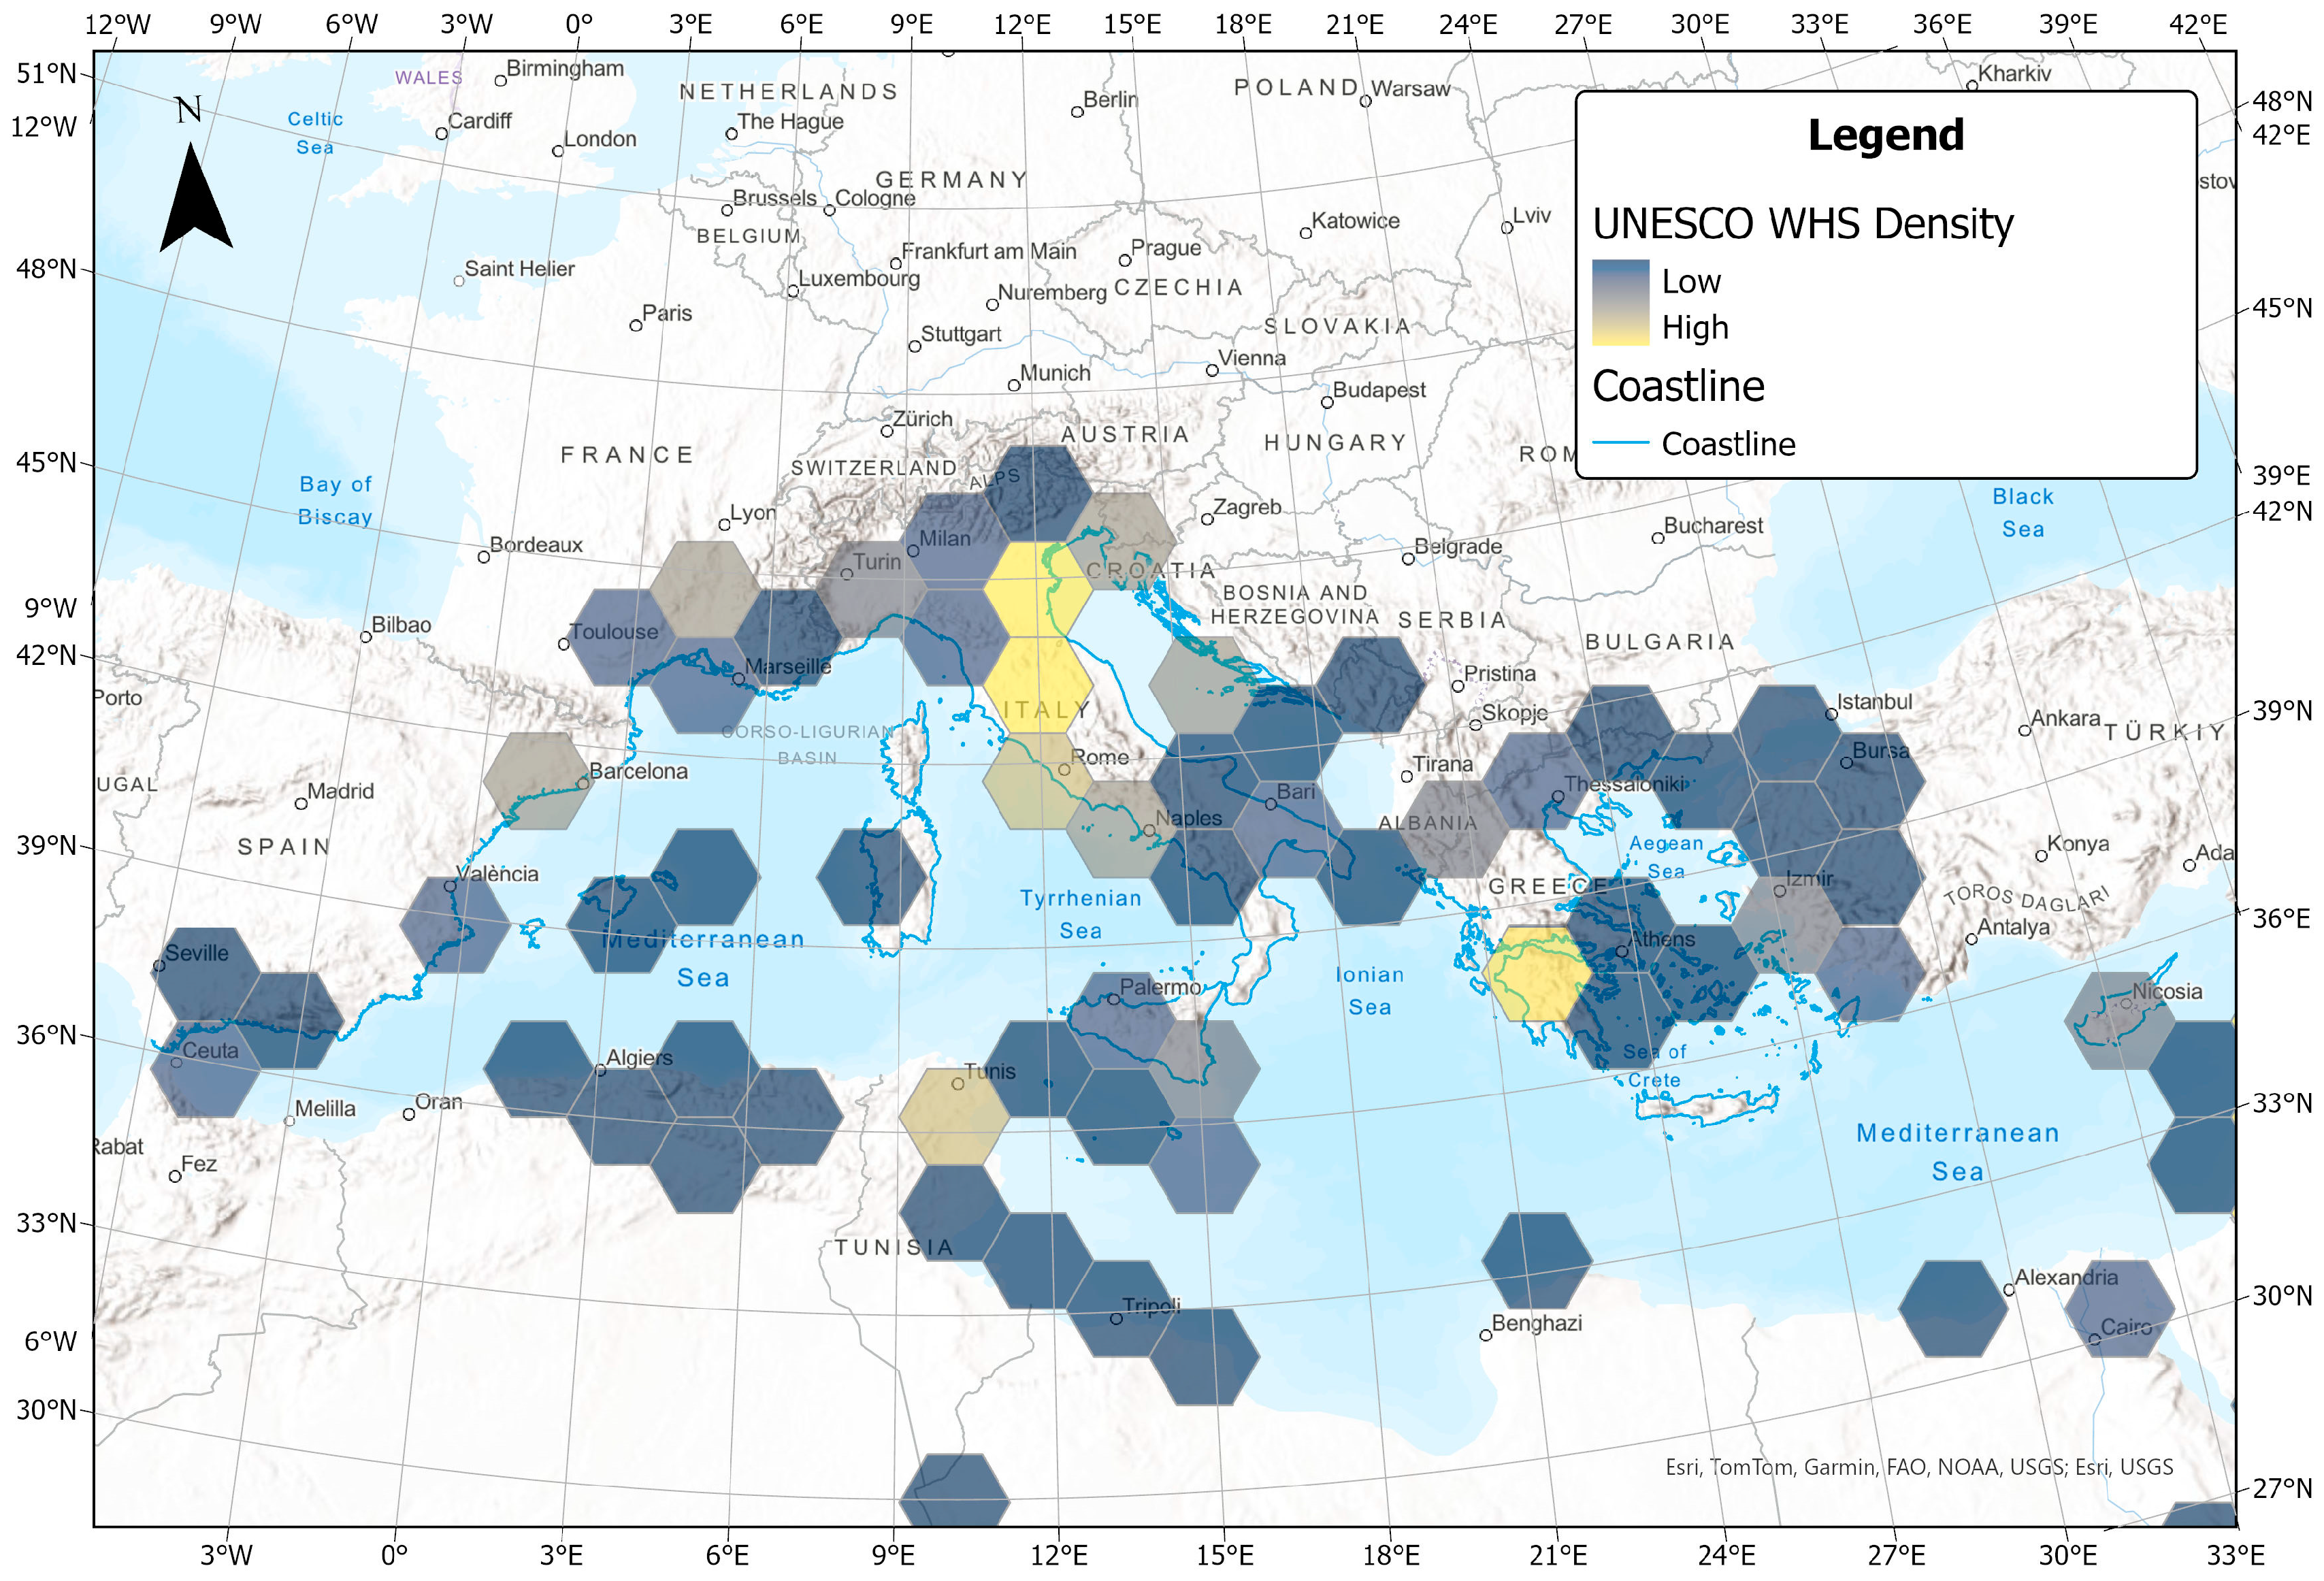
Figure 1. Density of UNESCO World Heritage Sites in the Mediterranean Region (Low: 1–High: 4).
Applsci 14 07210 g001
Figure 2. Global, European and national coastline datasets’ deviation in the Island of Aegina, Greece.
Applsci 14 07210 g002
Figure 3. EGMS L3 mean vertical velocity in the Mediterranean Coasts in mm/year.
Applsci 14 07210 g003
Figure 4. SLR projection for 2100 under RCP 8.5 scenario.
Applsci 14 07210 g004
Figure 5. Density of Cultural Heritage Sites in the Mediterranean Region (Low: 1-High: 70).
Applsci 14 07210 g005
Figure 6. Data pre-processing methodology.
Applsci 14 07210 g006
Figure 7. Flowchart for calculating probable elevation values in 2050 and 2100 under RCP 2.6, 4.5, 8.5.
Applsci 14 07210 g007
Figure 8. Identification of new coastal areas expected to flood due to Sea Level Rise in 2050 and 2100 under RCP scenarios 2.6, 4.5, 8.5.
Applsci 14 07210 g008
Figure 9. (a) Graph presenting new affected areas by SLR (in sq.km) per country under different RCP scenarios for 2050, (b) Graph presenting new affected areas by SLR (in sq.km) per country under different RCP scenarios for 2100, (c) Graph presenting the additional new affected areas in sq.km) by SLR between 2050 and 2100 under different RCP scenarios.
Applsci 14 07210 g009
Figure 10. Density of Cultural Heritage Sites under threat from SLR in the Mediterranean Region (Low: 1–High: 16).
Applsci 14 07210 g010
Figure 11. Number of CH assets threatened by Sea Level Rise per country under different RCP scenarios in 2050 and 2100.
Applsci 14 07210 g011
Table 1. Mediterranean Coastline extension in km for EU-27 Countries.
CountryCoastline (km)
Greece17,277.92
Italy14,673.59
Spain6835.66
Croatia5798.06
France5559.29
Cyprus737.39
Malta255.63
Slovenia55.57
Table 2. Possible affected areas from SLR (in sq.km.) per country.
20502100
RCP 2.6RCP 4.5RCP 8.5RCP 26RCP 4.5RCP 8.5
Croatia1.912.212.475.737.8210.68
Cyprus3.403.593.889.2010.5312.69
France56.4963.9168109.47114.82121.84
Greece68.1073.1181.02173.53186.26204.83
Italy48.0056.4159.4275.20124.54159.92
Malta0.070.080.080.280.390.55
Slovenia0.190.190.200.300.540.70
Spain18.6421.0421.5236.0141.7551.15
Total:196.81220.55236.60409.73486.66562.37
Table 3. Mean velocity and its calculated standard deviation in selected locations.
LocationMean Velocity (mm/Year)Mean Velocity (St.D)
Rhodes (GR)−1.460.31
Santorini (GR)1.140.24
Samos (GR)12.841.62
Delos (GR)−0.280.17
Napoli (IT)−1.750.28
Sicily (IT)−1.080.38
Mallorca (ES)−1.350.05
Barcelona (ES)−1.450.01
Marseille (FR)−1.260.01
Nice (FR)−0.910.02
Dubrovnik (CR)−2.440.22
Hvar (CR)−1.010.21
Paphos (CY)−1.370.21
Malta (MLT)−1.910.25
Disclaimer/Publisher’s Note: The statements, opinions and data contained in all publications are solely those of the individual author(s) and contributor(s) and not of MDPI and/or the editor(s). MDPI and/or the editor(s) disclaim responsibility for any injury to people or property resulting from any ideas, methods, instructions or products referred to in the content.