
Characterization of Multi-Layer Rolling Contact Fatigue Defects in Railway Rails Using Sweeping Eddy Current Pulse Thermal-Tomography


Abstract
1. Introduction
2. Literature Review
3. Methodology of Sweeping Eddy Current Pulse Thermal-Tomography
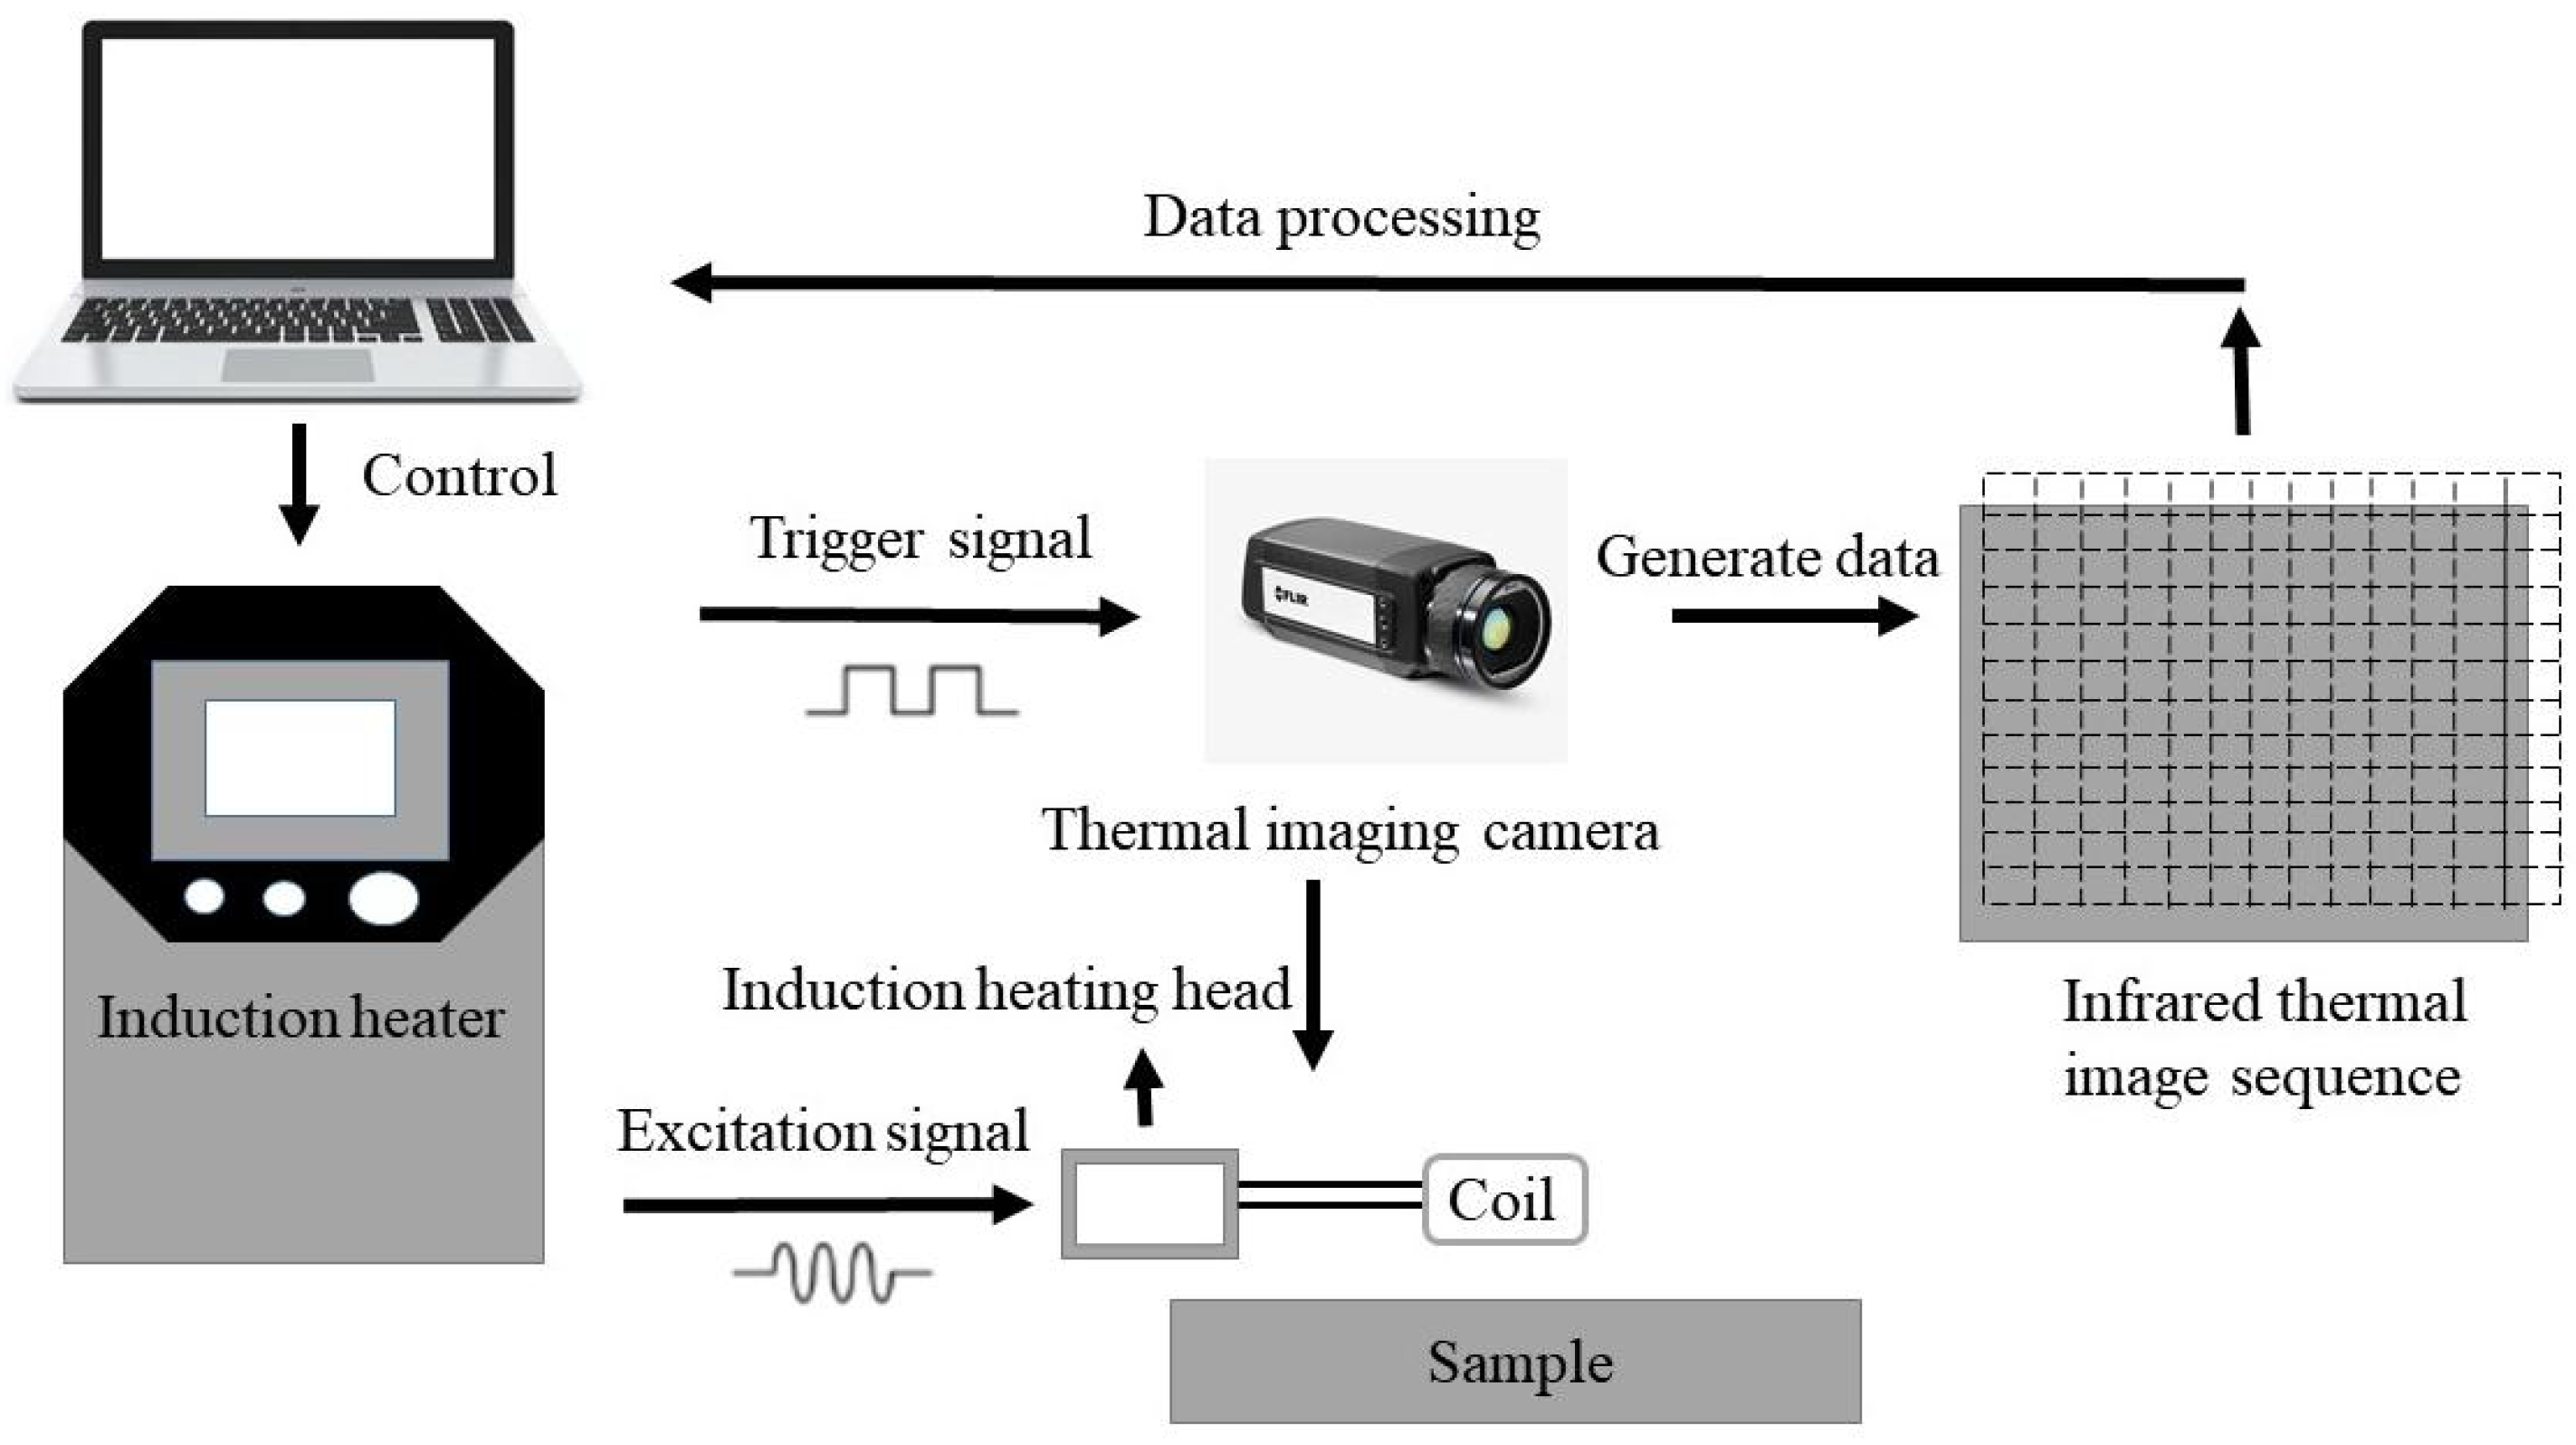
3.1. Ecptt System
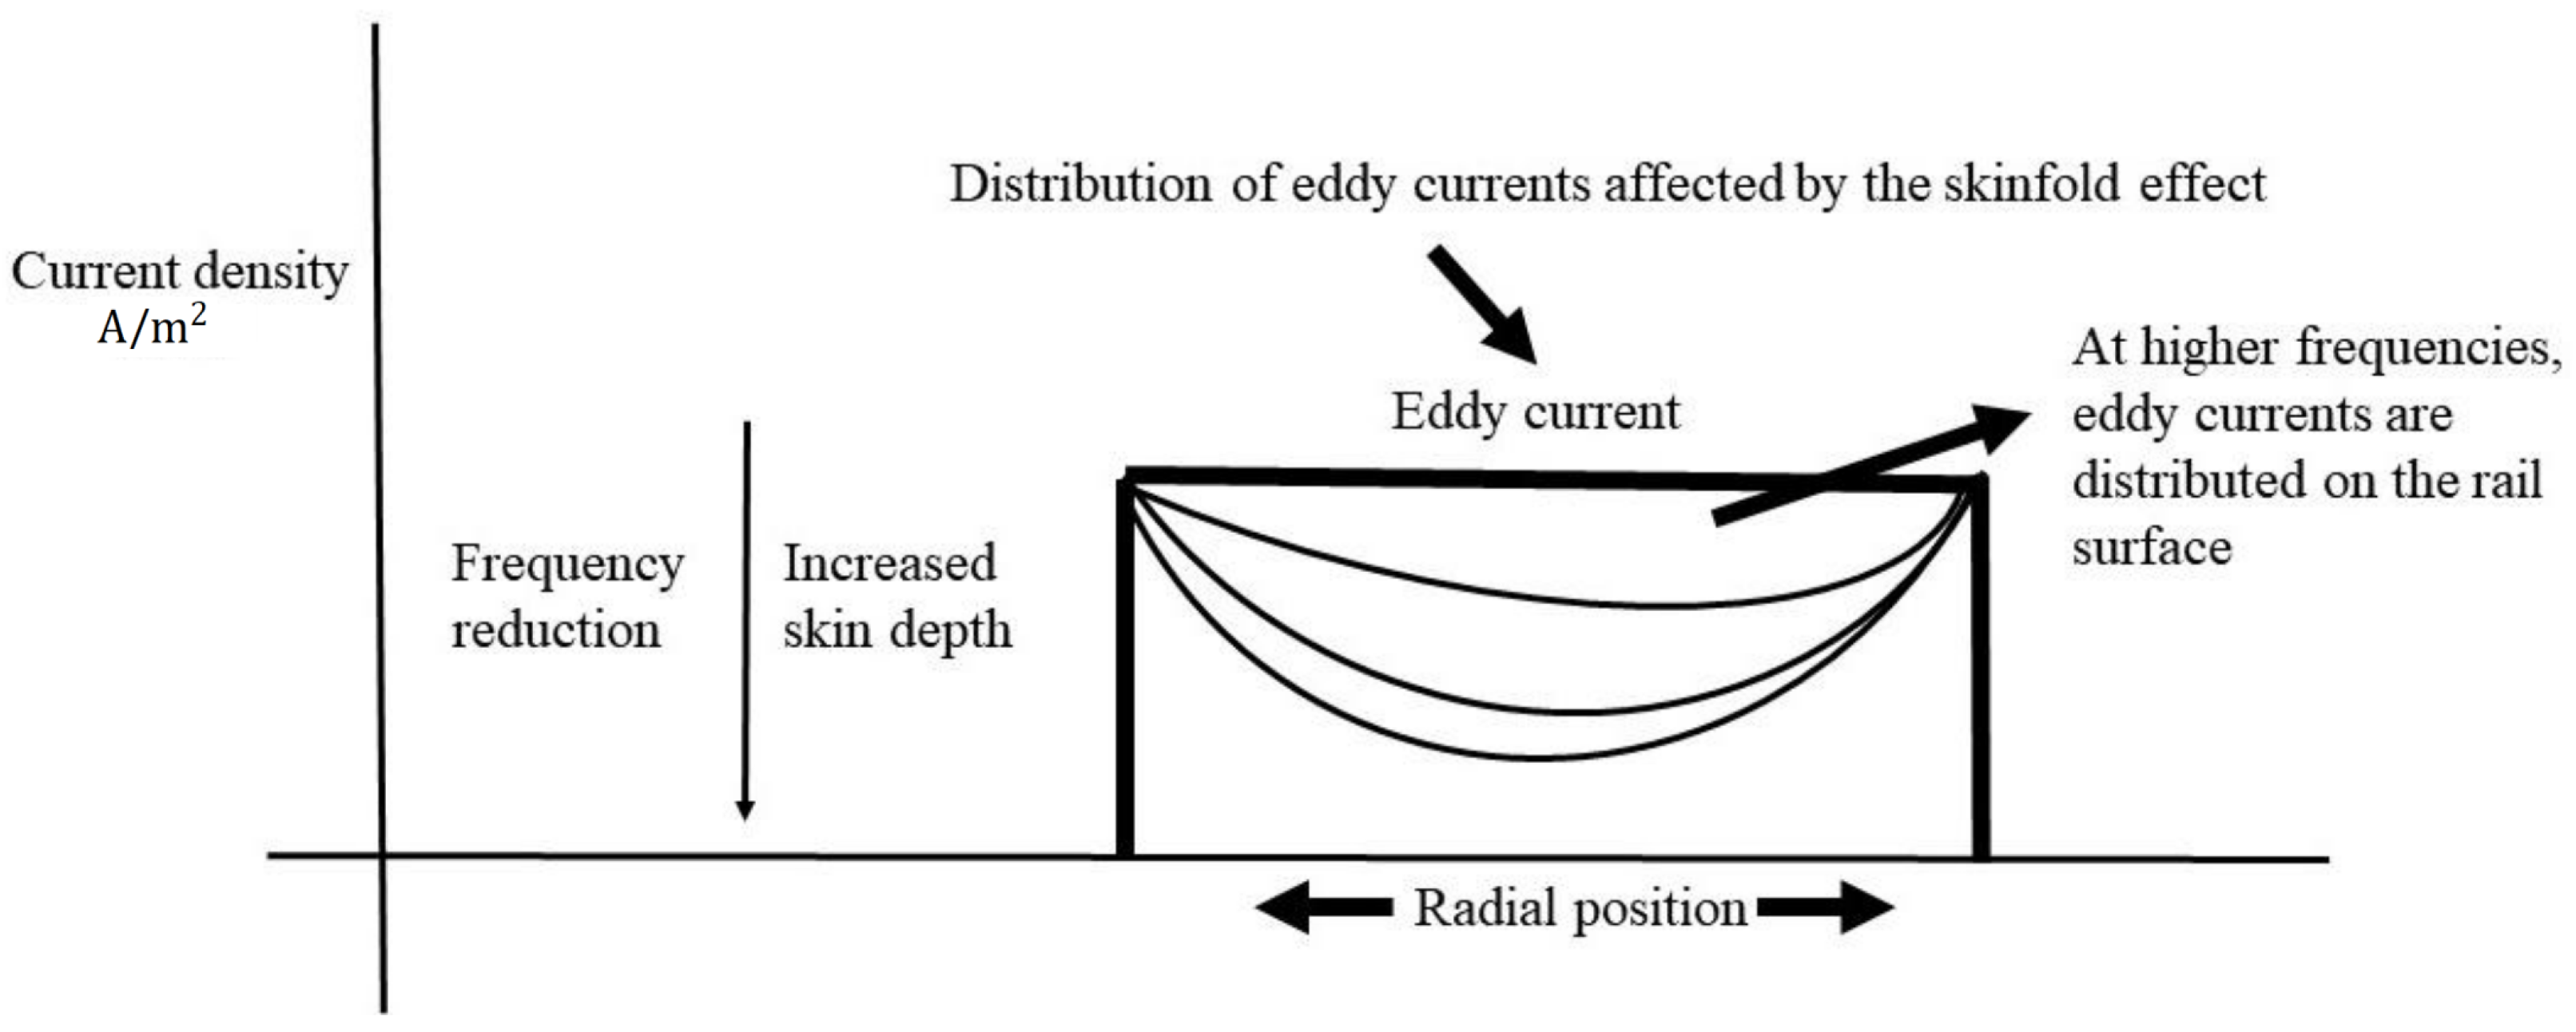
3.2. Physical Modeling of Sweeping Eddy Current Pulse Thermal-Tomography
3.3. Thermal Signal Feature Extraction
- (1)
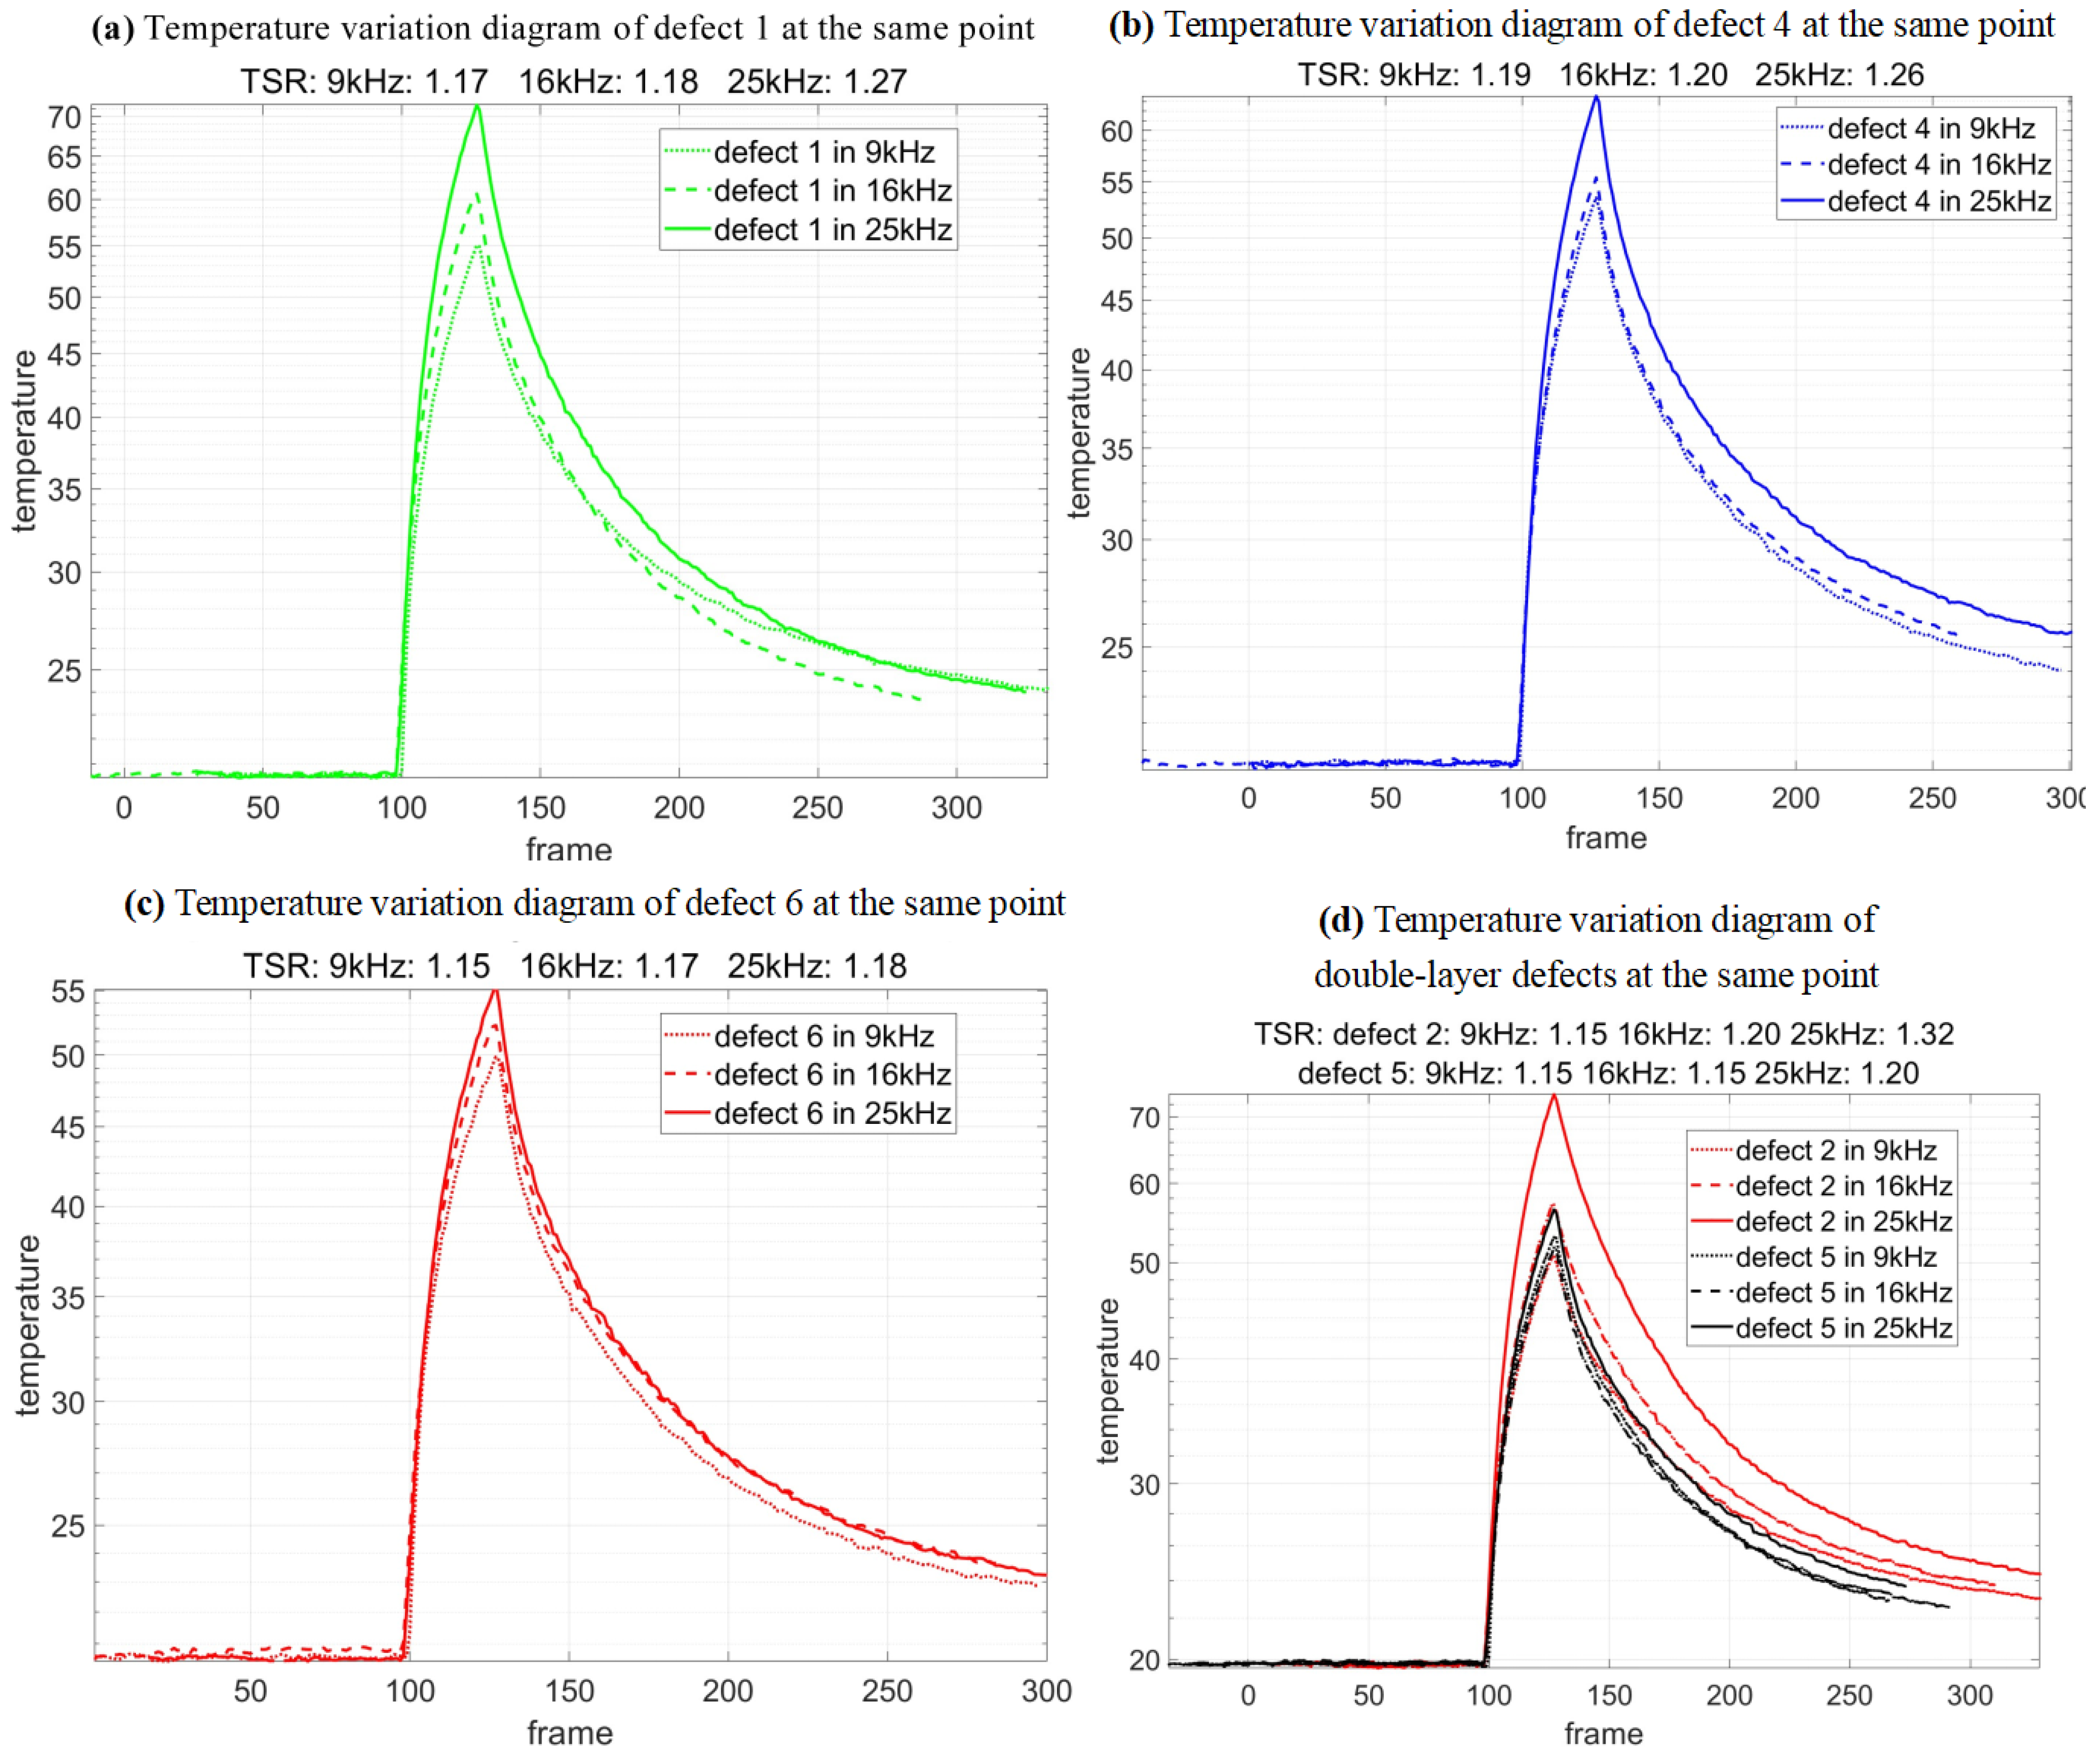
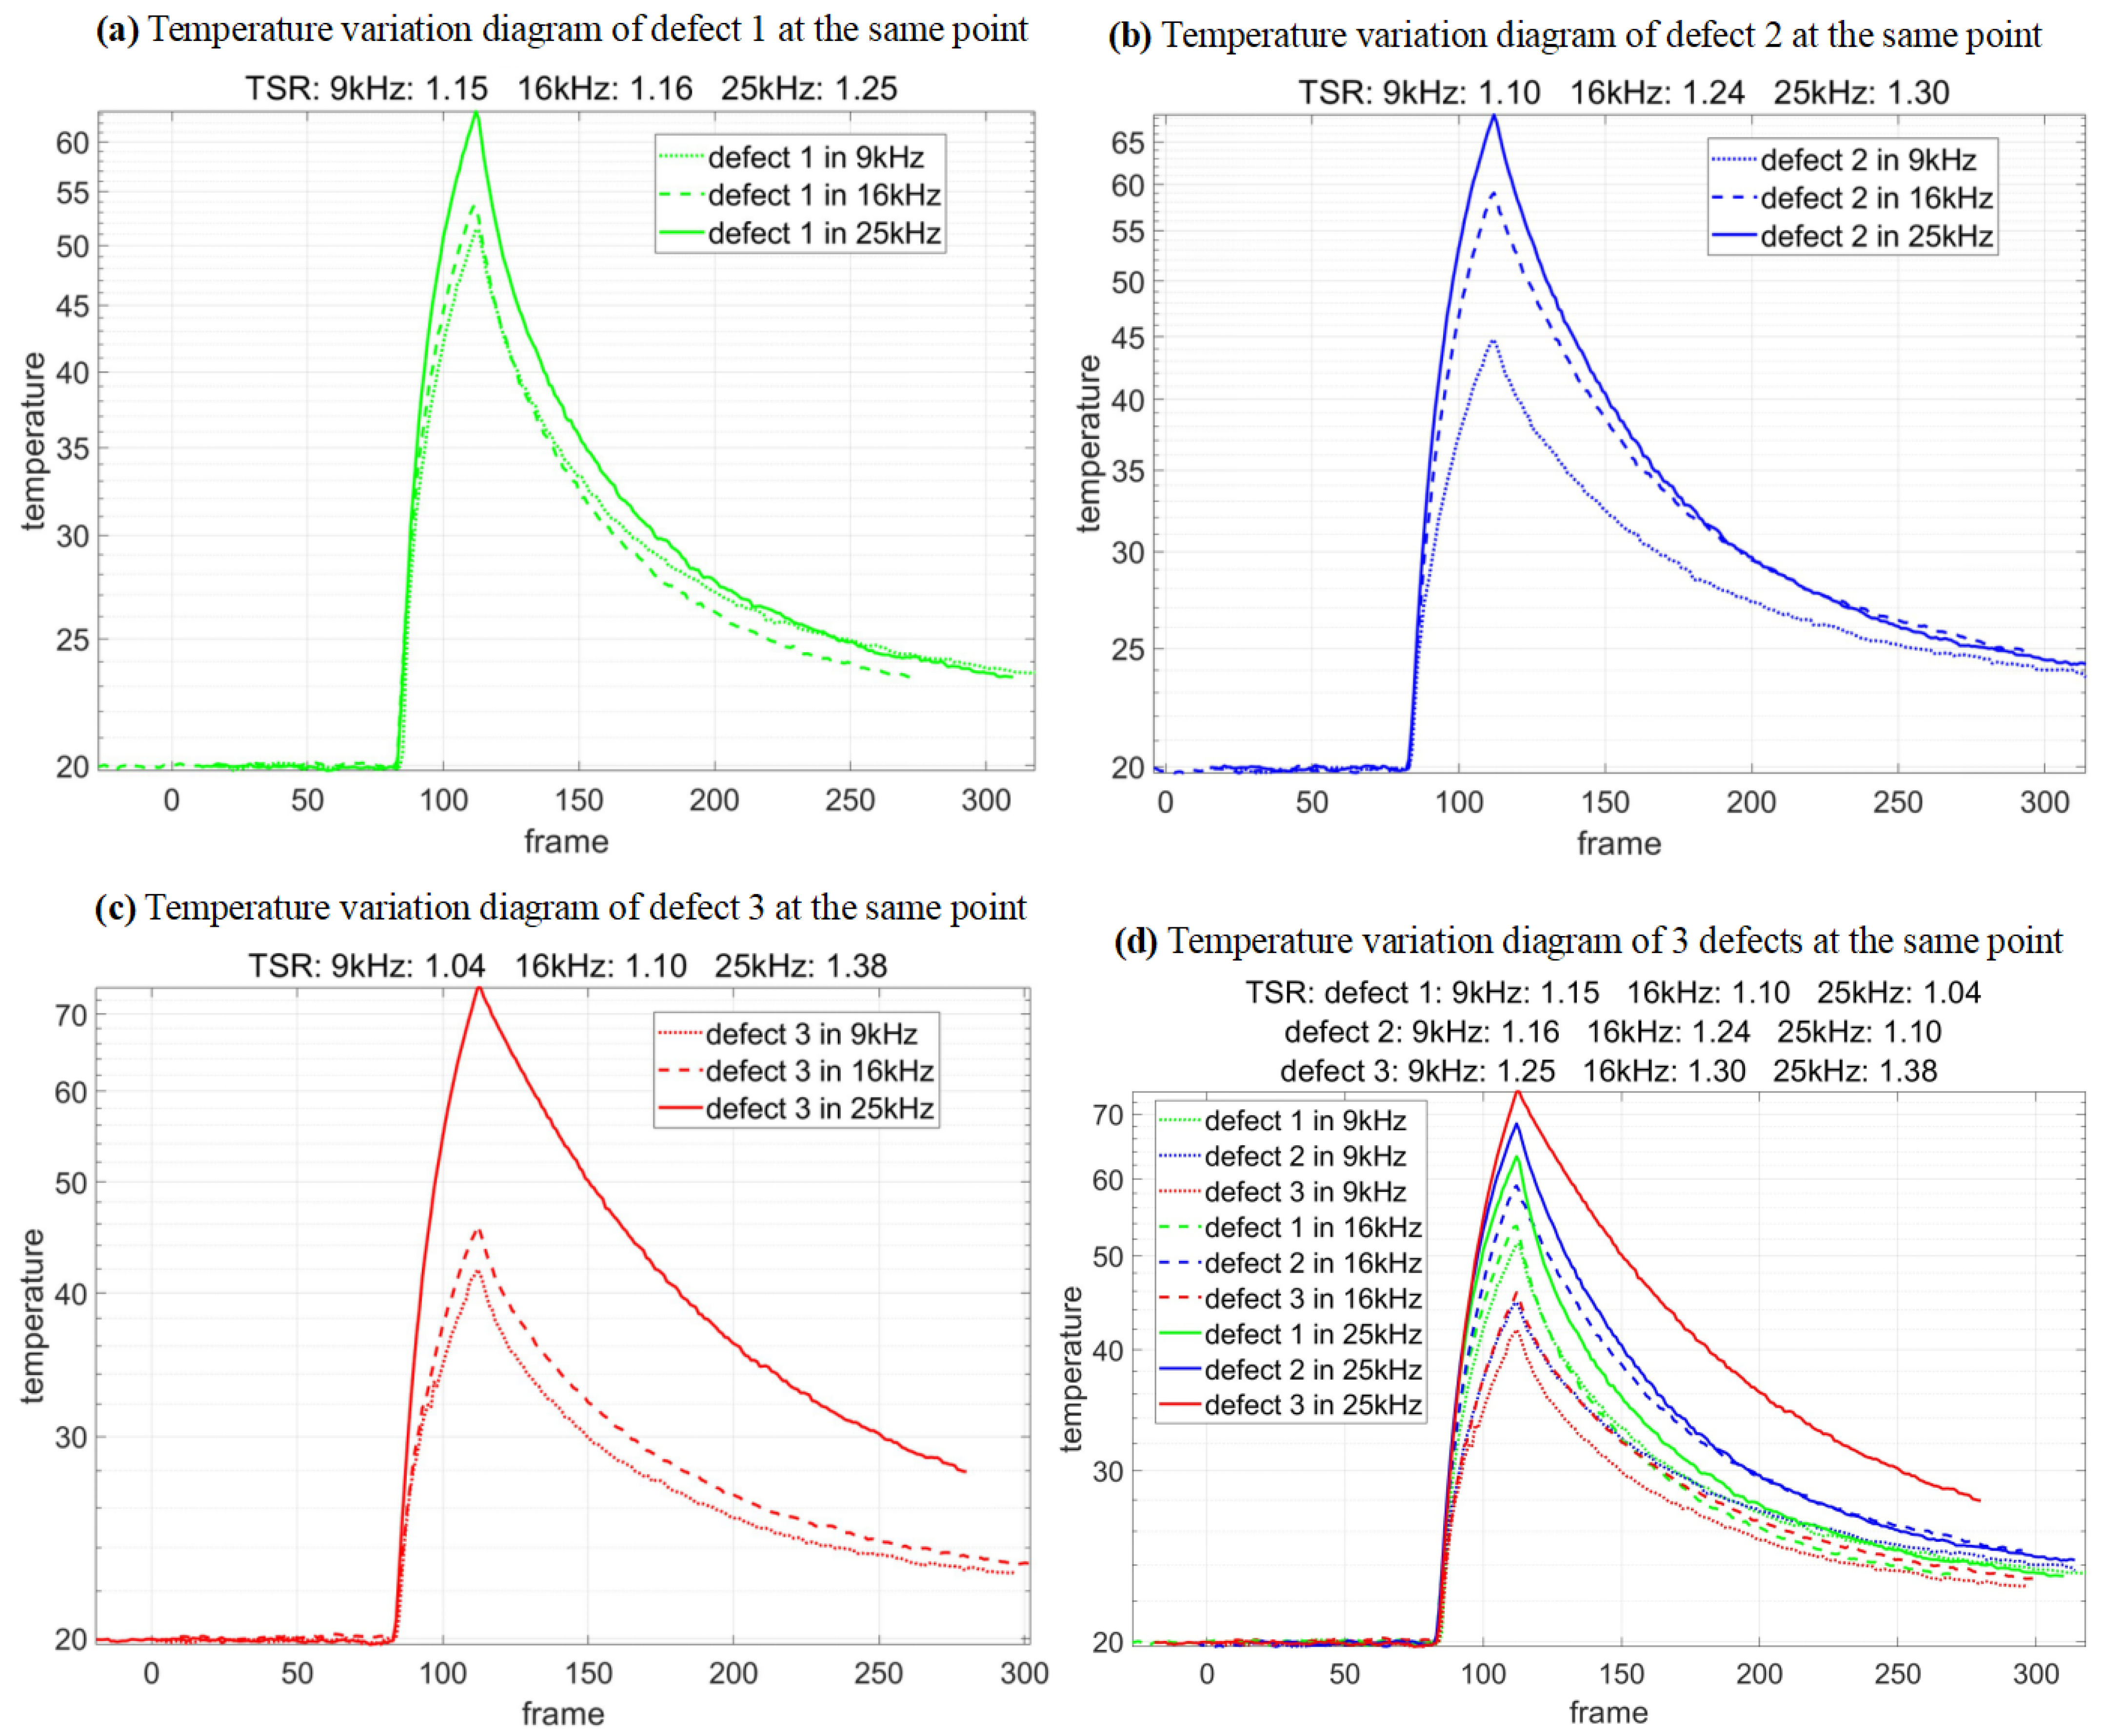
- TSR
- (2)
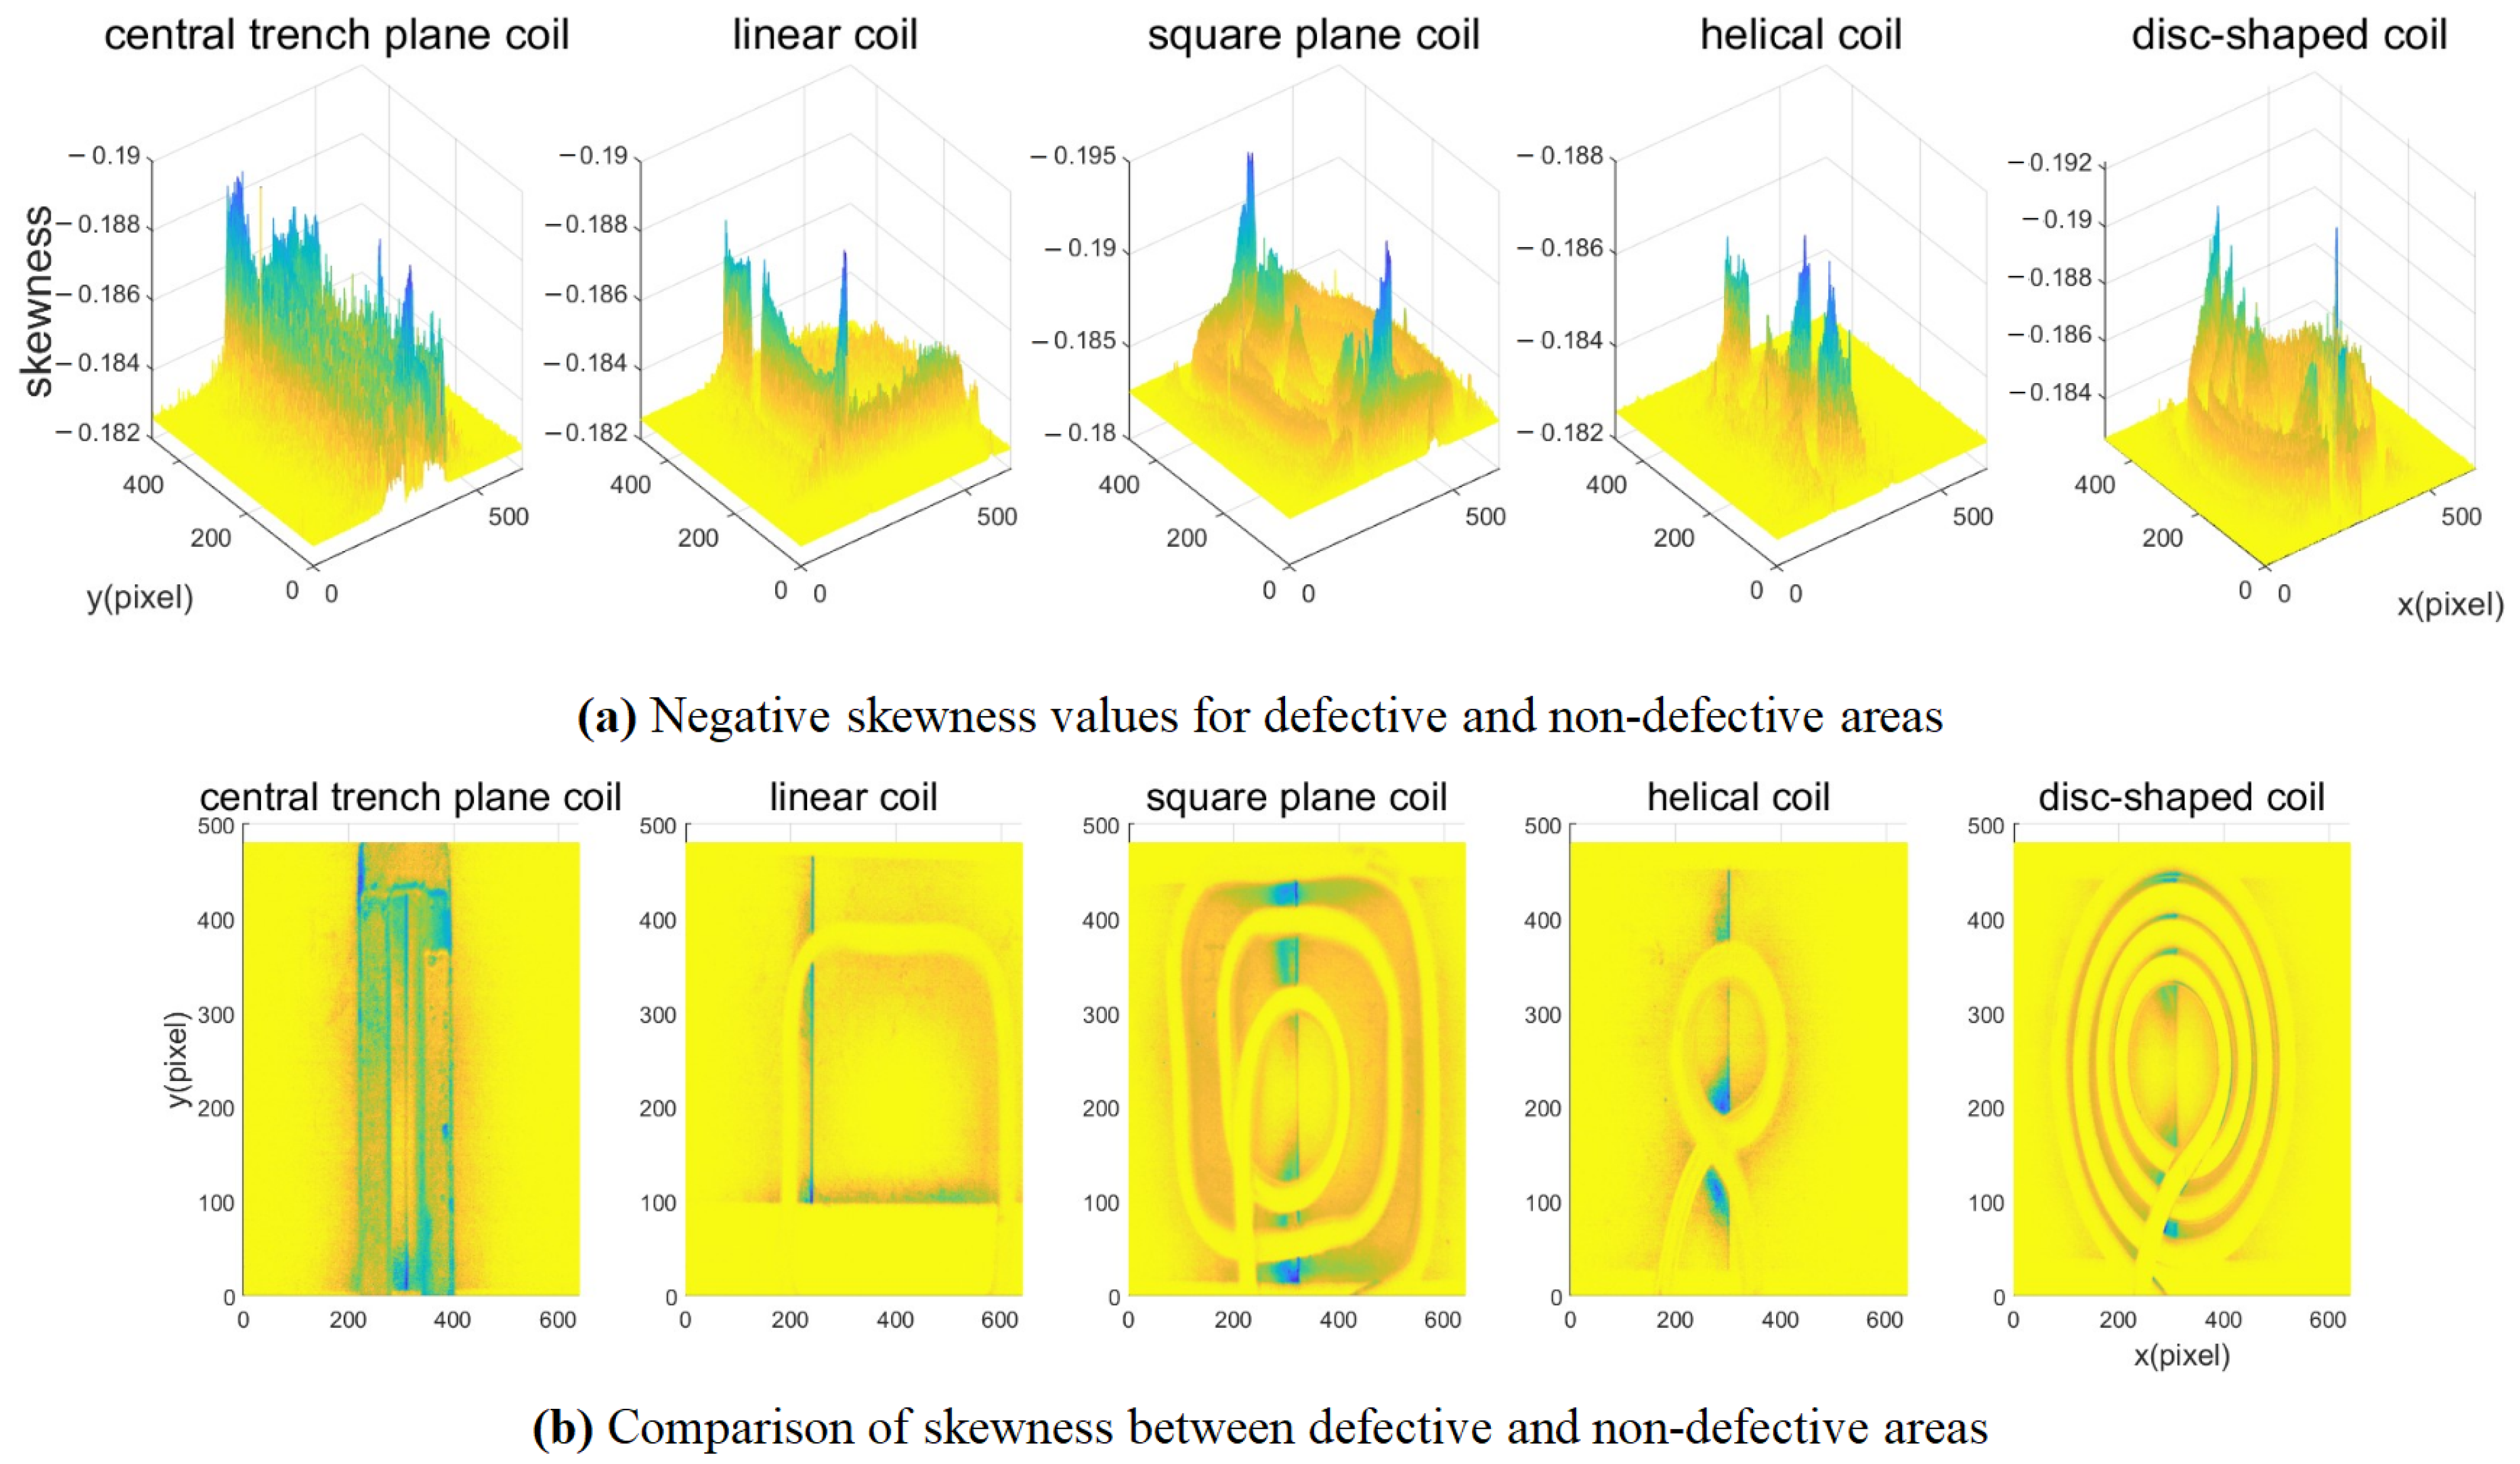
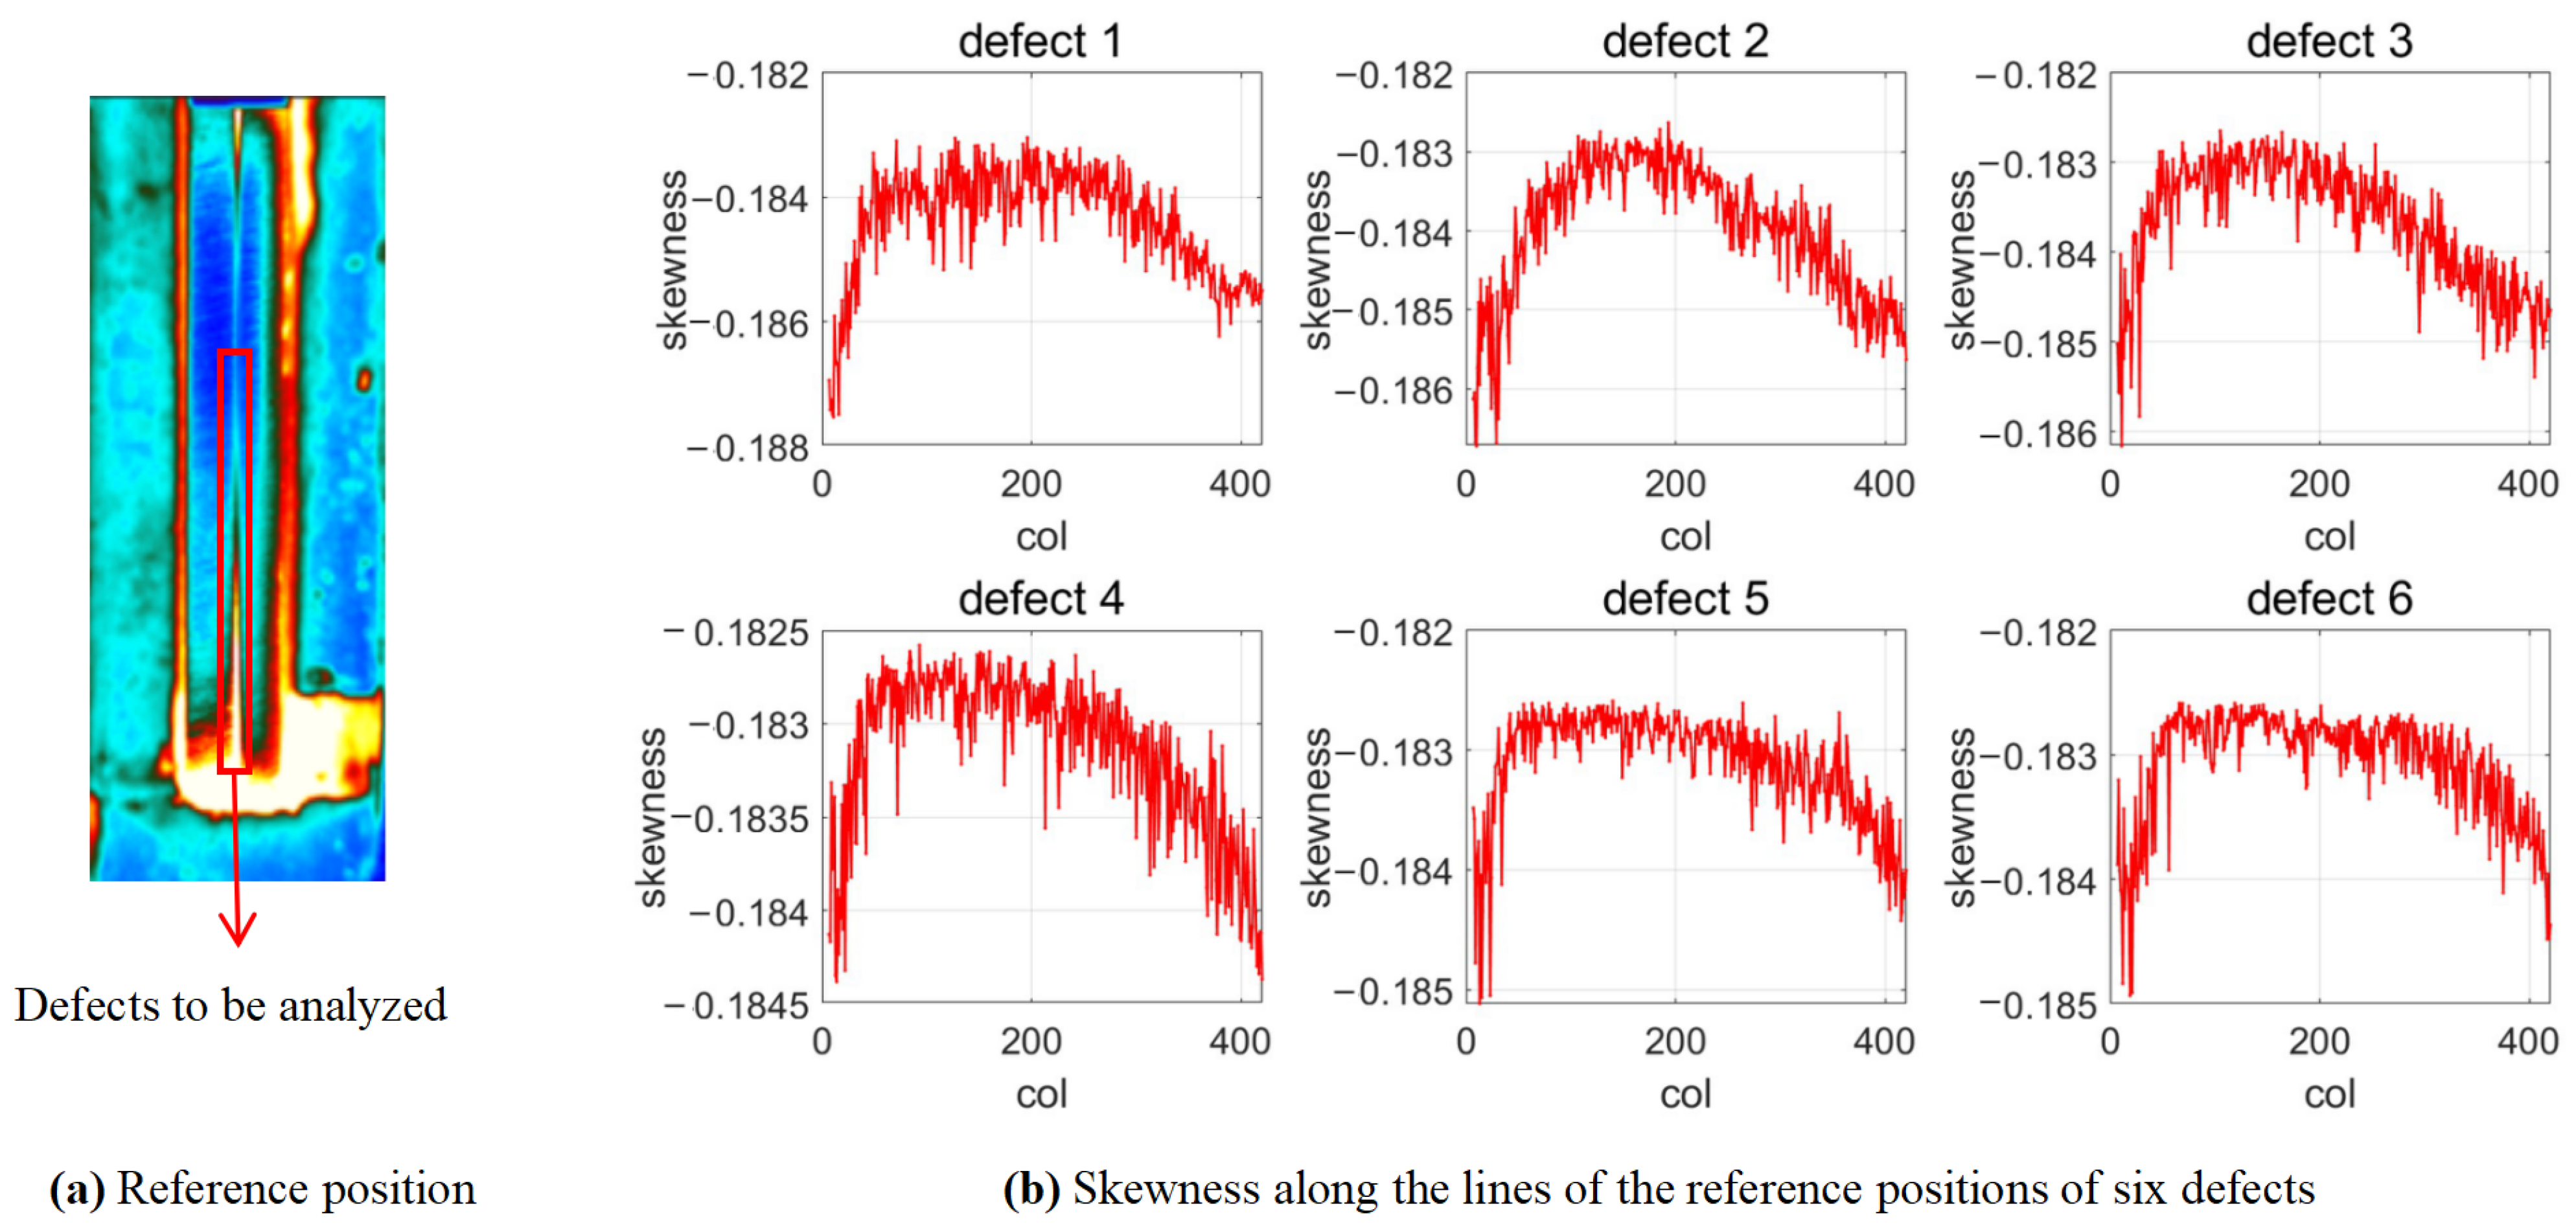
- Skewness
4. Experimental Study
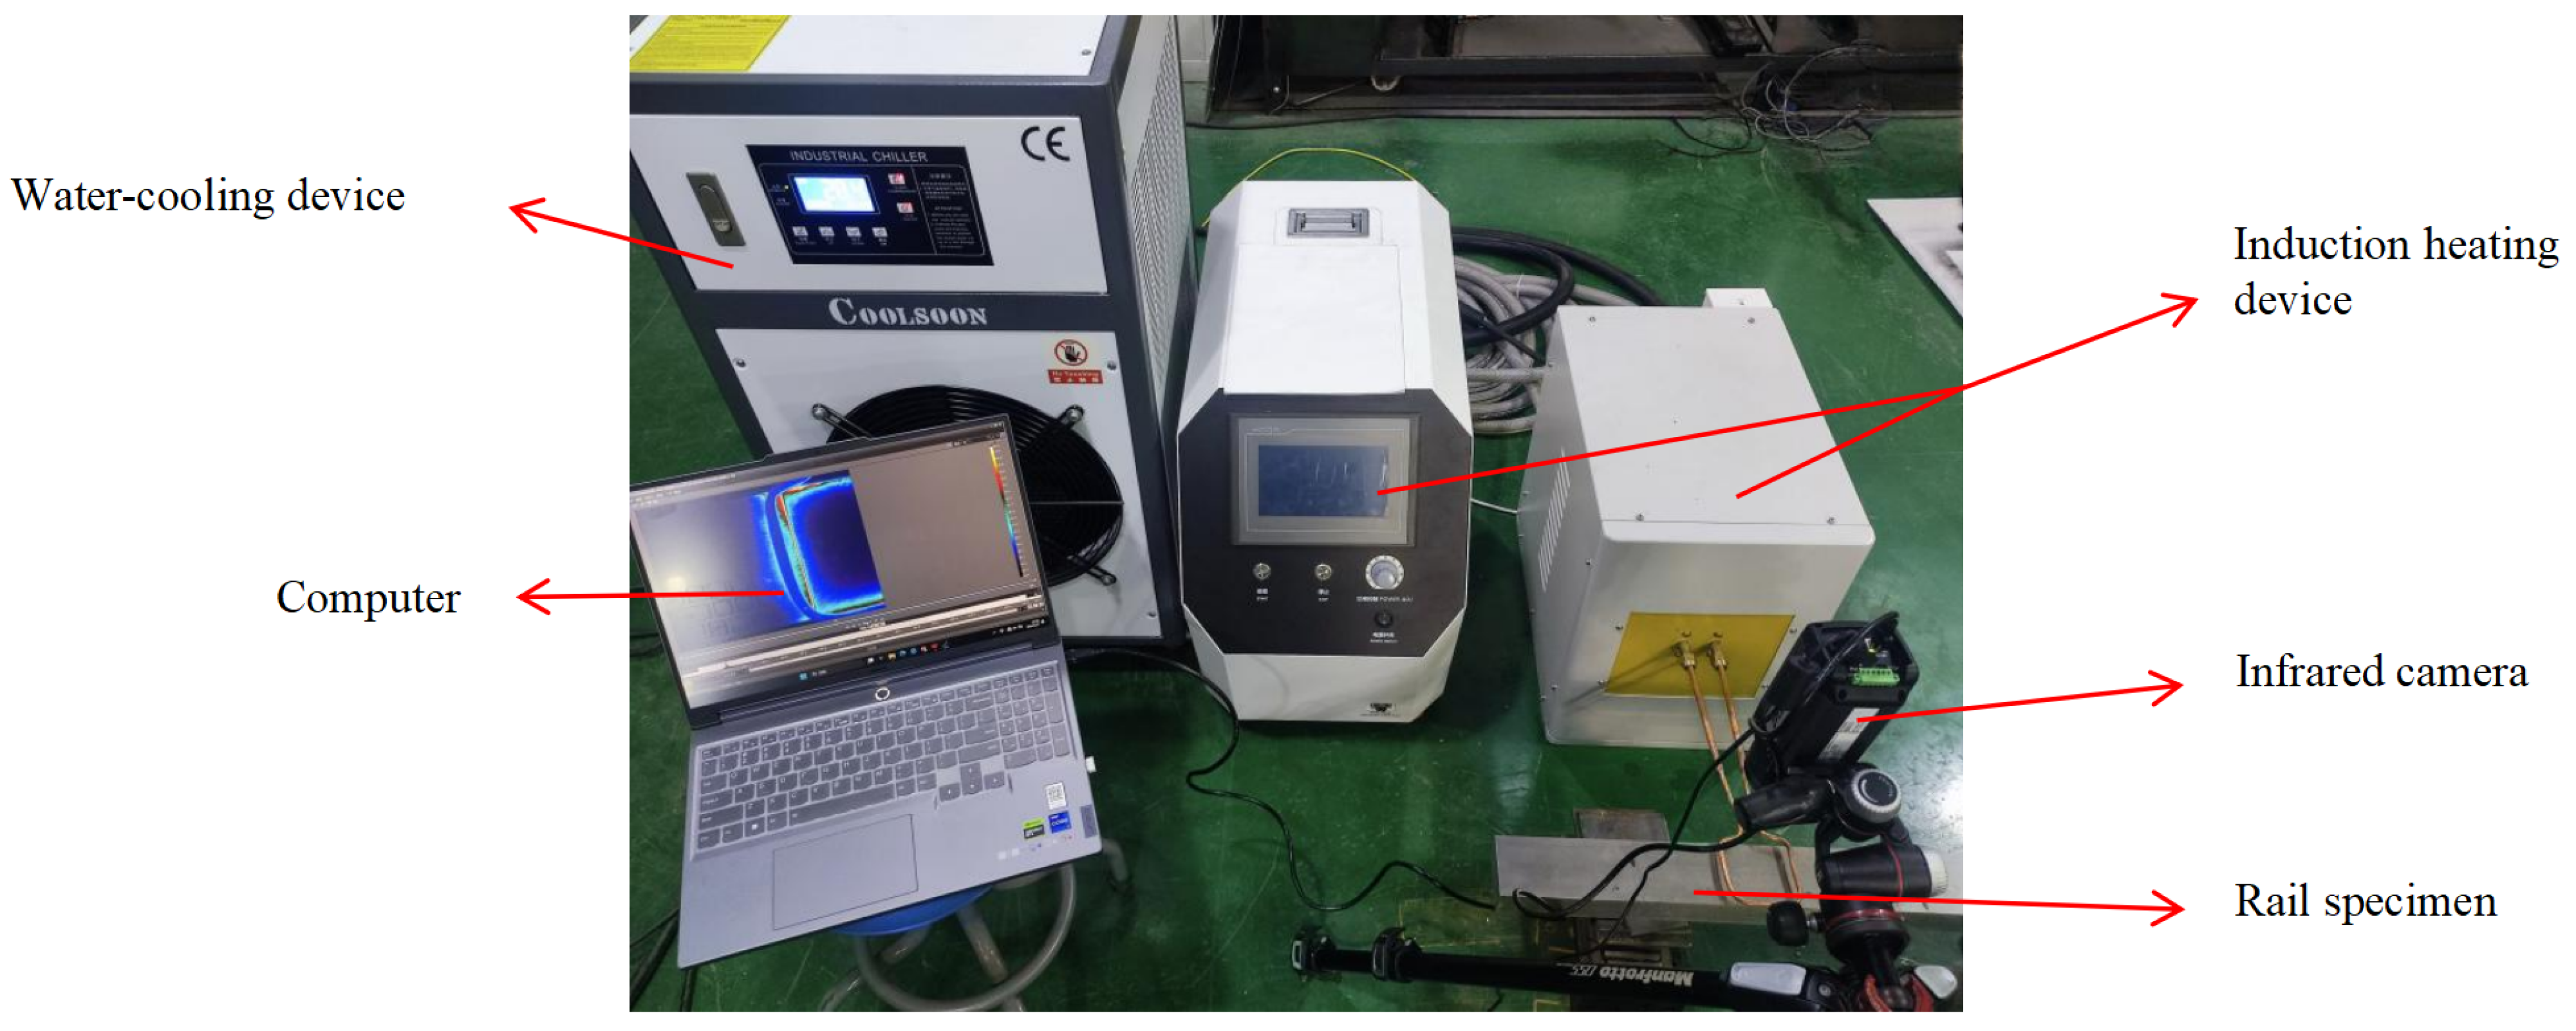
4.1. Experimental Setup
- (1)
- ECPTT Configuration
- (2)
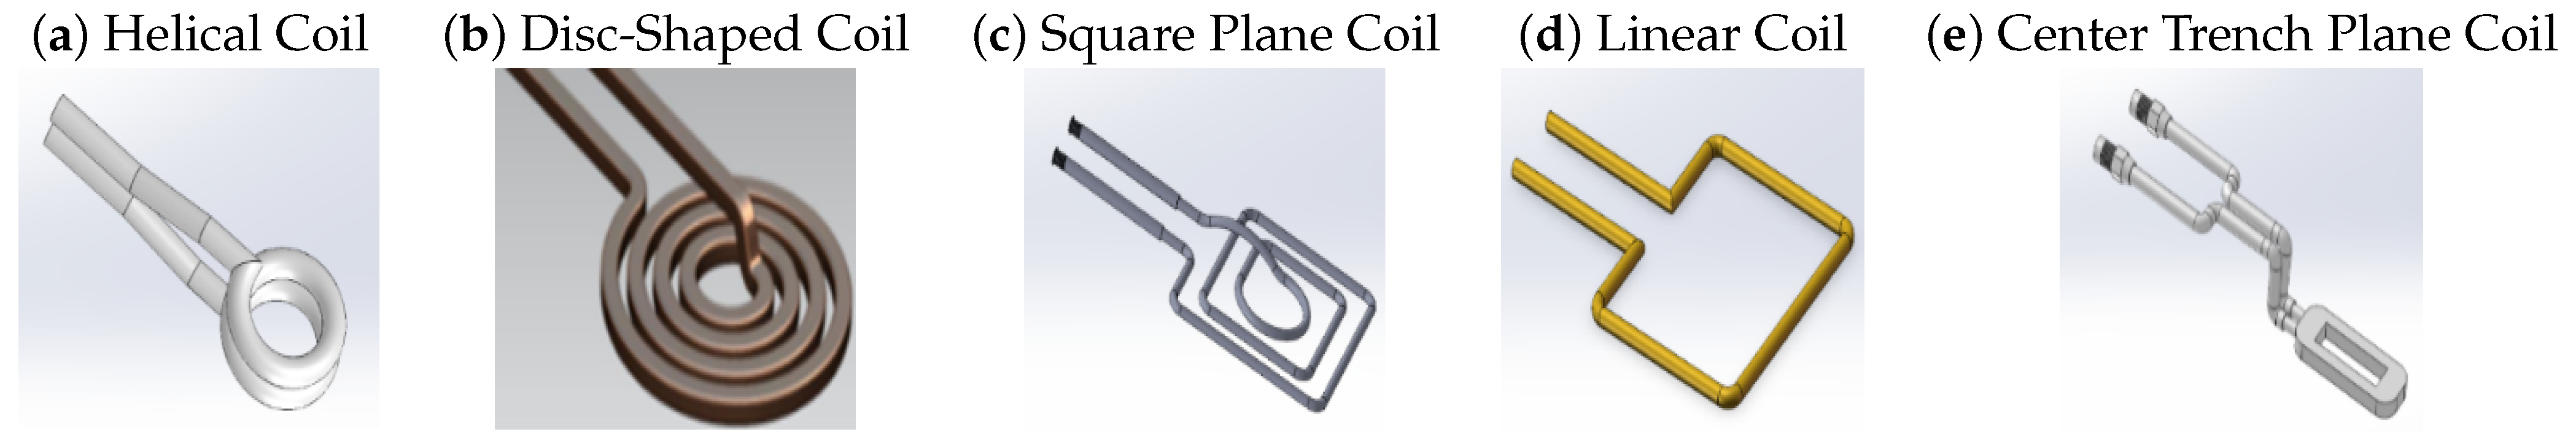
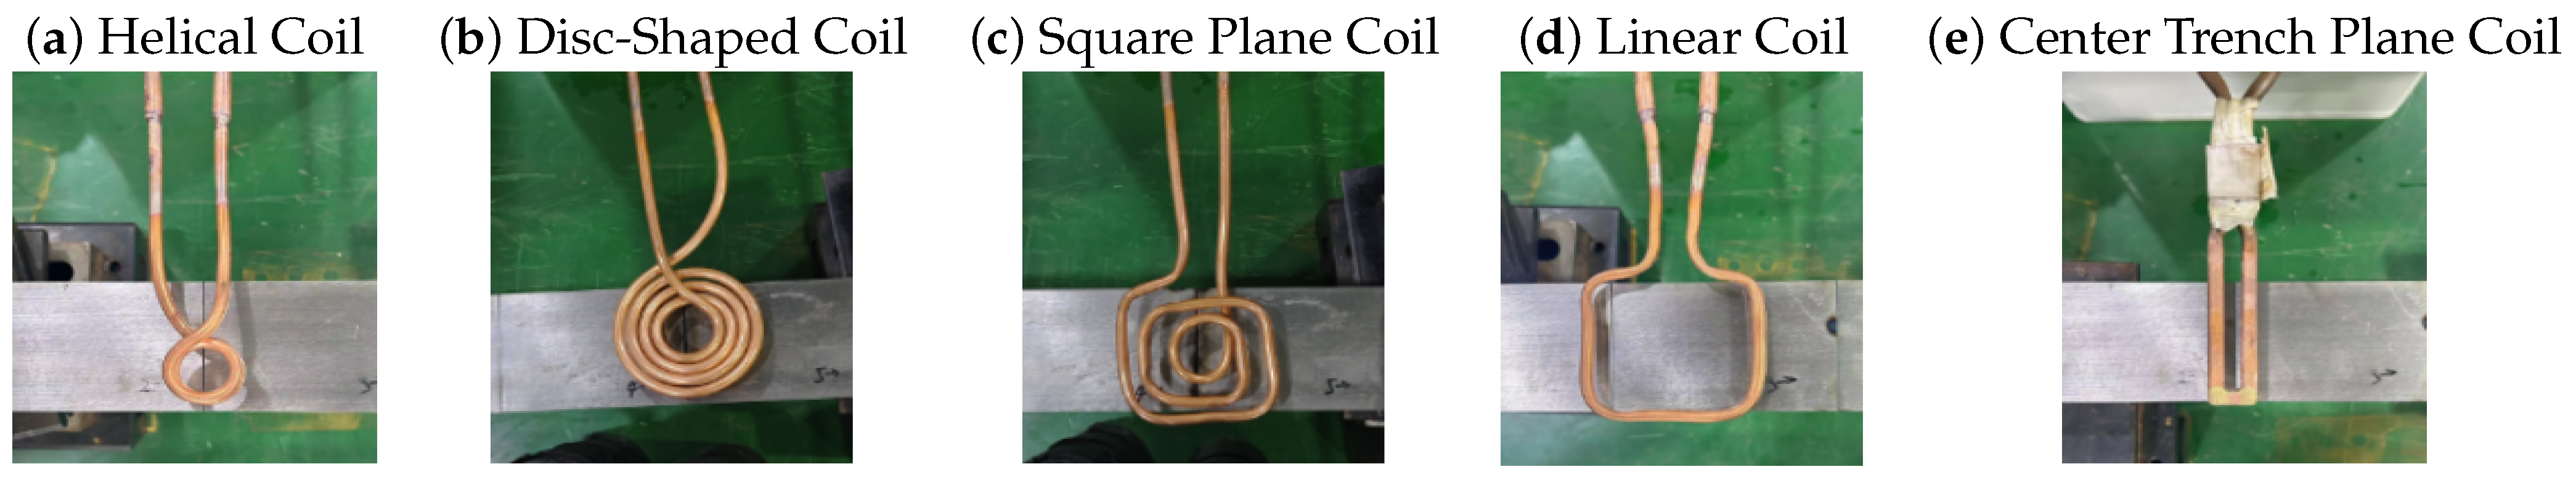
- Excitation Coils
4.2. Specimen
5. Results Analysis
5.1. Thermal Image Comparison
5.2. Quantitative Analysis
- (1)
- Feature Extraction to Thermal Response
- (2)
- Feature Analysis for Distinguishing Multi-layer Defects
- (a)
- The Depth of Defects
- (b)
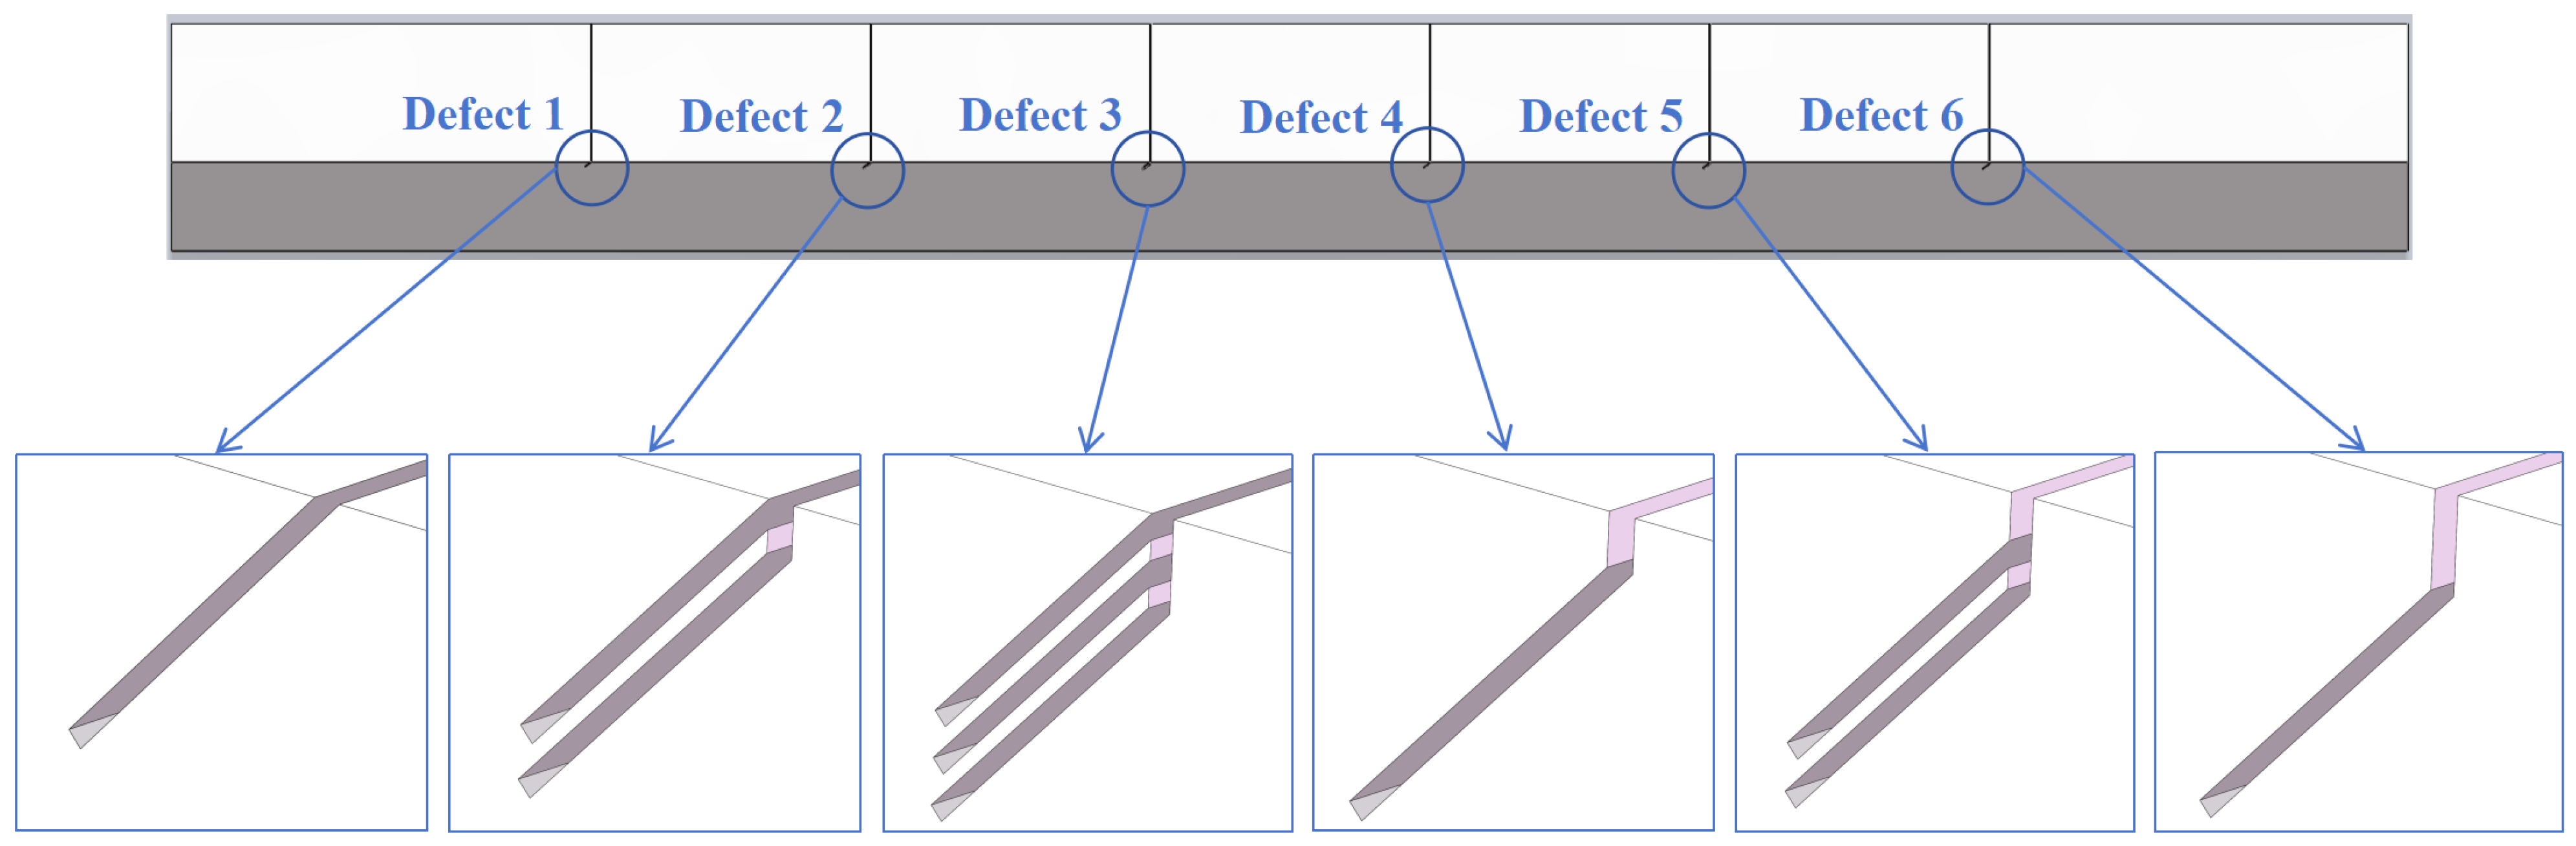
- The Layer of Defects
- (c)
- Discussion
6. Conclusions
Author Contributions
Funding
Institutional Review Board Statement
Informed Consent Statement
Data Availability Statement
Acknowledgments
Conflicts of Interest
References
- Grassie, S.L. Rolling contact fatigue on the British railway system: Treatment. Wear 2005, 258, 1310–1318. [Google Scholar] [CrossRef]
- Wang, Z.J. The Operating Mileage of China’s High-Speed Rail Has Reached 45,000 km. People’s Railway, 12 January 2024. [Google Scholar] [CrossRef]
- Zhou, L.; Brunskill, H.P.; Lewis, R. Real-time non-invasive measurement and monitoring of wheel–rail contact using ultrasonic reflectometry. Struct. Health Monit. 2019, 18, 1953–1965. [Google Scholar] [CrossRef]
- Yan, G.C.; He, Q.F.; Gao, Y.G. Study of Rolling Contact Fatigue of Wheels. Railw. Veh. 2002, 202, 17–20+1. [Google Scholar]
- Pan, S. Research on Machine Vision Based Surface Defect Detection Method for Steel Rails. Ph.D. Thesis, Chongqing Jiaotong University, Chongqing, China, 2023. [Google Scholar]
- Kou, L.; Sysyn, M.; Fischer, S.; Liu, J.; Nabochenko, O. Optical Rail Surface Crack Detection Method Based on Semantic Segmentation Replacement for Magnetic Particle Inspection. Sensors 2022, 22, 8214. [Google Scholar] [CrossRef] [PubMed]
- Shen, J.L.; Hou, Y.P.; Zhang, C. A Review of the Characterization of Rolling Contact Fatigue Cracks in Railway Rails Based on Alternating Current Field Measurement. China Railw. Sci. 2024, 5, 15–29. [Google Scholar]
- Qiu, Q.; Liu, Y.L.; Wu, J.B. Simulation analysis of Quantification effect of tensile Stress on Ferromagnetic material Defects based on ECPT. J. Nondestruct. Test. 2019, 45, 1–17. [Google Scholar]
- Thomas, H.M.; Heckel, T.; Hanspach, G. Advantage of a combined ultrasonic and eddy current examination for railway inspection trains. Non-Destr. Test. Aust. 2007, 49, 341–344. [Google Scholar] [CrossRef]
- Duan, S.Y.; Song, Y.; Wu, X.J. Measurement Method for Pulsed-eddy Current Lifting Distance Based on Continuous Homology. Control. Instruments Chem. Ind. 2022, 49, 54–59. [Google Scholar]
- Song, H.C.; Li, P.D.; Zhang, L.F. Design and performance analysis of planar coil sensors for pipeline eddy current inner inspection. Nondestruct. Test. 2024, 46, 1–5. [Google Scholar]
- Gao, B.; He, Y.; Woo, W.L. Multidimensional tensor-based inductive thermography with multiple physical fields for offshore wind turbine gear inspection. IEEE Trans. Ind. Electron. 2016, 63, 6305–6315. [Google Scholar] [CrossRef]
- Bai, L.B.; Gao, B.; Tian, S.L.; Cheng, Y.H.; Chen, Y.F.; Tian, G.Y.; Woo, W.L. A comparative study of principal component analysis and independent component analysis in eddy current pulsed thermography data processing. Rev. Sci. Instrum. 2013, 84, 104901. [Google Scholar] [CrossRef] [PubMed]
- Song, X.C. Comparison of magnetic Field Distribution and Uniformity between Helmholtz Coils and Maxwell Coils. Magn. Mater. Dev. 2016, 47, 1618. [Google Scholar]
- Geng, X.; Li, Y.J. Optimal design of novel sensing structure in three-dimensional Magnetic Properties of Magnetic Matrials. Instrum. Technol. Sens. 2018, 7, 7–10. [Google Scholar]
- Gao, Y.; Tian, G.Y.; Wang, P. Electromagnetic pulsed thermography for natural cracks inspection. Sci. Rep. 2017, 7, 42073–42078. [Google Scholar] [CrossRef] [PubMed]
- Tsopelas, N.; Siakavellas, N.J. Electromagnetic-thermal NDT in thin conducting plates. NDT E Int. 2006, 39, 391–399. [Google Scholar] [CrossRef]
- Chen, X.; Tian, G.; Ding, S.; Ahmed, J.; Woo, W.L. Tomographic Reconstruction of Rolling Contact Fatigues in Rails Using 3D Eddy Current Pulsed Thermography. IEEE Sens. J. 2021, 17, 18488–18496. [Google Scholar] [CrossRef]
- Lugin, S.; Netzelmann, U. A defect shape reconstruction algorithm for pulsed thermography. NDT E Int. 2007, 40, 220–228. [Google Scholar] [CrossRef]
- Abidin, I.Z.; Tian, G.Y.; Wilson, J.; Yang, S.; Almond, D. Quantitative evaluation of angular defects by pulsed eddy current thermography. NDT E Int. 2010, 43, 537–546. [Google Scholar] [CrossRef]
- Liu, Y.; Tian, G.; Gao, B.; Lu, X.; Li, H.; Chen, X.; Zhang, Y.; Xiong, L. Depth quantification of rolling contact fatigue crack using skewness of eddy current pulsed thermography in stationary and scanning modes. NDT E Int. Indep. Nondestruct. Test. Eval. 2022, 128, 102630. [Google Scholar] [CrossRef]
- Zhu, J.Z.; Withers, P.J.; Wu, J.B.; Liu, F.; Yi, Q.; Wang, Z.; Tian, G.Y. Characterization of rolling contact fatigue cracks in rails by eddy current pulsed thermography. IEEE Trans. Ind. Inform. 2021, 17, 6305–6315. [Google Scholar] [CrossRef]
- Sun, D.; Tao, N.; Zeng, Z.; He, R. The Phenomenon of Pseudo-Defect Caused by Thermographic Signal Reconstruction in Pulsed Thermography Testing. Nondestruct. Test. 2011, 128, 104498. [Google Scholar]
- Zhou, X.; Xue, Y.; Chen, Y. Study of pseudo soldering based on eddy current pulsed thermography. Appl. Phys. Lett. 2017, 111, 114104. [Google Scholar] [CrossRef]

| Excitation Frequency | Central Trench Plane Coil | Linear Coil | Helical Coil | Square Plane Coil | Disc-Shaped Coil |
|---|---|---|---|---|---|
| 9 kHz |  |  |  |  |  |
| 16 kHz |  |  |  |  |  |
| 25 kHz |  |  |  |  |  |
| Excitation Frequency | 9 kHz | 16 kHz | 25 kHz |
|---|---|---|---|
| Simulation magnetic flux density of single-layer defect (cutaway view) |  |  |  |
| Simulation temperature of single-layer defect (cutaway view) |  |  |  |
| Simulation magnetic flux density of triple-layer defect (cutaway view) |  |  |  |
| Simulation temperature of triple-layer defect (cutaway view) |  |  |  |
| Excitation Frequency | Experimental Results (Surface View) | Simulation Results (Surface View) |
|---|---|---|
| 9 kHz |  |  |
| 16 kHz | 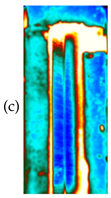 | 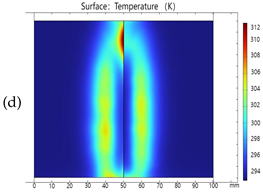 |
| 25 kHz | 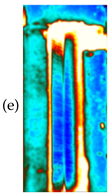 | 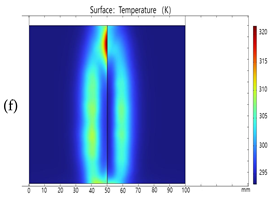 |
| Excitation Frequency | Defect 1 | Defect 2 | Defect 3 | Defect 4 | Defect 5 | Defect 6 |
|---|---|---|---|---|---|---|
| 9 kHz |  |  |  |  |  |  |
| 16 kHz |  |  |  |  |  |  |
| 25 kHz |  |  |  |  |  |  |
| Defect Number | Excitation Frequency | ||
|---|---|---|---|
| 9 kHz | 16 kHz | 25 kHz | |
| 1 | 1.17 | 1.18 | 1.27 |
| 2 | 1.10 | 1.24 | 1.30 |
| 3 | 1.04 | 1.10 | 1.38 |
| 4 | 1.19 | 1.20 | 1.26 |
| 5 | 1.15 | 1.15 | 1.20 |
| 6 | 1.15 | 1.17 | 1.18 |
Disclaimer/Publisher’s Note: The statements, opinions and data contained in all publications are solely those of the individual author(s) and contributor(s) and not of MDPI and/or the editor(s). MDPI and/or the editor(s) disclaim responsibility for any injury to people or property resulting from any ideas, methods, instructions or products referred to in the content. |
© 2024 by the authors. Licensee MDPI, Basel, Switzerland. This article is an open access article distributed under the terms and conditions of the Creative Commons Attribution (CC BY) license (https://creativecommons.org/licenses/by/4.0/).
Share and Cite
Zhang, H.; Zhang, S.; Chen, X.; Li, Y.; Zou, Y.; Zeng, Y. Characterization of Multi-Layer Rolling Contact Fatigue Defects in Railway Rails Using Sweeping Eddy Current Pulse Thermal-Tomography. Appl. Sci. 2024, 14, 7269. https://doi.org/10.3390/app14167269
Zhang H, Zhang S, Chen X, Li Y, Zou Y, Zeng Y. Characterization of Multi-Layer Rolling Contact Fatigue Defects in Railway Rails Using Sweeping Eddy Current Pulse Thermal-Tomography. Applied Sciences. 2024; 14(16):7269. https://doi.org/10.3390/app14167269
Chicago/Turabian StyleZhang, Hengbo, Shudi Zhang, Xiaotian Chen, Yingying Li, Yiling Zou, and Yizhao Zeng. 2024. "Characterization of Multi-Layer Rolling Contact Fatigue Defects in Railway Rails Using Sweeping Eddy Current Pulse Thermal-Tomography" Applied Sciences 14, no. 16: 7269. https://doi.org/10.3390/app14167269
APA StyleZhang, H., Zhang, S., Chen, X., Li, Y., Zou, Y., & Zeng, Y. (2024). Characterization of Multi-Layer Rolling Contact Fatigue Defects in Railway Rails Using Sweeping Eddy Current Pulse Thermal-Tomography. Applied Sciences, 14(16), 7269. https://doi.org/10.3390/app14167269