Article

Adsorption Separation of Various Polar Dyes in Water by Oil Sludge-Based Porous Carbon

School of Materials Science and Engineering, Xi’an University of Science and Technology, Xi’an 710054, China
*
Author to whom correspondence should be addressed.
Appl. Sci. 2024, 14(16), 7283; https://doi.org/10.3390/app14167283
Submission received: 28 July 2024 / Revised: 12 August 2024 / Accepted: 15 August 2024 / Published: 19 August 2024
(This article belongs to the Section Green Sustainable Science and Technology)

Abstract

:
The pollution caused by printing and dyeing wastewater is increasingly severe, posing significant harm to aquatic plants and animals. In this study, porous carbon was synthesized via the high-temperature pyrolysis of light and heavy organic matter present in oily sludge, utilizing low oil content sludge as the raw material and zinc chloride as a chemical activator. The results exhibited a significant increase in the specific surface area of the oily sludge-based porous carbon, from 4.95 m²/g to 10.95 m²/g. The effects of various parameters such as pH, amount of sorbent, dye concentration, temperature, and contact time on dye removal have been studied. The results showed that the oil sludge-based porous carbon exhibited high efficiency in removing Malachite Green from aqueous solutions, which has low polarity and remains consistently above 97%. The removal rate of Crystal Violet, which is more polar, was as low as 24.14%. The corresponding adsorption capacities were 33.41 mg/g for Malachite Green, 16.41 mg/g for Crystal Violet, and 13.56 mg/g for Methylene Blue. The adsorption capacity of OSC700 for three types of dyes was characterized by monolayer adsorption, primarily driven by chemical adsorption, with significant contributions from electrostatic and hydrophobic effects. The adsorption process was spontaneous, exothermic, and accompanied by an increase in entropy. For less polar substances, the adsorption on oily sludge-based porous carbon is primarily driven by aromatic functional groups on the carbon surface, hydrophobicity, π-π electron-donor-acceptor (π-π EDA) interactions, and surface hydrogen bond formation. In contrast, for more polar dyes, electrostatic and hydrophobic interactions dominate, with electrostatic adsorption being the predominant mechanism and minimal hydrogen bond formation during adsorption.

1. Introduction

Oily sludge (OS) is a typical solid waste generated in the petroleum processing industry during various stages, including extraction, transportation, storage, and refining [1]. However, with China’s increasing demand for crude oil, the annual production of oily sludge is projected to exceed 6 million tons by 2024, accounting for an estimated 3.15% of the total output, culminating in a historical inventory of approximately 143 million tons [2]. Generally, OS contains harmful pollutants such as heavy metals, polycyclic aromatic hydrocarbons, and oily compounds [3,4]. The accumulation of OS is not only limiting the development of the petroleum and petrochemical industries but also harmful to the environment [1,5]. Dyes in wastewater have become a significant source of water pollution due to the textile, paper, and printing industries [6]. When released into the environment, organic dyes have various harmful effects on humans and aquatic organisms, and the biodegradation process is slow and complex, releasing possible carcinogenic products [7]. Therefore, treating and utilizing OS is a key issue for the petroleum processing industry to address.
The commonly employed harmless treatment methods for OS include solvent extraction [8], ultrasonic irradiation [9], incineration [10], stabilization/solidification [11], and biodegradation [12,13]. However, these technologies are limited by large land requirements, high costs, leakage, and air pollution, which hinder their development and adoption. Porous carbon (C) is a promising adsorbent material due to its high specific surface area and abundance of functional groups [14,15,16]. It has been successfully utilized to adsorb various pollutants, including bisphenol A [17], phenol [18], Cr-(VI) [14,15], Pb(II) [16], Cd(II) [19,20], phosphates [21], organic dyes [22,23], and antibiotics [24]. Therefore, preparing oily sludge-based porous carbon (OSC) is an effective strategy for harmless treatment and resource utilization of OS.
Compared to expensive activated C and other porous C materials, OSC is a more economical and environmentally friendly option [25]. However, OS lacks active functional groups, which are essential adsorption sites, thereby limiting the adsorption properties of the as-prepared OSC [17]. Typically, activating agents such as ZnCl2, H3PO4, and KOH are used to activate C-based materials, enhancing their surface area, porosity, and functional groups [26]. For instance, Mohammadi et al. [14] activated OS with KOH, achieving a remarkable 97.36% removal rate for Cd ions. Similarly, Han et al. [1] synthesized a novel pyrolyzed carbon (PC) by catalytically pyrolyzing OS with phosphoric acid at 411 °C for 59 min. The results demonstrated that the prepared PC exhibited excellent hierarchical porous properties and a high adsorption capacity for methylene blue (MB) of 322.89 mg/g. Similarly, Mojoudi et al. [18] prepared high-performance activated C with a microporous structure by activating OS with KOH, achieving a BET specific surface area of 2263 m2·g−1, total pore volume of 1.37 cm3·g−1, micropore volume of 1.004 cm3·g−1, and a phenol removal rate of 87.8%. The adsorption process was found to be spontaneous and exothermic. Moreover, ZnCl2 is widely used as a chemical activator due to its effectiveness in producing a larger specific surface area [27].
Acharya et al. [28] examined the adsorption efficiency of ZnCl2-activated carbon derived from tamarind wood for removing Cr (VI) from water. The study revealed a maximum adsorption capacity of 28.019 mg/g, with the adsorption process being governed by a combination of pore diffusion, film diffusion, and particle diffusion. The results indicated that the adsorption was feasible, spontaneous, and endothermic, suggesting that activated tamarind wood is a viable material for effective Cr (VI) removal from aqueous solutions.
The textile, paper, and printing industries have made dyes in wastewater a significant contributor to water pollution [6,29]. When released into the environment, organic dyes can have a range of harmful effects on both human health and aquatic organisms. Moreover, the biodegradation process of these dyes is slow and complex, leading to the release of potential carcinogens. Guo et al. [30] successfully synthesized a layered MOF, [Cd(H2L)(BS)2]n·2nH2O (L-MOF-1, H2L = N1,N2-bis(pyridin-3-ylmethyl)ethane-1,2-diamine, BS = benzenesulfonate), which exhibited stability in both acidic and basic environments. Notably, the L-MOF-1 adsorbent demonstrated a remarkable adsorption capacity for CR, reaching approximately 12,000 mg/g within a mere 20 min. Huang et al. [31] successfully synthesized organobentonite by replacing the exchangeable Na+ ions in Na-bentonite (Na-Bt) with cetyltrimethylammonium bromide (CTAB). They then conducted a thorough investigation into its adsorption behavior as a highly effective adsorbent for dye removal. The results showed that the maximum adsorption capacities for RhB and Acid Red 1 were 173.5 mg/g and 157.4 mg/g, respectively. These values were achieved at a temperature of 30 °C, with pH levels of 9 and 8, and an initial concentration of 300 mg/L.
David et al. [32] developed a simple and eco-friendly one-pot method for synthesizing silver nanoparticles, utilizing bioactive components from Viburnum opulus fruit extracts as reducing and stabilizing agents. The researchers then tested the catalytic efficiency of these AgNPs for the degradation of three harmful organic dyes including carmoisine, tartrazine, and vivid blue FCF. All the dyes tested exhibited excellent effectiveness and remarkable catalytic activity in degrading vivid blue FCF. While various adsorbents have demonstrated successful dye removal from water, their practical applications are limited by high raw material costs and complex production processes, which limit their scalability and feasibility.
This study involves the activation of OS using ZnCl2, followed by the preparation of a series of OSC (OSC500, OSC700, and OSC900) through ZnCl2 activation at high temperatures. The phase structures and morphologies of these materials were characterized, and their adsorption properties were investigated for polar dyes. The adsorption models and mechanisms were also proposed. The ultimate goal of this research is to develop a method for designing and optimizing novel adsorbent materials with enhanced selectivity and adsorption capacity.

2. Materials and Methods

2.1. Raw Materials and Preparation of OSC

The OS was obtained from Shengli Oilfield, with a C content of 7.92%. The composition of the OS is shown in Table 1 and was measured by X-ray Fluorescence Spectrometer. Zinc chloride (ZnCl2, AR grade) was selected as the activating agent, sourced from Tianjin Kermel Chemical Reagent Co., Ltd., Tianjin, China.
The OS was first dried in an oven at 105 °C for 24 h. Then, the dried OS was ground and sieved through an 80-mesh sieve. Next, the sieved OS and ZnCl2 solution (2 mol/L) were mixed in a 1:1 mass ratio. The resulting mixture was then oscillated in a thermostatic shaker at 30 °C and 150 rad/min for 36 h. Then, the mixture was dried again at 105 °C for 24 h. The as-dried mixture was carbonized in a tubular furnace under a N2 atmosphere. The carbonization temperatures were 500 °C, 700 °C, and 900 °C, with a 2 h hold at each temperature. Finally, the as-carbonized samples were washed with secondary deionized water to remove any residual ZnCl2 and impurities, and then dried at 105 °C for 24 h to obtain OSC samples, designated as OSC500, OSC700, and OSC900, corresponding to their respective carbonization temperatures. Samples activated at 700 °C only, without the addition of a zinc chloride activator, are called NOSC.

2.2. Characterization Methods of OSC

A thermogravimetric analyzer (Netzsch, Selb, Germany) was used to determine the mass loss curve of the samples over a temperature range of room temperature (RT) to 1000 °C. The crystal structures of the OSC samples were investigated using X-ray diffractometer (BRUKER, Berlin, Germany) equipped with Cu Kα radiation. The XRD data were collected in continuous scan mode, scanning from 10° to 90° at a rate of 2°/min. Functional group information of the OSC samples was obtained using a Fourier transform infrared spectrometer (Thermo Scientific Nicolet, Waltham, MA, USA), employing the KBr pellet method. The FTIR spectra were collected at a resolution of 4 cm−1, spanning a range of 400 to 4000 cm−1. The morphologies of the as-prepared samples were examined using scanning electron microscopy (Carl Zeiss, Oberkochen, Germany). The surface elemental composition and ionic states of OSC were determined using X-ray photoelectron spectroscopy (Thermo Scientific Nicolet, Waltham, MA, USA). The adsorption/desorption isotherms of OSC were performed using a nitrogen adsorption/desorption isotherm tester (Micromeritics, Norcross, GA, USA). The adsorbed gas was N2, which was degassed at 120 °C for 7 h. The correlation between the Zeta potential of OSC and the migration rate was determined using a Zeta potential analyzer (Malvern Instruments Ltd., Malvern, UK). The adsorption properties of OSC were characterized using a UV-vis spectrophotometer (Shanghai Youke Instrumentation Co., Shanghai, China), with a scanning wavelength range of 190–1100 nm and an absorbance range of 0.0–3.0 Abs.

2.3. Batch Adsorption Experiment

The effects of adsorbent dosage, adsorption time, adsorption temperature, and pH on the adsorption performance of the coal materials were further investigated in this study through batch adsorption experiments. Specifically, different adsorbent dosages, adsorption temperatures, Malachite Green (MG), Methylene Blue (MB), and Crystal Violet (CV) concentrations, and reaction pH were set in this study, ranging from 0.1 to 0.6 g, 5 to 240 min, 25 to 55 °C, 10 to 200 mg/L, and 2 to 10, respectively. Specifically, the adsorbents were added to 50 mL of MG, MB, and CV standard solutions (100 mg/L) in 100 mL brown conical flasks at the different dosages. The mixtures were then thoroughly stirred using a constant temperature shaking incubator at 150 rpm and 25 °C for 120 min. Afterward, the mixtures were filtered using a 0.45 µm syringe filter. The absorbance values of MG, MB, and CV in the supernatants were determined using a UV-vis spectrophotometer (Shanghai Youke Instrumentation Co., Shanghai, China) at wavelengths of 617 nm, 665 nm, and 554 nm. The MG, MB, and CV concentrations in the solutions were calculated using MG, MB, and CV standard curve equations. These measurements were used to determine the removal and adsorption efficiencies. The collected data were plotted and used for further analysis.

2.4. Calculation of the Dipole Moments for Organic Dyes of Different Polarities

Dipole moment is an important attribute of a molecule, reflecting the extent of its polarity. The larger the dipole moment, the greater the polarity of the molecule. Using the Gaussian 09 program, the B3LYP/6-311g* method is applied to optimize the geometric structures of malachite green, crystal violet, and methylene blue molecules. Furthermore, the Multiwfn 3.3.7 program is utilized to calculate ADCH charges and bond dipole moments, as shown in Equation (1).
The bond dipole moment is a vector quantity, with its direction going from the center of positive charge to the center of negative charge along the direction of the bond. The basic formula can be applied to the situation of charges on multiple atoms. In the Hirshfeld method [33], the formula for calculating the molecular dipole moment can be expressed as (2).
The general formula for calculating dipole moments is: the dipole moments calculated using Hirshfeld charges tend to be less than the actual situation. According to the method proposed by Lu and Chen [34], a correction is applied through atomic dipole moments. Therefore, the final method employed is based on the Hirshfeld population (ADCH) method formula, as shown in Equations (3) and (4).
μ b = q × r
μ = A μ A + A q A · r A
μ A = B q A B r B
q A = B q B A q A ·
where, q represents the atomic charge, and r denotes the bond length; μ A is the dipole moment of atom A; q A · represents the Hirshfeld charge; r A q A · corresponds to the vector radius; q A B refers to the correction charge generated by the dipole moment of atom A on atom B. The ADCH charge takes into account the atomic dipole moments, providing a good reproduction and correction for the calculated dipole moments of molecules [35].

2.5. Modeling of the Adsorption Isotherms

The removal efficiency (η) and equilibrium capacity (qe, mg/g) of the three organic dyes were calculated using Equations (5) and (6). The adsorption kinetics were simulated using Equation (7) through (9); the adsorption isotherm model was simulated using Equations (10) and (11); the constant separation factor was calculated using Equation (12) and the separation factor was calculated using Equation (13); Thermodynamic modeling was carried out using Equation (14) to (15) [36,37]:
R e m o v a l e f f i c i e n c y   % : η = C 0 C e C o × 100
A d s o r p t i o n c a p a c i t y : q e = ( C 0 C e ) × V m
P s e u d o f i r s t o r d e r   m o d e l   P F O : q t = q e 1 e k 1 t
P s e u d o s e c o n d o r d e r   m o d e l   P S O : q t = k 2 q e 2 t 1 + k 2 q e t
I n t r a   p a r t i c l e d i f f u s i o n : q t = k p t 0.5 + C
a n g m u i r   e q u a t i o n : q e = q m K L C e 1 + K L C e
F r e u n d l i c h   e q u a t i o n : q e = K F C e 1 n
C o n s t a n t   s e p a r a t i o n   f a c t o r : R L = 1 1 + K L C 0
K e = ( C 0 C e ) C e × V m
G 0 = R T ln K e
G 0 = H 0 T S 0
where C0 and Ce (mg/L) denote the initial and equilibrium Pb2+ concentrations, respectively; V (L) denotes the solution volume; m (g) is the adsorbent dose; qt (mg/g) denotes the adsorbed Pb2+ amount by the CG, CGPC, and PAC-CGPC materials at time t (h); k1 (h−1) and k2 [g/(mg·h)] are the rate constants of the PFO and PSO models, respectively; qm (mg/g) denotes the maximum adsorption capacity; KL (L/mg) is the Langmuir isotherm constant; KF [(mg/g)(mg/L)n] is the Freundlich adsorption affinity coefficient; 1/n denotes the adsorption intensity of the Freundlich isotherm. 1/n < 0, 0 < 1/n < 1, 1/n > 1 indicate irreversible, favorable, and unfavorable adsorption, respectively; R (8.314 J·mol−1·K) is the ideal gas constant; T (K) denotes the absolute temperature; K is the adsorption partition coefficient.

3. Results

3.1. Microstructure Analysis

3.1.1. Thermogravimetry-Differential Scanning Calorimetry, X-ray Diffraction and Fourier-Transform Infrared Spectroscopy Analysis

The pyrolysis TG and DTG curves of OS are shown in Figure 1a, demonstrating a four-stage thermal activation process. Stage 1 (117 °C to 385.7 °C) is attributed to water evaporation, characterized by a significant mass loss peak of 3.5%. Stage 2 (385.7 °C to 603 °C) and Stage 3 (603 °C to 818 °C) represent the primary pyrolysis reactions, where light organic components are initially vaporized, followed by the cracking of heavy organic components into low molecular weight gases and oil products, resulting in a cumulative mass loss of 8.2%. Finally, Stage 4 (818 °C to 1000 °C) involves the condensation reactions of coke residue and the decomposition of inorganic minerals within the matrix.
Figure 1b displays the XRD patterns of OS, NOSC (OSC without activation), and OSC700. The XRD analysis reveals that the OS is composed of SiO2, calcite (CaCO3), and albite (Na2O·Al2O3·6SiO2), as reported in previous studies [38,39]. Notably, the SiO2 phase remains present in NOSC even after heat treatment at 700 °C for 2 h, as seen in the XRD patterns of NOSC and OSC700. Particularly in the case of the OSC activated with ZnCl2, the XRD peak at 26.6° is broadened, indicating that the activated C exists in an amorphous form with a disordered layer structure. It has been reported that ZnCl2 acts as a strong dehydrating agent, promoting the decomposition of organic matter in OS at high temperatures and the formation of porous structures during carbonization [40]. Furthermore, the dehydration caused by ZnCl2 also increases the amount of amorphous C, leading to a broader XRD peak.
The FTIR absorption spectra of OS and OSC700 are presented in Figure 1c. As shown by the OS spectrum (red line), a broad absorption peak at 3420 cm−1 is observed, attributable to O–H stretching vibration absorption in OS. Additionally, peaks at 1430 cm−1 and 1640 cm−1 correspond to aliphatic C–H and aromatic C=C vibrations, respectively [14,18]. The peak at 1440 cm−1 is attributed to the asymmetric deformation vibration of methyl carbon. A strong peak at 1020 cm−1 is assigned to Si-O and Si-O-Si stretching vibrations, which arises from the overlapping absorption bands of minerals such as quartz, calcite, and albite [41]. The peak at 776 cm−1 is attributed to the out-of-plane deformation vibration of C–H in a benzene ring substituted with five adjacent H atoms [14]. Furthermore, the absorption peaks in the range of 872 cm−1 to 471 cm−1 indicate the presence of silica and silicates [41]. In contrast, the FTIR absorption spectrum of OSC700 (purple line in Figure 1c) shows a significant enhancement in the intensity of aliphatic C-H vibrations (~3420 cm−1). The reason can be attributed to the formation of numerous hydrocarbon substances, such as alcohols and phenolic hydroxyl groups, during the high-temperature pyrolysis process of light and heavy organic materials. Meanwhile, the aromatic C=C skeletal vibration peak, observed at 1640 cm−1, is also intensified. This enhancement is attributed to the formation of a C network structure on the surface, which occurs during the calcination and pyrolysis process of both light and heavy organic matter present in the sludge. The formation of the C network structure leads to an increase in C=C content, resulting in an intensification of the C=C skeletal vibration peak [42]. This finding is consistent with the XRD pattern. Notably, new absorption peaks emerge at 465 cm−1, 618 cm−1, 990 cm−1, and 1075 cm−1, respectively. Specifically, the peak at 465 cm−1 is characteristic of ZnO in OSC [43]. The absorption peaks at 1075 cm−1 and 618 cm−1 correspond to the vibration of Al-O bonds [44], while the peak at 990 cm−1 is attributed to the vibration of Si-O-Si structures [17,45]. These results indicate that, following calcination and ZnCl2 activation, the surface of OSC700 is enriched with hydroxyl groups and carbon network structures. These functional groups facilitate the formation of hydrogen bonding and π-π EDA interactions, which enhances the removal of MG, CV, and MB, thereby improving the removal rate.

3.1.2. Specific Surface Area and Pore Size Distribution Analysis

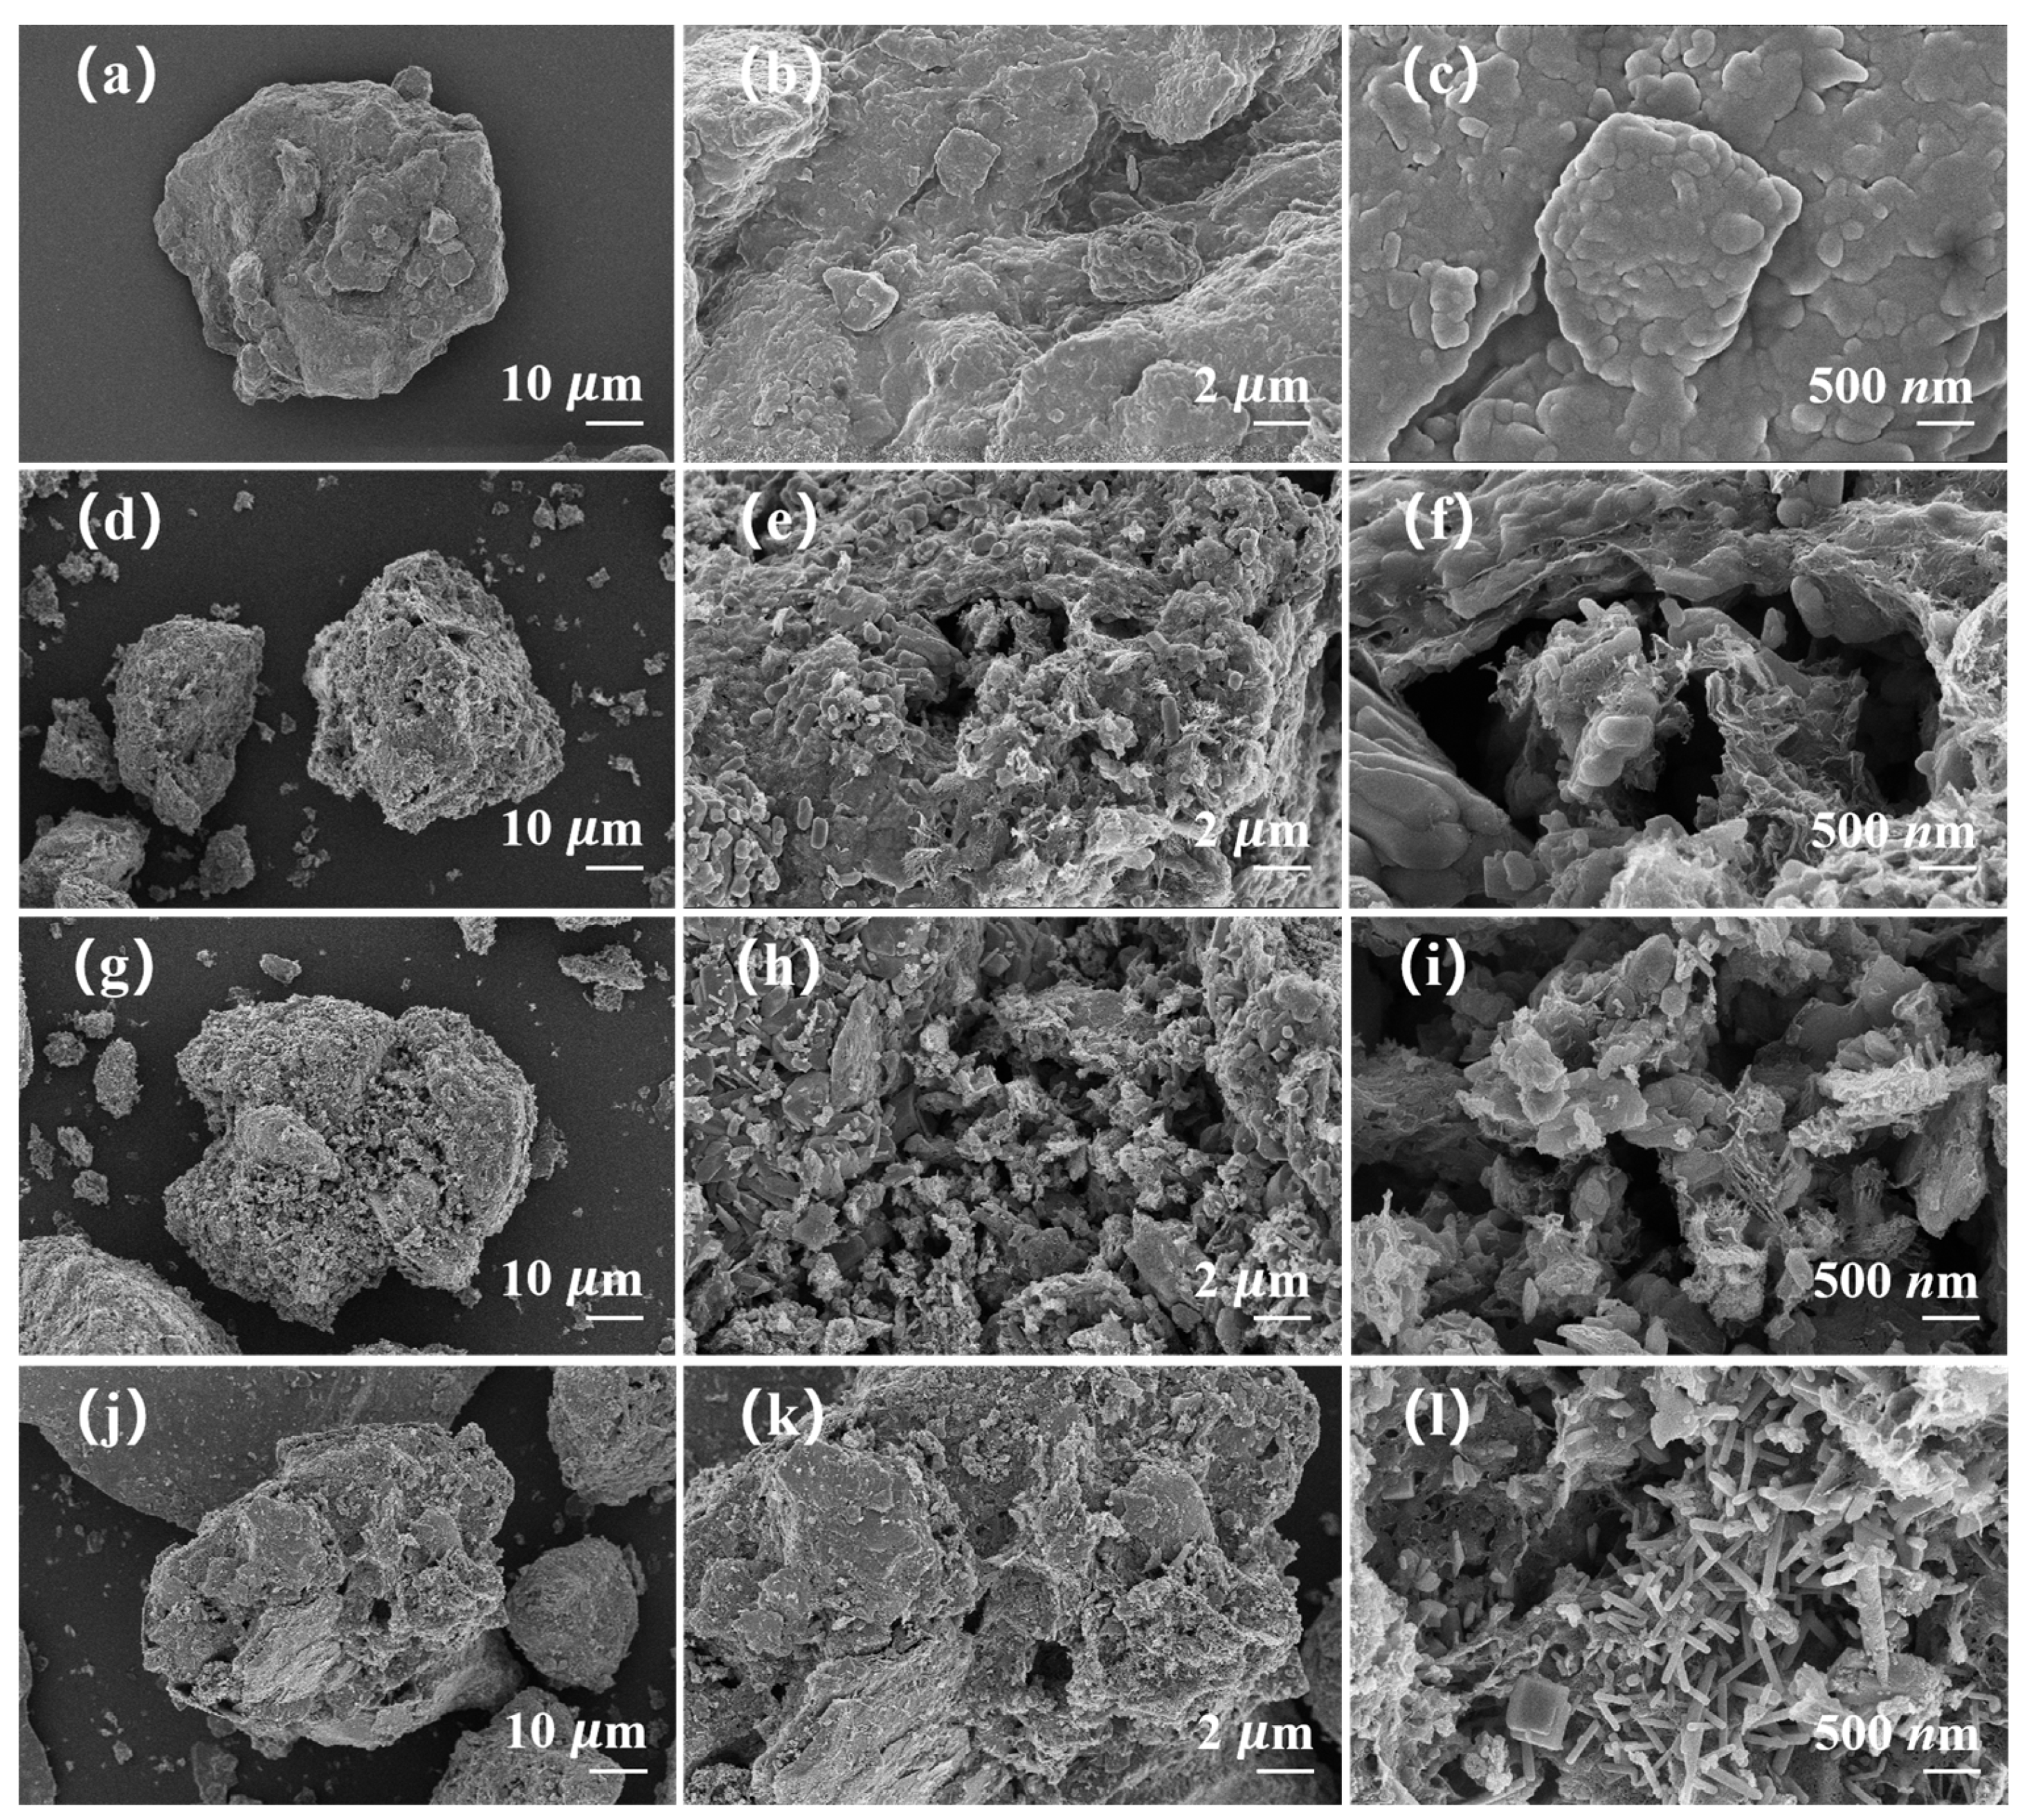
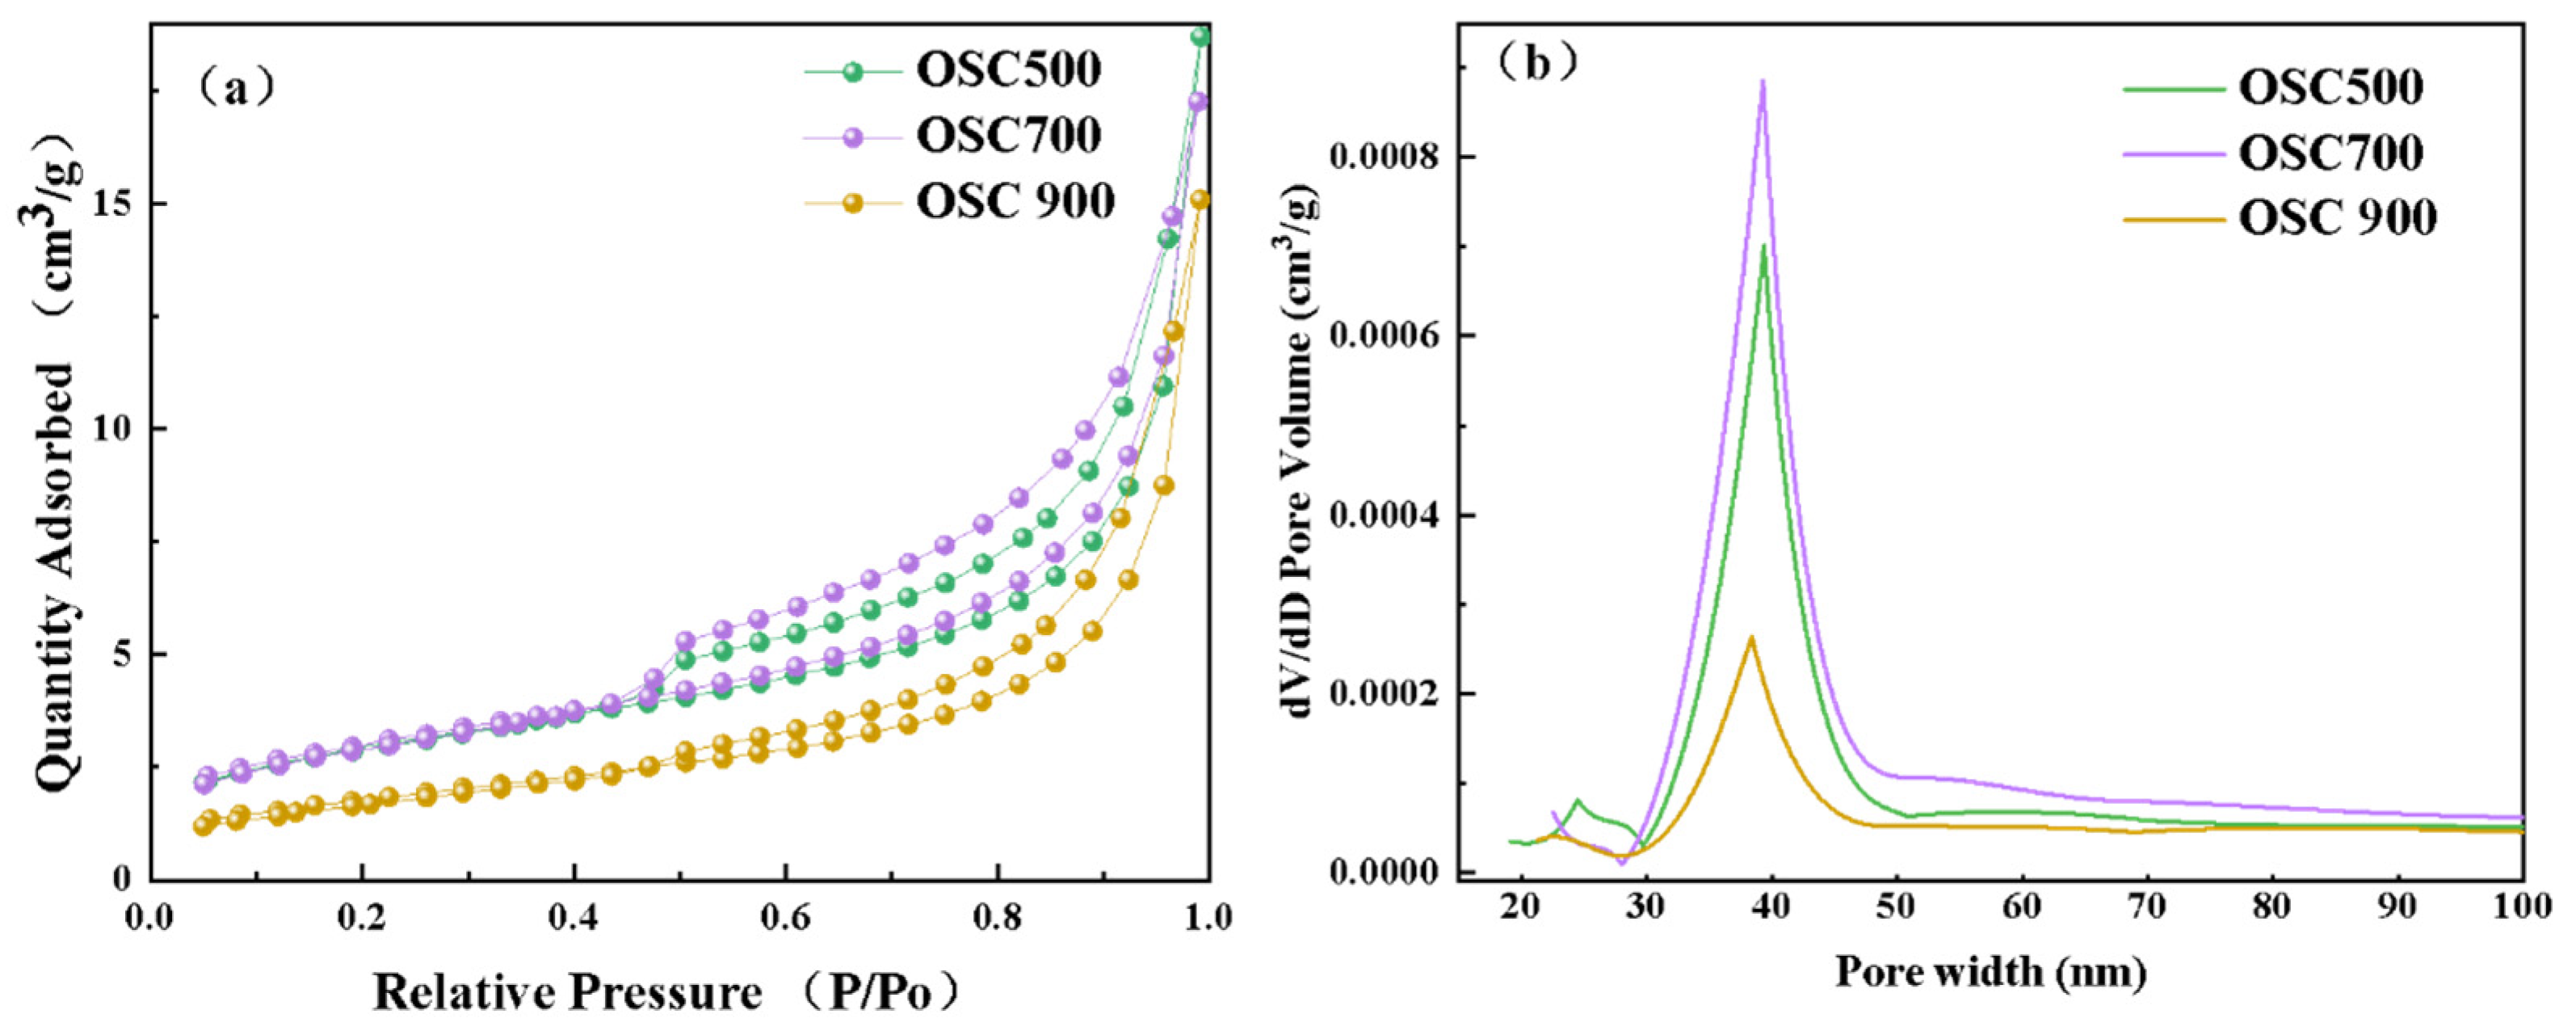
The nitrogen adsorption isotherm curves for OSC500, OSC700, and OSC900 are presented in Figure 2. These curves exhibit a type IV profile, characteristic of materials with a mesoporous structure. The pore size distribution is centered around 40 nm, consistent with the SEM images shown in Figure 3. As shown in Table 2, both the adsorption capacity and specific surface area initially increase, followed by a subsequent decrease. This pattern can be explained by the volatilization and decomposition of light and heavy organic chemicals in the oily sludge at 500 °C, resulting in the formation of holes on the particle surface. At 700 °C, ZnCl2 facilitates the carbonization of organic matter, which deposits onto the carbon framework, significantly increasing the material’s specific surface area. However, at 900 °C, the material undergoes substantial pore collapse due to the thermal degradation of some minerals, leading to a decrease in both the specific surface area and nitrogen adsorption capacity.

3.1.3. Morphological Analysis

The morphologies of OS, OSC500, OSC700, and OSC900 are displayed in Figure 3. The OS surface is smooth and dense, with no observable pores in it (Figure 3a–c). After carbonization at 500 °C, the OSC500 surface becomes rough and develops a flocculent network structure with tiny pores (Figure 3d–f). When the carbonization temperature is increased to 700 °C, the surface roughness further increases, and the pore diameter enlarges (Figure 3g–i).
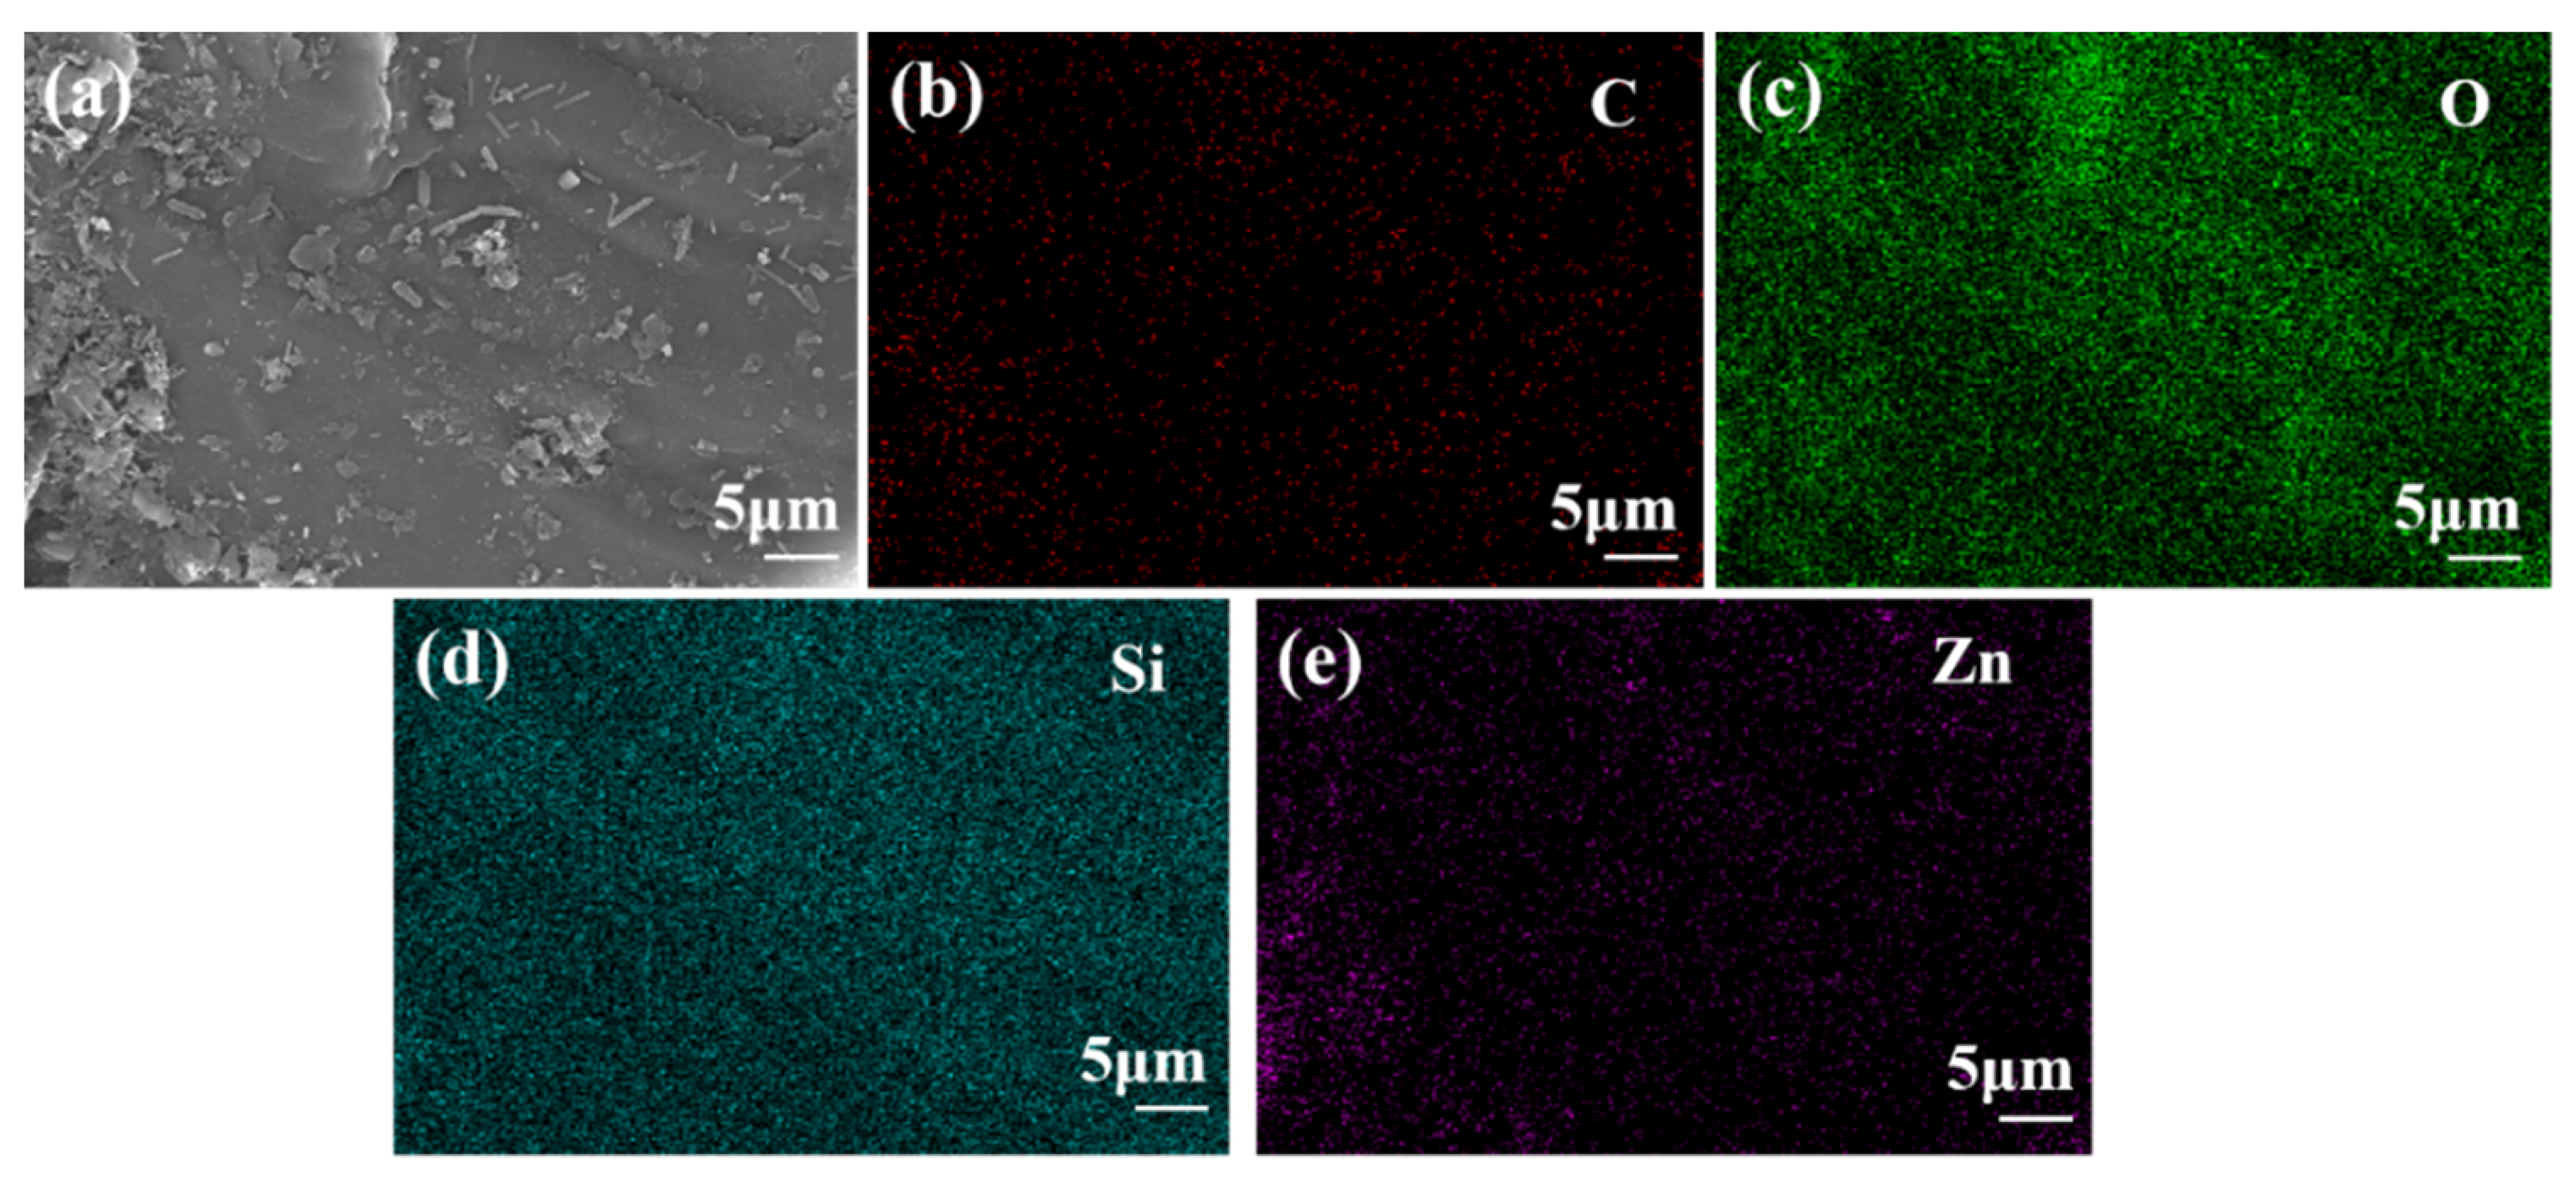
Upon completion of ZnCl2 gasification at 700 °C, ZnCl2 molecules were impregnated into the carbon interior, serving as a backbone for the carbon polymer deposited during carbonization. Subsequent washing with hot water removed Zn2+, producing a large number of new pores, increasing defects in the C network, and enhancing the specific surface area, thereby contributing to the overall surface roughness of the particles [44,45,46]. Figure 4 and Figure 5 also illustrate the synergistic binding of Zn with the C matrix. EDS tests were performed on the OSC700 surface Figure 4a, and the results are shown in Figure 4b–e.
Figure 3i also reveals that the deposited C combines with the original surface in a networked and flocculent manner, forming numerous bumps, pits, and wrinkles that provide additional adsorption sites for the adsorption process. However, carbonization at 900 °C (Figure 3j–l) significantly reduces the number of surface pores and increases the pore size. This phenomenon occurs because some inorganic minerals begin to decompose at 900 °C, causing the collapse of pore channels and the enlargement of pore sizes. The EDS diagram of OSC700 is shown in Figure 4. It can be seen that OSC700 is mainly composed of Si and O elements. Doping of Zn elements and deposition of C elements, i.e., porous carbon, appeared on its surface after calcination at 700 °C with the addition of ZnCl2. It can be seen from (b) and (e) that the appearance of the C element and the Zn element are two simultaneous appearances, which indicates that the nascent carbon is combined with the compounds of Zn.

3.1.4. X-ray Photoelectron Spectroscopy Analysis

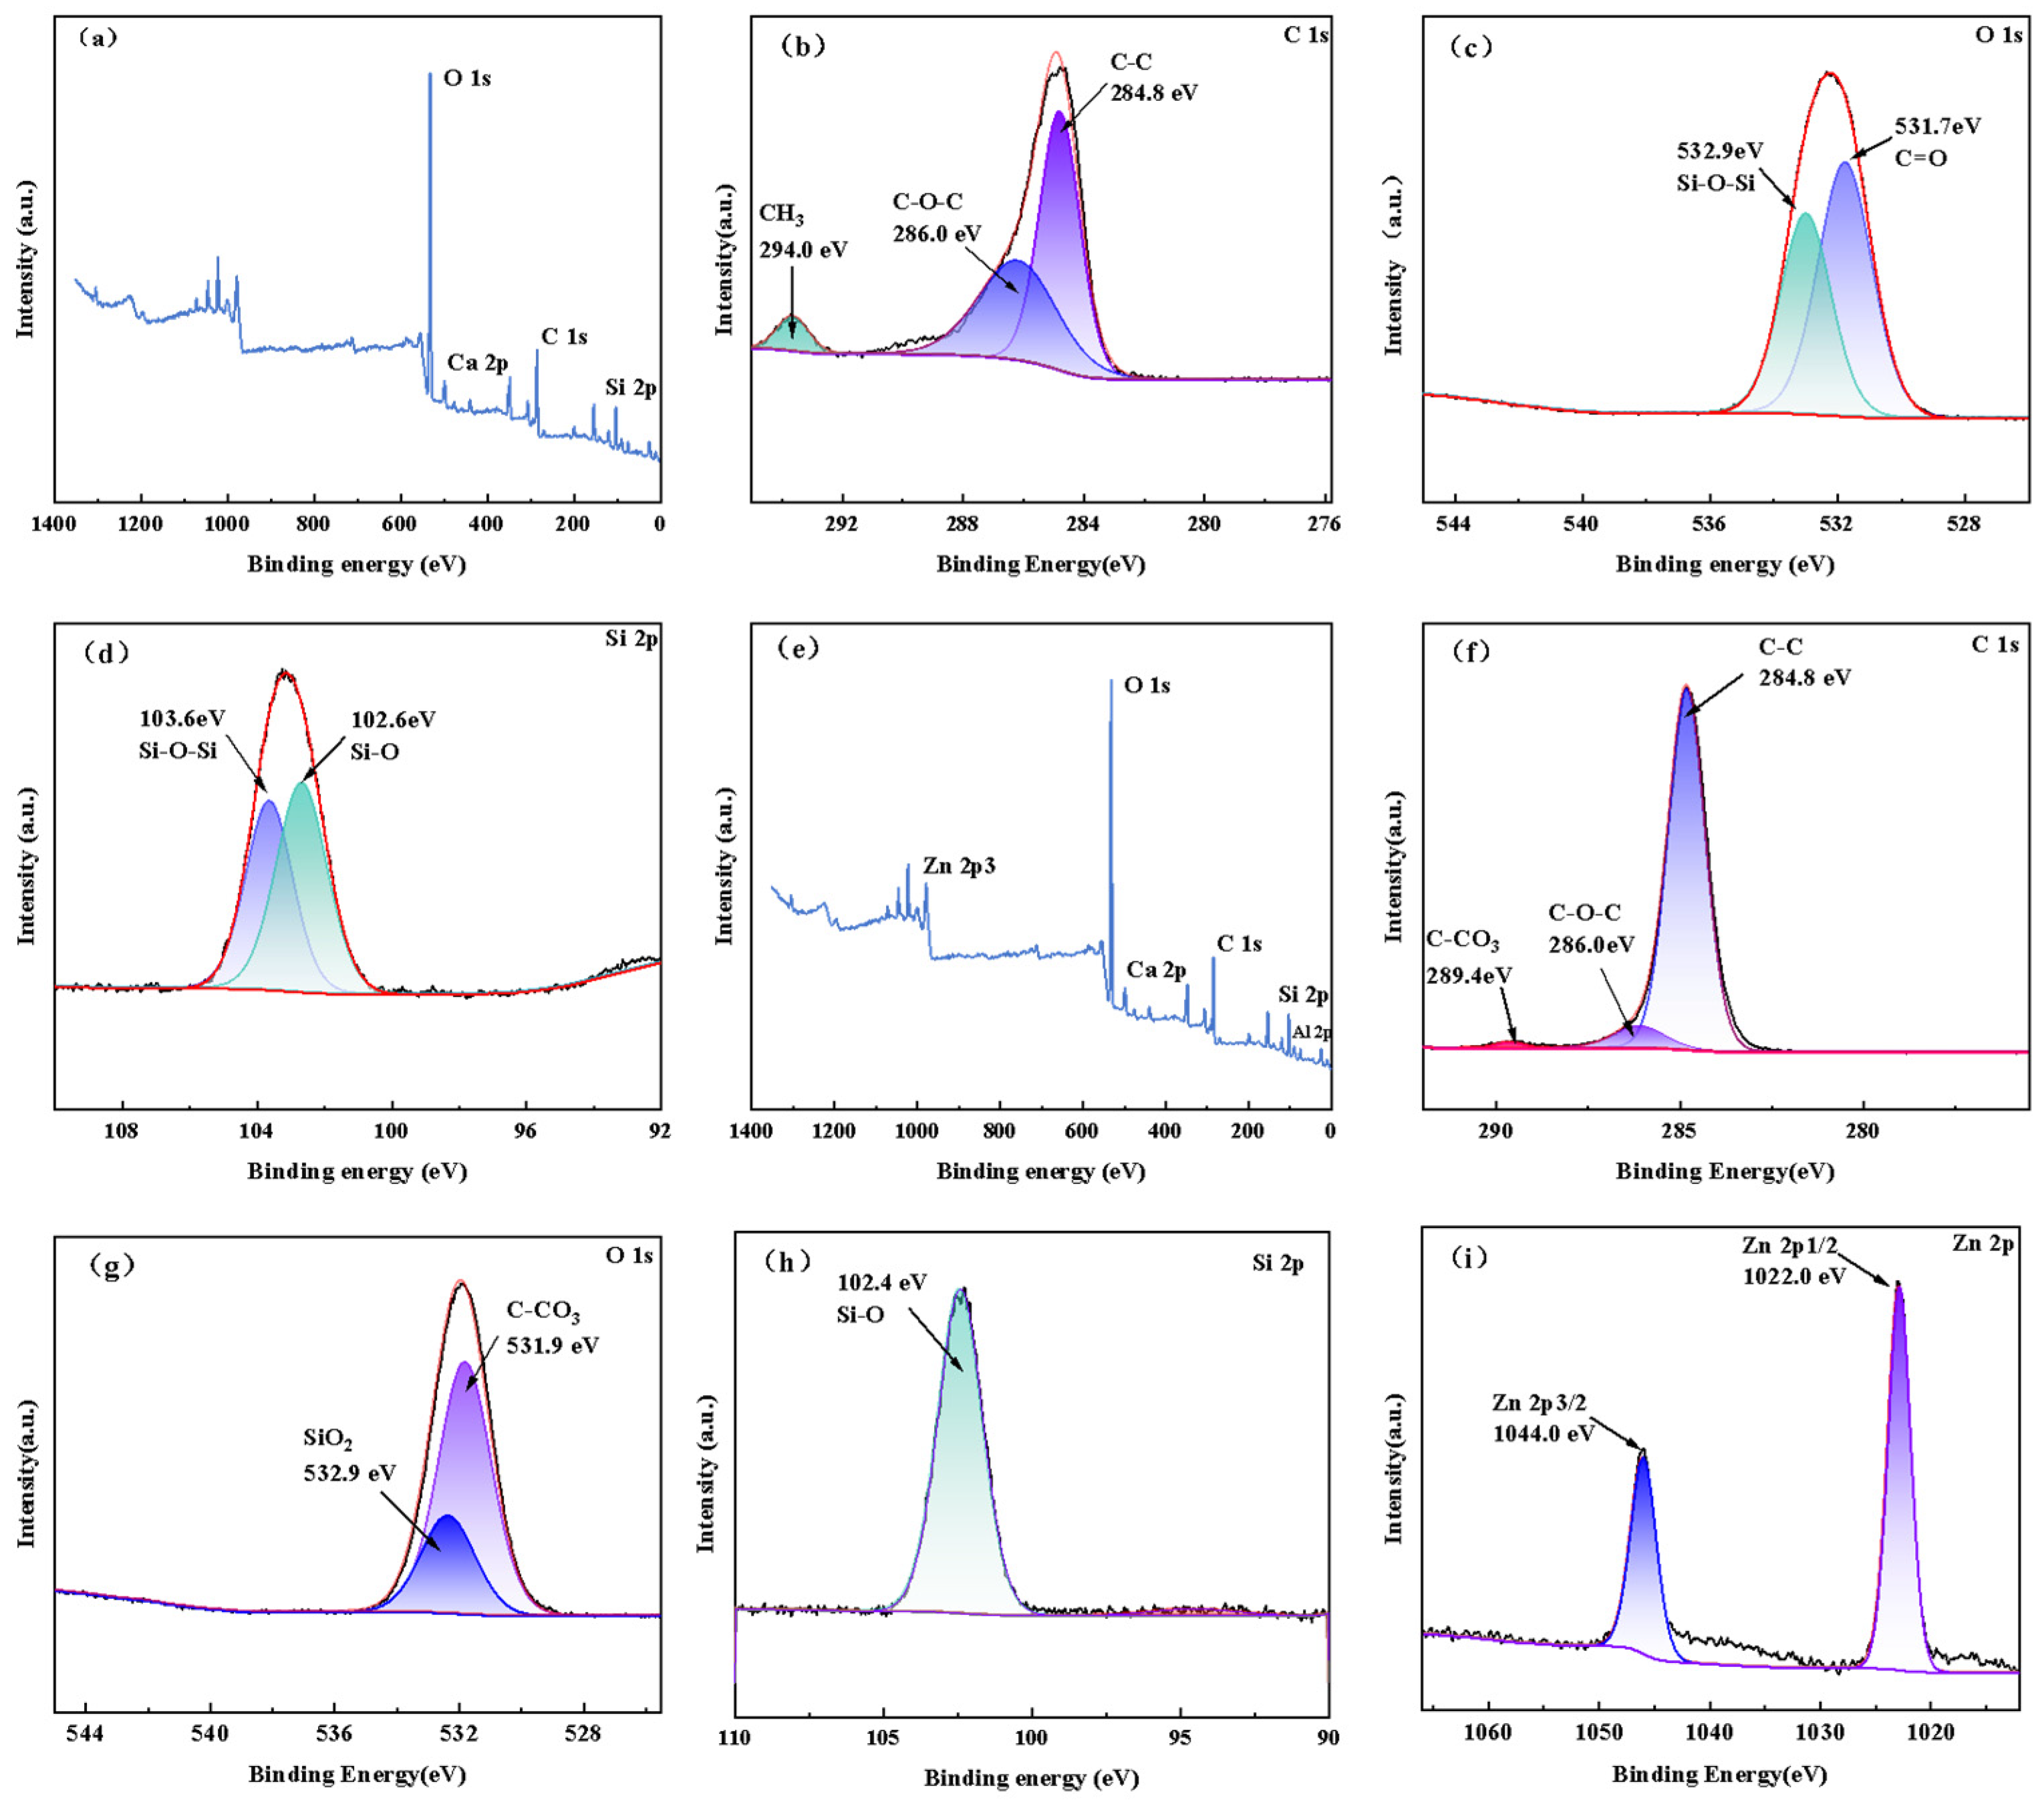
A comparison of Figure 5a–d and Figure 5e–i reveals that carbon (C) exists in two forms in the oil sludge (OS). The binding energies of carbon are 284.8 eV (C-C) and 286.0 eV (C-O-C) [46], as shown in Figure 5b. The C 1s spectrum (Figure 5f) indicates that carbon exhibits three types of binding states: C-C/C=C, C-O-C, and C-CO3 [47], with the C-C bond being the predominant form. After thermal activation with ZnCl2, a substantial carbon network forms on the surface of OSC700, consistent with the results shown in Figure 3.
In the OS, the binding energy of oxygen is 531.7 eV (C=O) [48], which shifts to 531.9 eV after ZnCl2 thermal activation, corresponding to the formation of metal carbonates. This shift is primarily attributed to the synergistic binding of Zn with the carbon matrix. The silicon elements in the oily sludge primarily exist in the forms of Si-O (102.6 eV) and Si-O-Si (103.6 eV) [49] (Figure 5d), which shift to Si-O (102.4 eV) in the form of quartz [49] (Figure 5i). The activation process enhances the surface activity and porosity of the material, leading to improved adsorption performance. The binding energies of zinc are detected at 1022.0 eV (Zn 2p3/2) and 1044.0 eV (Zn 2p1/2), with no Zn LMM peak observed, indicating that Zn is fully covered by the carbon layer [50].
In conclusion, the optimal preparation temperature for porous materials derived from oil sludge is 700 °C. The resulting OSC700 exhibits the largest specific surface area and total pore volume, with a relatively uniform pore size distribution. The use of ZnCl2 as an activator at this pyrolysis temperature enhances pore formation.

3.2. The Adsorption Properties of OSC for Organic Dyes

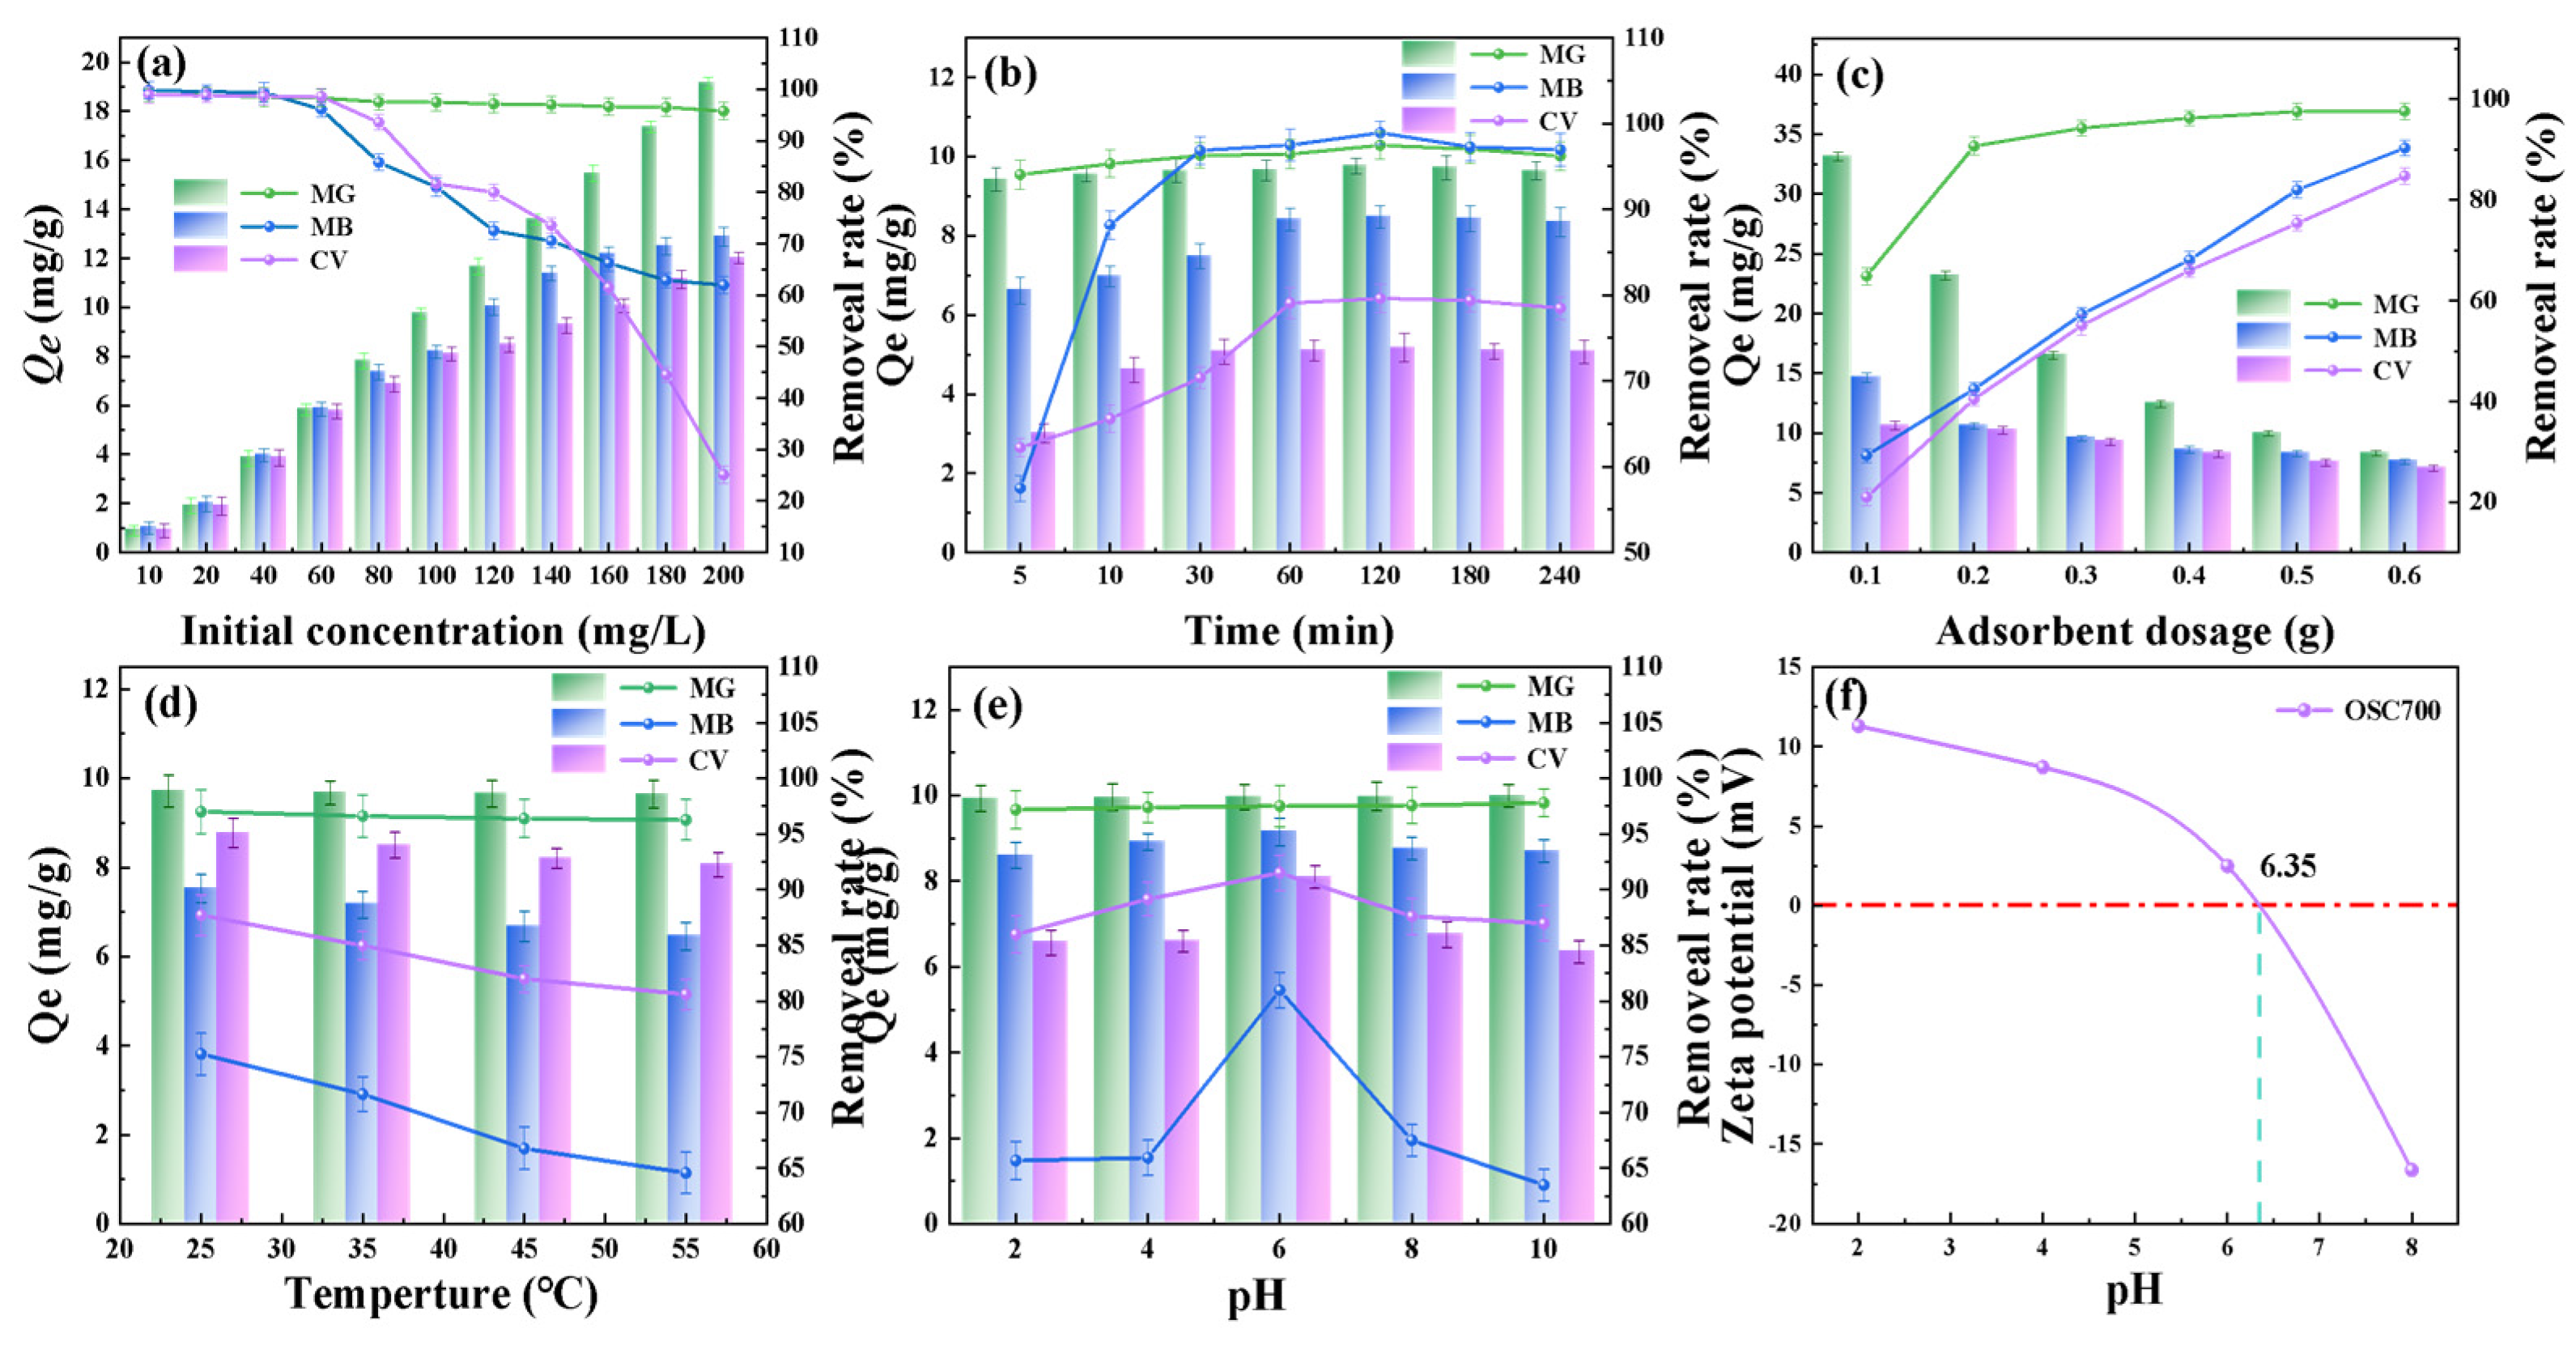
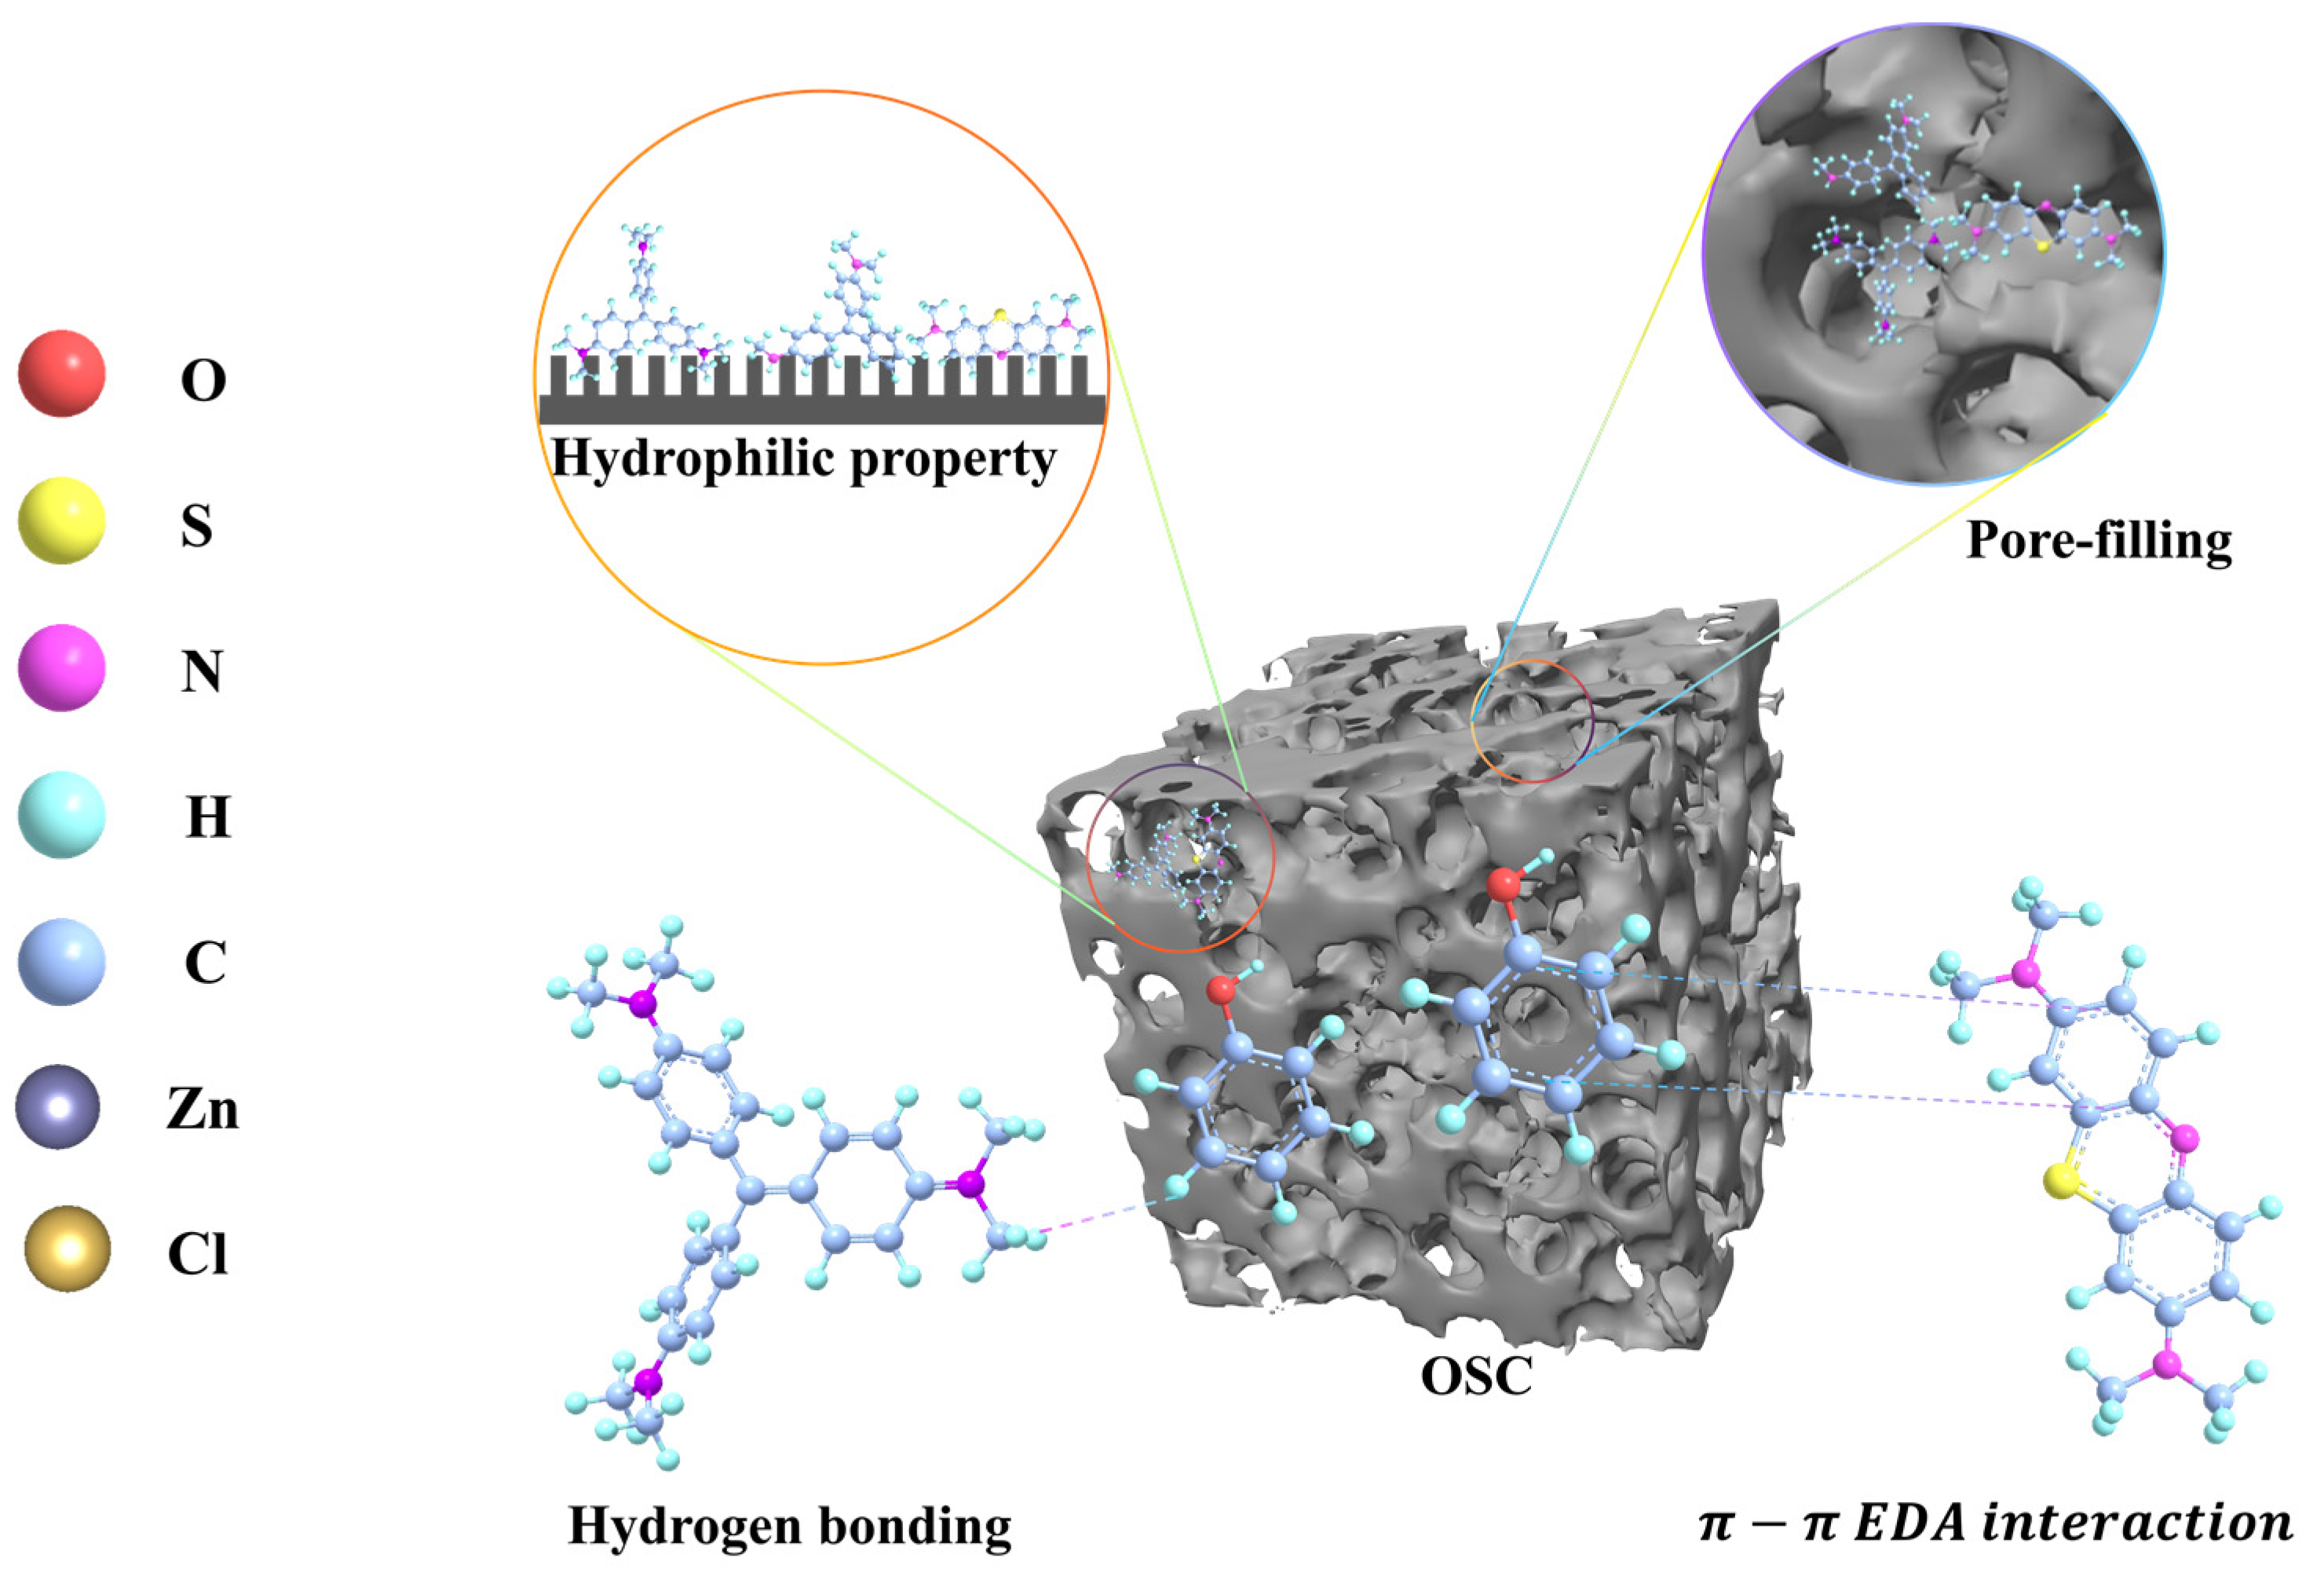
Figure 6a shows the effect of varying initial concentrations of adsorbates on the adsorption efficiency of OSC700. As shown, the adsorption capacity of OSC700 for the three organic dyes increases with increasing concentration. The adsorption capacity also varies depending on the type of dye, with MG exhibiting the highest capacity and CV the lowest. This is because the polarity of the three organic dyes increases in the order of MG < MB < CV (Table 3). The weaker the polarity, the stronger the hydrophobic interaction and π-π EDA interactions between the organic dyes and the adsorbent, resulting in a higher removal rate. The adsorption mechanism of organic dyes by OSC is illustrated in Figure 7.
The removal efficiency showed that MG maintained a high removal rate, with a slight decrease from 98.92% to 95.74% as the concentration increased from 10 ppm to 200 ppm. Meanwhile, the adsorption capacity increased significantly from 0.89 mg/g to 19.15 mg/g. In contrast, the removal rates of MB and CV, which have greater polarity, continuously decreased with increasing solution concentration, from 99.80% to 61.97% and 98.91% to 24.14%, respectively. The adsorption capacity increased gradually from 0.99 mg/g and 0.89 mg/g to 12.89 mg/g and 12.01 mg/g, respectively. The slope of the removal efficiency curve indicates that the adsorption of MG by OSC700 has not yet reached saturation, even when the solution concentration is increased to 200 ppm. In contrast, the removal efficiency of MB begins to decrease significantly when the solution concentration exceeds 60 ppm, suggesting that the active adsorption of MB by OSC700 has ended, and the subsequent process is driven by molecular diffusion and concentration gradient [51]. The removal efficiency of CV, the most polar dye, decreases linearly, while the adsorption capacity stabilizes gradually as the concentration exceeds 120 ppm. It is apparent that the adsorption of OSC700 on organic dyes is inversely proportional to the polarity of the dye, with this phenomenon becoming more pronounced at higher concentrations.
Figure 6b shows the effect of different adsorption times on the adsorption efficiency of OSC700 for MG, MB, and CV. The adsorption efficiency of OSC700 for MG reaches 94.05% at 5 min and 97.47% at 120 min, respectively. The removal efficiencies of MB and CV also increase gradually, with optimal values of 98.91% and 79.62% achieved at 120 min. However, the removal rate and adsorption capacity decline after 120 min. According to the adsorption kinetics model, this phenomenon may be attributed to the desorption of organic dye molecules that are electrostatically bound to the C network on the OSC700 surface. During the adsorption process, the concentration of dye in the adsorption solution and OSC700 changes, with the concentration in OSC700 becoming significantly higher than in the solution. This leads to the diffusion of physically absorbed dye molecules, which have weak binding forces, resulting in desorption after prolonged adsorption.
Figure 6c shows the effect of varying OSC700 dosages on the adsorption efficiency of MG, MB, and CV. As shown, increasing the OSC700 dosage continuously improves the removal efficiency, while the adsorption amount gradually decreases. Notably, when the OSC700 dosage was 0.2 g, the adsorption of MG by OSC700 increased most rapidly. Subsequently, as the OSC700 dosage increased, the removal efficiency of MB and CV tended to stabilize, whereas the removal efficiency of MG increased almost linearly with the amount of adsorbent, indicating that the adsorption capacity of OSC700 for MG had not yet reached saturation, whereas the adsorption of MB and CV had already reached saturation. The adsorption capacity of all three dyes decreased, with MG showing the most significant decline. This is primarily attributed to the substantial increase in MG adsorption sites on the OSC700 surface. Although the amount of OSC700 was increased, the number of surface-active sites did not increase significantly, resulting in minimal changes to the adsorption capacity of MB and CV. This highlights the importance of optimizing the amount of OSC700 used during adsorption to achieve high removal efficiency while ensuring efficient utilization of the adsorbent material.
Figure 6d illustrates the effect of different temperatures on the adsorption efficiency of OSC700 for MG, MB, and CV. As shown, in the temperature range of 25~55 °C, the removal rate of OSC700 for MG, which has the minimum polarity, remains above 96%. In contrast, the highest removal rates for CV and MB are 87.7% and 75.2%, respectively, both exhibiting a decreasing trend. This indicates that the adsorption process of OSC700 for MG, MB, and CV is spontaneous, exothermic, and entropy-increasing, as confirmed by the adsorption thermodynamic model shown in Figure 8f. The consistently high removal efficiency of MG throughout the temperature range indicates that OSC700 has a strong affinity for MG, likely due to the favorable compatibility between the adsorbent’s surface properties and the MG molecular structure. As the temperature rises, the removal efficiency of MB and CV decreases, potentially due to weakened adsorption or more favorable interactions at lower temperatures. The spontaneous and exothermic nature of the adsorption process, accompanied by an increase in entropy, indicates that adsorption not only releases heat but also leads to a more disordered state, characteristic of physical adsorption [52].
Figure 6e,f illustrate the impact of various pH levels on the adsorption efficiency of OSC700 for MG, MB, and CV. As shown, within the pH range of 2.0~10.0, the removal rate of OSC700 for MG, which has the minimum polarity, remains consistently above 97%, with a stable adsorption capacity of 9.9 mg/g. This indicates that OSC700 is effective in removing MG from water across a range of environmental pH conditions. Although protonation of the adsorbent’s surface functional groups at lower pH values may reduce its ability to adsorb cationic dyes, the sustained high removal efficiency suggests that alternative forces, such as hydrophobic interactions or hydrogen bonds, play a significant role in the effective adsorption of dyes. The maximum removal rates of MB and CV are 80.9% and 91.5%, respectively, with corresponding maximum adsorption capacities of 9.1 mg/g and 8.0 mg/g. Under acidic conditions, the high concentration of H+ in the aqueous solution protonates the functional groups (such as -COOH) on the OSC700 surface, reaching a maximum at pH 6.0. As a result, the adsorption capacity of OSC700 for MB and CV decreases due to electrostatic repulsion, hindering the adsorption process. At pH~6, where the surface charge of OSC700 approaches the isoelectric point (i.e., the point of zero surface charge), the functional groups on OSC700 may be in a neutral or less protonated state. Under these conditions, electrostatic attraction may not be the dominant factor governing the adsorption of MB and CV. Instead, other types of interactions, such as van der Waals forces or hydrophobic interactions [53], may play a more significant role in enhancing the removal of MB and CV by OSC700. As the pH continues to rise, the surface of OSC700 becomes increasingly negatively charged, leading to competitive adsorption and enhanced hydrophobic interactions, which consequently reduce the removal rates of MB and CV.
The acidity coefficient of malachite green is 13.78 ± 0.29. When the pH exceeds this value, malachite green remains positively charged in the solution. Although this may induce some electrostatic repulsion, Figure 6e demonstrates that the protonation of malachite green does not significantly affect its adsorption by OSC700.
For methylene blue, the acidity coefficients are 2.6 and 11.2. As the pH increases, the concentration of hydrogen ions in the solution decreases, reducing electrostatic repulsion. Consequently, the removal efficiency of methylene blue gradually increases, reaching its peak at a pH of approximately 6, where charge equilibrium is established. At this point, electrostatic forces are no longer the primary factor influencing removal efficiency. However, with a further increase in pH, the solution becomes enriched with hydroxide ions, which compete with methylene blue for adsorption sites on OSC700, decreasing removal efficiency.
The acidity coefficient of crystal violet is 0.8 [54]. As the pH increases from 2 to 10, the concentration of hydrogen ions decreases, while that of hydroxide ions increases. The removal efficiency of crystal violet reaches its maximum at a pH of 6, where equilibrium is attained. During the pH increase from 2 to 6, electrostatic repulsion reduces the removal efficiency. As the pH rises from 6 to 10, the competitive adsorption of ions in the solution further affects the removal efficiency, resulting in an initial increase followed by a decrease.

4. Discussion

4.1. The Adsorption Models and Mechanisms of OSC

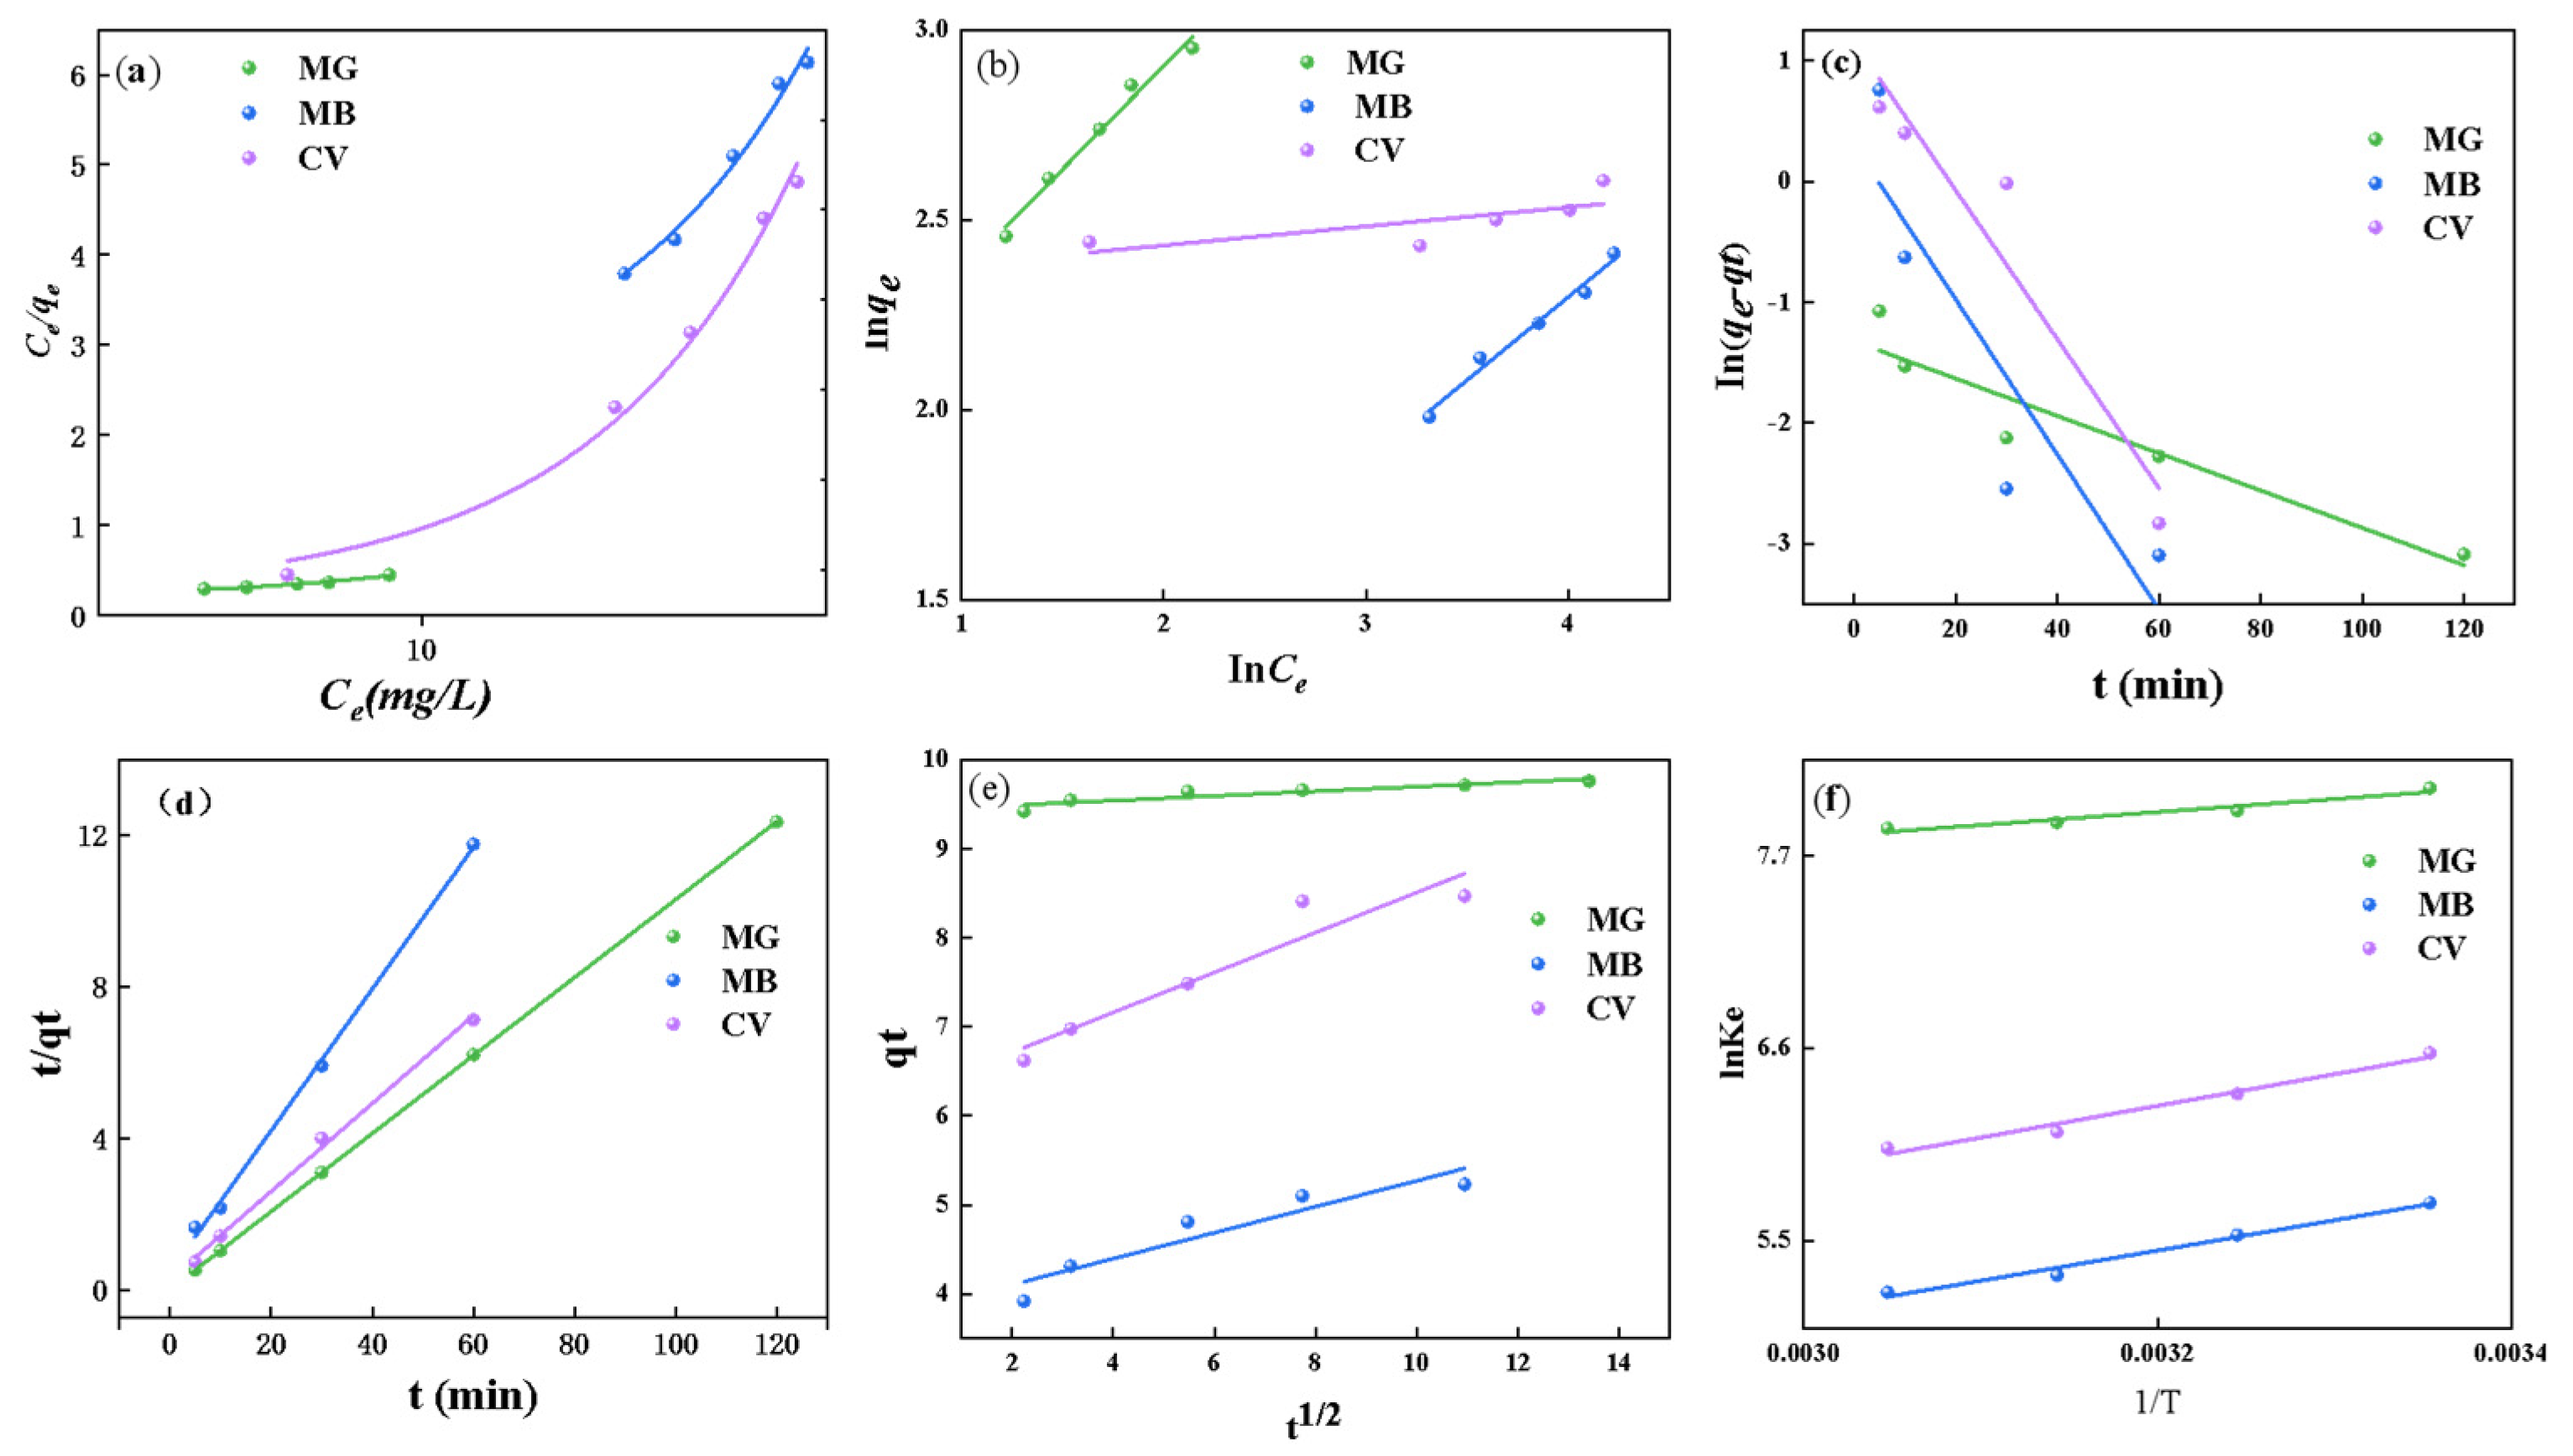
Figure 8 displays the adsorption kinetic curves and thermodynamic curves for OSC700 adsorption of MG, MB, and CV, fitted to different models. The results show that the Langmuir isothermal adsorption model has a higher fitting correlation coefficient compared to the Freundlich isothermal adsorption model, indicating a better fit to the data (Table 4). This indicates that the adsorption of MG, MB, and CV molecules by OSC700 follows the Langmuir isothermal adsorption model, indicating a monolayer adsorption mechanism on the outer surface of OSC700. As mentioned earlier, OS particles are primarily composed of quartz (57.03%), which is characterized by its high density and strength. The internal light and heavy organic matters are decomposed and deposited at high temperatures, leaving only a C network structure on the surface of the sludge particles. According to calculations, the theoretical saturation adsorption capacities (qm) of OSC700 for MG, MB, and CV are 33.41 mg/g, 16.41 mg/g, and 13.56 mg/g, respectively. These values are in good agreement with the actual experimental results obtained in the adsorbent dosage gradient adsorption experiments.
The Pseudo-second-order model (PSO) fitting correlation coefficients for the adsorption process of the three dyes are 0.99999, 0.99806, and 0.99669, respectively, which are all extremely close to 1 and higher than those of the Pseudo-first-order model (PFO) (Figure 8c,d and Table 5). Furthermore, the equilibrium adsorption capacity (qe) calculated by the PSO kinetic model is in closer agreement with the experimental value, indicating that the PSO kinetic model is more suitable for describing the adsorption process of OSC700 on the three dyes. The main reason is that the adsorption of OSC700 to the three dyes involves a combination of both chemical and physical adsorption mechanisms. The surface of OSC700 is rich in functional groups, including hydroxyl and carboxyl groups, which can interact with dye molecules, facilitating chemical adsorption.
In the study of adsorption kinetics, the PFO and PSO models have limitations in fully explaining the diffusion mechanism involved in the adsorption process. Therefore, the intraparticle diffusion model is applied to further investigate the adsorption mechanism, as shown by the fitting curves in Figure 8e. The adsorption results of OSC700 on three dyes revealed a linear relationship between qt and t0.5, with intercepts of 9.43 mg/g, 3.8115 mg/g, and 6.2624 mg/g, respectively. The fact that these intercepts do not pass through the origin suggests that diffusion is not the sole factor controlling the adsorption rate. During the adsorption process, the three dyes initially migrate through the liquid film surrounding the porous carbon surface of the oily sludge-based adsorbent, ultimately reaching the outer surface. The mass transfer rate across this liquid film significantly influences the adsorption process. The incoming dye molecules bind to the active sites on the porous carbon surface, while the remaining molecules diffuse along the pores into the interior of OSC700, with their transport governed by the molecular diffusion rate. As shown in Figure 6b, the concentration of organic dyes in the liquid decreases gradually with increasing adsorption time, leading to a corresponding decrease in molecular diffusion rate until adsorption equilibrium is achieved. The larger the C value in the intraparticle diffusion model, the more pronounced the boundary effect, indicating a greater contribution of surface adsorption to the overall adsorption process.
During the adsorption process, the adsorption of porous carbon and the desorption of solvent molecules occur simultaneously (Figure 8f, and Table 6). The desorption process leads to a greater increase in entropy than the decrease in entropy caused by the adsorption of the three dyes by OSC700. When ΔG < 0, it indicates that the adsorption of MG, MB, and CV by OSC700 is thermodynamically favorable and spontaneous. Furthermore, the positive value of ΔS indicates an increase in the disorder or randomness at the solid-liquid interface during the adsorption process, which enhances the entropy of the system and suggests a more random and disordered interaction between the three dyes and the active sites on OSC700. This demonstrates the strong affinity of OSC700 for MG, MB, and CV. Due to the large size of the dye molecules, their adsorption on OSC700 is accompanied by the release of a significant number of water molecules. This release occurs because the incoming dye molecules replace the water molecules initially bound to the hydrophilic functional groups on the OSC700 surface through hydrogen bonding, thereby facilitating the adsorption process [52]. As the temperature rises, the number of water molecules on the OSC700 surface decreases, exposing more adsorption sites for dye molecules. However, the changes in Gibbs free energy (ΔG) decrease with increasing temperature, from −20,045.2574 kJ/mol, −14,027.34 kJ/mol, and −16,194.66 kJ/mol to −21,436.9136 kJ/mol, −14,203.13 kJ/mol, and −16,452.18 kJ/mol, respectively. This suggests that increasing the temperature does not enhance the adsorption performance of OSC700, indicating that the entire adsorption process is a spontaneous endothermic process.

4.2. Adsorption Mechanism of Organic Dyes by OSC

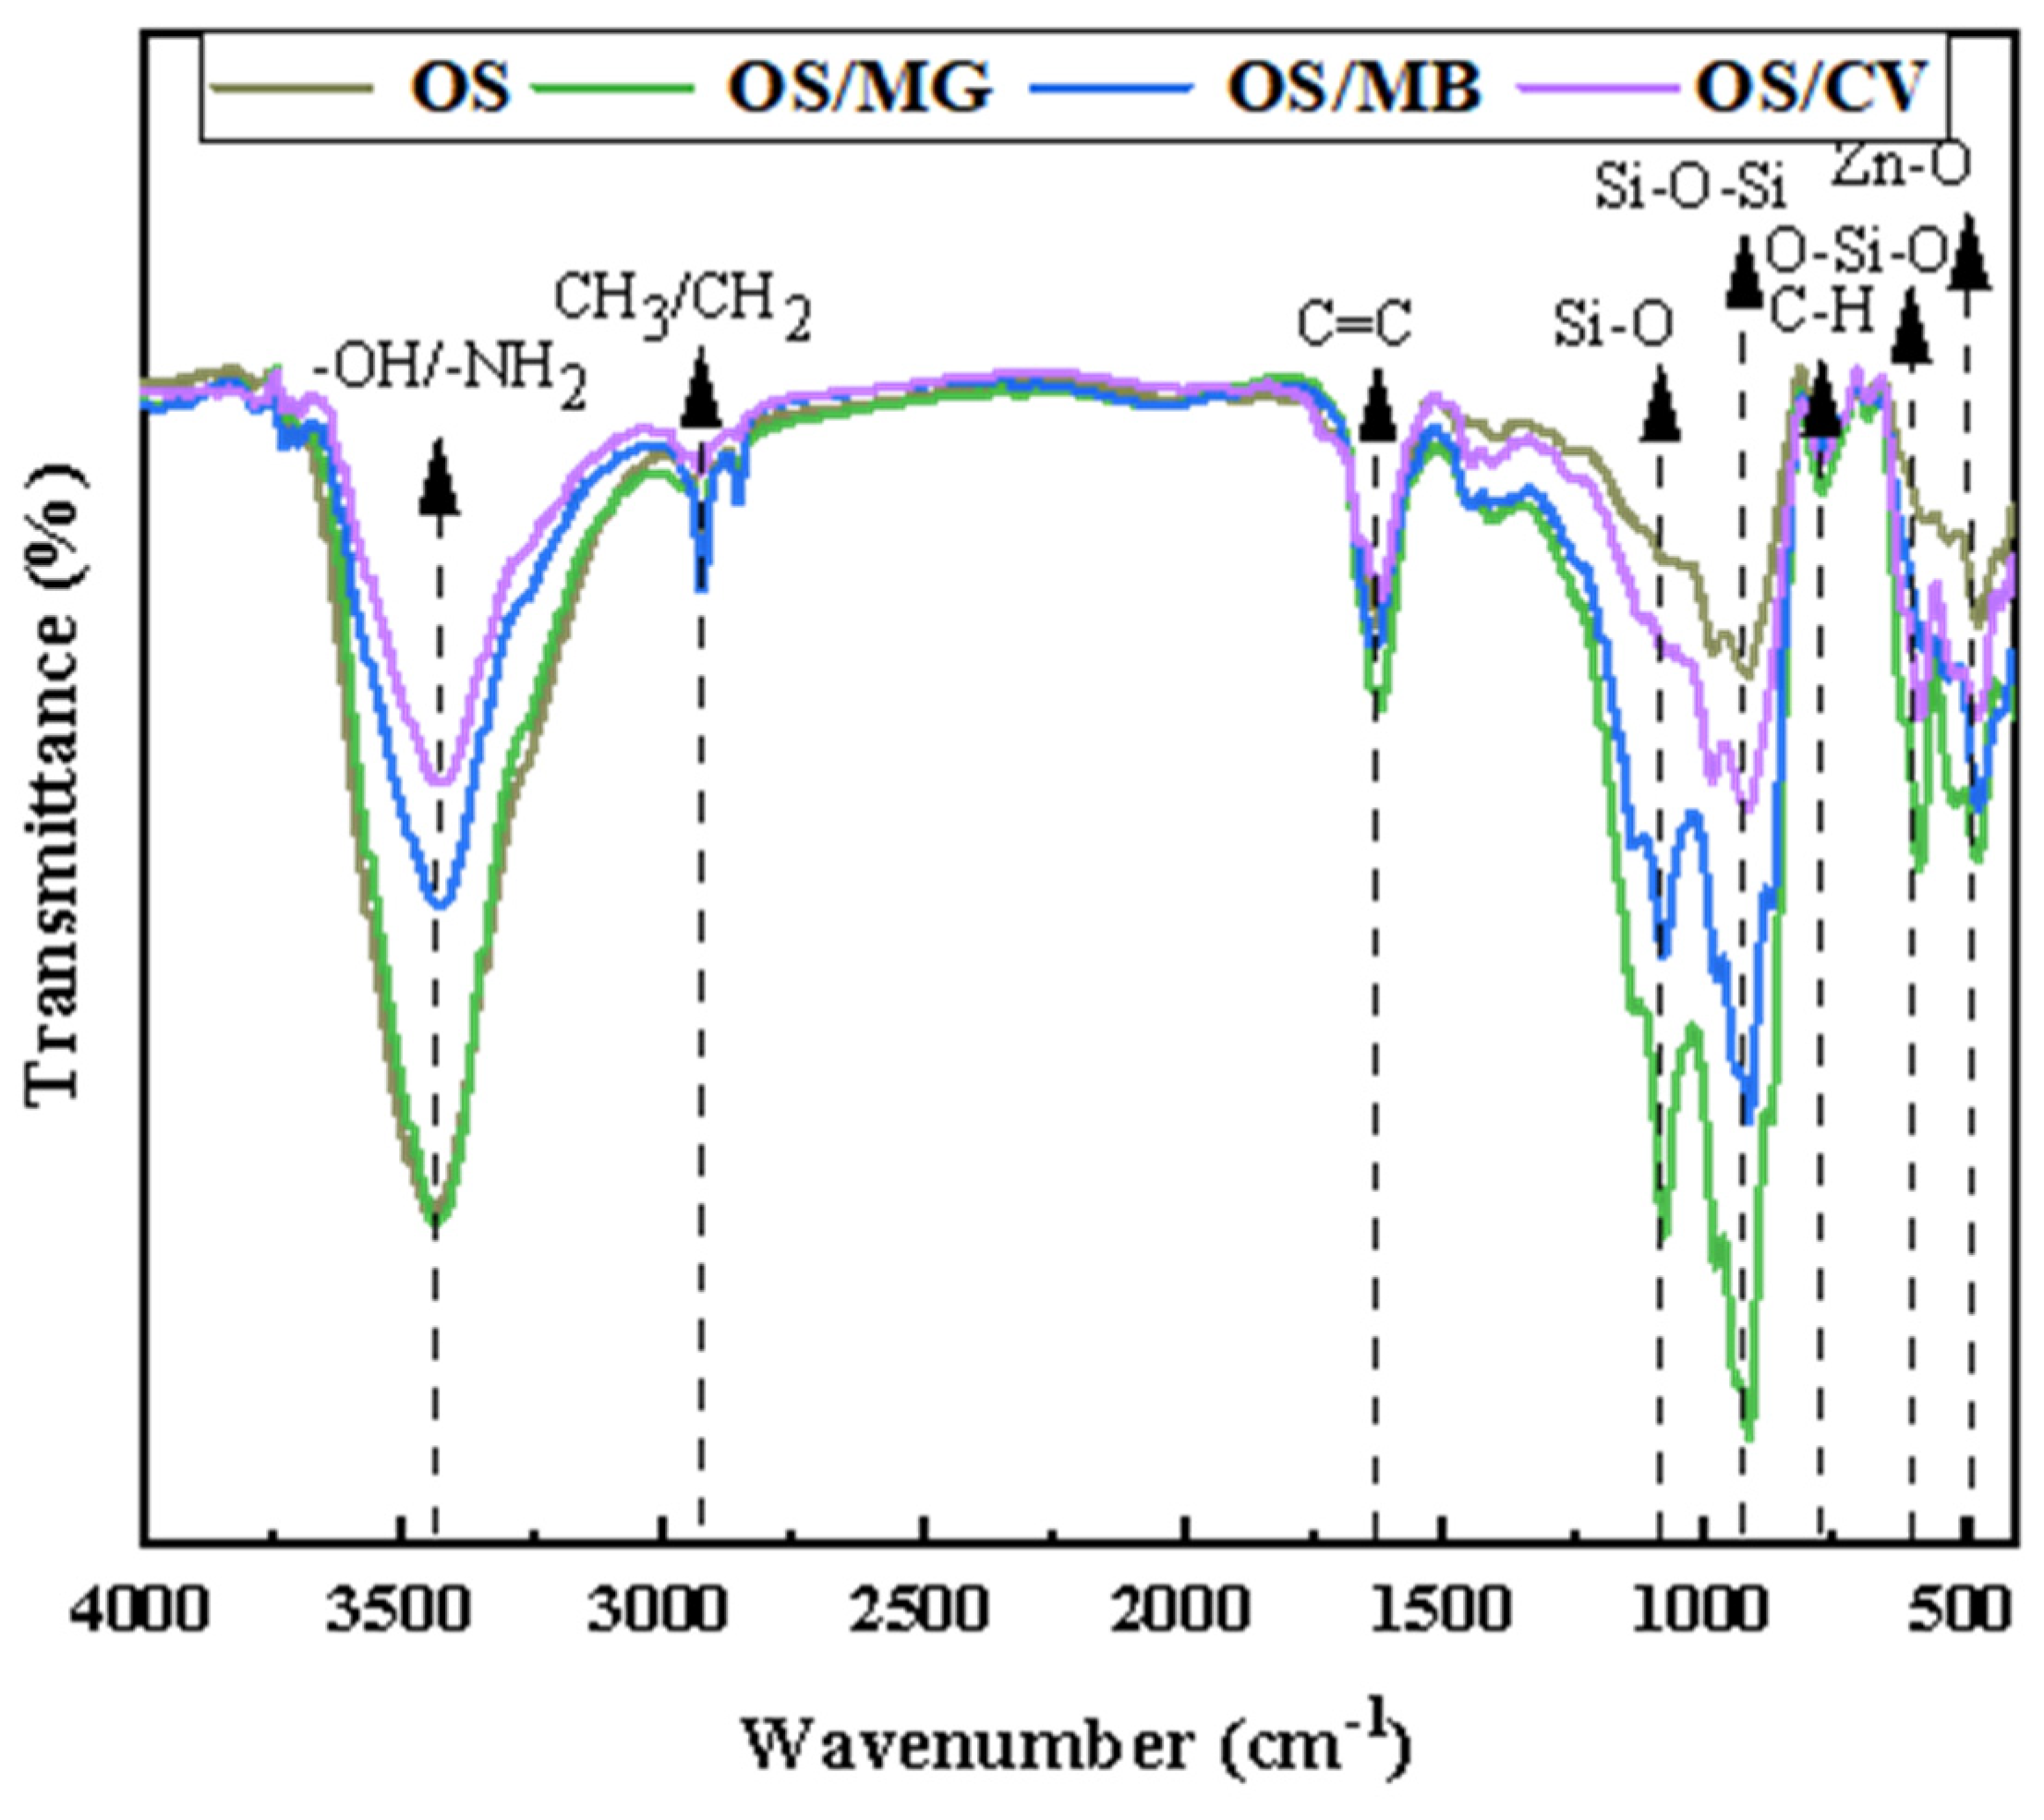
As shown in Figure 9, the FTIR spectrum of OSC700 prior to adsorption exhibits absorption peaks at 3450 cm−1, 2920 cm−1, 2850 cm−1, 1620 cm−1, 987 cm−1, 910 cm−1, and 474 cm−1. After adsorption of the three organic dyes, the wavenumber and peak intensity of the -OH peaks at 3420 cm−1 decreased, indicating that the adsorption process consumed a portion of the phenolic hydroxyl groups, leading to the formation of hydrogen bonds between the porous carbon surface and the adsorbate. This evidence confirms that the phenolic hydroxyl groups on the OSC700 surface play a major role in the chemisorption of dye molecules. Furthermore, the significant decrease in the absorption peaks at 2920 cm−1 and 2850 cm−1, corresponding to saturated -CH groups, indicates a reduction in the amount of these groups on the surface as the polarity of the adsorbent increases. The intensity of the aromatic C=C double bond peak at 1620 cm−1 undergoes a shift and decrease after adsorption, indicating that the adsorption of the three organic dyes by OSC700 occurs on the benzene rings, specifically on the C network structure of the porous carbon surface. Notably, the peak intensity decreases most significantly after MG adsorption, followed by MB, and then CV.
The most pronounced changes in the entire infrared spectrum occur in the hydroxyl and fingerprint regions (920–980 cm−1), where the peak intensity increases and shifts significantly after adsorption. This is primarily attributed to the presence of benzene rings in the three organic dye molecules, which interact with the porous carbon surface through π-π EDA interactions, forming π-π bonds. This interaction is inferred in the fingerprint region, despite not being explicitly evident. The absorption peak at 1000 cm−1 in the infrared fingerprint region is attributed to the -Si-O-Si- bond in the material, and even a slight modification in the molecular structure leads to a significant shift in this absorption peak. The interaction between OSC700 and the dyes (MG, MB, and CV) through hydrogen bonding or electrostatic attraction induces changes in the material’s molecular structure, resulting in alterations to the peak intensity of the -Si-O-Si-. The peak intensity reveals that the hydroxyl and fingerprint regions of CV, which has the highest polarity and lowest adsorption capacity, exhibit the smallest enhancement at 920–980 cm−1. In contrast, MG, which has the weakest polarity and largest saturated adsorption capacity, shows the most significant enhancement. This observation is in agreement with the results presented in Figure 7.

5. Conclusions

In this study, low-oil-content sludge served as the starting material, and ZnCl2 was employed as the activating agent. The OSC was prepared through the thermal decomposition of light and heavy organic constituents in the oily sludge at elevated temperatures, followed by carbon deposition processes.
The as-prepared OSC was thoroughly characterized, and its absorption properties were investigated. The results revealed that the C network framework can be effectively formed in OS by using ZnCl2 as an activator and carbonizing at 700 °C for 1 h. The theoretical monolayer saturation adsorption capacities of OSC700 for MG, MB, and CV were determined to be 33.41 mg/g, 16.41 mg/g, and 13.56 mg/g, respectively. Under optimal adsorption conditions, the removal efficiencies achieved were 95.74%, 64.97% and 24.14%, respectively. The adsorption of MG, MB, and CV by OSC700 was found to follow the pseudo-second-order kinetic model, suggesting a combined mechanism of physical and chemical adsorption, with chemical adsorption being the predominant mode. The adsorption process was spontaneous, exothermic, and entropy-increasing. Quantum functional theory calculations revealed that the dipole moments of MG, MB, and CV follow the polarity order of MG < MB < CV. Notably, the adsorption of MG, MB, and CV by OSC700 showed an inverse correlation between polarity and adsorption performance, with weaker polarity leading to better adsorption effects and higher theoretical and actual saturation adsorption capacities in oily sludge-based porous carbon. The adsorption of low-polarity materials by porous carbon derived from oily sludge is primarily driven by the presence of aromatic functional groups, hydrophily, π-π EDA interactions, and the formation of hydrogen bonds on the surface of the porous carbon. For dyes with higher polarity, electrostatic interactions and hydrophobic effects play a dominant role, with electrostatic adsorption being the primary adsorption mechanism. Notably, the formation of hydrogen bonds is negligible during the adsorption process. In summary, this study provides an effective approach and theoretical guidance for the removal of organic dyes, particularly those with lower polarity, from wastewater, providing valuable insights for the development of efficient wastewater treatment strategies.

Author Contributions

Conceptualization, H.C. and L.P.; methodology, H.C. and F.H.; software, H.C. and F.H.; validation, H.C., L.P., B.Z., J.L. and J.Y.; formal analysis, H.C., L.P., B.Z. and J.Y.; investigation, H.C., B.Z. and J.Y.; resources, L.P. and B.Z.; data curation, H.C. and C.M.; writing—original draft preparation, H.C.; writing—review and editing, C.M., J.L. and B.Z.; visualization, H.C. and F.H.; supervision, L.P.; project administration, L.P.; funding acquisition, L.P. All authors have read and agreed to the published version of the manuscript.

Funding

This research was funded by the Qinchuangyuan “Scientist + Engineer” Team Development Program of the Shaanxi Provincial Department of Science and Technology, grant number 2024QCY-KXJ-053 and the National Natural Science Foundation of China, grant number 52102144.

Institutional Review Board Statement

Not applicable.

Informed Consent Statement

Not applicable.

Data Availability Statement

The original contributions presented in the study are included in the article, further inquiries can be directed to the corresponding author.

Acknowledgments

Thanks to Longgui Peng for his important technical help and for providing experimental equipment and related materials.

Conflicts of Interest

The authors declare no conflicts of interest.

Abbreviations

The following abbreviations are used in this manuscript:
OSOily Sludge
OSCOily Sludge-based porous Carbon
NOSCOily Sludge-based porous carbon without the addition of a zinc chloride activator
MGMalachite Green
MBMethylene Blue
CVCrystal Violet
PFOPseudo-first-orderequation
PSOPseudo-second-orderequation
EDAelectron-donor-acceptor

References

  1. Han, D.; Li, X.; Gong, Z.; Jiang, L.; Wang, Z.; Liu, P. Hierarchical Porous Catalytic Pyrolysis Char Derived from Oily Sludge for Enhanced Adsorption. ACS Omega 2021, 6, 20549–20559. [Google Scholar] [CrossRef] [PubMed]
  2. Chen, H.; Wang, X.; Liang, H.; Chen, B.; Liu, Y.; Ma, Z.; Wang, Z. Characterization and treatment of oily sludge: A systematic review. Environ. Pollut. 2024, 344, 123245. [Google Scholar] [CrossRef] [PubMed]
  3. Saikia, N.; Sengupta, P.; Gogoi, P.K.; Borthakur, P.C. Kinetics of dehydroxylation of kaolin in presence of oil field effluent treatment plant sludge. Appl. Clay Sci. 2002, 22, 93–102. [Google Scholar] [CrossRef]
  4. Wang, Z.; Guo, Q.; Liu, X.; Cao, C. Low Temperature Pyrolysis Characteristics of Oil Sludge under Various Heating Conditions. Energy Fuels 2007, 21, 957–962. [Google Scholar] [CrossRef]
  5. Hu, G.; Li, J.; Zeng, G. Recent development in the treatment of oily sludge from petroleum industry: A review. J. Hazard. Mater. 2013, 261, 470–490. [Google Scholar] [CrossRef]
  6. Alguacil, F.J.; López, F.A. Organic Dyes versus Adsorption Processing. Molecules 2021, 26, 5440. [Google Scholar] [CrossRef]
  7. Thirumalisamy, S.; Subbian, M. Removal of methylene blue from aqueous solution by activative carbon prepared from the peel of Cucumis sativa fruit by adsorption. BioResources 2010, 5, 419–437. [Google Scholar] [CrossRef]
  8. Taiwo, E.A.; Otolorin, J.A. Oil Recovery from Petroleum Sludge by Solvent Extraction. Pet. Sci. Technol. 2009, 27, 836–844. [Google Scholar] [CrossRef]
  9. Jin, Y.; Zheng, X.; Chu, X.; Chi, Y.; Yan, J.; Cen, K. Oil Recovery from Oil Sludge through Combined Ultrasound and Thermochemical Cleaning Treatment. Ind. Eng. Chem. Res. 2012, 51, 9213–9217. [Google Scholar] [CrossRef]
  10. Zhou, L.; Jiang, X.; Liu, J. Characteristics of oily sludge combustion in circulating fluidized beds. J. Hazard. Mater. 2009, 170, 175–179. [Google Scholar] [CrossRef]
  11. Leonard, S.A.; Stegemann, J.A. Stabilization/solidification of petroleum drill cuttings. J. Hazard. Mater. 2010, 174, 463–472. [Google Scholar] [CrossRef] [PubMed]
  12. da Silva, L.J.; Alves, F.C.; de França, F.P. A review of the technological solutions for the treatment of oily sludges from petroleum refineries. Waste Manag. Res. 2012, 30, 1016–1030. [Google Scholar] [CrossRef] [PubMed]
  13. Koolivand, A.; Abtahi, H.; Godini, K.; Saeedi, R.; Rajaei, M.S.; Parhamfar, M.; Seifi, H. Biodegradation of oil tank bottom sludge using a new two-phase composting process: Kinetics and effect of different bulking agents. J. Mater. Cycles Waste Manag. 2019, 21, 1280–1290. [Google Scholar] [CrossRef]
  14. Mohammadi, S.; Mirghaffari, N. A preliminary study of the preparation of porous carbon from oil sludge for water treatment by simple pyrolysis or KOH activation. New Carbon Mater. 2015, 30, 310–318. [Google Scholar] [CrossRef]
  15. Yang, H.; Shen, K.; Fu, P.; Zhang, G. Preparation of a novel carbonaceous material for Cr(VI) removal in aqueous solution using oily sludge of tank bottom as a raw material. J. Environ. Chem. Eng. 2019, 7, 102898. [Google Scholar] [CrossRef]
  16. Zhang, J.; Shao, J.a.; Jin, Q.; Li, Z.; Zhang, X.; Chen, Y.; Zhang, S.; Chen, H. Sludge-based biochar activation to enhance Pb(II) adsorption. Fuel 2019, 252, 101–108. [Google Scholar] [CrossRef]
  17. Liu, Y.; Zhou, S.-L.; Liu, R.; Cheng, M.; Xu, J.; Liao, M.; Mei, J.; Yang, L. Study on amino-directed modification of oil sludge-derived carbon and its adsorption behavior of bisphenol A in water. Sep. Purif. Technol. 2022, 298, 121625. [Google Scholar] [CrossRef]
  18. Mojoudi, N.; Mirghaffari, N.; Soleimani, M.; Shariatmadari, H.; Belver, C.; Bedia, J. Phenol adsorption on high microporous activated carbons prepared from oily sludge: Equilibrium, kinetic and thermodynamic studies. Sci. Rep. 2019, 9, 19352. [Google Scholar] [CrossRef] [PubMed]
  19. Zhang, G.; Yang, H.; Zhao, T.; Li, X.; Zhou, Y.; Guo, S.-H. Highly efficient removal of As(III), Zn(II), Cu(II) and Cd(II) in aqueous solution using thermal desorption residue from oil sludge contaminated soil: Performance and mechanism. J. Environ. Chem. Eng. 2022, 10, 107668. [Google Scholar] [CrossRef]
  20. Tian, Y.; Li, J.; Whitcombe, T.W.; McGill, W.B.; Thring, R.W. Application of oily sludge-derived char for lead and cadmium removal from aqueous solution. Chem. Eng. J. 2020, 384, 123386. [Google Scholar] [CrossRef]
  21. Usman, M.O.; Aturagaba, G.; Ntale, M.; Nyakairu, G.W. A review of adsorption techniques for removal of phosphates from wastewater. Water Sci. Technol. 2022, 86, 3113–3132. [Google Scholar] [CrossRef] [PubMed]
  22. Wang, J.; Sun, C.; Lin, B.C.; Huang, Q.X.; Ma, Z.Y.; Chi, Y.; Yan, J.H. Micro- and mesoporous-enriched carbon materials prepared from a mixture of petroleum-derived oily sludge and biomass. Fuel Process. Technol. 2018, 171, 140–147. [Google Scholar] [CrossRef]
  23. Zhuang, X.; Wan, Y.; Feng, C.; Shen, Y.; Zhao, D. Highly Efficient Adsorption of Bulky Dye Molecules in Wastewater on Ordered Mesoporous Carbons. Chem. Mater. 2009, 21, 706–716. [Google Scholar] [CrossRef]
  24. Peiris, C.; Gunatilake, S.R.; Mlsna, T.E.; Mohan, D.; Vithanage, M. Biochar based removal of antibiotic sulfonamides and tetracyclines in aquatic environments: A critical review. Bioresour. Technol. 2017, 246, 150–159. [Google Scholar] [CrossRef] [PubMed]
  25. Del Bubba, M.; Anichini, B.; Bakari, Z.; Bruzzoniti, M.C.; Camisa, R.; Caprini, C.; Checchini, L.; Fibbi, D.; El Ghadraoui, A.; Liguori, F.; et al. Physicochemical properties and sorption capacities of sawdust-based biochars and commercial activated carbons towards ethoxylated alkylphenols and their phenolic metabolites in effluent wastewater from a textile district. Sci. Total Environ. 2019, 708, 135217. [Google Scholar] [CrossRef] [PubMed]
  26. Yahya, M.A.; Al-Qodah, Z.; Ngah, C.W.Z.C.W. Agricultural bio-waste materials as potential sustainable precursors used for activated carbon production: A review. Renew. Sustain. Energy Rev. 2015, 46, 218–235. [Google Scholar] [CrossRef]
  27. Donald, J.; Ohtsuka, Y.; Xu, C.C. Effects of activation agents and intrinsic minerals on pore development in activated carbons derived from a Canadian peat. Mater. Lett. 2011, 65, 744–747. [Google Scholar] [CrossRef]
  28. Acharya, J.; Sahu, J.N.; Sahoo, B.K.; Mohanty, C.R.; Meikap, B.C. Removal of chromium(VI) from wastewater by activated carbon developed from Tamarind wood activated with zinc chloride. Chem. Eng. J. 2009, 150, 25–39. [Google Scholar] [CrossRef]
  29. Fu, J.; Xu, Z.; Li, Q.; Chen, S.; An, S.; Zeng, Q.f.; Zhu, H. Treatment of simulated wastewater containing Reactive Red 195 by zero-valent iron/activated carbon combined with microwave discharge electrodeless lamp/sodium hypochlorite. J. Environ. Sci. 2010, 22, 512–518. [Google Scholar] [CrossRef] [PubMed]
  30. Guo, D.-D.; Li, B.; Deng, Z.-P.; Huo, L.-H.; Gao, S. A rational design of layered metal–organic framework towards high-performance adsorption of hazardous organic dye. Dalton Trans. 2021, 50, 7818–7825. [Google Scholar] [CrossRef] [PubMed]
  31. Huang, Z.; Li, Y.; Chen, W.; Shi, J.; Zhang, N.; Wang, X.; Li, Z.; Gao, L.; Zhang, Y. Modified bentonite adsorption of organic pollutants of dye wastewater. Mater. Chem. Phys. 2017, 202, 266–276. [Google Scholar] [CrossRef]
  32. David, L.; Moldovan, B. Green Synthesis of Biogenic Silver Nanoparticles for Efficient Catalytic Removal of Harmful Organic Dyes. Nanomaterials 2020, 10, 202. [Google Scholar] [CrossRef]
  33. Han, B.; Isborn, C.M.; Shi, L. Determining Partial Atomic Charges for Liquid Water: Assessing Electronic Structure and Charge Models. J Chem Theory Comput 2021, 17, 889–901. [Google Scholar] [CrossRef]
  34. Lu, T.; Chen, F. Multiwfn: A multifunctional wavefunction analyzer. J Comput Chem 2012, 33, 580–592. [Google Scholar] [CrossRef] [PubMed]
  35. Fei, C. Comparison of Computational Methods for Atomic Charges. Acta Phys.-Chim. Sin. 2012, 28, 1–18. [Google Scholar]
  36. Choi, Y.K.; Kan, E. Effects of pyrolysis temperature on the physicochemical properties of alfalfa-derived biochar for the adsorption of bisphenol A and sulfamethoxazole in water. Chemosphere 2019, 218, 741–748. [Google Scholar] [CrossRef]
  37. Yang, X.; Wang, B.; Cheng, F. Adsorption performance on tetracycline by novel magnetic adsorbent derived from hydrochar of low-rank coal and sewage sludge. Sep. Purif. Technol. 2024, 330, 125482. [Google Scholar] [CrossRef]
  38. Cheng, S.; Chang, F.; Zhang, F.; Huang, T.; Yoshikawa, K.; Zhang, H. Progress in thermal analysis studies on the pyrolysis process of oil sludge. Thermochim. Acta 2018, 663, 125–136. [Google Scholar] [CrossRef]
  39. Xin, W.; Li, X.; Song, Y. Sludge-based mesoporous activated carbon: The effect of hydrothermal pretreatment on material preparation and adsorption of bisphenol A. J. Chem. Technol. Biotechnol. 2020, 95, 1666–1674. [Google Scholar] [CrossRef]
  40. Boonprachai, R.; Autthawong, T.; Namsar, O.; Yodbunork, C.; Yodying, W.; Sarakonsri, T. Natural Porous Carbon Derived from Popped Rice as Anode Materials for Lithium-Ion Batteries. Crystals 2022, 12, 223. [Google Scholar] [CrossRef]
  41. Majoul, N.; Aouida, S.; Bessaïs, B. Progress of porous silicon APTES-functionalization by FTIR investigations. Appl. Surf. Sci. 2015, 331, 388–391. [Google Scholar] [CrossRef]
  42. Wang, J.; Liu, T.; Huang, Q.-X.; Ma, Z.; Chi, Y.; Yan, J.-H. Production and characterization of high quality activated carbon from oily sludge. Fuel Process. Technol. 2017, 162, 13–19. [Google Scholar] [CrossRef]
  43. Abraham, O.F.; Sunday, A.V.; EmenikeChinedozi, E.; ChinwokeOgbuefi, U. Rice husk derived graphene and zinc oxide composite anode for high reversible capacity lithium-ion batteries. Diam. Relat. Mater. 2022, 123, 108885. [Google Scholar] [CrossRef]
  44. Giacomazzi, L.; Shcheblanov, N.S.; Povarnitsyn, M.E.; Li, Y.; Mavrič, A.; Zupančič, B.; Grdadolnik, J.; Pasquarello, A. Infrared spectra in amorphous alumina: A combined ab initio and experimental study. Phys. Rev. Mater. 2023, 7, 045604. [Google Scholar] [CrossRef]
  45. Lu, G.Q.; Low, J.C.; Liu, C.Y.; Lua, A.C. Surface area development of sewage sludge during pyrolysis. Fuel 1995, 74, 344–348. [Google Scholar] [CrossRef]
  46. Lennon, D.; Lundie, D.T.; Jackson, S.D.; Kelly, G.J.; Parker, S.F. Characterization of Activated Carbon Using X-ray Photoelectron Spectroscopy and Inelastic Neutron Scattering Spectroscopy. Langmuir 2002, 18, 4667–4673. [Google Scholar] [CrossRef]
  47. Zhang, N.; Ejtemaei, M.; Nguyen, A.V.; Zhou, C. XPS analysis of the surface chemistry of sulfuric acid-treated kaolinite and diaspore minerals with flotation reagents. Miner. Eng. 2019, 136, 1–7. [Google Scholar] [CrossRef]
  48. Shen, C.; Wang, H.; Shen, H.; Wu, J.; Zhu, Y.; Shi, W.; Zhang, X.; Ying, Z. NH4Br-Modified Biomass Char for Mercury Removal in a Simulated Oxy-fuel Atmosphere: Mechanism Analysis by X-ray Photoelectron Spectroscopy. Energy Fuels 2020, 34, 9872–9884. [Google Scholar] [CrossRef]
  49. Dietrich, P.M.; Glamsch, S.; Ehlert, C.; Lippitz, A.; Kulak, N.; Unger, W.E.S. Synchrotron-radiation XPS analysis of ultra-thin silane films: Specifying the organic silicon. Appl. Surf. Sci. 2016, 363, 406–411. [Google Scholar] [CrossRef]
  50. Qin, H.; Kuang, W.; Huang, D.; Zhang, X.; Liu, J.; Yi, L.; Shen, F.; Wei, Z.; Huang, Y.; Xu, J.; et al. Achieving high-rate and high-capacity Zn metal anodes via a three-in-one carbon protective layer. J. Mater. Chem. A 2022, 10, 17440–17451. [Google Scholar] [CrossRef]
  51. Theydan, S.K.; Ahmed, M.J. Adsorption of methylene blue onto biomass-based activated carbon by FeCl3 activation: Equilibrium, kinetics, and thermodynamic studies. J. Anal. Appl. Pyrolysis 2012, 97, 116–122. [Google Scholar] [CrossRef]
  52. Hu, Q.; Wang, Q.; Feng, C.; Zhang, Z.; Lei, Z.; Shimizu, K. Insights into mathematical characteristics of adsorption models and physical meaning of corresponding parameters. J. Mol. Liq. 2018, 254, 20–25. [Google Scholar] [CrossRef]
  53. Nayak, A.; Bhushan, B.; Kotnala, S. Chapter 3—Fundamentals and mechanism of adsorption. In Sustainable Remediation Technologies for Emerging Pollutants in Aqueous Environment; Hadi Dehghani, M., Karri, R.R., Tyagi, I., Eds.; Elsevier: Amsterdam, The Netherlands, 2024; pp. 29–62. [Google Scholar]
  54. Olam, M.; Gündüz, F.; Karaca, H. Production of activated carbon from duckweed and its effectiveness in crystal violet adsorption. Biomass Convers. Biorefinery 2024, 14, 19597–19612. [Google Scholar] [CrossRef]
Figure 1. TG profiles of OS (a), XRD profiles of OS, NOSC and OSC700 (b), FT-IR profiles of OS and OSC700 (c).
Applsci 14 07283 g001
Figure 2. N2 adsorption-desorption curves (a) and BJH pore size distribution curves (b) of OSC500, OSC700 and OSC900.
Applsci 14 07283 g002
Figure 3. SEM images of OS (ac), OSC500 (df), OSC700 (gi), OSC900 (jl).
Applsci 14 07283 g003
Figure 4. EDS image of OSC700 (a), corresponding to C element (b), O element (c), Si element (d), Zn element (e).
Applsci 14 07283 g004
Figure 5. XPS spectra of OS (ad), OSC700 (ei) and their fitting results.
Applsci 14 07283 g005
Figure 6. Adsorption capacity and removal efficiency of three organic dyes at different initial concentrations (a), time (b), agent dosage (c), temperature (d) and pH (e), and Zeta of OSC700 (f).
Applsci 14 07283 g006
Figure 7. Adsorption mechanism of organic dyes by OSC.
Applsci 14 07283 g007
Figure 8. Langmuir (a), Freundlich (b), PFO kinetic curves (c), PSO kinetic curves (d), particle diffusion adsorption kinetic curves (e), thermodynamic curves (f) models for OSC700 adsorption of MG, MB, CV.
Applsci 14 07283 g008
Figure 9. Infrared spectra of OSC700 before and after adsorption of MG, MB and CV.
Applsci 14 07283 g009
Table 1. The main elements in oily sludge composition.
SiO2CaOAl2O3Fe2O3K2OMgONa2OTiO2SO3Cl
w/%57.0315.1912.576.042.592.031.551.510.660.27
Table 2. Surface structural parameters of OSC500, OSC700, and OSC900.
SSA(m2/g)Total Pore Volume (cm3/g)Mean Pore Diameter (nm)
OSC50010.40.028914.50
OSC70010.950.031811.63
OSC9006.430.023311.11
Table 3. Parameters for calculating the dipole moment of three organic dyes.
Single-Point Energy (RB3LYP)/HartreeRMS Gradient Norm/HartreeDipole Moment/
Debye
Polarizability/a.u.
MG−843.62670.00000411.0223306.5257
MB−899.00140.00001414.9658335.8883
CV−1025.57970.00006726.6531237.6323
Table 4. The model parameters of adsorption isotherm.
LangmuirFreundlich
qm (mg/g)KL (L/mg)R2KF (mg/g)nR2
MG33.411290.162150.9882465.616031.837930.9801
MB16.409580.028740.983513.528662.287070.98101
CV13.561160.327210.9909215.040371.995610.53733
Table 5. Kinetic constants for the adsorption of MG, MB, and CV.
PFOPSO
qe (mg/g)K1R2qe (mg/g)K1R2
MG0.04750.015440.901629.7267−0.043050.9999
MB1.15930.06420.81555.35780.07240.9981
CV1.15250.06160.92038.63110.45950.9967
Table 6. Thermodynamic parameters of OSC700 on MG, MB, and CV.
ΔH (kJ/mol)ΔS (J/(mol∙K))ΔG (kJ/mol)
298 K298 K298 K
MG−6189.072146.28820−20,045.2574−20,385.9097−20,868.9016
MB−14,373.39211.4651−14,027.344−14,171.545−14,174.080
CV−15,045.37883.9898−16,242.086−16,290.533−16,452.179
Disclaimer/Publisher’s Note: The statements, opinions and data contained in all publications are solely those of the individual author(s) and contributor(s) and not of MDPI and/or the editor(s). MDPI and/or the editor(s) disclaim responsibility for any injury to people or property resulting from any ideas, methods, instructions or products referred to in the content.