Article

Developing a Dynamic Feature Selection System (DFSS) for Stock Market Prediction: Application to the Korean Industry Sectors

1
Department of Industrial Engineering, Yonsei University, Seoul 03722, Republic of Korea
2
Department of Business Administration, Sejong University, Seoul 05006, Republic of Korea
3
Division of Data Science, Yonsei University, Wonju 26493, Republic of Korea
*
Authors to whom correspondence should be addressed.
Appl. Sci. 2024, 14(16), 7314; https://doi.org/10.3390/app14167314
Submission received: 22 July 2024 / Revised: 8 August 2024 / Accepted: 9 August 2024 / Published: 20 August 2024
(This article belongs to the Special Issue Exploring AI: Methods and Applications for Data Mining)

Abstract

:
For several years, a growing interest among numerous researchers and investors in predicting stock price movements has spurred extensive exploration into employing advanced deep learning models. These models aim to develop systems capable of comprehending the stock market’s complex nature. Despite the immense challenge posed by the diverse factors influencing stock price forecasting, there remains a notable lack of research focused on identifying the essential feature set for accurate predictions. In this study, we propose a Dynamic Feature Selection System (DFSS) to predict stock prices across the 10 major industries, as classified by the FnGuide Industry Classification Standard (FICS) in South Korea. We apply 16 feature selection algorithms from filter, wrapper, embedded, and ensemble categories. Subsequently, we adjust the settings of industry-specific index data to evaluate the model’s performance and robustness over time. Our comprehensive results identify the optimal feature sets that significantly impact stock prices within each sector at specific points in time. By analyzing the inclusion ratios and significance of the optimal feature set by category, we gain insights into the proportion of feature classes and their importance. This analysis ensures the interpretability and reliability of our model. The proposed methodology complements existing methods that do not consider changes in the types of variables significantly affecting stock prices over time by dynamically adjusting the input variables used for learning. The primary goal of this study is to enhance active investment strategies by facilitating the creation of diversified portfolios for individual stocks across various sectors, offering robust models and feature sets that consistently demonstrate high performance across industries over time.

1. Introduction

The recent financial market has evolved into a more complex and interconnected structure, driven by rapid advancements in technology and digitalization [1]. These technological advancements, along with the swift circulation of information, underscore the dynamic nature of the market, thereby presenting new challenges and opportunities for investors and market analysts [2]. However, the prediction of stock prices remains a challenging issue, attributed to the market’s volatility, non-linearity, and non-stationarity, as well as the influence of various external factors [3]. In response, the field of stock price prediction is increasingly shifting towards improving performance through the application of various machine learning and deep learning algorithms, with the aim of enhancing prediction accuracy and computational efficiency [4,5,6,7]. These research endeavors are focused on enhancing the predictability of financial markets and providing more accurate decision-making tools for investors.
There is a notable scarcity of research focused on identifying effective combinations of factors influencing stock prices. The dynamics of the stock market are affected by various elements, including the market value of stocks, company performance, government policies, a country’s gross domestic product (GDP), inflation rates, and unexpected events such as natural disasters [8]. Additionally, factors like short-term price trends, economic conditions, corporate solvency, and profitability, and the impact of behavioral psychology are acknowledged as significant [5]. Current research is exploring these complex factors through the development of various technical indicators and advancements in computer science. However, the pursuit of effective feature sets for stock price prediction continues to be a formidable challenge [9,10,11,12].
In the realm of machine learning and deep learning algorithms, feature selection is a critical step for avoiding overfitting and mitigating the curse of dimensionality. This process is essential for identifying key feature sets that significantly influence the prediction of the target feature. Active exploration of this process is ongoing in various AI fields [13,14]. Its significance is especially pronounced in the stock market due to its dynamic nature and the unique characteristics of each sector. Employing dynamic methods, rather than a static approach, becomes imperative for feature selection, aligning with the continuously evolving conditions and sector-specific characteristics of the stock market. Identifying the appropriate combination of features for each situation is crucial. Thus, prioritizing effective feature management in stock price prediction emerges as a significant and necessary challenge, one that should be addressed before focusing on enhancements in algorithm complexity.
We propose a Dynamic Feature Selection System (DFSS) specifically designed to predict stock prices across the 10 major industries within South Korea’s FICS sectors. This system utilizes 16 distinct feature selection algorithms that encompass filter, wrapper, embedded, and ensemble methodologies. It conducts in-depth analyses of sector-specific index data to thoroughly understand each sector’s unique characteristics. The DFSS continually evaluates and adapts to the ever-changing market conditions, assessing the performance and stability of predictive models for each industry over time. This iterative process enables the identification of the most effective combination of features and algorithms that significantly impact stock prices at any given moment. By providing a versatile analysis model that dynamically responds to market fluctuations, the DFSS substantially improves the adaptability and effectiveness of investment strategies. Ultimately, the DFSS offers investors and analysts critical insights, facilitating more informed and astute investment decisions in a dynamic market environment.
The structure of this paper is as follows: Section 1 describes the background of stock price prediction and the contributions of this study. Section 2 discusses previous research, while Section 3 explains the methodologies used in this study. Section 4 details the research procedures, and Section 5 presents the experimental results. Finally, Section 6 concludes the study and suggests directions for future research.

2. Literature Review

2.1. Stock Price Prediction

Diverse methodologies have been explored over time for stock price prediction. With advancements in machine learning and deep learning models, there has been a significant increase in research employing these artificial intelligence approaches for forecasting stock prices.
Han (2021) investigated a method to enhance the performance of stock price prediction models by integrating LSTM deep learning models with various indicators, such as technical, macroeconomic, and market sentiment factors [15]. Through experimenting with 290 combinations, the study demonstrated that selecting the appropriate combination for each industry could improve the model’s predictive capability. Sayavong et al. (2019) combined CNN with the characteristics of the Thai stock market for data preprocessing and model training [16]. This approach yielded predictions for three stocks listed on the Thai stock exchange (BBL, CAPLL, PTT), and reported high accuracy in comparison to actual stock price data. Park and Shin (2013) proposed a semi-supervised learning (SSL) model designed to capture the complex interrelationships between features, using network structures to address the interconnectedness and complexity of factors necessary for stock prediction [17]. This model exhibited superior AUC and ROI results compared to other predictive models. Fang et al. (2023) tackled the limitations of traditional models in capturing rapid changes in stock price data by introducing an adaptive cross-entropy loss function [18]. This function assigns greater weights to samples with significant stock price volatility. Applying this method, they developed an LSTM-BN network and conducted predictions on the S&P500, CSI300, and SSE180 indices, ultimately showing that their model outperformed existing models in terms of returns. These studies exemplify the use of diverse techniques combined for predicting stock prices. Nam and Seong (2019) classified Korean stocks using the Global Industry Classification Standard (GICS) and integrated causal relationship information from financial news to predict stock movements [19].

2.2. Feature Selection

The increasing scale and diversity of datasets have elevated the importance of feature selection, leading to a heightened emphasis in this area. As a result, numerous studies are being conducted to address its significance. Effrosynidis and Arampatzis (2021) carried out research using eight environmental datasets, encompassing approximately 6830 features and 18 feature selection techniques, employing filter, wrapper, embedded, and ensemble methodologies [20]. They identified the optimal method and feature sets by evaluating the average accuracy ranking and variance of each technique. Cateni et al. (2014) developed a hybrid algorithm that combines filter-wrapper techniques to improve performance in classification problems and executed feature selection [21]. Classifiers trained with datasets reduced by this hybrid model exhibited high balanced classification rate (BCR) performance during testing. Fernandes et al. (2019) analyzed various datasets from a metallurgy company, conducting a study that integrated the remote memory reference (RMR) algorithm—a filter technique—with a rule-based model [22]. This approach resulted in reducing the feature space from the initial 47 datasets to the most significant 32 datasets. Benkessirat and Benblidia (2019) performed feature selection on diverse real-world datasets using filter, wrapper, and embedded methods [23]. They then conducted a comparative analysis of the most effective feature selection methods for each sector, using metrics such as accuracy and F1_score. Meera and Sundar (2021) researched using feature selection to decrease the processing load of the model and mine data streams in real time [24]. They proposed a wrapper-based particle swarm optimization (PSO), grammatical evolution (GE), and a hybrid PSO-GE model. The hybrid PSO-GE model demonstrated an 8.63% higher accuracy in feature selection compared to other models. Lastly, Khaire, and Dhanalakshmi (2022) provided an overview of feature selection techniques and instability of algorithms, offering solutions for various causes of instability [25].

2.3. Feature Selection for Stock Price Prediction

Feature selection in stock price prediction has been crucial in unraveling the complex attributes and interconnections within financial market data. Initially, research in this domain primarily utilized basic statistical methods and straightforward economic indicators to forecast market trends and stock price fluctuations.
Advancing this research, Tsai and Hsiao (2010) developed a methodology that integrates various feature selection techniques, including Principal Component Analysis (PCA), Genetic Algorithm (GA), and Classification and Regression Trees (CARTs) [26]. This approach aimed to identify key features to enhance the accuracy of stock price predictions. They found that the combined application of PCA and GA, as well as the integration of PCA, GA, and CARTs, were particularly effective. This method distilled approximately 80% of the initial 85 features, identifying 14–17 critical features. Ni et al. (2011) adopted the fractal feature selection method in conjunction with a Support Vector Machine (SVM) for daily stock price trend forecasting, demonstrating superior average prediction accuracy with a smaller subset of features [27]. Naik and Mohan (2019) utilized 33 technical indicators along with the Boruta feature selection technique for forecasting stock prices, reducing the error rate to 12% through an ANN regression model [13]. Yuan et al. (2020) analyzed Chinese A-share market data using various feature selection algorithms and machine learning models, including time-sliding window cross-validation [28]. Their findings underscored the effectiveness of the Random Forest algorithm in predicting stock price trends. Chaudhari and Thakkar (2023) introduced a novel stock price trend prediction methodology using feature selection based on the coefficient of variation and various neural network models, showing substantial improvements in performance compared to traditional feature selection techniques [29].
Previous research has indicated a significant gap in the context of the Korean market, often focusing either on broad market indices or individual stock predictions, with a limited range of feature selection methods and types. Korean industry-specific prediction research also focuses on improving stock prediction performance. To overcome these limitations, this study aims to explore a spectrum of feature selection techniques, seeking to identify the most effective feature sets for predicting stock prices within key domestic industry classifications.

3. Methodology

In this study, we employed four distinct feature selection techniques—filter, wrapper, embedded, and ensemble—to derive the optimal feature set, utilizing a total of 16 algorithms. The selected methodologies were chosen based on the study by Effrosynidis and Arampatzis (2021), focusing on commonly used approaches. Within the filter category, we applied the Chi-square test, mutual information, ANOVA F-value, variance threshold, Fisher score, and MultiSURF algorithms [20]. For the wrapper techniques, we used recursive feature elimination, permutation importance, SHAP, Boruta, and BorutaSHAP. The embedded category involved the use of algorithms such as embedded random forest, embedded LightGBM, and embedded LASSO. Finally, in the ensemble category, we employed borda count and reciprocal rank algorithms. Detailed descriptions of each technique and algorithm are provided in the subsequent subsections.

3.1. Filter Method

The filter technique, as described by Colla and Reyneri (2009), is a feature selection method based on the statistical characteristics of data that involves filtering out insignificant features [30]. The primary advantage of the filter method is its high-speed operation, although it tends to demonstrate lower effectiveness in terms of performance impact compared to other techniques. In this paper, we conducted experiments applying the Chi-square test, mutual information, ANOVA F-value, variance threshold, Fisher score, and MultiSURF algorithms to the filter technique.
Chi-square Test. This method, as detailed by Magnello (2005), identifies relationships between categorical variables through the difference between observed frequencies and expected values [31]. Features are ranked based on statistical significance tests, with selection favoring those dependent on the class label [32].
Mutual Information. As Kraskov and Grassberger (2004) explain, this methodology measures the mutual dependence between two probability features [33]. Greater mutual dependence suggests that selecting one feature provides significant information about another, highlighting the importance of the selected feature [34].
ANOVA F-value. One statistical method for evaluating differences between data groups is ANOVA, which, according to Rutherford (2011), assesses the significance of differences by analyzing the variance levels within groups [35]. This approach measures feature similarity and identifies significant features, thereby reducing the high dimensionality of the feature space [36].
Variance Threshold. This feature selection technique, described by Fida and Ntahobari (2021), eliminates characteristics that do not meet a certain feature percentile, thereby focusing on more significant features [37].
Fisher Score. This method, as Duda (2001) outlines, identifies the optimal feature set that maximizes the distance between data points of different classes and minimizes the distance within the same class in the data space generated by the selected feature [38,39].
MultiSURF. Based on the Relief algorithm, this methodology, as presented by Raj and Mohanasundaram (2020), generates a threshold defining the average pairwise distance between the target instance and all other instances [40]. Implementing this threshold aids in selecting features across all instance pairs in the dataset, increasing the probability of choosing optimal features.

3.2. Wrapper Method

The wrapper method is an approach that aims to find the optimal feature subset, tailored to a specific algorithm and domain. However, its dependency on multiple iterations of machine learning algorithms results in considerable time and cost implications, which is a notable drawback. Additionally, this method introduces complexities in implementation [41].
Recursive Feature Elimination. As described by Gregorutti (2017), this method involves training the model repeatedly and removing the least important features at each step, ultimately retaining only the essential features [42].
Permutation Importance. Introduced by Breiman (2001), this measure theoretically elucidates the impact of correlation on feature rankings [43].
SHAP. Proposed by Lundberg and Lee (2017), this technique expands usability by allowing feature inclusion based on the independence between features, founded on the SHAP theory [44]. The SHAP framework objectively distributes benefits by considering each feature’s marginal contribution.
Boruta. As detailed by Kursa and Rudnicki (2010), the Boruta algorithm is a wrapper feature selection method utilizing random forest [45]. It evaluates candidate features alongside shadow features to determine all significant features related to the outcome.
BorutaSHAP. Building on the Boruta algorithm, BorutaSHAP, as described by Keany (2020), uses randomly shuffled shadow features. It improves upon Boruta by integrating Shapley values and an optimized Shap TreeExplainer, tailored specifically for tree-based models [46].

3.3. Embedded Method

The embedded method represents a hybrid approach that amalgamates the benefits of both filter and wrapper techniques. It learns directly from each feature, identifying and selecting those that significantly enhance the model’s accuracy. This method refines the training process by selectively incorporating features with non-zero coefficients, thus efficiently training the model while concurrently reducing its complexity [47,48].
Embedded Random Forest. Utilizing the Random Forest algorithm, this method assesses the significance of features and conducts feature selection based on these assessments [49].
Embedded LightGBM. By exploiting LightGBM’s streamlined architecture and rapid learning capabilities, this method involves training the model and determining the importance of each feature. In this process, it methodically discards features of low significance, thus selectively retaining only those crucial for substantial contributions to the model’s efficacy.
Embedded LASSO. This technique employs an absolute value-based penalty within the regularization term of a regression model. This effectively minimizes the model’s complexity and mitigates the risk of overfitting [50].

3.4. Ensemble Method

The ensemble technique employed in this study is based on a voting system that incorporates the Borda count and reciprocal rank methods [20]. This paper integrates the feature sets derived from all feature selection algorithms into rankings or ordinal orders.
Borda Count. As a preference-based voting method, the Borda count allocates scores to each candidate according to their rank order, ultimately selecting the candidate with the highest aggregate score [51]. Essentially, the more significant a feature is, the higher its ranking score will be.
The formula of Borda count is as follows:
r f = j = 1 N r j ( f )
In this formula, N represents the number of techniques of feature selection, and r j ( f ) denotes the rank of the feature obtained from the j th technique.
Reciprocal Rank. Reciprocal rank is a metric information retrieval method (Craswell, 2009) and is utilized to calculate the final rank r f for feature f [52]. This metric is equivalent to the harmonic mean rank and is also known as inverse rank position (IRP) [20]. The reciprocal rank is computed as follows, with the symbols having the same meanings as those in the Borda count formula.
r f = 1 j = 1 N 1 r j ( f )

4. Empirical Study

We conducted an empirical study to ascertain whether our proposed Dynamic Feature Selection System (DFSS) yields feature selection algorithms that exhibit optimal performance and stability across different sectors. The comprehensive process of DFSS is illustrated in Figure 1 below.
DFSS initiates by identifying the specific sector for which feature selection is to be conducted, followed by the collection of relevant data for that sector. Subsequently, the collected data undergo a performance evaluation using a range of feature selection algorithms to determine the most effective combination. Ultimately, based on the outcomes of this performance evaluation, rankings are assigned to discern the optimal feature combination.

4.1. Data Preprocessing

DFSS facilitates the collection and preprocessing of crucial data for the chosen sector, enabling their integration into the prediction models. The experiments were executed across ten sectors, adhering to the FnGuide industry classification standard (FICS). The sectors selected encompass energy, materials, industrials, consumer discretionary, consumer staples, healthcare, financials, information technology (IT), communication services, and utilities. Data collection was tailored to amass features that provided comprehensive information, thereby allowing the prediction model to forecast the direction of the index accurately.
For each sector, data encompassing six primary classes—price indicators, technical indicators, economic indicators, financial indicators, fundamental indicators, and market sentiment indicators—were meticulously gathered, incorporating a total of 67 features. A detailed list of these variables is presented in Table 1. The news sentiment index was computed using the Koelectra-base-finetuned model, which quantifies news data for the respective sector on a scale from 0 to 1.
The proposed DFSS analyzes data from the last three years to determine the optimal feature combination at each point, considering both accurate performance and stability. The empirical study utilized data from 1 March 2020 to 31 March 2022.

4.2. Performance Evaluation

Performance evaluation of various combinations of feature selection algorithms was conducted using preprocessed data. Four types of variable selection algorithms—filter, wrapper, embedded, and ensemble—were employed, incorporating a comprehensive set of 16 variable selection algorithms as detailed in Section 3. Their performances were subsequently compared for evaluation. To determine the contribution of the proposed algorithm to the improvement in prediction performance, the benchmark model, No Feature Selection (NOFS), was utilized. NOFS evaluates prediction performance by extracting non-repeating features from the entire feature set at random based on the feature selection percentile.
For each algorithm, we varied the “feature selection percentile”, “look-back size”, and “window size”, measuring the classification performance on the rise or fall of the sector index during the test period using models trained in the training period. We compared “feature selection percentiles” at 10%, 20%, 30%, 50%, and 70%. Additionally, we explored “look-back sizes” of Lag 1, Lag 5, and Lag 10. The “window sizes” for the train-test period included 3 months–1 month, 6 months–2 months, 12 months–4 months, and 18 months–6 months. As a result, performance measurements were conducted for a total of 60 combinations for each of the 16 feature selection algorithms.
The “look-back size” refers to using data from time t to t-n time points to predict the direction at time t + 1. Lag 1 predicts the direction using data from only the previous day, lag 5 uses data from one week ago, and lag 10 uses data from two weeks ago. The “window size” and test period maintained a 3:1 ratio, with window sizes varying from 3 to 18 months for training. A dataset was selected for each “window size”, with 22 datasets over 3 months, 18 datasets over 6 months, 10 datasets over 12 months, and 2 datasets over 18 months used for evaluation.
Prediction models used for evaluation are Bagging-based Random Forest, Boosting-based Light GBM (LGBM), commonly used in time series prediction, and LSTM-based neural networks. To measure the model’s performance, classification metrics such as accuracy, precision, recall, F1 Score, AUC, and specificity were calculated and averaged.

4.3. Rank Comparison

The evaluation of performance and stability is carried out by examining the average ranking and standard deviation of the 60 outcomes derived from varying the “feature selection percentile”, “look-back size”, and “window size” across the 16 feature selection algorithms. This approach is designed to ascertain the optimal feature selection results. The results garnered from this process facilitate the identification of the most suitable feature selection algorithm for the current sector, allowing for an examination of the feature class percentages within the optimal feature selection combination. Likewise, calculating the average rank of feature importance aids in assessing the significance of each feature, thereby augmenting the interpretability and predictive accuracy of the model. The insights obtained from the Dynamic Feature Selection System (DFSS) enhance the understanding of effective feature selection algorithms and the relevance of each feature for the specified sector at the present time. Moreover, by determining which feature class has a greater prevalence in predictions and comparing the outcomes across various combinations, it becomes possible to draw stable and reliable conclusions.

5. Experimental Results

In this section, we present the results of the conducted experiments to demonstrate the utility of the DFSS. Section 5.1 and Section 5.2 describe and interpret the outputs achievable through DFSS, while Section 5.3 demonstrates the dynamic nature of the system.

5.1. Average Results across All Sectors in DFSS

We develop effective feature selection algorithms for the stock market by analyzing the average results across all sectors. Figure 2 and Table 2 illustrate visual representations and tabulations of these average outcomes for all sectors using the Dynamic Feature Selection System (DFSS). These averages are computed from 600 results obtained by varying feature selection percentiles, look-back sizes, and window sizes for each sector, reflecting the performance and stability of the algorithms.
The performance comparison of these algorithms was conducted against a benchmark of random feature sampling (No Feature Selection, NOFS). An algorithm is deemed superior to NOFS in terms of average performance and stability if its average result is positioned in the upper right corner relative to the NOFS result. The findings indicate that, on average, wrapper-based algorithms demonstrate high performance and stability in forecasting stock prices in domestic sectors. In contrast, filter methods show markedly lower performance and stability. This can be attributed to their limitation of considering only univariate correlations, as opposed to multivariate ones. Ensemble and embedded methods exhibit marginally lower performance. Based on the high performance of the predictive model, the wrapper model, as known, demonstrated the highest performance. Ultimately, by balancing both stability and performance, the wrapper-based SHAP algorithm is identified as the optimal feature selection method.

5.2. Results for Each Sector in DFSS

The optimal feature selection algorithms and combinations for each sector were determined by analyzing their average results. Additionally, the importance and proportion of feature classes in each sector were assessed. Table 3 presents a summary of the optimal outcomes for each sector, reflecting the average results from 60 experimental configurations per sector. Consistent with the overall results, the wrapper method exhibits the best performance in four out of ten sectors. Intriguingly, despite its generally lower performance, the filter method proves effective in three out of ten sectors. It is noteworthy that no sector demonstrated optimal results with the ensemble method, possibly due to the influence of outliers within the algorithm’s impact. In the majority of sectors, price and market sentiment indicators are commonly included, with market sentiment often emerging as the most significant. This indicates that, typically, price is a secondary feature, while market sentiment plays a primary role (considering price’s high inclusion rate but relatively lower significance). Most sectors exhibit an optimal set of features. However, in the sectors of communication services and utilities, a random selection approach yielded the best results. This could be ascribed to both sectors being highly regulated and less affected by economic fluctuations, as they provide essential services. Such characteristics impact the profitability and operations of companies within these sectors.
Figure 3 presents graphs summarizing the average results for each sector, illustrating the performance and stability outcomes of various algorithms. These results indicate distinct patterns of algorithmic superiority in different sectors. In the energy and healthcare sectors, aligning with the general sector results, the wrapper method exhibits high performance. In contrast, in the materials and consumer staples sectors, the filter method shows higher performance, despite its relative ineffectiveness in other sectors.
Table 4 details the optimal feature sets for the materials, consumer discretionary, and financial sectors. Results for all sectors are compiled in Appendix A. The interpretations of these results are as follows:
Material: All price features are included, with technical and financial indicators following. The most significant factors, in descending order, are financial, price, and technical indicators. This implies that the materials sector is profoundly influenced by financial indicators such as currencies, government bonds, market indices, and short-term price trends, alongside daily price movements.
Consumer Discretionary: Indicators are evenly distributed, with financial, price, and market sentiment indicators being the most prominent. The order of significance, with market sentiment, technical analysis, and economic factors leading, suggests that, in the consumer discretionary sector, financial indicators moderately impact stock prices. Market sentiment and short-term price trends, coupled with long-term economic conditions, have a more pronounced role.
Financial: Market sentiment and price features are fully included, with technical indicators constituting over 90%. The prominence of technical, economic, and price factors indicates that, in the financial sector, market sentiment has a lesser influence, and the sector is mainly affected by price variations, both in the short term and in relation to the overall economic conditions.
As shown in the results, the DFSS identifies the feature selection algorithms that demonstrate optimal performance and stability for each sector at any given time. It involves a process of selecting feature sets in these instances, thereby reflecting market fluctuations.

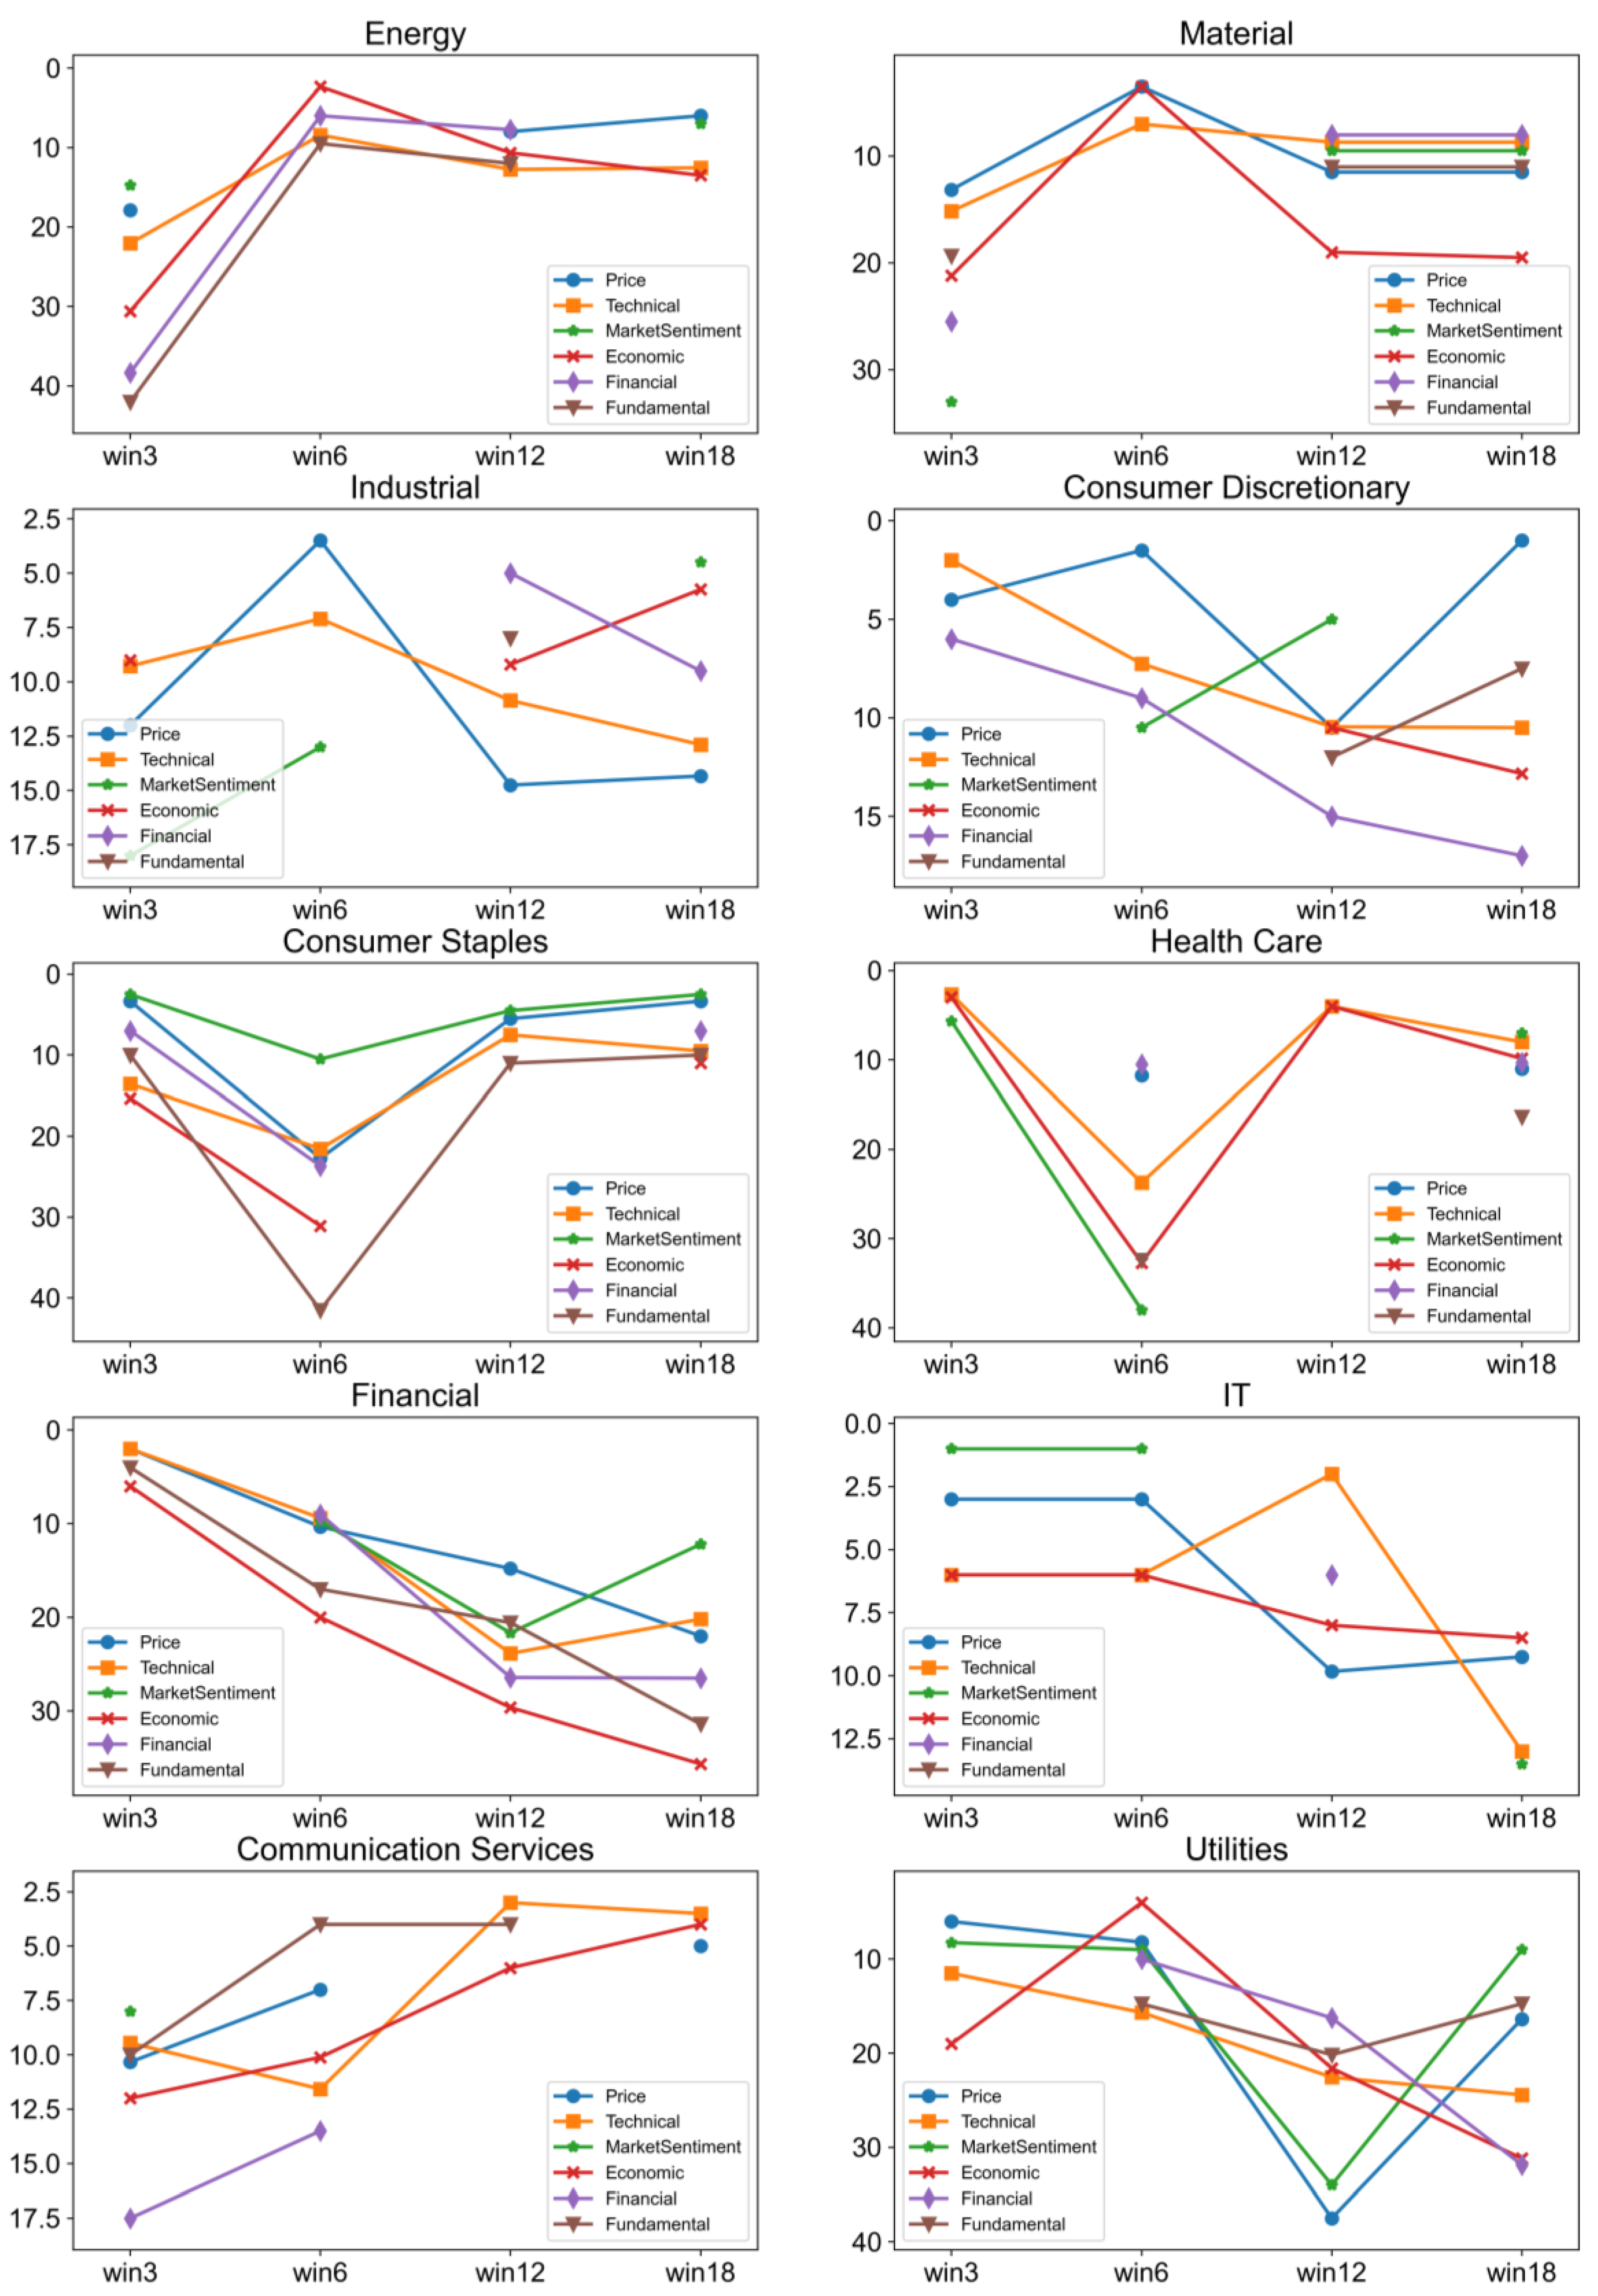
5.3. The Dynamic Nature of DFSS

We assessed the effectiveness of the DFSS in capturing temporal changes. This entailed identifying the optimal feature selection algorithms, their respective sets, and the contributions and percentages of feature classes for each sector over time. Table 5 displays the dynamic adjustments in the optimal feature sets for each sector across various time periods. The table demonstrates that the algorithms yielding optimal performance, along with their corresponding feature sets, differ for each sector over the timeline. This observation underscores the DFSS’s capability to dynamically adjust the optimal feature sets at specific time points.
Figure 4 and Figure 5 depict the evolution of feature class inclusion percentages and feature importance rankings within the DFSS over time. Specifically, Figure 4 illustrates that, with the exception of the consumer staples and healthcare sectors, the trends in the inclusion rates of feature classes in other sectors vary over time. This suggests that the consumer staples and healthcare sectors, being essential consumption markets, exhibit less significant variability in the trends of feature inclusion. Additionally, Figure 5 reveals that there is minimal or no variation in the trends of feature importance across almost all sectors over time. This implies that the DFSS effectively mirrors the impact of certain well-established factors in the real world.
Consequently, DFSS ultimately demonstrates itself as a real-time system that dynamically calculates the optimal percentage of feature sets for each sector over time. This is evidenced by the fact that the trends in importance do not vary, indicating that the system does not randomly determine these percentages.

6. Conclusions

In this paper, we propose the Dynamic Feature Selection System (DFSS) for predicting stock prices in ten major Korean FICS industry sectors. The DFSS employs 16 different feature selection algorithms, focusing on both performance and stability. Our experimental results show that the DFSS generally outperforms random feature selection in both areas. The optimal performance algorithms and their corresponding feature sets vary across sectors, and the percentage of features included changes over time within the same sector. These findings are corroborated in Section 5.3, demonstrating the model’s capability to capture temporal variations and determine sector-specific optimal features. This aspect was previously overlooked in existing research. Integrating DFSS into stock algorithm trading systems could enhance their sophistication and aid investors by providing reliable, dynamically updated information.
Future research could enhance the system’s performance by employing Attention or GAN-based feature selection methods, which are increasingly prevalent in AI. Additionally, the model could be applied to various financial markets, such as futures, options, bonds, and real estate, as well as tested in diverse countries like the United States and China to evaluate its robustness.

Author Contributions

Investigation, W.K., J.J., M.J. and S.K.; Software, W.K.; Formal analysis, W.K. and J.J.; Writing-original draft, W.K., J.J., M.J. and S.K.; Writing-review & editing, W.K., H.L., S.Y. and J.A.; Supervision, H.L., S.Y. and J.A.; Resources, J.A. All authors have read and agreed to the published version of the manuscript.

Funding

This work was supported by a National Research Foundation of Korea (NRF) grant funded by the Korean government (MSIT) (No. 2021R1A2C1094211).

Institutional Review Board Statement

Not applicable.

Informed Consent Statement

Not applicable.

Data Availability Statement

Restrictions apply to the availability of these data. Data were obtained from FnGuide and are available at https://dataguide.fnguide.com/ (accessed on 20 July 2024) with the permission of FnGuide.

Conflicts of Interest

The authors declare no conflict of interest.

Appendix A

Table A1. Optimal feature set by ten sectors.
Energy
Feature ClassPercentageFeature ClassAverage Importance Ranking of Feature
Price0.500Economic2.000
Technical0.500Market Sentiment8.500
Market Sentiment0.400Technical10.727
Financial0.286Price10.750
Economic0.059Financial15.000
Fundamental0Fundamental-
Material
Feature ClassPercentageFeature ClassAverage Importance Ranking of Feature
Price1Financial10.500
Technical0.591Price11.000
Financial0.571Technical17.769
Fundamental0.500Economic23.800
Economic0.294Fundamental28.750
Market Sentiment0Market Sentiment-
Industrial
Feature ClassPercentageFeature ClassAverage Importance Ranking of Feature
Market Sentiment0.800Market Sentiment4.250
Price0.625Financial10.000
Technical0.455Technical11.800
Financial0.143Price13.000
Economic0Economic-
Fundamental0Fundamental-
Consumer Discretionary
Feature ClassPercentageFeature ClassAverage Importance Ranking of Feature
Financial0.286Market Sentiment2.000
Price0.250Technical5.750
Market Sentiment0.200Economic6.667
Technical0.182Fundamental8.000
Economic0.176Price8.500
Fundamental0.125Financial10.500
Consumer Staples
Feature ClassPercentageFeature ClassAverage Importance Ranking of Feature
Market Sentiment0.600Price5.333
Price0.375Technical6.333
Technical0.273Market Sentiment9.000
Financial0.143Financial10.000
Economic0Economic-
Fundamental0Fundamental-
Health Care
Feature ClassPercentageFeature ClassAverage Importance Ranking of Feature
Price0.250Economic1.000
Market Sentiment0.200Market Sentiment3.000
Technical0.136Technical3.667
Economic0.059Price6.500
Financial0Financial-
Fundamental0Fundamental-
Financial
Feature ClassPercentageFeature ClassAverage Importance Ranking of Feature
Market Sentiment1Technical19.050
Price1Economic22.667
Technical0.909Price26.000
Economic0.529Financial29.333
Financial0.429Market Sentiment31.800
Fundamental0.250Fundamental44.000
IT
Feature ClassPercentageFeature ClassAverage Importance Ranking of Feature
Market Sentiment0.400Price1.500
Price0.250Technical4.000
Technical0.136Market Sentiment6.500
Economic0Economic-
Financial0Financial-
Fundamental0Fundamental-
Communication Services (Random Selection)
Feature ClassPercentageFeature ClassAverage Importance Ranking of Feature
Price0.375Market Sentiment5.000
Fundamental0.250Economic6.000
Market Sentiment0.200Financial6.000
Economic0.176Technical6.000
Financial0.143Price7.333
Technical0.136Fundamental11.000
Utilities (Random Selection)
Feature ClassPercentageFeature ClassAverage Importance Ranking of Feature
Price0.375Market Sentiment5.000
Fundamental0.250Economic6.000
Market Sentiment0.200Financial6.000
Economic0.176Technical6.000
Financial0.143Price7.333
Technical0.136Fundamental11.000

References

  1. Sharaf, M.; Hemdan, E.E.D.; El-Sayed, A.; El-Bahnasawy, N.A. StockPred: A framework for stock Price prediction. Multimed. Tools Appl. 2021, 80, 17923–17954. [Google Scholar] [CrossRef]
  2. Jiang, W. Applications of deep learning in stock market prediction: Recent progress. Expert Syst. Appl. 2021, 184, 115537. [Google Scholar] [CrossRef]
  3. Contreras, J.; Espinola, R.; Nogales, F.J.; Conejo, A.J. ARIMA models to predict next-day electricity prices. IEEE Trans. Power Syst. 2003, 18, 1014–1020. [Google Scholar] [CrossRef]
  4. Adebiyi, A.A.; Ayo, C.K.; Adebiyi, M.; Otokiti, S.O. Stock price prediction using neural network with hybridized market indicators. J. Emerg. Trends Comput. Inf. Sci. 2012, 3, 1–9. [Google Scholar]
  5. Gupta, R.; Garg, N.; Singh, S. Stock market prediction accuracy analysis using kappa measure. In Proceedings of the IEEE 2013 International Conference on Communication Systems and Network Technologies, Gwalior, India, 6–8 April 2013; pp. 635–639. [Google Scholar]
  6. Wen, F.; Xiao, J.; He, Z.; Gong, X. Stock price prediction based on SSA and SVM. Procedia Comput. Sci. 2014, 31, 625–631. [Google Scholar]
  7. Girish, G.P. Spot electricity price forecasting in Indian electricity market using autoregressive-GARCH models. Energy Strategy Rev. 2016, 11, 52–57. [Google Scholar] [CrossRef]
  8. Khare, K.; Darekar, O.; Gupta, P.; Attar, V.Z. Short term stock price prediction using deep learning. In Proceedings of the 2017 2nd IEEE International Conference on Recent Trends in Electronics, Information & Communication Technology (RTEICT), Bangalore, India, 19–20 May 2017; pp. 482–486. [Google Scholar]
  9. Fama, E.F. Random walks in stock market prices. Financ. Anal. J. 1995, 51, 75–80. [Google Scholar] [CrossRef]
  10. Lee, J.W. Stock price prediction using reinforcement learning. In ISIE 2001, Proceedings of the 2001 IEEE International Symposium on Industrial Electronics Proceedings (Cat. No. 01TH8570), Pusan, Republic of Korea, 12–16 June 2001; IEEE: New York, NY, USA, 2001; Volume 1, pp. 690–695. [Google Scholar]
  11. Vaiz, J.S.; Ramaswami, M. A study on technical indicators in stock price movement prediction using decision tree algorithms. Am. J. Eng. Res. (AJER) 2016, 5, 207–212. [Google Scholar]
  12. Agrawal, M.; Khan, A.U.; Shukla, P.K. Stock price prediction using technical indicators: A predictive model using optimal deep learning. Learning 2019, 6, 7. [Google Scholar] [CrossRef]
  13. Naik, N.; Mohan, B.R. Optimal feature selection of technical indicator and stock prediction using machine learning technique. In Emerging Technologies in Computer Engineering: Microservices in Big Data Analytics: Second International Conference, ICETCE 2019, Jaipur, India, 1–2 February 2019; Revised Selected Papers 2; Springer: Singapore, 2019; pp. 261–268. [Google Scholar]
  14. Islam, M.R.; Nguyen, N. Comparison of financial models for stock price prediction. J. Risk Financ. Manag. 2020, 13, 181. [Google Scholar] [CrossRef]
  15. Han, T. Stock Price Prediction Using LSTM: Focusing on the Combination of Technical Indicators, Macroeconomic Indicators, and Market Sentiment. Soc. Converg. Knowl. Trans. 2021, 9, 189–198. [Google Scholar]
  16. Sayavong, L.; Wu, Z.; Chalita, S. Research on stock price prediction method based on convolutional neural network. In Proceedings of the IEEE 2019 International Conference on Virtual Reality and Intelligent Systems (ICVRIS), Jishou, China, 14–15 September 2019; pp. 173–176. [Google Scholar]
  17. Park, K.; Shin, H. Stock price prediction based on a complex interrelation network of economic factors. Eng. Appl. Artif. Intell. 2013, 26, 1550–1561. [Google Scholar] [CrossRef]
  18. Fang, Z.; Ma, X.; Pan, H.; Yang, G.; Arce, G.R. Movement forecasting of financial time series based on adaptive LSTM-BN network. Expert Syst. Appl. 2023, 213, 119207. [Google Scholar] [CrossRef]
  19. Nam, K.; Seong, N. Financial news-based stock movement prediction using causality analysis of influence in the Korean stock market. Decis. Support Syst. 2019, 117, 100–112. [Google Scholar] [CrossRef]
  20. Effrosynidis, D.; Arampatzis, A. An evaluation of feature selection methods for environmental data. Ecol. Inform. 2021, 61, 101224. [Google Scholar] [CrossRef]
  21. Cateni, S.; Colla, V.; Vannucci, M. A hybrid feature selection method for classification purposes. In Proceedings of the IEEE 2014 European Modelling Symposium, Pisa, Italy, 21–23 October 2014; pp. 39–44. [Google Scholar]
  22. Fernandes, M.; Canito, A.; Bolón-Canedo, V.; Conceição, L.; Praça, I.; Marreiros, G. Data analysis and feature selection for predictive maintenance: A case-study in the metallurgic industry. Int. J. Inf. Manag. 2019, 46, 252–262. [Google Scholar] [CrossRef]
  23. Benkessirat, A.; Benblidia, N. Fundamentals of feature selection: An overview and comparison. In Proceedings of the 2019 IEEE/ACS 16th International Conference on Computer Systems and Applications (AICCSA), Abu Dhabi, United Arab Emirates, 3–7 November 2019; pp. 1–6. [Google Scholar]
  24. Meera, S.; Sundar, C. A hybrid metaheuristic approach for efficient feature selection methods in big data. J. Ambient Intell. Humaniz. Comput. 2021, 12, 3743–3751. [Google Scholar] [CrossRef]
  25. Khaire, U.M.; Dhanalakshmi, R. Stability of feature selection algorithm: A review. J. King Saud Univ.-Comput. Inf. Sci. 2022, 34, 1060–1073. [Google Scholar] [CrossRef]
  26. Tsai, C.F.; Hsiao, Y.C. Combining multiple feature selection methods for stock prediction: Union, intersection, and multi-intersection approaches. Decis. Support Syst. 2010, 50, 258–269. [Google Scholar] [CrossRef]
  27. Ni, L.P.; Ni, Z.W.; Gao, Y.Z. Stock trend prediction based on fractal feature selection and support vector machine. Expert Syst. Appl. 2011, 38, 5569–5576. [Google Scholar] [CrossRef]
  28. Yuan, X.; Yuan, J.; Jiang, T.; Ain, Q.U. Integrated long-term stock selection models based on feature selection and machine learning algorithms for China stock market. IEEE Access 2020, 8, 22672–22685. [Google Scholar] [CrossRef]
  29. Chaudhari, K.; Thakkar, A. Neural network systems with an integrated coefficient of variation-based feature selection for stock price and trend prediction. Expert Syst. Appl. 2023, 219, 119527. [Google Scholar] [CrossRef]
  30. Colla, V.; Matarese, N.; Reyneri, L.M. A method to point out anomalous input-output patterns in a database for training neuro-fuzzy system with a supervised learning rule. In Proceedings of the IEEE 2009 Ninth International Conference on Intelligent Systems Design and Applications, Pisa, Italy, 30 November–2 December 2009; pp. 1307–1311. [Google Scholar]
  31. Magnello, M.E. Karl Pearson and the origins of modern statistics: An elastician becomes a statistician. N. Z. J. Hist. Philos. Sci. Technol. 2005, 1. [Google Scholar]
  32. Thaseen, I.S.; Kumar, C.A.; Ahmad, A. Integrated intrusion detection model using chi-square feature selection and ensemble of classifiers. Arab. J. Sci. Eng. 2019, 44, 3357–3368. [Google Scholar] [CrossRef]
  33. Kraskov, A.; Stögbauer, H.; Grassberger, P. Estimating mutual information. Phys. Rev. E 2004, 69, 066138. [Google Scholar] [CrossRef] [PubMed]
  34. Estévez, P.A.; Tesmer, M.; Perez, C.A.; Zurada, J.M. Normalized mutual information feature selection. IEEE Trans. Neural Netw. 2009, 20, 189–201. [Google Scholar] [CrossRef] [PubMed]
  35. Rutherford, A. ANOVA and ANCOVA: A GLM Approach; John Wiley & Sons: Hoboken, NJ, USA, 2011. [Google Scholar]
  36. Elssied, N.O.F.; Ibrahim, O.; Osman, A.H. A novel feature selection based on one-way anova f-test for e-mail spam classification. Res. J. Appl. Sci. Eng. Technol. 2014, 7, 625–638. [Google Scholar] [CrossRef]
  37. Fida, M.A.F.A.; Ahmad, T.; Ntahobari, M. Variance threshold as early screening to Boruta feature selection for intrusion detection system. In Proceedings of the IEEE 2021 13th International Conference on Information & Communication Technology and System (ICTS), Virtual, 20–21 October 2021; pp. 46–50. [Google Scholar]
  38. Hart, P.E.; Stork, D.G.; Duda, R.O. Pattern Classification; Wiley: Hoboken, NJ, USA, 2000. [Google Scholar]
  39. Gu, Q.; Li, Z.; Han, J. Generalized fisher score for feature selection. arXiv 2012, arXiv:1202.3725. [Google Scholar]
  40. Raj, D.D.; Mohanasundaram, R. An efficient filter-based feature selection model to identify significant features from high-dimensional microarray data. Arab. J. Sci. Eng. 2020, 45, 2619–2630. [Google Scholar] [CrossRef]
  41. Kohavi, R.; John, G.H. The wrapper approach. In Feature Extraction, Construction and Selection: A Data Mining Perspective; Springer: Boston, MA, USA, 1998; pp. 33–50. [Google Scholar]
  42. Gregorutti, B.; Michel, B.; Saint-Pierre, P. Correlation and variable importance in random forests. Stat. Comput. 2017, 27, 659–678. [Google Scholar] [CrossRef]
  43. Breiman, L. Random forests. Mach. Learn. 2001, 45, 5–32. [Google Scholar] [CrossRef]
  44. Lundberg, S.M.; Lee, S.I. A unified approach to interpreting model predictions. Adv. Neural Inf. Process. Syst. 2017, 30, 4768–4777. [Google Scholar]
  45. Kursa, M.B.; Rudnicki, W.R. Feature selection with the Boruta package. J. Stat. Softw. 2010, 36, 1–13. [Google Scholar] [CrossRef]
  46. Keany, E. BorutaShap: A Wrapper Feature Selection Method Which Combines the Boruta Feature Selection Algorithm with Shapley Values; Zenodo: Geneva, Switzerland, 2020. [Google Scholar]
  47. Zhu, J.; Shan, Y.; Mao, J.C.; Yu, D.; Rahmanian, H.; Zhang, Y. Deep embedding forest: Forest-based serving with deep embedding features. In Proceedings of the 23rd ACM SIGKDD International Conference on Knowledge Discovery and Data Mining, Halifax, NS, USA, 13–17 August 2017; pp. 1703–1711. [Google Scholar]
  48. Hua, Y. An efficient traffic classification scheme using embedded feature selection and lightgbm. In Proceedings of the IEEE 2020 Information Communication Technologies Conference (ICTC), Nanjing, China, 29–31 May 2020; pp. 125–130. [Google Scholar]
  49. Saeys, Y.; Abeel, T.; Van de Peer, Y. Robust feature selection using ensemble feature selection techniques. In Machine Learning and Knowledge Discovery in Databases: European Conference, ECML PKDD 2008, Antwerp, Belgium, 15–19 September 2008; Proceedings, Part II 19; Springer: Berlin/Heidelberg, Germany, 2008; pp. 313–325. [Google Scholar]
  50. Hameed, S.S.; Petinrin, O.O.; Hashi, A.O.; Saeed, F. Filter-wrapper combination and embedded feature selection for gene expression data. Int. J. Adv. Soft Compu. Appl 2018, 10, 90–105. [Google Scholar]
  51. Emerson, P. The original Borda count and partial voting. Soc. Choice Welf. 2013, 40, 353–358. [Google Scholar] [CrossRef]
  52. Craswell, N. Mean Reciprocal Rank. In Encyclopedia of Database Systems; Springer: New York, NY, USA, 2009; p. 1703. [Google Scholar]
Figure 1. DFSS Process.
Applsci 14 07314 g001
Figure 2. Average results across all sectors in DFSS (red box is a feature selection algorithm with a high friedman rank compared to a low standard deviation).
Applsci 14 07314 g002
Figure 3. Results for each of ten sectors in DFSS (red box is a feature selection algorithm with a high friedman rank compared to a low standard deviation).
Applsci 14 07314 g003
Figure 4. Dynamic adjustment of the percentage of feature classes across timeline.
Applsci 14 07314 g004
Figure 5. Dynamic adjustment of the important features across timeline.
Applsci 14 07314 g005
Table 1. Features collected in DFSS.
TypeFeature
Technical
Indicators
Moving Average Convergence Divergence (MACD), On-Balance Volume (OBV), Commodity Channel Index (CCI), Relative Strength Index (RSI), Stochastic Oscillator D%/K%, Stochastic Oscillator, Disparity Index, Moving Average (5,20,60,120), Bollinger Band (h, l), Average Directional Index (ADX), Accumulation Distribution Index (ADI), Force Index (FI), Money Flow Index (MI), True Strength Index (TSI), Market Facilitation Index (MFI), Williams %R Awesome Oscillator, Rate of Change (ROC)
Economic
Indicators
Exchange Rate (KRW-USD), Exchange Rate (KRW-EUR), Exchange Rate (KRW-JPY), Exchange Rate (KRW-CNY), International Gold Price Monthly, Economic Sentiment Index Monthly, Oil Prices (Crude, Diesel, Gasoline) Monthly, Gross Domestic Product (GDP)_Yearly, Employed Persons Monthly, Unemployed Persons Monthly, Consumer/Producer Price Index, Import/Export Price Index, Housing Sales Price Index Monthly
Price
Indicators
Volume, Daily OHLC (Open, High, Low, Close), Individual/Institution/Foreigner Quantity
Financial
Indicators
Certificate of Deposit (CD) (3 months), Monetary Stability, Government Bonds, M1 Monthly, M2 Monthly, Lf Monthly, KOSPI Index Monthly
Fundamental
Indicators
Sales per Share (SPS), Operating Profit per Share (OPS), Earnings per Share (EPS), Book Value per Share (BPS), Price-to-Earnings Ratio (PER), Price-to-Book Ratio (PBR), Return on Assets (ROA), Return on Equity (ROE Quarterly)
Market
Sentiment
Indicators
Google Trends Search Volume Weekly, News Sentiment Index,
Naver DataLab Company Name Search Index
Table 2. Average results in rank mean’s descending order across all sectors in DFSS.
ModelMethodRank MeanRank STD
SHAPWrapper7.2224.3
BorutaSHAPWrapper7.4534.483
RFEWrapper7.4684.407
NOFSRandom Selection7.6084.678
Embedded Random ForestEmbedded7.6284.341
Borda CountEnsemble8.1174.406
Embedded LightGBMEmbedded8.1374.591
Mutual InformationFilter8.3684.913
Variance ThresholdFilter8.6874.68
Permutation ImportanceWrapper8.7684.618
ANOVA F-valueFilter8.8784.654
Reciprocal RankEnsemble9.1634.618
MultiSURFFilter9.1854.744
Fisher ScoreFilter9.5804.610
Embedded LassoEmbedded9.6834.622
Chi2Filter11.0584.849
BorutaWrapper14.6503.543
Table 3. Results of the first ranked feature class analysis by sector.
SectorAlgorithm
(Feature Count)
Method1st Ranked Feature Class by Percentage (%)1st Ranked Feature Class in Feature Importance
EnergyRFE (20)WrapperPrice (50)Economic
MaterialVariance Threshold (34)FilterPrice (100)Financial
IndustrialANOVA F-value (20)FilterMarket Sentiment (80)Market Sentiment
Consumer DiscretionaryMutual Information (13)FilterFinancial
(28.6)
Market Sentiment
Consumer StaplesSHAP (13)WrapperMarket Sentiment (60)Price
Health CareEmbedded Random Forest (7)EmbeddedPrice (25)Economic
FinancialSHAP (47)WrapperMarket Sentiment (100)Technical
ITRFE (7)WrapperMarket Sentiment (40)Price
Communication ServicesNOFS (13)Random SelectionPrice (37.5)Market Sentiment
UtilitiesNOFS (13)Random SelectionPrice (37.5)Market Sentiment
Table 4. Optimal feature set of material, consumer discretionary, and financial sectors.
Material
Feature ClassPercentageFeature ClassAverage Importance Ranking of Feature
Price1Financial10.500
Technical0.591Price11.000
Financial0.571Technical17.769
Fundamental0.500Economic23.800
Economic0.294Fundamental28.750
Market Sentiment0Market Sentiment-
Consumer Discretionary
Feature ClassPercentageFeature ClassAverage Importance Ranking of Feature
Financial0.286Market Sentiment2.000
Price0.250Technical5.750
Market Sentiment0.200Economic6.667
Technical0.182Fundamental8.000
Economic0.176Price8.500
Fundamental0.125Financial10.500
Financial
Feature ClassPercentageFeature ClassAverage Importance Ranking of Feature
Market Sentiment1Technical19.050
Price1Economic22.667
Technical0.909Price26.000
Economic0.529Financial29.333
Financial0.429Market Sentiment31.800
Fundamental0.250Fundamental44.000
Table 5. Dynamic adjustment of feature set across the timeline.
SectorWin3Win6Win12Win18
1st
Algorithm
1st
Score
1st
Algorithm
1st
Score
1st
Algorithm
1st
Score
1st
Algorithm
1st
Score
EnergyERF (47)0.4938BSHAP (13)0.5014BC (20)0.5428ERF (20)0.5567
MaterialMSURF (34)0.5114BC (7)0.6503RFE (20)0.5188RFE (20)0.5824
IndustrialRFE (20)0.4933PI (13)0.5076MI (20)0.5182ELGBM (20)0.5926
Consumer
Discretionary
VT (7)0.4906ERF (13)0.4858BSHAP (20)0.5051PI (20)0.5426
Consumer
Staples
MSURF (20)0.4921SHAP (47)0.5032BSHAP (13)0.5349MSURF (13)0.5524
Health CareELGBM (7)0.4777VT (47)0.4892SHAP (7)0.5214MI (20)0.5434
FinancialPI (7)0.5403BSHAP(20)0.5322ELASSO (34)0.5511BSHAP (47)0.6153
ITMI (7)0.5215MI (7)0.5220VT (13)0.5467RR (20)0.5792
Communication ServicesBSHAP (20)0.4793RR (20)0.4995ELGBM (7)0.5467RFE (7)0.5689
UtilitiesSHAP (20)0.4705ELGBM (20)0.5107MSURF (47)0.5467ELGBM (47)0.5745
Disclaimer/Publisher’s Note: The statements, opinions and data contained in all publications are solely those of the individual author(s) and contributor(s) and not of MDPI and/or the editor(s). MDPI and/or the editor(s) disclaim responsibility for any injury to people or property resulting from any ideas, methods, instructions or products referred to in the content.

