Article

Comparison of Four Rapid N-Glycan Analytical Methods and Great Application Potential in Cell Line Development

1
College of Biotechnology and Pharmaceutical Engineering, Nanjing Tech University, Nanjing 211816, China
2
School of Pharmaceutical Sciences, Nanjing Tech University, Nanjing 211816, China
*
Author to whom correspondence should be addressed.
Appl. Sci. 2024, 14(16), 7320; https://doi.org/10.3390/app14167320
Submission received: 6 July 2024 / Revised: 9 August 2024 / Accepted: 18 August 2024 / Published: 20 August 2024

Abstract

:
N-glycan, a critical quality attribute (CQA) of monoclonal antibodies, profoundly impacts potency, immunogenicity, safety, and clinical efficiency. Therefore, N-glycan should be monitored and controlled during development. The conventional 2-AB method is considered the gold standard for N-glycan analysis, which is labor intensive and time consuming. Moreover, its sample requirement is relatively high and cannot be met in early-stage development, including cell line development. In this study, we compared the performance of four rapid analytical methods in N-glycan analysis of mAbs, including the rapid 2-AB method, reduction method, off-line IdeS digestion method, and two-dimensional liquid chromatography-mass spectrometry (2D-LC-MS) method. Our results showed that these four rapid analytical methods could provide comparable N-glycan data. Moreover, these four rapid methods shortened the testing time for the conventional 2-AB method from days to just minutes. They also reduced the sample requirement for the conventional 2-AB method from milligrams to micrograms. Among these four rapid methods, the 2D-LC-MS method demonstrated great potential for applications in time-consuming cell line development because it required less testing time and a lower sample requirement.

1. Introduction

Monoclonal antibodies (mAbs) are the most promising sector in the pharmaceutical industry and five of the top ten best-selling drugs in 2023 were mAbs [1]. Due to their high target specificity, good clinical efficiency, long serum half-life, and the capability to be produced routinely with consistency, the annual growth rate of the global mAbs market is projected to be approximately 15% in the next decade [2,3,4].
N-glycan is one of the most common post-translational modifications (PTMs) of mAbs, and glycans can be attached to the asparagine conserved sequon of Asn-Xaa-Ser/Thr (where Xaa is any amino acid except proline) at the CH2 domain of the Fc fragment [5]. N-linked glycans are classified into high-mannose, hybrid, and complex types [6]. The mAbs from different host systems show different N-glycan profiles. Currently, the majority of mAbs are expressed in Chinese Hamster Ovary (CHO) cells, generally with complex type biantennary oligosaccharides as the major species. These glycans usually have a core fucose and a bisecting N-acetylglucosamine with variation in the galactose and sialic acid content of the antennae [7,8]. N-glycan plays an essential role in effector functions and serum half-life. Afucosylation can enhance antibody-dependent cell cytotoxicity (ADCC) by increasing binding affinity to receptors present on the surface of leukocyte effector cells [9,10]. Galactosylation may increase complement-dependent cytotoxicity (CDC) [11,12]. Moreover, N-glycan plays a vital role in serum half-life. It is well known that high-mannose glycans accelerate clearance of mAbs from the blood, thereby shortening the circulating half-life in the bloodstream [13,14].
N-glycan is considered a critical quality attribute (CQA) for its potentially important impact on the safety, efficacy, pharmacokinetics, and pharmacodynamics of mAbs [15,16]. Therefore, N-glycan should be monitored and controlled at different stages, including cell line development, cell culture process, purification process, release testing, etc. The 2-aminobenzamide (2-AB) method is considered the gold standard for N-glycan analysis and is widely used in the mAbs industry for its high labelling efficiency and fluorescent response. However, the conventional 2-AB method is labor intensive and time consuming, usually taking several days to perform the whole testing, including glycan release by PNGase F, fluorescent labelling by 2-AB, subsequent purification, and testing [17]. There is an urgent demand for a rapid, accurate, and less sample-consuming method of N-glycan analysis to speed up the development of mAbs, especially in the process development steps that require plenty of N-glycan data. For instance, one of the most labor-intensive steps in the development of mAbs is the clone selection process of cell line development. To increase the likelihood of identifying rare clones with high titer and product quality attributes, hundreds of clones must be carried from single cell to relatively small-scale cell cultures [18], resulting in large workloads and a long time for quality attribute analysis, especially N-glycan analysis using the time-consuming conventional 2-AB method. Moreover, the cell culture scale is usually at the milliliter level per clone with low titer in the cell line development step [19]. Therefore, there are not enough protein samples for N-glycan analysis by means of the conventional 2-AB methods. In this situation, major N-glycans are the primary focus, and minor N-glycans should be removed from the CQA list. Analytical methods that provide major N-glycan data rapidly are key to the success of mAb development.
To this end, methods have been developed for rapid N-glycan analysis. Based on the principle of the conventional 2-AB method, rapid N-glycan release, labelling and purification steps have been successfully optimized to reduce the testing time to less than one day [6]. Liquid chromatography-mass spectrometry (LC-MS) for N-glycan analysis at intact protein level is rapid and indispensable in the mAb industry [6], which still suffers from the limitations in identifying paired glycoforms (such as G0F/G2F and 2 G1F, which could not be identified at intact protein level) [20] and low sensitivity at about 150 kDa molecular weight for mAbs [21]. The subunit level analysis by LC-MS is an alternative to intact protein level analysis and can mitigate the drawbacks of intact protein level analysis by reducing the molecular weight. Reduction by tris (2-carboxyethyl) phosphine (TCEP) or dithiothreitol (DTT) can generate heavy chains (HC, about 50 kDa) and light chains (LC, about 25 kDa) [6]. Digestion by IdeS can generate the F(ab’)2 subunit (about 100 kDa) and the Fc/2 subunit (about 25 kDa) [22,23]. Additionally, 2D-LC-MS has been developed for complex sample analysis with high efficiency in recent decades, and some cases have been reported for charge variant characterization of mAbs [24,25]. Recently, Genovis has launched a new immobilized IdeS-HPLC column, allowing a complete digestion of mAbs in only 10 min, which makes it possible to construct a 2D-LC-MS system with on-line IdeS digestion for rapid N-glycan analysis.
In this study, we compared the performance of four rapid N-glycan analytical methods in N-glycan analysis of mAbs, including the rapid 2-AB method, the reduction method, the off-line IdeS digestion method, and the 2D-LC-MS method with on-line immobilized IdeS digestion. We also made a comparison of protein sample requirement and testing time between these four rapid methods and the conventional 2-AB method, illustrating their great application potential in time-consuming cell line development.

2. Materials and Methods

2.1. Reagents

Formic acid, ammonium formate, DL-dithiothreitol (DTT), and ammonium bicarbonate were obtained from Sigma-Aldrich (St. Louis, MO, USA). Acetonitrile (CAN), 8 M guanidine hydrochloride, ammonium acetate, and phosphate buffered saline (PBS, pH 7.4) were obtained from Thermo Fisher Scientific (Waltham, MA, USA). IdeS enzyme was obtained from RHINO BIO (Shanghai, China). Glyco 2-AB Library, Glyco 2-AB Man5, Glyco 2-AB Man6, Glyco 2-AB G0F-GN, and AdvanceBio Gly-X N-Glycan Prep kit (including Gly-X Deglycosylation Module, Gly-X 2-AB Express Labeling Module, and Gly-X 2-AB Express Cleanup Module) were obtained from Agilent (Santa Clara, CA, USA). The two mAbs (mAb A and mAb B with ≥98% SEC purity) used in this study were from our lab.

2.2. Instruments

Agilent 1290 UHPLC (Waldbronn, Germany) equipped with a binary pump, an autosampler, an oven, and a fluorescence detector was used for the rapid 2-AB method. Agilent 1290 UHPLC coupled with 6545XT AdvanceBio Q-TOF (Singapore) was used for the reduction method and off-line IdeS digestion method. The Agilent 1290 UHPLC comprised a binary pump, an autosampler, an oven, and a UV detector. The mass spectrometer 6545XT AdvanceBio Q-TOF was a time-of-flight mass spectrometer instrument equipped with an Agilent JetStream electrospray ionization source. The 2D-LC-MS system consisting of an Agilent 1290 Infinity II UHPLC and a 6545XT AdvanceBio Q-TOF was used for 2D-LC-MS method with on-line immobilized IdeS digestion. The instrument modules were from the 1290 Infinity line of Agilent Technologies: first (1D) and second (2D) dimension binary pumps; autosampler, thermostated column compartments, and ultraviolet (UV) detector. The interface valve connecting the two dimensions of the system was set up with 20 µL sample loops made from 10 cm lengths of 0.0200 i.d. PEEK tubing. The mass spectrometer 6545XT AdvanceBio Q-TOF was the same as that used for the reduction method and off-line IdeS digestion method.
The instruments were controlled by MassHunter software V10.0. Data were processed by Agilent MassHunter BioConfirm V10.0. The theoretical MW was confirmed by Sequence Manger V10.0.

2.3. Rapid 2-AB Method

The conventional 2-AB method usually uses conventional reagents and approaches for glycan release, 2-AB labelling, and purification, which is time consuming and still widely used in mAb industry. In this study, the Agilent AdvanceBio Gly-X N-Glycan Prep kit was used for more rapid sample pretreatment than the conventional 2-AB method, referred to as the rapid 2-AB method. Firstly, a 40 microgram mAb sample was buffer exchanged and diluted to about 2 mg/mL. Then, denaturation, reduction, and deglycosylation (2 µL of PNGase F working solution: 40 µg antibody) were performed to release glycans from mAbs [26]. The following step was to load the sample onto a cleanup plate to collect the released glycans. The 2-AB labelling solution was added to a cleanup plate and incubated in the dark at 65 °C for 1 h for 2-AB labelling. Then, two purification steps were used to purify the 2-AB labelled glycans. Finally, the purified 2-AB labelled glycan samples were injected into UHPLC for glycan analysis.
Glycan BEH Amide column (130 Å, 2.1 × 150 mm, 1.7 μm) from Waters (Milford, MA, USA) was chosen for 2-AB labelled glycan analysis. The column temperature was set as 60 °C. A fluorescence detector was used for signal acquisition with excitation wavelength at 330 nm and emission wavelength at 420 nm. The mobile phase A was 100 mM ammonium formate buffer at pH 4.5, and the mobile phase B was acetonitrile. The gradient elution was decreased from 78% mobile phase B to 60% mobile phase B in 30 min, with a 5 min regeneration using 40% mobile phase B and a 20 min equilibration using 78% mobile phase B. The flow rate was 0.4 mL/min for gradient elution and equilibration while 0.2 mL/min for regeneration. The qualitative analysis of different glycans was based on the retention time of glycan standards. The percentage of different glycans was calculated from the relative fluorescence peak area.

2.4. Reduction Method

A 50 microgram mAb sample was treated with 1 μL solution (1 M DTT in 8 M guanidine hydrochloride) for 30 min at 56 °C, and then centrifuged at 13,000 rpm for 10 min. The treated sample (0.5 μL) was injected onto BioResolve RP mAb polyphenyl columns (Waters, Cat# 186008944, 2.1 mm × 50 mm, 2.7 µm) and analysis was performed using a binary gradient of 0.1% (v/v) formic acid in water (mobile phase A) and 0.1% (v/v) formic acid in acetonitrile (mobile phase B). The gradient conditions were as follows: 25% mobile phase B initially for 3 min, increased to 40% mobile phase B in 15 min with a further increase to 95% mobile phase B in 0.1 min and a 3 min isocratic hold for regeneration, at last change to 25% mobile phase B for re-equilibration. The column temperature was maintained at 75 °C and the flow rate was sustained at 0.4 mL/min. Hyphenated RP column was Q-TOF MS analysis at subunit level (HC, about 50 kDa). Data were acquired in positive mode with a mass range of 100–5000 m/z at a rate of 1 Hz. The fragmentor voltage was set as 225 V. The percentage of different glycans was calculated from the MS intensity.

2.5. Off-Line IdeS Digestion Method

A 50 microgram mAb sample was diluted to 0.5 mg/mL with 0.1 M ammonium bicarbonate solution, then 1 μL (50 units/μL) IdeS enzyme was added, mixed, and incubated at 37 °C for 60 min before being centrifuged at 13,000 rpm for 10 min. The treated samples (1 μL) were injected into the LC-MS system for analysis. The parameters were the same as those in the reduction method.

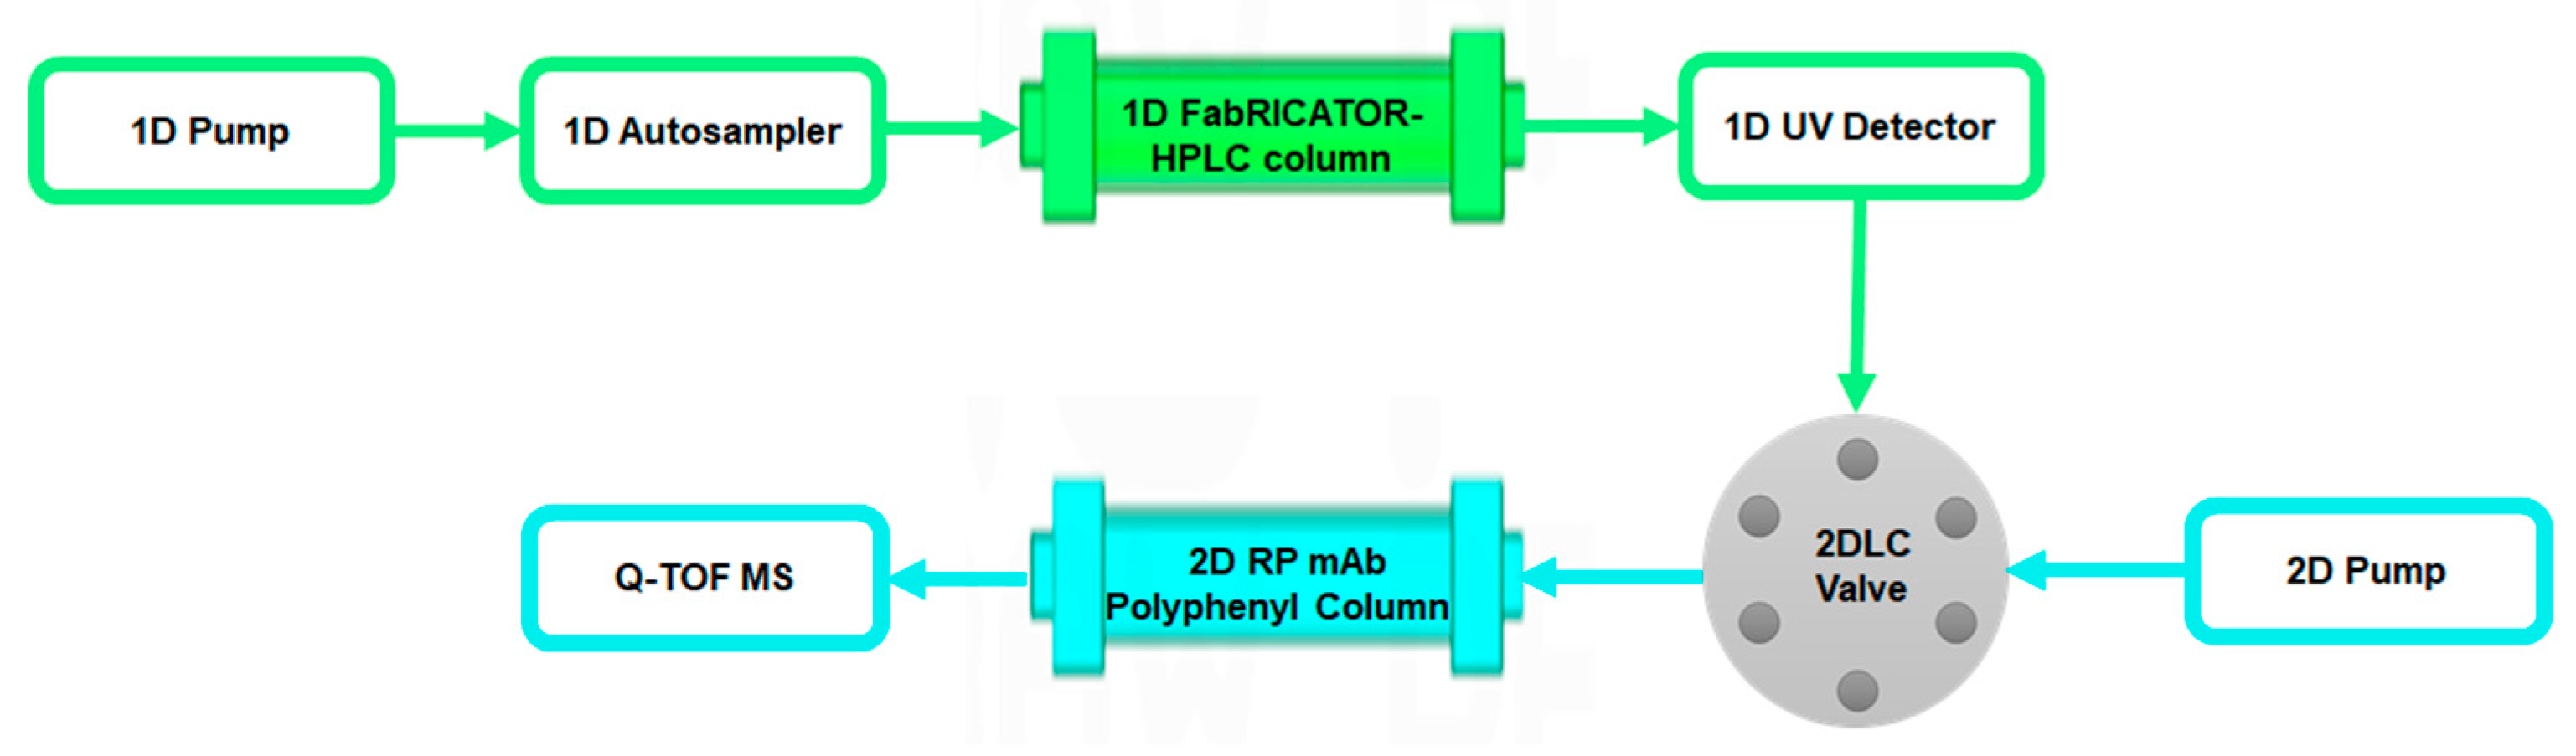
2.6. 2D-LC-MS Method

Figure 1 shows a scheme of the instrument used for rapid N-glycan analysis by the 2D-LC-MS method with on-line immobilized IdeS digestion. To analyze N-glycan analysis at the subunit level (about 25 kDa), a 2D-LC-MS system that included a FabRICATOR-HPLC column (Genovis, Cat# A0-FRC-050, 2.1 mm × 50 mm) as the first dimension for IdeS digestion and a BioResolve RP mAb polyphenyl column (Waters, Cat# 186008944, 2.1 mm × 50 mm, 2.7 µm) as the second dimension for separation of subunits hyphenated to Q-TOF MS was utilized.
Two micrograms of mAb were dispersed into 10 mM PBS buffer (pH 7.4) to obtain a concentration of 1.0 mg/mL. Then, it was centrifuged at 13,000 rpm for 10 min. About 2 μL of the supernatant was injected into the 2D-LC-MS system for analysis. The first dimension FabRICATOR-HPLC parameters were as below: column temperature was 37 °C, the mobile phase was pH 7.0 ammonium acetate buffer, with an isocratic elution for 30 min, and the flow rate was 0.05 mL/min. The second dimension RP mAb Polyphenyl used a binary gradient of 0.1% (v/v) formic acid in water (mobile phase A) and 0.1% (v/v) formic acid in acetonitrile (mobile phase B). The gradient conditions were as follows: 25% mobile phase B initially for 8 min, increased to 95% mobile phase B in 15 min and a 3 min isocratic hold for regeneration, then decreased to 25% mobile phase B in 0.1 min and held 4 min for re-equilibration. The column temperature was maintained at 75 °C and the flow rate was sustained at 0.4 mL/min. The heart-cutting mode was used for targeted fractions of on-line IdeS digested samples and then re-injected into the second-dimension column hyphenated Q-TOF MS analysis at the subunit level (Fc/2, about 25 kDa). Data were acquired in positive mode with a mass range of 100–5000 m/z at a rate of 1Hz. The fragmentor voltage was set as 225 V. The percentage of different glycans was calculated using MS intensity.

3. Results and Discussion

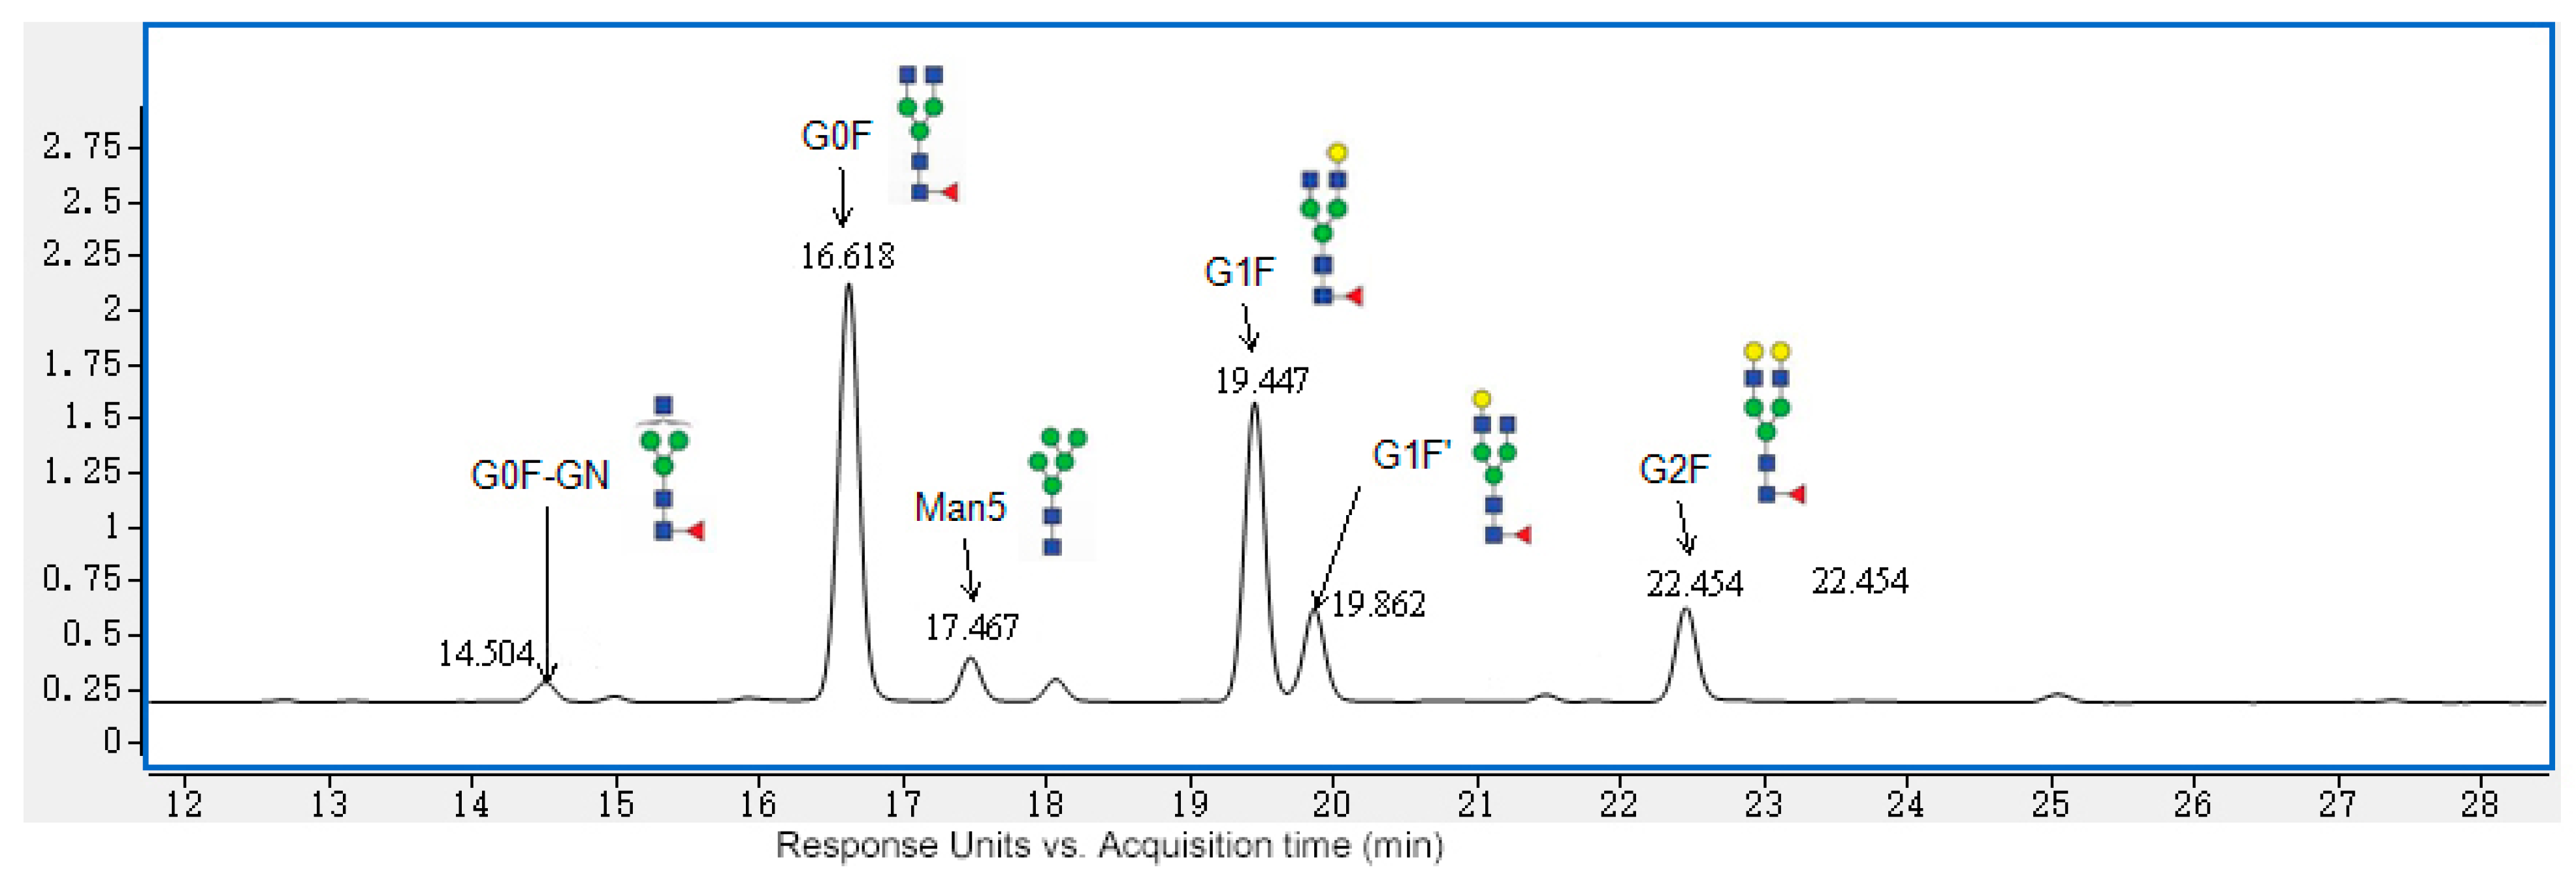
3.1. N-Glycan Data from the Rapid 2-AB Method

Pre-treatment of sample for N-glycan analysis only took a few hours using the Agilent AdvanceBio Gly-X N-Glycan Prep Kit, which released N-glycans quickly and simplified subsequential purification steps. The representative chromatogram of the N-glycan profiles of mAb A from the rapid 2-AB method was shown in Figure 2. The major glycans of mAb A included G0F, G1F, G1F’, G2F, Man5, and G0F-GN, which were common glycans of mAbs.
The rapid 2-AB method for glycan profiles of mAb A was performed in triplicate. Table 1 lists the percentage of major N-glycans of mAb A. Glycans G0F and G1F were the major components, and G0F had a percentage over 40% and G1F had a percentage of 29%. Other glycans, such as G1F’, G2F, Man5, and G0F-GN, could also be analyzed. Fucosylation was the most prominent glycan, and the total ratio (G0F, G1F, G1F’, G2F, and G0F-GN) exceeded 90%. The reproducibility of the percentage of the six major glycans was very good, with RSD lower than 5%.

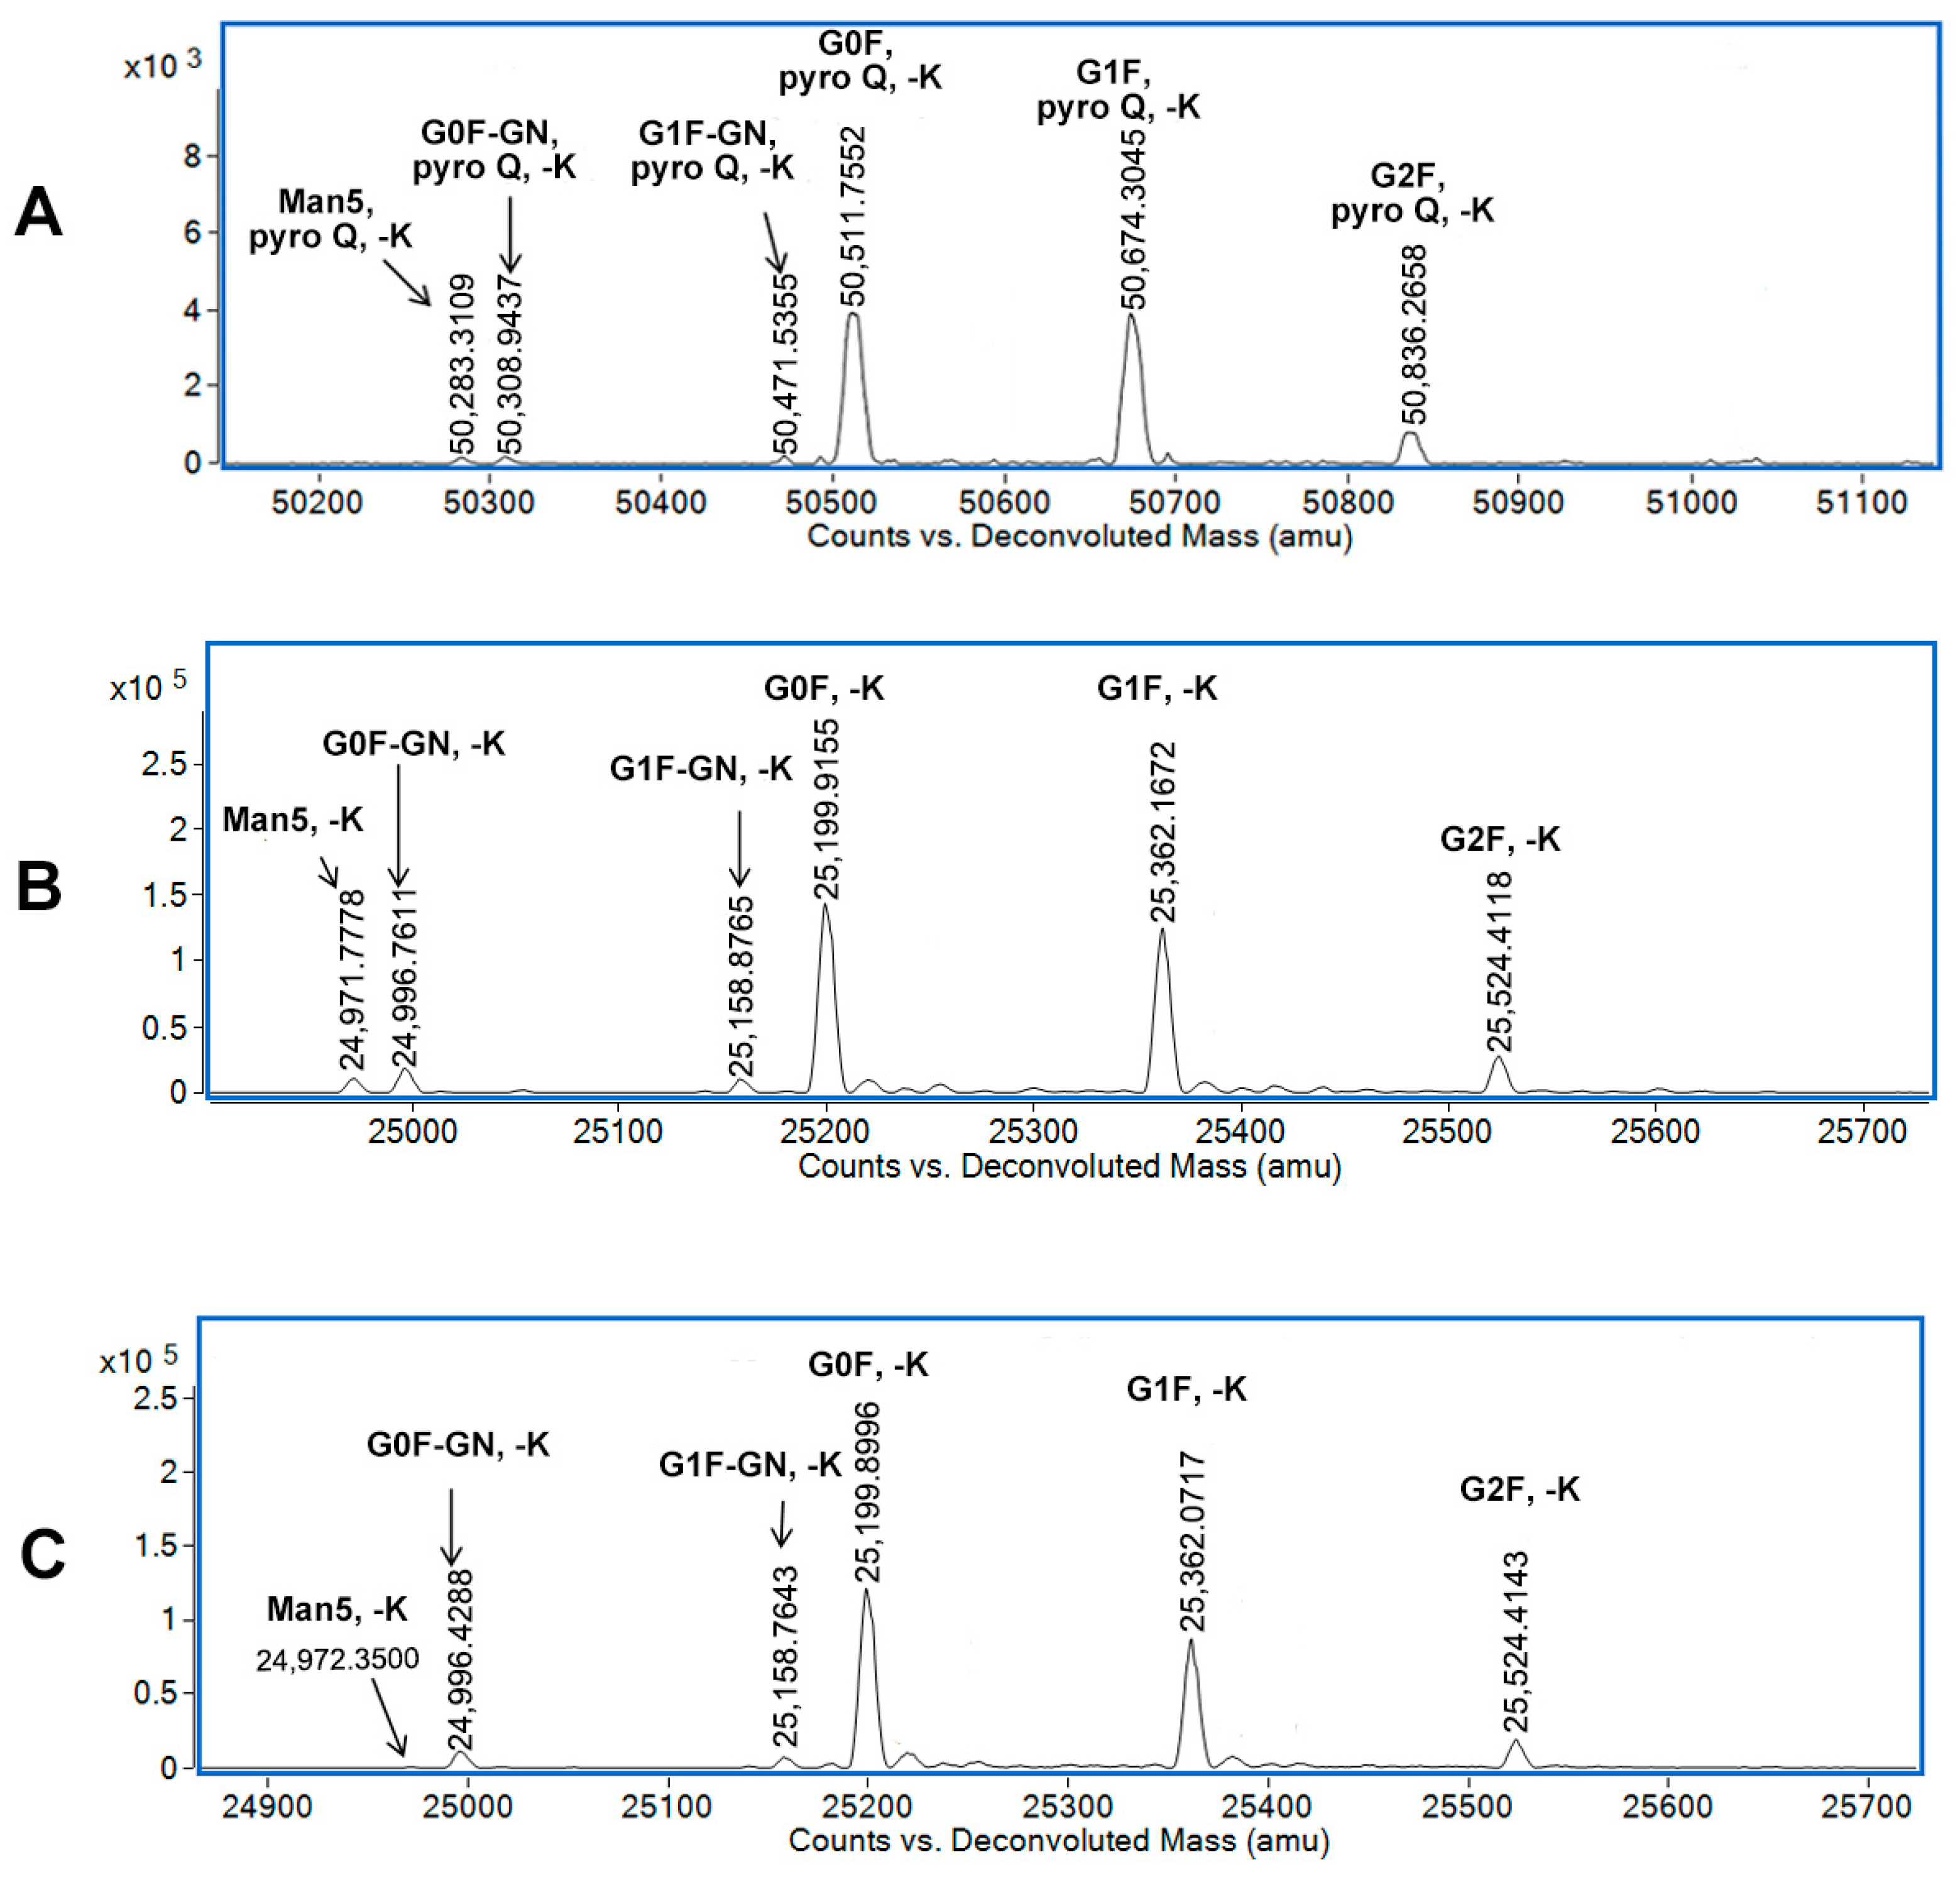
3.2. N-Glycan Data from the Reduction Method

In order to analyze N-glycan at the subunit level instead of the intact protein level, DTT was employed to reduce mAb A to generate HC, which was used for further N-glycan analysis at the HC level. Figure 3A shows representative deconvoluted MS spectra of the HC of mAb A from the reduction method. The six major glycans were identified as G0F-GN, G1F-GN, G0F, G1F, G2F, and Man5, with small mass errors compared to theoretical molecular weight. Additionally, C-terminal lysine truncation and N-terminal glutamine pyroglutamic acid cyclization were the main PTMs. Representative raw MS spectra of the heavy chains of mAb A from the reduction method is shown in Supplementary Materials, Figure S1A. The method was run in triplicate, and detailed information are shown in Supplementary Materials, Table S1. The average glycan ratios (n = 3) of G0F-GN, G1F-GN, G0F, G1F, G2F, and Man5 were 1.75%, 1.97%, 44.31%, 40.91%, 9.34%, and 1.73%, respectively. The RSD (n = 3) values of G0F-GN, G1F-GN, G0F, G1F, G2F, and Man5 were 12.34%, 6.83%, 2.49%, 3.34%, 4.49%, and 11.41%, respectively.

3.3. N-Glycan Data from the Off-Line IdeS Digestion Method

The IdeS enzyme can specifically cleave the bond between G242 and G243 in the hinge range of mAbs. Therefore, it is widely used to generate the fragments of Fc/2 and F(ab’)2 [23]. To the best of our knowledge, all the mAb drugs currently available on the market typically exhibit N-glycans exclusively within the Fc domain, with Cetuximab (Erbitux) being a notable exception, as it has been found to possess N-glycans within the Fab domain [27]. In line with this trend, the mAbs used in our study also exhibit N-glycans solely within the Fc domain, so fragments of Fc/2 are chosen for N-glycan analysis in this study. At the subunit level of Fc/2, LC-MS can analyze N-glycan with higher sensitivity than that at the intact protein level. Herein, we used the IdeS enzyme to digest mAb A to generate Fc/2 off-line and then used LC-MS to analyze N-glycan. Figure 3B shows representative deconvoluted MS spectra of the Fc/2 fragment of mAb A from the off-line IdeS method. The same six major glycans as those from the reduction method were identified with small mass errors compared to the theoretical molecular weight. Additionally, C-terminal lysine truncation was the main PTM. Representative raw MS spectra of the Fc/2 fragment of mAb A from the off-line IdeS digestion method is shown in Supplementary Materials, Figure S1B. The method was run in triplicate, and the detailed information are shown in Supplementary Materials, Table S2. The average glycan ratios (n = 3) of G0F-GN, G1F-GN, G0F, G1F, G2F, and Man5 were 5.29%, 2.80%, 43.64%, 36.82%, 8.04%, and 3.41%, respectively. The RSD (n = 3) of G0F-GN, G1F-GN, G0F, G1F, G2F, and Man5 were 7.16%, 9.07%, 2.81%, 1.68%, 3.42%, and 6.02%, respectively.

3.4. N-Glycan Data from the 2D-LC-MS Method

The 2D-LC-MS method has been developed for the analysis of complex samples with high efficiency in recent decades [28]. The FabRICATOR-HPLC column is a new immobilized IdeS-HPLC column from Genovis, and can completely digest mAbs in only 10 min, which makes it possible to construct a 2D-LC-MS system with on-line IdeS digestion for rapid N-glycan analysis. In this study, we constructed a 2D-LC-MS system to quickly analyze N-glycan of mAbs, using the FabRICATOR-HPLC column as the first dimension for on-line IdeS digestion and the RP mAb Polyphenyl column as the second dimension for the separation of subunits. Figure 3C shows representative deconvoluted MS spectra of the Fc/2 fragment of mAb A from the 2D-LC-MS method with on-line immobilized IdeS digestion. G0F-GN, G1F-GN, G0F, G1F, G2F, and Man5 were identified as the six major glycans, which were the same as those from the reduction method and the off-line IdeS digestion method. Moreover, C-terminal lysine truncation was the main PTM, which was the same as the results from the off-line IdeS digestion method. Representative raw MS spectra of the Fc/2 fragment of mAb A from the 2D-LC-MS method is shown in Supplementary Materials, Figure S1C. The method was run in triplicate, and the details are shown in Supplementary Materials, Table S3. The average glycan ratios (n = 3) of G0F-GN, G1F-GN, G0F, G1F, G2F, and Man5 were 4.74%, 2.97%, 49.46%, 34.75%, 7.77%, and 0.31%, respectively. The RSD (n = 3) of G0F-GN, G1F-GN, G0F, G1F, G2F, and Man5 were 3.31%, 3.86%, 0.76%, 1.41%, 2.12%, and 6.73%, respectively.

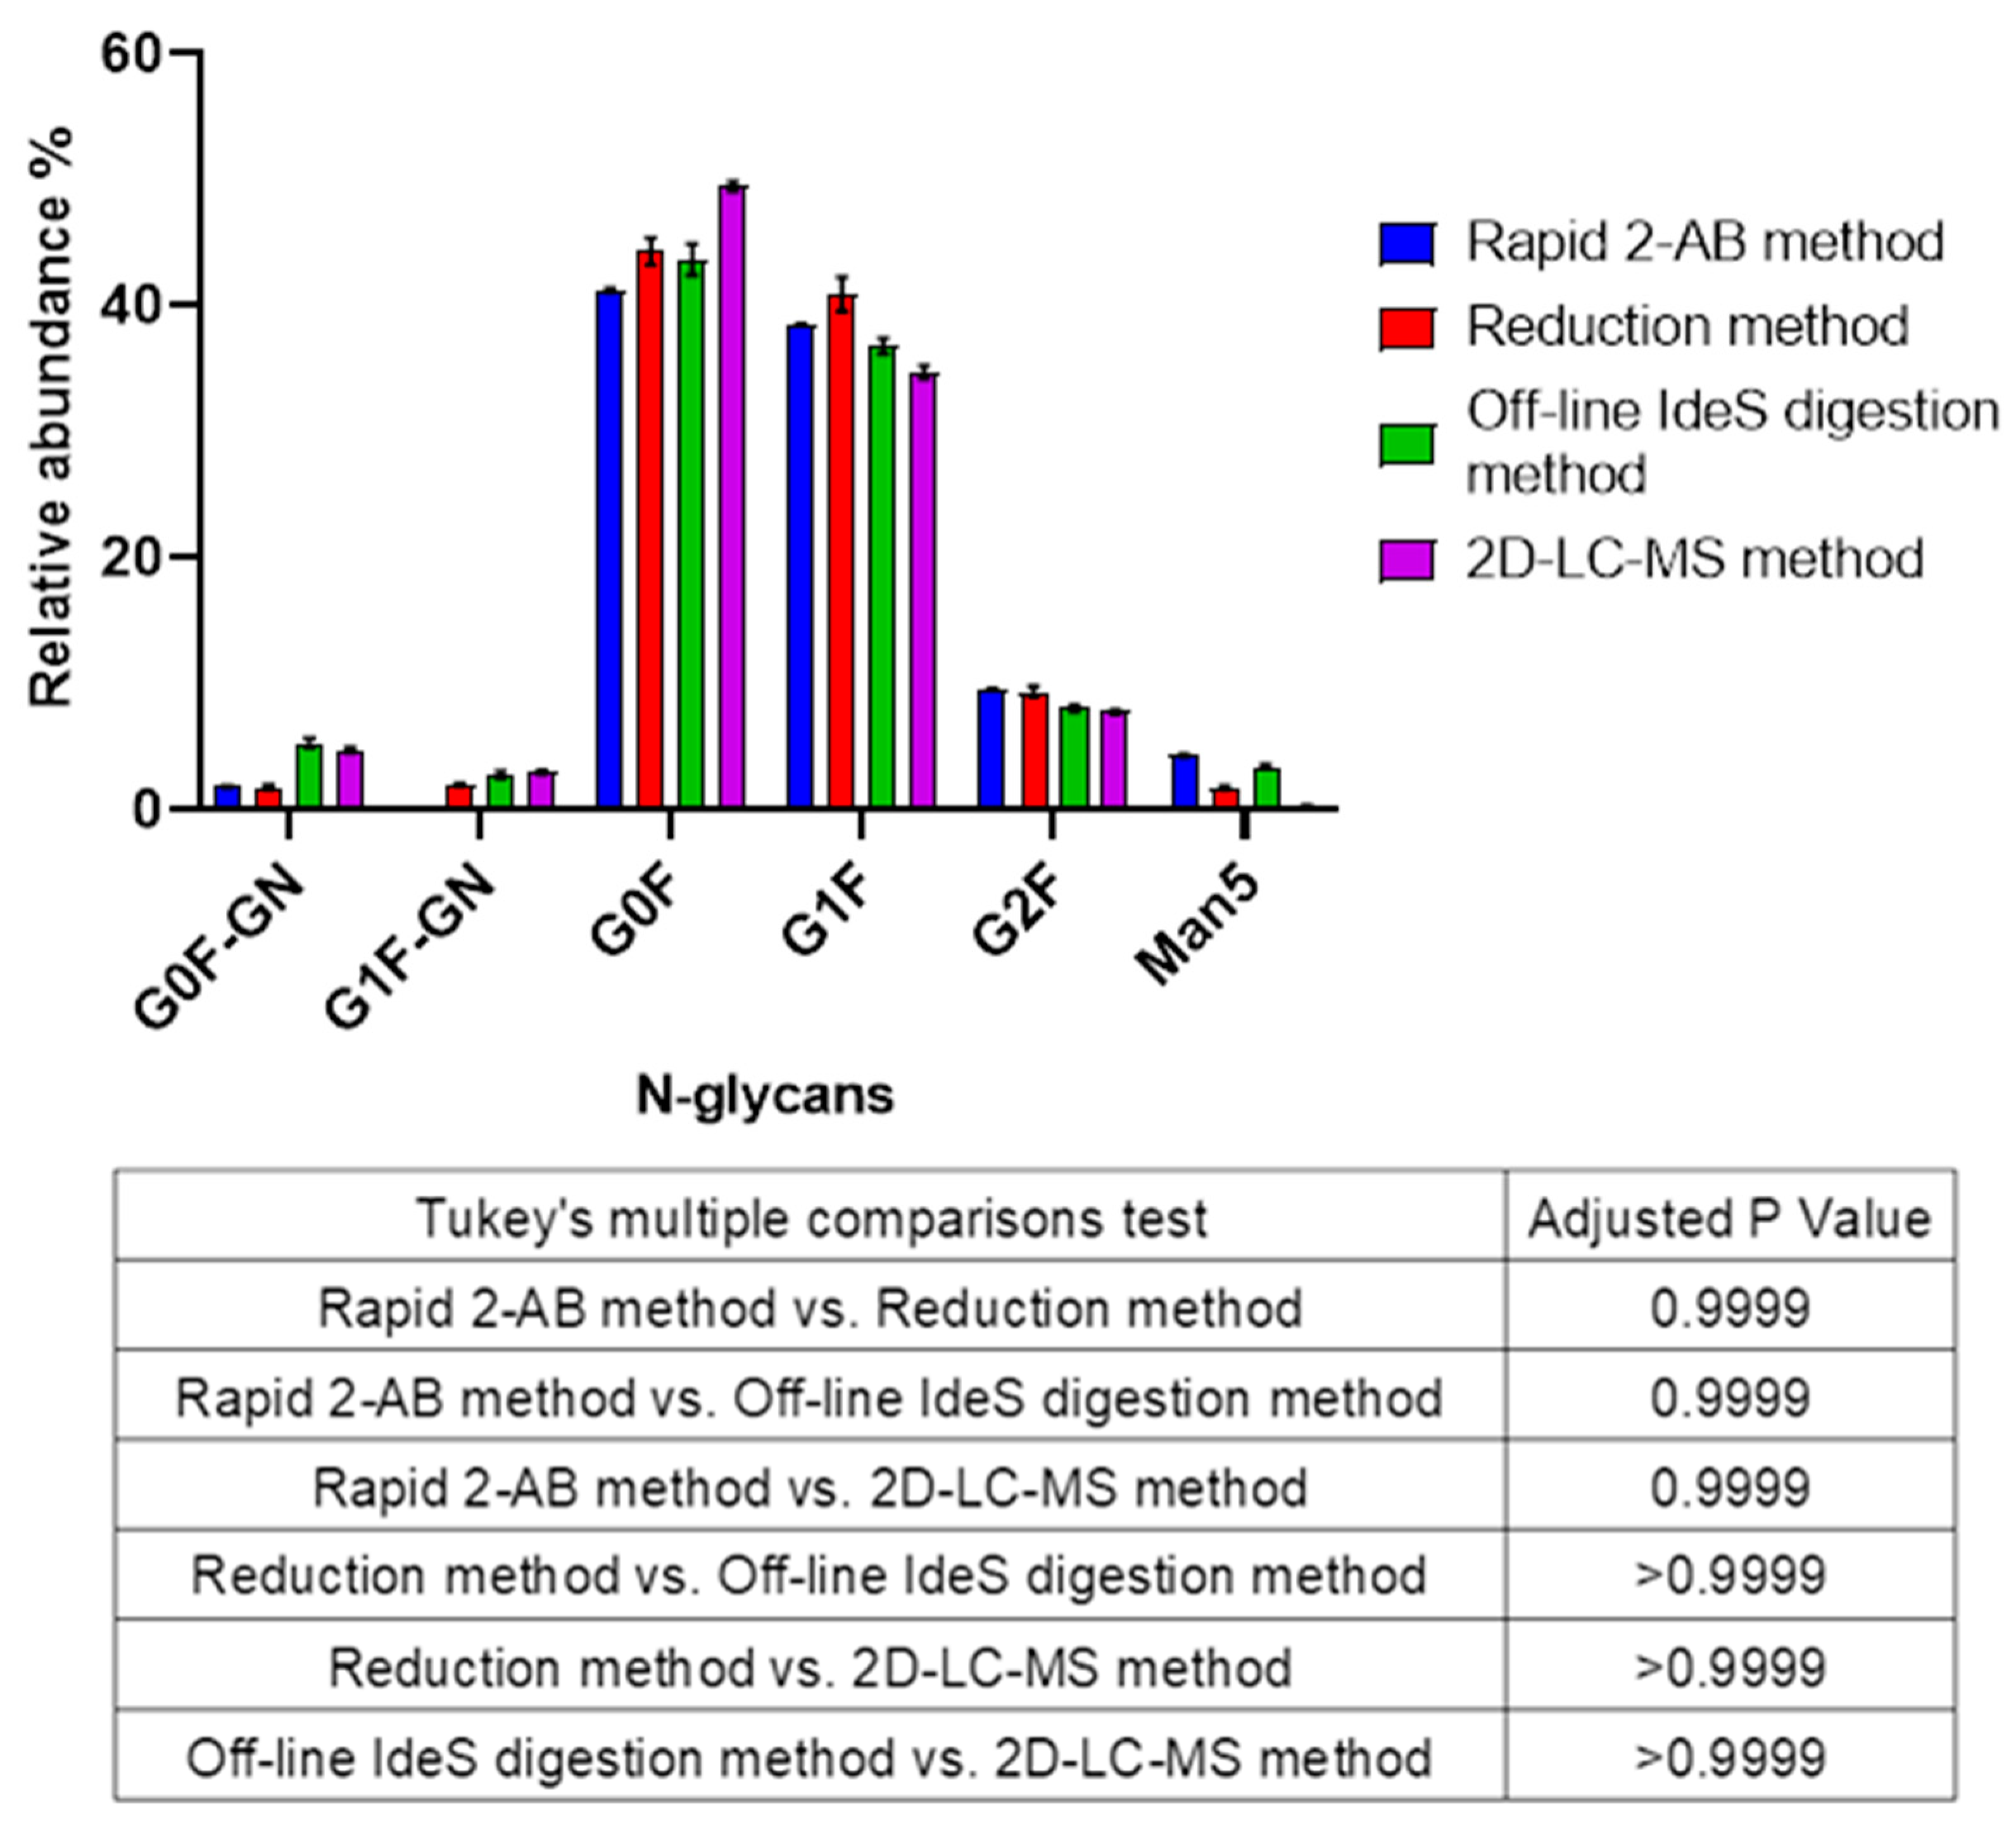
3.5. Comparison of Four Rapid N-Glycan Analytical Methods

Based on the above data, we compared the six major glycans of mAb A from these four methods in Figure 4. Tukey’s multiple comparison test was widely used in comparisons of different groups [29,30] and was performed in this study to compare the differences between any two methods. The adjusted P values between any two methods were 0.9999 or >0.9999, which meant that there were no significant differences between any two methods. For highly abundant glycans, such as G0F, G1F, and G2F, these four methods provided comparable data, despite some minor differences for low abundant glycans, such as G0F-GN, G1F-GN, and Man5.
It was speculated that these minor differences were due to the dilution in the 2D-LC-MS system, the efficiency of pre-treatment, and response differences between MS and fluorescence detectors. The comparison of these four rapid methods is listed in Table 2. The rapid 2-AB method analyzed N-glycans using a fluorescence detector at the released N-glycan level, which differed from the other three methods using an MS detector at the subunit level. The N-glycans release step, labelling step, subsequent purification step, and fluorescence detection could influence the N-glycan data. For the reduction method, the off-line IdeS digestion method, and the 2D-LC-MS method, the reduction step, off-line IdeS digestion step, and on-line IdeS digestion step could influence the data of N-glycans. The 2D-LC-MS method utilized on-line immobilized IdeS columns for digestion and RP columns for on-line desalting. It had an on-line dilution effect, which may induce a variation in the method.
Cosine similarity, which is one of the most widely used approaches for a similarity calculation, was used to further compare the similarity of N-glycan data from these four rapid methods [31]. The smaller the angle of the two non-zero vectors a and b, the closer the cosine value is to 1, and the more their directions coincide, the more similar they are. The cosine value of six major glycans between the 2D-LC-MS method and the rapid 2-AB method was 0.9853, the cosine value of six major glycans between the 2D-LC-MS method and the reduction method was 0.9895, and the cosine value of six major glycans between the 2D-LC-MS method and the off-line IdeS digestion method was 0.9946. This meant N-glycan data from the 2D-LC-MS method and other methods were similar and comparable. Detailed information is shown in Supplementary Materials, Table S4.
Furthermore, we compared the protein sample requirement and testing time between these four methods and the conventional 2-AB method. Details are listed in Table 3. The 2-AB method is considered the gold standard for N-glycan analysis. The greatest disadvantages of the 2-AB method is a long and laborious procedure with overnight enzymatic incubations, multi-hour labelling reactions, and purification steps, usually several days for the whole testing [32]. For the rapid 2-AB method used in this study, the testing time was only 4 h with the rapid N-glycans release and subsequent rapid purification steps. The reduction method tests N-glycan at the subunit level, which can minimize the complexity caused by glycan pairs at the intact protein level [6]. In this study, DTT was used as the reducing reagent to cleave the disulfide bond between the antibody chains into HC and LC for subsequent N-glycan analysis using LC-MS. This method required only 74 min per sample, significantly shortening the testing time compared to the conventional 2-AB method. The off-line IdeS digestion method also tested N-glycan at the subunit level and had advantages over other methods at the intact protein level. The difference was that it used the IdeS to enzymatically digest antibodies into F(ab’)2 and Fc/2 [22] and analyzed N-glycans of Fc/2 using LC-MS. This method had a similar testing time to the reduction method; 104 min per sample in this study. The 2D-LC-MS method shared the same principle with the off-line IdeS digestion method, just changing off-line digestion to on-line digestion, which improved analytical efficiency and reduced testing time. Based on the rapid on-line digestion hyphenated MS detection in this study, this method took only 40 min per sample in this study.
In addition to being time saving, these four rapid methods have a smaller sample requirement than that of the conventional 2-AB method, which can reduce the sample requirement from milligrams to micrograms. A milligram-level protein sample is necessary for the conventional 2-AB method due to the limitations of purification steps. The sample requirement of these four rapid methods is 40 µg for the rapid 2-AB method, 50 µg for the reduction method, 50 µg for the off-line IdeS digestion method, and only 2 µg for the 2D-LC-MS method. Among the four rapid methods, the 2D-LC-MS method is superior to the conventional 2-AB method due to a lower protein sample requirement.
Since the 2D-LC-MS method showed the best performance in terms of the testing time and protein sample requirement, we further evaluated the quantitative performance of the 2D-LC-MS method using mAb B by comparing the 2D-LC-MS method and the rapid 2-AB method. Detailed information is shown in Supplementary Materials, Figure S2 and Table S5. G0F was the prominent glycan of mAb B, the ratio from the 2D-LC-MS method was 82.13%, and the ratio from the rapid 2-AB method was 82.94%, suggesting highly similar results. The ratios of G1F were 11.58% and 12.22% from the 2D-LC-MS method and the rapid 2-AB method, respectively. For low abundant glycans, there were minor differences between the 2D-LC-MS method and the rapid 2-AB method. In addition, the cosine value between the 2D-LC-MS method and the rapid 2-AB method for N-glycan data of mAb B was 0.9995, hinting that these two methods offered similar and comparable data. As a relatively new method, the 2D-LC-MS method can provide comparable N-glycan data with less testing time and a lower sample requirement, indicating its great application potential in mAb development.

3.6. Great Application Potential of These Four Rapid N-Glycan Analytical Methods in Cell Line Development

With the advantages of less testing time and a lower sample requirement, these four rapid N-glycan analytical methods would have great application potential in cell line development and will benefit the development of mAbs. Assuming the top 100 cell lines are expanded into shaken culture tubes for simplified fed-batch screening, there are 100 samples for N-glycan analysis. First, the 100 samples must be purified by means of affinity chromatography, and then they must undergo N-glycan analysis via suitable methods. It is worth noting that the purification of mAbs from the medium falls outside the scope of this study, and the comparison of different methods presented in our manuscript is based on the analysis of identical samples—mAbs of high purity. Detailed comparison is listed in Table 1. If using the conventional 2-AB method, the pre-treatment step (glycans release, labelling, etc.) usually requires 2 days, and HPLC analysis usually require 1 h per sample, that is 24 samples per day, which is the limitation step. Therefore, the throughput of the conventional 2-AB method is 24 samples every 3 days, and the glycan analysis of 100 samples require 12.5 days. If using the rapid 2-AB method, 100 sample analysis only requires 6.25 days, saving 6.25 days compared to the conventional 2-AB method. If using the reduction method, 100 sample analysis only requires about 5.26 days, saving about 7.24 days compared to the conventional 2-AB method. If using the off-line IdeS digestion method, 100 sample analysis only requires about 7.69 days, saving about 4.81 days compared to the conventional 2-AB method. When using the 2D-LC-MS method, 100 sample analysis required only about 2.78 days, saving about 9.72 days compared to the conventional 2-AB method. These four rapid methods can significantly reduce the testing time of N-glycan analysis. Furthermore, the 2D-LC-MS method is the most effective at about 78% time saving, which will help to accelerate the cell line development of mAbs.
Additionally, the protein sample requirements of these four rapid methods are much lower than that of the conventional 2-AB method. In cell line development, protein materials are one of the limitations for quality analysis due to low titer and small cell culture scale. Usually only lower than milligram-level protein materials are available after affinity chromatography purification. These protein materials need to be allocated for different quality attribute analysis, and the protein materials allocated for N-glycan analysis usually cannot meet the requirement of conventional 2-AB. This is one of the bottlenecks in cell line development. These four rapid methods require only microgram levels of protein samples, especially the 2D-LC-MS method, which needs only 2 microgram protein samples and fits well with the N-glycan analysis in cell line development.

4. Conclusions

In summary, we compared the performance of four rapid N-glycan analytical methods, and found they provide comparable N-glycan data. Moreover, the testing time and protein sample requirement were much lower than those for the conventional 2-AB method. The 2D-LC-MS method performed the best with the shortest testing time and the lowest protein sample requirement. These four rapid N-glycan analytical methods, especially the 2D-LC-MS method, showed great application potential in cell line development and will play an important role in the development of mAbs in the future.

Supplementary Materials

The following supporting information can be downloaded at: https://www.mdpi.com/article/10.3390/app14167320/s1, Figure S1: Raw MS spectra of mAb A. (A) Raw MS spectra by reduction method. (B) Raw MS spectra by off-line IdeS digestion method. (C) Raw MS spectra by 2D-LC-MS method with on-line immobilized IdeS digestion; Figure S2: Comparison of five major glycans of mAb B by 2D-LC-MS method (n = 3) and rapid 2-AB method (n = 3); Table S1: The reproducibility of the major N-glycan data by reduction method in triplicate; Table S2: The reproducibility of the major N-glycan data by off-line IdeS digestion method in triplicate; Table S3: The reproducibility of N-glycan data by 2D-LC-MS method in triplicate; Table S4: The cosine value of the six major glycans of mAb A between 2D-LC-MS method and other methods; Table S5: The cosine value of the five major glycans of mAb B between 2D-LC-MS method and rapid 2-AB method.

Author Contributions

Conceptualization, X.J.; investigation, X.J.; writing—original draft, X.J.; supervision, B.H.; writing—review and editing, J.C. and B.H. All authors have read and agreed to the published version of the manuscript.

Funding

This work was funded by the National Key Research and Development Program of China (2018YFA0902000) and the Jiangsu Synergetic Innovation Center for Advanced Bio-Manufacture (No. XTC2206).

Institutional Review Board Statement

Not applicable.

Informed Consent Statement

Not applicable.

Data Availability Statement

The original contributions presented in the study are included in the article/supplementary material, further inquiries can be directed to the corresponding author.

Acknowledgments

The authors are grateful to Genovis Group for providing FabRICATOR-HPLC column in this study.

Conflicts of Interest

The authors declare no conflicts of interest.

References

  1. Yaozhi. Top10 Best-Selling Drugs in 2023. Available online: https://m.baidu.com/bh/m/detail/ar_9971613961676379877 (accessed on 22 February 2024).
  2. Martin, K.P.; Grimaldi, C.; Grempler, R.; Hansel, S.; Kumar, S. Trends in industrialization of biotherapeutics: A survey of product characteristics of 89 antibody-based biotherapeutics. MAbs 2023, 15, 2191301. [Google Scholar] [CrossRef]
  3. Khetan, R.; Curtis, R.; Deane, C.M.; Hadsund, J.T.; Kar, U.; Krawczyk, K.; Kuroda, D.; Robinson, S.A.; Sormanni, P.; Tsumoto, K.; et al. Current advances in biopharmaceutical informatics: Guidelines, impact and challenges in the computational developability assessment of antibody therapeutics. MAbs 2022, 14, 2020082. [Google Scholar] [CrossRef]
  4. Farid, S.S.; Baron, M.; Stamatis, C.; Nie, W.; Coffman, J. Benchmarking biopharmaceutical process development and manufacturing cost contributions to R&D. MAbs 2020, 12, 1754999. [Google Scholar] [CrossRef]
  5. Higel, F.; Seidl, A.; Sorgel, F.; Friess, W. N-glycosylation heterogeneity and the influence on structure, function and pharmacokinetics of monoclonal antibodies and Fc fusion proteins. Eur. J. Pharm. Biopharm. 2016, 100, 94–100. [Google Scholar] [CrossRef] [PubMed]
  6. Shrivastava, A.; Joshi, S.; Guttman, A.; Rathore, A.S. N-Glycosylation of monoclonal antibody therapeutics: A comprehensive review on significance and characterization. Anal. Chim. Acta 2022, 1209, 339828. [Google Scholar] [CrossRef] [PubMed]
  7. Carillo, S.; Pérez-Robles, R.; Jakes, C.; Ribeiro da Silva, M.; Millán Martín, S.; Farrell, A.; Navas, N.; Bones, J. Comparing different domains of analysis for the characterisation of N-glycans on monoclonal antibodies. J. Pharm. Anal. 2020, 10, 23–34. [Google Scholar] [CrossRef] [PubMed]
  8. Majewska, N.I.; Tejada, M.L.; Betenbaugh, M.J.; Agarwal, N. N-Glycosylation of IgG and IgG-Like Recombinant Therapeutic Proteins: Why Is It Important and How Can We Control It? Annu. Rev. Chem. Biomol. Eng. 2020, 11, 311–338. [Google Scholar] [CrossRef]
  9. Matsumiya, S.; Yamaguchi, Y.; Saito, J.; Nagano, M.; Sasakawa, H.; Otaki, S.; Satoh, M.; Shitara, K.; Kato, K. Structural comparison of fucosylated and nonfucosylated Fc fragments of human immunoglobulin G1. J. Mol. Biol. 2007, 368, 767–779. [Google Scholar] [CrossRef]
  10. Upton, R.; Bell, L.; Guy, C.; Caldwell, P.; Estdale, S.; Barran, P.E.; Firth, D. Orthogonal Assessment of Biotherapeutic Glycosylation: A Case Study Correlating N-Glycan Core Afucosylation of Herceptin with Mechanism of Action. Anal. Chem. 2016, 88, 10259–10265. [Google Scholar] [CrossRef]
  11. Raju, T.S.; Jordan, R.E. Galactosylation variations in marketed therapeutic antibodies. MAbs 2012, 4, 385–391. [Google Scholar] [CrossRef]
  12. Thomann, M.; Reckermann, K.; Reusch, D.; Prasser, J.; Tejada, M.L. Fc-galactosylation modulates antibody-dependent cellular cytotoxicity of therapeutic antibodies. Mol. Immunol. 2016, 73, 69–75. [Google Scholar] [CrossRef] [PubMed]
  13. Goetze, A.M.; Liu, Y.D.; Zhang, Z.; Shah, B.; Lee, E.; Bondarenko, P.V.; Flynn, G.C. High-mannose glycans on the Fc region of therapeutic IgG antibodies increase serum clearance in humans. Glycobiology 2011, 21, 949–959. [Google Scholar] [CrossRef] [PubMed]
  14. Liu, Y.D.; Flynn, G.C. Effect of high mannose glycan pairing on IgG antibody clearance. Biologicals 2016, 44, 163–169. [Google Scholar] [CrossRef] [PubMed]
  15. Kaur, H. Characterization of glycosylation in monoclonal antibodies and its importance in therapeutic antibody development. Crit. Rev. Biotechnol. 2021, 41, 300–315. [Google Scholar] [CrossRef] [PubMed]
  16. Duivelshof, B.L.; Jiskoot, W.; Beck, A.; Veuthey, J.L.; Guillarme, D.; D’Atri, V. Glycosylation of biosimilars: Recent advances in analytical characterization and clinical implications. Anal. Chim. Acta 2019, 1089, 1–18. [Google Scholar] [CrossRef] [PubMed]
  17. Eckard, A.D.; Dupont, D.R.; Young, J.K. Development of Two Analytical Methods Based on Reverse Phase Chromatographic and SDS-PAGE Gel for Assessment of Deglycosylation Yield in N-Glycan Mapping. Biomed. Res. Int. 2018, 2018, 3909674. [Google Scholar] [CrossRef] [PubMed]
  18. Le, K.; Tan, C.; Gupta, S.; Guhan, T.; Barkhordarian, H.; Lull, J.; Stevens, J.; Munro, T. A novel mammalian cell line development platform utilizing nanofluidics and optoelectro positioning technology. Biotechnol. Prog. 2018, 34, 1438–1446. [Google Scholar] [CrossRef] [PubMed]
  19. Wang, B.; Albanetti, T.; Miro-Quesada, G.; Flack, L.; Li, L.; Klover, J.; Burson, K.; Evans, K.; Ivory, W.; Bowen, M.; et al. High-throughput screening of antibody-expressing CHO clones using an automated shaken deep-well system. Biotechnol. Prog. 2018, 34, 1460–1471. [Google Scholar] [CrossRef] [PubMed]
  20. O’Flaherty, R.; Trbojevic-Akmacic, I.; Greville, G.; Rudd, P.M.; Lauc, G. The sweet spot for biologics: Recent advances in characterization of biotherapeutic glycoproteins. Expert Rev. Proteom. 2018, 15, 13–29. [Google Scholar] [CrossRef] [PubMed]
  21. Kaur, H.; Reusch, D. Monoclonal Antibodies Physicochemical Analysis; Elsevier Inc.: Amsterdam, The Netherlands, 2021. [Google Scholar]
  22. Camperi, J.; Dai, L.; Guillarme, D.; Stella, C. Development of a 3D-LC/MS Workflow for Fast, Automated, and Effective Characterization of Glycosylation Patterns of Biotherapeutic Products. Anal. Chem. 2020, 92, 4357–4363. [Google Scholar] [CrossRef] [PubMed]
  23. Marquet, F.; D’Atri, V.; Guillarme, D.; Borchard, G. A New Practice to Monitor the Fabrication Process of Fab-Targeting Ligands from Bevacizumab by LC-MS: Preparation and Analytical Characterization. Sci. Pharm. 2022, 90, 5. [Google Scholar] [CrossRef]
  24. Liu, Z.; Cao, Y.; Zhang, L.; Xu, Y.; Zhang, Z. In-Depth Characterization of mAb Charge Variants by On-Line Multidimensional Liquid Chromatography-Mass Spectrometry. Anal. Chem. 2023, 95, 7977–7984. [Google Scholar] [CrossRef] [PubMed]
  25. Jaag, S.; Shirokikh, M.; Lammerhofer, M. Charge variant analysis of protein-based biopharmaceuticals using two-dimensional liquid chromatography hyphenated to mass spectrometry. J. Chromatogr. A 2021, 1636, 461786. [Google Scholar] [CrossRef]
  26. Agilent. Agilent AdvanceBio Gly-X N-Glycan Prep with 2-AB Express Kit. Available online: https://www.agilent.com.cn/cs/library/usermanuals/public/5994-1228EN.pdf (accessed on 1 July 2019).
  27. Jarasch, A.; Koll, H.; Regula, J.T.; Bader, M.; Papadimitriou, A.; Kettenberger, H. Developability assessment during the selection of novel therapeutic antibodies. J. Pharm. Sci. 2015, 104, 1885–1898. [Google Scholar] [CrossRef]
  28. Foster, S.W.; Parker, D.; Kurre, S.; Boughton, J.; Stoll, D.R.; Grinias, J.P. A review of two-dimensional liquid chromatography approaches using parallel column arrays in the second dimension. Anal. Chim. Acta 2022, 1228, 340300. [Google Scholar] [CrossRef]
  29. Rautenberg, T.A.; Ng, S.K.A.; Downes, M. A cross-sectional study of symptoms and health-related quality of life in menopausal-aged women in China. BMC Womens Health 2023, 23, 563. [Google Scholar] [CrossRef] [PubMed]
  30. Someya, T.; Kasahara, M.; Takemoto, S.; Hattori, M. The Wear Behavior of Glass-Ceramic CAD/CAM Blocks against Bovine Enamel. Materials 2023, 16, 6839. [Google Scholar] [CrossRef]
  31. Grieb, N.; Oltrup, T.; Bende, T.; Leitritz, M.A. The Cosine Similarity Technique: A new method for smart EXCIMER laser control. Z. Med. Phys. 2020, 30, 253–258. [Google Scholar] [CrossRef]
  32. Zhou, S.; Veillon, L.; Dong, X.; Huang, Y.; Mechref, Y. Direct comparison of derivatization strategies for LC-MS/MS analysis of N-glycans. Analyst 2017, 142, 4446–4455. [Google Scholar] [CrossRef]
  33. Schiel, J.E.; Rogstad, S.M.; Boyne, M.T., 2nd. Comparison of Traditional 2-AB Fluorescence LC-MS/MS and Automated LC-MS for the Comparative Glycan Analysis of Monoclonal Antibodies. J. Pharm. Sci. 2015, 104, 2464–2472. [Google Scholar] [CrossRef]
Figure 1. Scheme of 2D-LC-MS method for rapid N-glycan analysis.
Applsci 14 07320 g001
Figure 2. Representative chromatogram of N-glycan profiles of mAb A from rapid 2-AB method.
Applsci 14 07320 g002
Figure 3. Representative deconvoluted MS spectra of mAb A. (A) Deconvoluted MS spectra of HC from the reduction method. (B) Deconvoluted MS spectra of Fc/2 from the off-line IdeS digestion method. (C) Deconvoluted MS spectra of Fc/2 from the 2D-LC-MS method.
Applsci 14 07320 g003
Figure 4. Comparison of six major glycans of mAb A from the reduction method (n = 3), the off-line IdeS digestion method (n = 3), the 2D-LC-MS method with on-line immobilized IdeS digestion (n = 3), and the rapid 2-AB method (n = 3).
Applsci 14 07320 g004
Table 1. The percentages of major N-glycans of mAb A from rapid 2-AB method.
Glycan NamePercentage/%
Run 1Run 2Run 3RSD
G0F-GN1.921.761.864.19%
G0F41.3341.0641.270.34%
Man54.224.404.292.09%
G1F29.0529.1029.020.14%
G1F’9.409.469.410.38%
G2F9.589.559.460.68%
Table 2. The comparison of these four rapid methods.
MethodAnalytical PrinciplePre-TreatmentColumnDetector
Rapid 2-AB methodN-glycans is released from the antibody by PNGase F, labelled by 2-AB, and tested by a fluorescence detector.Denaturation, N-glycan release, labelling and purification.HILIC columnFluorescence detector
Reduction methodThe antibody is reduced to generate HC and analyzed N-glycans by MS at the subunit level.Off-line DTT reduction.RP columnQ-TOF MS detector
Off-line IdeS digestion methodThe antibody is off-line digested by IdeS to generate Fc/2 and analyzed N-glycans by MS at the subunit level.Off-line IdeS digestion.RP columnQ-TOF MS detector
2D-LC-MS method The antibody is on-line digested by the column with immobilized IdeS to generate Fc/2 and analyzed N-glycans by MS at the subunit level.No pre-treatment.Immobilized IdeS column and RP columnQ-TOF MS detector
Table 3. The comparison of the protein sample requirement and testing time between these four rapid methods and conventional 2-AB method.
MethodProtein Sample
Requirement per Analysis
Total Testing Time per AnalysisThroughputTotal Testing Time for 100 SamplesTime Saving for 100
Samples
Time Saving Ratio for 100 Samples
Conventional 2-AB method1 mg [33]1~3 days [17]24 samples per 3 days *12.5 daysNANA
Rapid 2-AB method40 µg4 h16 samples per day #6.25 days6.25 days50%
Reduction method50 µg74 min~19 samples per day~5.26 days~7.24 days~58%
Off-line IdeS digestion method50 µg104 min~13 samples per day~7.69 days~4.81 days~38%
2D-LC-MS method2 µg40 min36 samples per day~2.78 days~9.72 days~78%
Note: * based on 2 days for pretreatment of 24 samples and 60 min per sample for HPLC testing. # based on 8 h for pretreatment of 16 samples and 60 min per sample for HPLC testing.
Disclaimer/Publisher’s Note: The statements, opinions and data contained in all publications are solely those of the individual author(s) and contributor(s) and not of MDPI and/or the editor(s). MDPI and/or the editor(s) disclaim responsibility for any injury to people or property resulting from any ideas, methods, instructions or products referred to in the content.

