Abstract
Using Antarctic krill (Euphausia superba) as the research object, we optimized the process conditions for Antarctic krill sauce (AkS) by including three factors (salt addition, rock sugar addition, and the oil-to-material ratio) and sensory evaluation as response values. The data from the response surface were fed into the back propagation (BP) neural network training, generating a model mapping the process conditions and sensory scores, which were subsequently combined with the genetic algorithm (GA) for global optimization to determine the optimal process for AkS preparation. The results revealed that the response surface model was well suited to the BP neural network training and prediction sets, with correlation values of 0.98 and 0.95, respectively. The fitting prediction effect was obvious for the sensory scoring results of the product. The parameters obtained from the GA’s global optimization search accord with the analytical results of the response surface. The findings demonstrated that combining a BP neural network with a GA can enhance the AkS preparation technique. Under optimal processing conditions, AkS has a high sensory score and protein and carbohydrate contents, moderate fat content, minimal fat oxidation, and non-detectable pathogens, indicating that the AkS in this study was nutritious and safe to consume.
1. Introduction
Antarctic krill (Euphausia superba) are shrimp-like planktonic crustaceans normally found in the Antarctic Ocean, and it is the primary producer in the Antarctic food chain system [1,2]. According to the latest statistics, Antarctic krill capture is more than twice the total fisheries production worldwide [3]. The vast potential resources of Antarctic krill, as well as its unique status in the Antarctic, are a growing concern. As a result, the development and usage of Antarctic krill resources is an unavoidable trend, since the amount of fishing resources worldwide continues to decrease.
Antarctic krill are protein-rich and have a distinctive flavor. At present, Antarctic krill are only developed and used to make krill meal paste, krill powder, krill oil, and other products [4,5]. Recently, bioactive substances derived from Antarctic krill have been reported [6,7,8]. The functional and chelating peptides isolated from Antarctic krill exhibit substantial biological activity and functionality [7,8]. However, large-scale manufacturing of bioactive compounds from raw Antarctic krill requires more extensive approaches and a greater amount of raw Antarctic krill. The development of high-value Antarctic krill products is therefore critical for their optimal usage. Antarctic krill sauce (AkS) has been developed to meet Chinese tastes while also filling a gap in high-value Antarctic krill processing [2].
Process optimization is highly important for improving product quality. Traditional aquatic product processing relies heavily on sensory evaluation and experiences from humans, which lack scientific value and cannot objectively reflect the quality of the products, potentially affecting consumer acceptability. The Back propagation (BP) neural network is one of the most widely used artificial networks [9]. It determines the ideal weights and thresholds via the gradient descent approach and repeated learning training, resulting in lower error value prediction for sensory evaluation. When combined with the fact that the genetic algorithm (GA) can effectively generate multi-level and multi-factor global optimization design algorithms, it can effectively mitigate the impact of local optimal solutions [10]. Zhao et al. [11] effectively used the response surface method (RSM) and the GA-BP models to extract taxanes from Taxus cuspidata. Jacob and Benerjee [12] employed the RSM and artificial neural network coupled with GA models to optimize the process of the synergistic digestion of potato waste and aquatic weeds. The improved approach resolved the acid extraction issue and increased the conversion rate by 6%. As a result, using a GA-BP neural network may successfully minimize the human subjective impact on the sensory evaluation of AkS, allowing for the optimization of the AkS production process.
In this study, we designed an AkS and optimized its production process using salt addition, rock sugar addition, the addition of an oil-to-material ratio as a single factor, and a sensory evaluation scores as response values. The optimized process from the RSM was then submitted to BP neural network for training before being integrated with a GA to globally optimize the AkS production process. The experimental results provide the optimal production process for AkS and basic application data for the development and utilization of high-value Antarctic krill products.
2. Materials and Methods
2.1. Materials and Reagents
The Antarctic krill were obtained during China’s 37th Antarctic Expedition. All the Antarctic krill samples were preserved on the boat at −40 °C and brought to the laboratory in June. The Antarctic krill were stored at −80 ℃ in the laboratory before use. Other ingredients, including garlic, dried chili, onion, Jinhua ham, salt, chili pepper, cooking oil, rock sugar, soy sauce, and oyster sauce, were obtained from a market in Dalian, China.
All of the chemical reagents were of analytical grade and purchased from Sinopharm Chemical Reagent Co., Ltd. (Shanghai, China). Nutrient agar, triple-sugar-iron agar, chromogenic Salmonella agar, and Baird Parker agar were all obtained from BD Pharmingen (Shanghai Yubo Biotechnology Co., Ltd., Shanghai, China).
2.2. AkS Preparation
The AkS was produced using the processing approach shown in Figure S1, with slight modifications as previously described by Chi et al. (2024) [2]. Briefly, raw Antarctic krill were thawed in running water before being cooked in boiling water. The cooked Antarctic krill were then drained at room temperature, leaving a water content of around 35%. The dried Antarctic krill were placed into a sterile bag and stored at 4 °C overnight. Individual Antarctic krill shorter than 3 cm in length were crushed, whereas Antarctic krill more than 3 cm in length were utilized for processing.
The Jinhua ham, garlic, dried chili, and chili peppers were crushed before use. Prior to combining all of the crushed ingredients, the cooking oil was heated in a cooking machine. Throughout the whole process, all of the ingredients were blended and the oil temperature remained below 130 °C. After 5 min of stirring, seasonings such as salt, rock sugar, soy sauce, and oyster sauce were added to the mixture. After 10 min of stirring, the AkS was cooled and ready to be transferred to a sterile container for further investigation.
2.3. Optimization of Preparation Conditions for AkS
2.3.1. Single-Factor Experimental Design
Single-factor conditions included salt, rock sugar, and the oil-to-material ratio. The AkS produced in Section 2.2 was mixed with various salts (0%, 2%, 4%, 6%, and 8%), rock sugars (0.4%, 0.8%, 1.2%, 1.6%, and 2.0%), and oil-to-material ratios (0.4:1, 0.6:1, 0.8:1, 1:1, and 1.2:1). The sensory evaluation served as the response value for optimizing the process conditions.
2.3.2. Training and Fitting of BP Neural Networks
The tansig and purelin functions were used to trigger the implicit and output layers, respectively, and the BP neural network was trained according to Chi et al. [2]. The model has three input neurons, including salt addition, rock sugar addition, and the oil-to-material ratio, and one output-layer neuron, representing a sensory evaluation of the AkS. According to empirical equations and the trial-and-error method, the optimal number of neurons in the hidden layer was determined to be 10, and the network topology under the modeling conditions was set to the 3-10-1 type, which was modeled after the different preparation processes of AkS in order to investigate the effects of different factors on its sensory evaluation [2]. The input layer is entered, and the input data are normalized via the mapminmax function. The goal error for training is 0.00001, the learning rate is 0.01, and the maximum number of training steps is 1000. Finally, the mean square error (MSE) is used to evaluate the prediction capacity of the BP neural-network-based model [2].
2.3.3. GA Optimization Design
After training and fitting the BP neural network, the established neural network model was used as the fitness function, and the basic parameters of the GA were set according to Yin et al. [13]. Briefly, the setting parameters were as follows: the population size sizepop = 20, the crossover probability pcross = 0.4, the mutation probability pmutation = 0.2, the length of the individual lenchrom = [1 1 1], and the maximal number of iterations maxgen = 100, with the maximum value of the sensory score as the goal of the GA extreme value optimization operation (the overall procedure followed is shown in Figure S1). The aim was to obtain the optimal process parameters and then perform an experimental verification.
2.4. Color Determination
The color of AkS was determined using a colorimeter (Konica, Tokyo, Japan, Shanghai iBetter Technology Co., Ltd., Shanghai, China) and the results were expressed as L*, a*, b*, and ΔE, as described previously by Chi et al. (2024) [2].
2.5. Sensory Evaluation
A total of ten experienced participants (5 males and 5 females) with normal taste sensitivity and a specific sensory evaluation background were recruited to assess the color, odor, flavor, and texture of AkS using the sensory evaluation criteria (Table 1).

Table 1.
Sensory evaluation criteria for AkS.
2.6. Nutritional Indicator Determination
The determination of nutritional indicators, including moisture, protein, ash, carbohydrate, energy, fat, sodium, and other conventional nutrients, in the optimized AkS was carried out according to previous studies [14,15].
2.7. Oxidative Stability of AkS
The oxidative stability of AkS was detected by measuring its acid value (AV), peroxide value (POV), and thiobarbituric acid reactive substance (TBARS) according to Zhang et al. (2022) [16].
2.8. Microbiological Detection of AkS
After the AkS samples were aseptically weighed to 25 g, the homogenates were mixed with 225 mL of saline. After 30 min, a tenfold gradient dilution was made, and 100 μL was aspirated onto the appropriate plates for use. The total colony count (TVC), coliform, Salmonella sp., and Staphylococcus aureus were detected in accordance with Jiang et al. (2022) [17], the National Criterion of China GB 4789.38-2012 [18], GB/T 13,091-2018 [19], and GB/T 4789.10-2016 [20], respectively. The microbiological detection results were expressed as colony-forming units, CFU/g.
2.9. Statistical Analysis
The experimental data were collected at least three times and were presented as “mean ± standard deviation (SD)”. The figures for the single-factor analyses were made by Origin 2018. The raw data were processed using Microsoft Excel 2016. SPSS 24.0 software (SPSS, Chicago, IL, USA) was used for analysis of variance.
The salt addition amount (A), rock sugar amount (B), and oil-to-material ratio (C) were used as independent variables at three levels for RSM design. Sensory evaluation was used as the response value. The Box–Behnken design was created according to independent variables. The central composite was designed at three levels, encoded as −1 (low), 0 (moderate), and +1 (high) according to Xu et al. [21]. The response surface plot figures were produced by Design Expert 12.0 (Stat-Ease, Minneapolis, MN, USA). The statistical significance of the RSM-based model was determined and validated by analysis of variance (ANOVA). A quadratic design was used to quantify the response outcome and regression analysis in every test run.
Duncan’s multiple-range test was employed to determine significant differences at p < 0.05. The BP neural network model was created using MATLAB R2017b. All of the figures related to the BP neural network training and fitting, as well as the GA adaptation curve, were produced using MATLAB R2017b (Mathworks Inc., Natick, MA, USA).
3. Results
3.1. Single-Factor Analysis
According to Figure 1a, the sensory score was highest when the rock sugar addition and the oil-to-material ratio remained constant and the salt addition was 2.0%, attaining a sensory score of 90.2. However, the salt content in the product caused the salinity value to exceed the human body’s adaptation value and the sensory score decreased continuously as the salt addition increased. When the amount of salt added reached 8%, the sensory score dropped to the lowest value. As a result, the 2% salt addition level was chosen as the response surface experimental design’s center value.
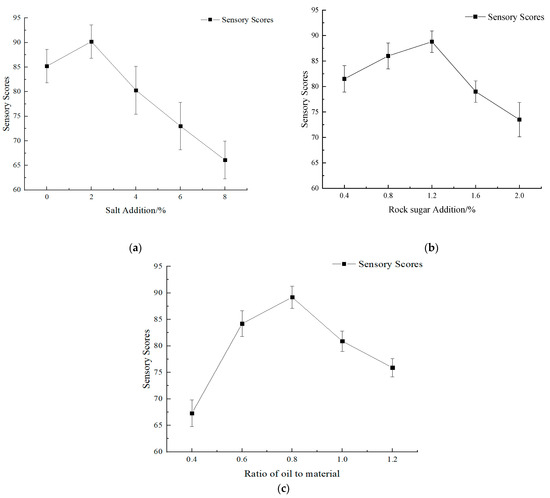
Figure 1.
Effects of salt addition (a), rock sugar addition (b), and the oil-to-material ratio (c) on the sensory scores of AkS.
As shown in Figure 1b, the sensory score for the AkS increased and subsequently decreased as the quantity of rock sugar added increased. The sensory score was 82.5 at initial point, and reached a maximum when the amount of rock sugar added was 1.2%. The sensory scores declined with the quantity of rock sugar added, reaching 76.0 and 73.2 at the 1.6% and 2.0% addition points, respectively. Therefore, the addition of 1.2% rock sugar was chosen as the center value of the response surface experimental design.
Food texture can influence oral behavior and taste release, which are essential criteria for evaluating meal quality. Furthermore, changes in the oil-to-material ratio might impact the textural properties of the product, such as granularity and fluidity. The sensory scores for the AkS increased as the oil-to-material ratio increased from 0.4 to 0.8, as shown in Figure 1c, and then began to decrease after the ratio continued to increase from 0.8. As a result, the oil-to-material ratio of 0.8 was chosen as the response surface experimental design’s center value.
Salt addition, rock sugar addition, and the oil-to-material ratio were employed as dependent variables A, B, and C, respectively. The sensory scores for the AkS were used as response values, and the findings of the test factors and levels based on the single-factor test are shown in Table 2.
Table 2.
Box–Behnken design factors and levels.
3.2. Color Detection
Table 3 shows the color of the AkS under various processing conditions. The addition of salt to the AkS had no effect on its color (p > 0.05). When no salt was added to the Aks, the L* value was 23.84 ± 0.07. Increasing the amount of salt resulted in fluctuations. Similarly, a* displayed the same up–down situation, yet the values were all less than the starting position (0% addition). The addition of 4.0%, 6.0%, and 8.0% salt resulted in lower b* values (−14.10 ± 0.32, −14.03 ± 0.12, and −14.30 ± 0.51, respectively) than those at the beginning point (−13.96 ± 0.09). Therefore, the ΔE varied from 75.75 ± 0.11 at the beginning to 79.24 ± 5.30 after a salt addition of 8.0%.
Table 3.
Effects of different factors and levels on the color of AkS.
Moreover, varying the amount of rock sugar had no obvious effect on the color of the AkS. Lower amounts of rock sugar (0%, 0.8%, and 1.2%) in the AkS resulted in similar L* values of 24.87 ± 0.03, 24.61 ± 0.20, and 24.88 ± 0.07, respectively. Higher amounts of rock sugar (1.6% and 2.0%) resulted in higher L* values of 25.56 ± 0.05 and 27.96 ± 0.05, respectively. The a* values ranged from 2.58 ± 0.10 for low amounts to 2.67 ± 0.08 for high amounts. The application of 0% to 1.6% rock sugar resulted in equal b* and ΔE values. However, an increase of 1.8% resulted in lower b* and higher ΔE values.
Increasing the oil-to-material ratio resulted in significantly higher L* and b* values for the AkS (p < 0.05). The L* values increased from 22.18 ± 0.04 at 0.4 to 27.96 ± 0.37 at a 1.2 oil-to-material ratio. Similarly, the b* increased from 14.54 ± 0.56 at 0.4 to −9.01 ± 0.39 at a 1.2 ratio. When the oil-to-material ratio was between 0.4 and 1.0, the a* value was approximately 2.93, but the other oil-to-material ratios were approximately 2.76. The ΔE values decreased dramatically as the oil-to-material ratio increased from 77.27 ± 0.42 at 0.4 to 69.30 ± 0.54 at 1.2.
The single-factor analysis results revealed that salt and rock sugars have no effect on the color of AkS. Sensory scores, therefore, were used as the response values for the response surface design.
3.3. Optimization of AkS by Response Surface Method
3.3.1. Analysis of Response Surface Model
The response surface was conducted using sensory scores as response values on the basis of the experimental results of the single-factor analysis. The experimental results are shown in Table 4.
Table 4.
Central composite results.
The quadratic polynomial regression equations for multiple factors (salt addition for A, rock sugar addition for B, and the oil-to-material ratio for C) were determined. Table 5 displays the results of the model coefficients of significance and the variance analysis. The results showed that the influence of each component on the AkS sensory ratings was in the following order: A > C > B. The multiple-regression fitting of the sensory rating data yielded the following quadratic multinomial regression model: Y = 89.68 − 3.11A − 1.75B − 1.71C + 1.6AC − 7.74A2 − 3.51B2 − 4.89C2.
Table 5.
ANOVA of the central composite design.
The results in Table 5 demonstrated that the p-value of the overall model for the sensory evaluation of the AkS was less than 0.01, R2 = 0.98, (R2adj = 0.97) and that the value of the misfit term in the model was greater than 0.05, indicating that the error between the predicted and experimental values was relatively small, and that the model can be used to analyze and optimize the product. The initial terms, A, B, and C, as well as the interaction terms, A2, B2 and C2, showed extremely significant performances, whereas the interaction term, AC, illustrated significant performance.
3.3.2. Interaction Effects of Different Factors on Response Variables
Figure 2b,c reveals that the interaction between the addition of rock sugar and the oil-to-material ratio did not significantly differ (p > 0.05) from the interaction between the addition of rock sugar and the addition of salt. Figure 2a shows that when the salt content was greater than 0% but less than 2.0%, the sensory score increased; however, when the salt content exceeded 2.0%, the sensory score decreased. Similarly, when the amount of rock sugar added was between 0% and 1.2% and the oil-to-material ratio was between 0 and 0.8, the sensory score of the AkS increased, whereas when the amount of rock sugar added was greater than 1.2% and the oil-to-material ratio was greater than 0.8, the sensory score of the AkS decreased. As a result, Figure 2 reveals that the best sensory scores for the response surface were achieved with a combination of a salt addition of slightly less than 2%, a rock sugar addition of slightly less than 1.2%, and an oil-to-material ratio of slightly less than 0.8.
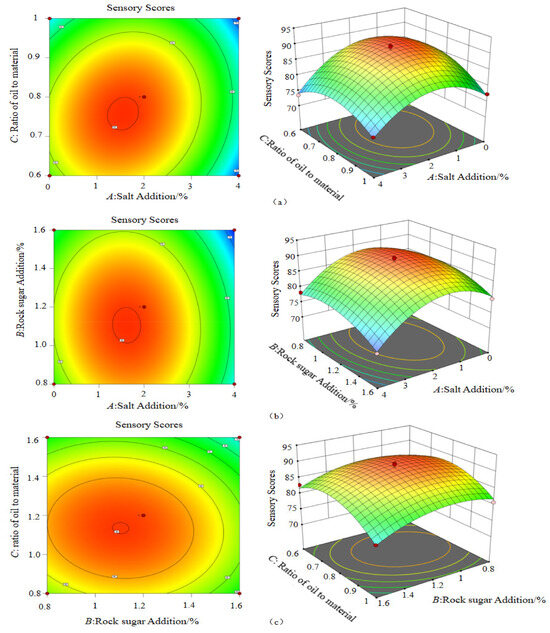
Figure 2.
Response surface plots of the effects of factor interactions on the sensory scores of AkS. (a) Effects of the interaction between the oil-to-material ratio and salt addition; (b) effects of the interaction between rock sugar addition and salt addition; (c) effects of the oil-to-material ratio and rock sugar addition.
3.4. BP Neural Networks Established
Figure 3 demonstrates how the mean square error (MSE) decreased throughout the BP neural network training. As shown in Figure 3, the MSE of the model decreased as the number of training steps increased, indicating the improved accuracy in describing the experimental data. The neural network achieved an optimal validation performance at 0.17 in the first epoch, and the MSE decreased below the predefined error goal value of 0.00001 in the third epoch. The test curve did not considerably increase until the validation curve rose, showing that the neural network was not overtrained.
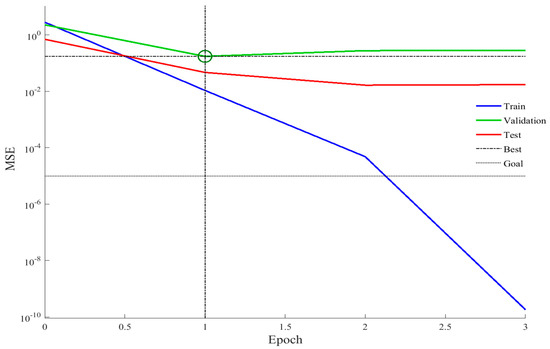
Figure 3.
Error drop curve of the neural network.
Figure 4 depicts the fitted plots of the experimental findings and neural network predictions for training, validation, testing, and overall. Figure 4 shows that the R-values of the training and the overall sets of the BP neural network were 0.98 and 0.95, respectively, and that the correlation coefficients were greater than 0.90, indicating that there was no under-fitting state in the established BP neural network model; the R-values of the testing and validation sets were 1, indicating that the neural network model did not have an over-fitting state and that there was a better fit between the training and the validation sets.
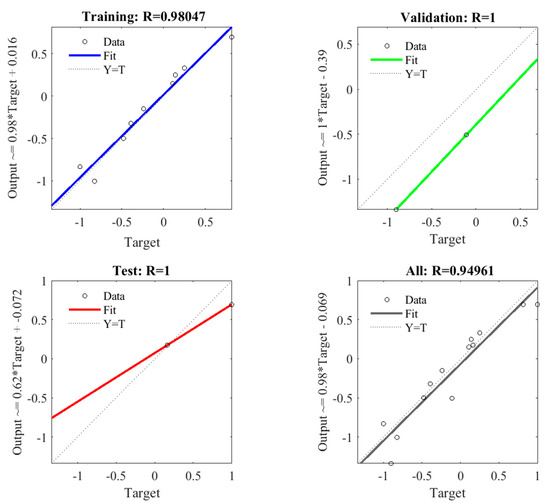
Figure 4.
Training, validation, testing, and all the prediction sets of the BP neural network models.
Finally, the model had a low simulation error and good data interpretation ability, it can be improved to express the mapping relationships among salt addition, rock sugar addition, the oil-to-material ratio, and sensory scores, and it can be applied to the optimization of AkS preparation.
3.5. Data Detection with BP Neural Networks
The generalized ability of the constructed model may be assessed by selecting data from the response-surface experimental design factor level table, which was outside of its training range for the test. The test values, network predictions, and relative errors for the coding factors [0 0 1], [0 0 −1], [1 0 0], [−1 0 0], and [1 1 1] are shown in Table 6. The maximum relative error between the test values of the samples and the predicted values of the neural network was 3.06% (less than 5.00%), the average relative error was 1.70%, and the goodness of fit between the test values and the predicted values was 0.95, indicating that the neural network had a high generalization ability to predict the sensory ratings of samples that were not in the training set, as shown in Table 6.
Table 6.
Prediction results of BP neural network model and its relative error.
3.6. GA Optimization
Figure 5 depicts the relationship between the fitness values and the number of GA evolutionary generations. The data revealed that the absolute values of the population’s average fitness and highest fitness began to rise significantly, stabilized after 40 generations of iterative evolution, and converged near 93.02 at the 80th iteration. The entire GA process proceeded via crossover–selection–mutation–crossover–selection. When the number of evolutionary generations reached 100, the GA ended selection and acquired the individual with the greatest sensory score adaptation, completing the program. The optimal outcomes were as follows: the optimal sensory score was 93.0, with a salt addition of 1.4%, a rock sugar addition of 1.1%, and an oil-to-material ratio of 0.8. The value point for the optimal solution was determined by the analysis results of the response surface model. The GA-BP neural network’s optimization results were examined, and the experimental value of the model’s optimal solution was 92.0, with a relative error of 1.1% with the model’s optimized value, indicating that the GA-BP neural network can be effectively applied to the optimization of AkS preparation.
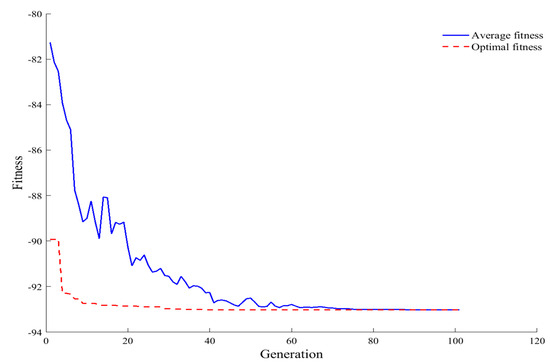
Figure 5.
GA adaptation curve.
3.7. Testing of Nutritional Indicators and Sensory Evaluation Detection
After the GA-BP neural network was optimized, the sensory evaluation and nutritional indices of the Aks were investigated. The sensory evaluation improved from a low point of 72.6 to 93.0 with color, odor, flavor, and texture ratings of 22.0, 24.0, 23.0, and 24.0, respectively. Moreover, the nutritional indicator results demonstrated that the optimized AkS had a complete nutritional composition, with high contents of protein, fat, carbohydrates, and energy (14.0 g/100 g, 38.1 g/100 g, 24.9 g/100 g, and 2071 kJ/100 g, respectively).
3.8. Oxidative Stability Analysis of AkS
Oxidation indicators are among the important variables for determining the safety and quality of fat-rich seafood. As shown in Table 7, the AV of AkS was 0.38 mg/100 g, the POV was 0.04 g/100 g, and the TBARS value was 0.62 mg/kg.
Table 7.
Oxidative indicators analysis of AkS.
3.9. Microbiological Detection
The TVC and coliform counts were less than 10 CFU/g, and Salmonella sp. and S. aureus were not detected (shown in Table 8), indicating that the samples were consistent with hygienic standards for sauce products and commercially sterile. These findings suggest that the processed AkS is environmentally friendly and safe, that the preparation method is less polluting, and that it may be used in the food industry as a high-value product of Antarctic krill.
Table 8.
Microbiological analysis of AkS.
4. Discussion
Antarctic krill are an enormous and nutritious resource, and they are widely regarded as the world’s last available protein source [1]. Furthermore, Antarctic krill are high in unsaturated fatty acids, and a distinct flavor emerges after boiling [1]. To preserve the distinct flavor of Antarctic krill while highlighting the salty, sweet, and umami flavor of the AKS, it was produced with an intense flavor, seasoned, and made suitable for Chinese tastes. In this study, we therefore used the response surface method to optimize the amount of salt, rock sugar, and oil-to-material ratio. The data from the response surface method were subsequently input into the BP neural network for training, and the results were integrated with the GA to obtain the optimum process performance for the AkS.
Throughout the AkS optimization process, sensory evaluation as a response value, which has a direct influence on consumer purchasing willingness and is one of the major indicators for food processing optimization [22], was employed to construct the response surface. Sensory evaluations may produce varied evaluation results, depending on personnel perspectives [23]. Instead, artificial intelligence (AI) is being used in sensory evaluation, food processing, and other industries to improve efficiency and accuracy [24]. BP neural networks have been widely used in combination with GA to optimize bioactive substance extraction [25,26], as well as industrialized performance prediction and optimization [27,28]. In our study, we initially optimized the AkS process using a response surface method, and the optimized AkS process from the response surface method produced results similar to those from the GA-BP neural network. The BP neural network prediction values after training demonstrated a lower relative error. The minimal and maximal relative errors were 0.02% and 3.06%, respectively, demonstrating that the BP neural network performs better in prediction. Yang et al. (2022) [29] compared the GA-BP neural network to the response surface method for extracting selenium-containing proteins and discovered that the GA-BP neural network delivered a better optimal extraction procedure. The results suggested that AI might replace the traditional evaluation approach. Because of its self-learning skills, adaptable capacity, and excellent fault tolerance, AI technologies are currently widely employed to tackle a variety of issues in food processing, optimization, data interpretation, and analysis [30,31,32]. Peveler compared sensory arrays with machine learning analysis to mammalian noses or tongues from a sensory perspective. He discovered that machine learning analysis, as a novel tool, can deliver authenticity and reliable evaluation outcomes [33].
With optimization, the AkS was developed, and the sensory evaluation and oxidative, nutritional, and microbiological parameters were assessed. The AkS exhibited a complete nutritional profile, with substantial levels of protein, fat, carbohydrates, and energy. Even though the same products as AkS are rarely found on the market, related items such as XO seafood sauces are quite popular in China. Compared with the nutritional information from other XO sauce labels, the AkS had similar protein contents (2.24 g/16 g) and energy (331.36 KJ/16 g) as the 2.0 g/16 g of protein and 352 KJ/16 g of energy in XO sauce. In comparison to XO sauces, the AsK includes less fat and more carbohydrates. These findings suggest that AkS will be popular because to its taste and nutritional profile. While the nutrition information for sodium contents was missing, subsequent work on Aks’ sodium contents should be completed quite quickly. The TVC and coliform were less than 10 CFU/g, indicating that high standards of hygiene were maintained throughout the process. Moreover, pathogenic bacteria such as Salmonella sp. and S. aureus were not identified, indicating that the microbiological indices of the AkS conform with the requirements set by GB 10133-2014 [34]. The AkS has a delicious flavor and provides plenty of protein and energy to satisfy modern consumer preferences for Antarctic krill products. Although the optimized product results in decreased fat oxidation, relevant research has indicated that fat oxidation is the primary cause of diminished quality in Antarctic krill products [2,35,36,37]. As a result, further studies will focus on predicting the shelf-life of AkS.
5. Conclusions
In this study, the AkS process was first submitted to a single-factor test to thoroughly examine the effects of salt addition, rock sugar addition, and the oil-to-material ratio. The experimental results from the Box–Behnken design of RSM were utilized to create a BP neural network (topology 3-10-1) for product indication simulation and prediction. Combined with the GA for the optimization of the process parameters, the optimal process for the AkS was obtained, as follows: salt addition of 1.4%, rock sugar addition of 1.1%, oil-to-material ratio of 0.8. Under the optimal process, the sensory scores reached 93.0, and the error between the experimental value and the predicted value was 1.1%, with a high prediction accuracy, indicating that the GA-BP neural network modeling method has a certain prediction and optimization ability for AkS preparation.
The optimized products of the AkS were assessed for nutritional, hygiene, and safety indices. The optimized AkS had 14.0 g/100 g of protein, 24.9 g/100 g of carbohydrates, 38.1 g/100 g of fat, and 2071 kJ/100 g of energy, respectively. The AV value of the product was 0.38 mg/g, the POV was 0.04 g/100 g, and the TBARS value was 0.62 mg/kg. The bacterial count and coliform were low (<10 CFU/g), and S. aureus and Salmonella sp. were not detected. Therefore, commercial sterility was achieved, indicating the good hygienic conditions and safety of consumption of the prepared AkS. Overall, the output of the GA-BP neural network optimization can provide fundamental data and a theoretical framework for high-value AkS production. Future work to benefit the food industries should focus on the oxidative degradation of AkS in relation to quality changes and shelf-life prediction.
Supplementary Materials
The following supporting information can be downloaded at: https://www.mdpi.com/article/10.3390/app14167337/s1, Figure S1: Antarctic krill sauce processing work flow.
Author Contributions
Conceptualization, L.Z., Z.F. and H.C.; methodology, Z.F., H.C. and L.L.; software, H.C. and D.Y.; validation, H.C. and P.W.; data curation, P.W., L.Z., Z.F. and H.C.; writing—original draft preparation, H.C., Z.F., P.W., J.Z. and D.Y.; writing—review and editing, H.C., Z.F., P.W., Y.L., L.L. and J.Z.; project administration, H.C. and J.Z.; funding acquisition, H.C. All authors have read and agreed to the published version of the manuscript.
Funding
This research was funded by National Key R&D Program of China grant number 2023YFD2401200.
Data Availability Statement
The raw data supporting the conclusions of this article will be made available by the authors on request.
Conflicts of Interest
The authors declare no conflicts of interest.
References
- Yang, X.; Shi, Y.; Cai, Y.; Chi, H. Quality changes and safety evaluation of ready-to-eat roasted Antarctic krill (Euphausia superba) during storage at room temperature (25 °C). J. Ocean. Univ. China 2023, 22, 235–241. [Google Scholar] [CrossRef]
- Chi, H.; Zhang, Y.; Zhao, L.; Lin, N.; Kang, W. Quality Analysis and Shelf-Life Prediction of Antarctic Krill (Euphausia superba) Sauce Based on Kinetic Model and Back Propagation Neural Network Model. J. Food Process. Preserv. 2024, 1, 4506851. [Google Scholar] [CrossRef]
- Suzuki, T.; Shibata, N. The utilization of Antarctic krill for human food. Food Rev. Int. 1990, 6, 119–147. [Google Scholar] [CrossRef]
- Nicol, S.; Foster, J.; Kawaguchi, S. The fishery for Antarctic krill-recent developments. Fish Fish. 2012, 13, 30–40. [Google Scholar] [CrossRef]
- Yoshitomi, B. Utilization of Antarctic krill for food and feed. Dev. Food Sci. 2004, 42, 45–54. [Google Scholar]
- Ge, M.; Chen, R.; Zhang, L.; Wang, Y.; Chi, C.; Wang, B. Novel Ca-Chelating Peptides from Protein Hydrolysate of Antarctic Krill (Euphausia superba): Preparation, Characterization, and Calcium Absorption Efficiency in Caco-2 Cell Monolayer Model. Mar. Drugs 2023, 21, 579. [Google Scholar] [CrossRef]
- Gigliotti, J.C.; Jaczynski, J.; Tou, J.C. Determination of the nutritional value, protein quality and safety of krill protein concentrate isolated using an isoelectric solubilization/precipitation technique. Food Chem. 2008, 111, 209–214. [Google Scholar] [CrossRef]
- Sun, R.; Liu, X.; Yu, Y.; Miao, J.; Leng, K.; Gao, H. Preparation process optimization, structural characterization and in vitro digestion stability analysis of Antarctic krill (Euphausia superba) peptides-zinc chelate. Food Chem. 2021, 340, 128056. [Google Scholar] [CrossRef] [PubMed]
- Khoshnoudi-Nia, S.; Moosavi-Nasab, M. Prediction of various freshness indicators in fish fillets by one multispectral imaging system. Sci. Rep. 2019, 9, 14704. [Google Scholar] [CrossRef]
- Fuchs, R.H.; Ribeiro, R.P.; Bona, E.; Matsushita, M. Development of a freeze-dried mixture of Nile tilapia (Oreochromis niloticus) croquette using a GA-based multiobjective optimisation. J. Sci. Food Agric. 2013, 93, 1042–1048. [Google Scholar] [CrossRef]
- Zhao, Z.; Zhang, Y.; Meng, H.; Li, W.; Wang, S. Identification and Optimization of a Novel Taxanes Extraction Process from Taxus cuspidata Needles by High-Intensity Pulsed Electric Field. Molecules 2022, 27, 3010. [Google Scholar] [CrossRef]
- Jacob, S.; Banerjee, R. Modeling and optimization of anaerobic codigestion of potato waste and aquatic weed by response surface methodology and artificial neural network coupled genetic algorithm. Bioresour. Technol. 2016, 214, 386–395. [Google Scholar] [CrossRef] [PubMed]
- Yin, F.; Mao, H.; Hua, L. A hybrid of back propagation neural network and genetic algorithm for optimization of injection molding process parameters. Mater. Des. 2011, 32, 3457–3464. [Google Scholar] [CrossRef]
- Adamczak, L.; Florowski, T.; Chmiel, M.; Pietrzak, D. Chemical Composition of Edible Ostrich Offal. J. Poult. Sci. 2017, 54, 326–330. [Google Scholar] [CrossRef][Green Version]
- Aberoumand, A. Preliminarily comparison of nutritional composition of some fresh and processed seafood. Pak. J. Biol. Sci. 2012, 15, 951–953. [Google Scholar] [CrossRef] [PubMed]
- Zhang, H.; Zhang, L.; Yang, X.; Cheng, W.; Huang, Y.; Liang, P. Oxidative stability of marine phospholipids derived from large yellow croaker roe. Food Res. Int. 2022, 160, 111743. [Google Scholar] [CrossRef]
- Jiang, L.; Zhang, B.; Liu, S.; Zhu, L.; Zhu, F. The MBS microbial rapid detection system for rapid detection of major pathogenic bacteria in feed: Comparison with plate counting method. BMC Microbiol. 2022, 22, 242. [Google Scholar] [CrossRef]
- GB/T 18867–2019; Determination of Coliforms in Feeds. Standards Press of China: Beijing, China, 2019.
- GB/T 13091–2018; Determination of Salmonella in Feeds. Standards Press of China: Beijing, China, 2018.
- GB/T 4789.10–2016; National Food Safety Standard Food Microbiological Examination: Staphylococcus aureus. Standards Press of China: Beijing, China, 2016.
- Xu, N.; Sun, Y.H.; Guo, X.L.; Liu, C.; Mao, Q.; Hou, J.M. Optimization of ultrasonic-microwave synergistic extraction of polysaccharides from Morchella conica. J. Food Process. Preserv. 2017, 42, e13423. [Google Scholar] [CrossRef]
- Schouteten, J.J.; Steur, H.D.; Pelsmaeker, S.D.; Lagast, S.; Juvinal, J.G.; Bourdeaudhuij, I.D. Emotional and sensory profiling of insect-, plant- and meat-based burgers under blind, expected and informed conditions. Food Qual. Prefer. 2016, 52, 27–31. [Google Scholar] [CrossRef]
- Pambo, K.O.; Okello, J.J.; Mbeche, R.M.; Kinyuru, J.N.; Alemu, M.H. The role of product information on consumer sensory evaluation, expectations, experiences and emotions of cricket-flour-containing buns. Food Res. Int. 2018, 106, 532–541. [Google Scholar] [CrossRef]
- Nath, P.C.; Mishra, A.K.; Sharma, R.; Bhunia, B.; Mishra, B.; Tiwari, A.; Nayak, P.K.; Sharma, M.; Bhuyan, T.; Kaushal, S.; et al. Recent advances in artificial intelligence towards the sustainable future of agri-food industry. Food Chem. 2024, 447, 138945. [Google Scholar] [CrossRef] [PubMed]
- Zhang, Z.; Guo, S.; Chen, C.; Lin, J.; Chen, L.; Wang, D.; Hu, J.; Chen, X.; Yang, J.; Li, Y.; et al. Optimization of extraction and bioactivity detection of celery leaf flavonoids using BP neural network combined with genetic algorithm and response. Prep. Biochem. Biotechnol. 2022, 52, 648–656. [Google Scholar] [CrossRef]
- Qiu, J.; Shi, M.; Li, S.; Ying, Q.; Zhang, X.; Mao, X.; Shi, S.; Wu, S. Artificial neural network model- and response surface methodology-based optimization of Atractylodis Macrocephalae Rhizoma polysaccharide extraction, kinetic modelling and structural characterization. Ultrason Sonochem. 2023, 95, 106408. [Google Scholar] [CrossRef] [PubMed]
- Xu, J.; Zhao, Y. Stability Analysis of Geotechnical Landslide Based on GA-BP Neural Network Model. Comput. Math. Methods Med. 2022, 2022, 3958985. [Google Scholar] [CrossRef]
- Ning, Y.; Jin, Y.; Peng, Y.; Yan, J. Small obstacle size prediction based on a GA-BP neural network. Appl. Opt. 2022, 61, 177–187. [Google Scholar] [CrossRef] [PubMed]
- Yang, T.; Lai, H.; Cao, Z.; Niu, Y.; Xiang, J.; Zhang, C.; Shang, L. Comparison of an Artificial Neural Network and a Response Surface Model during the Extraction of Selenium-Containing Protein from Selenium-Enriched Brassica napus L. Foods 2022, 11, 3823. [Google Scholar] [CrossRef]
- Qian, J.; Dai, B.; Wang, B.; Zha, Y.; Song, Q. Traceability in food processing: Problems, methods, and performance evaluations-a review. Crit. Rev. Food Sci. Nutr. 2022, 62, 679–692. [Google Scholar] [CrossRef]
- Bhagya, R.G.; Dash, K.K. Comprehensive study on applications of artificial neural network in food process modeling. Crit. Rev. Food Sci. Nutr. 2022, 62, 2756–2783. [Google Scholar] [CrossRef] [PubMed]
- Theodore, T.P.; Nfor, K.A.; Kim, J.I.; Kim, H.C. Applications of Artificial Intelligence, Machine Learning, and Deep Learning in Nutrition: A Systematic Review. Nutrients 2024, 16, 1073. [Google Scholar] [CrossRef]
- Peveler, W.J. Food for Thought: Optical Sensor Arrays and Machine Learning for the Food and Beverage Industry. ACS Sens. 2024, 9, 1656–1665. [Google Scholar] [CrossRef]
- GB/T 10133–2014; National Food Safety Standard Aquatic Condiment. Standards Press of China: Beijing, China, 2014.
- Zheng, Y.; Zhang, S.; Yang, L.; Wei, B.; Guo, Q. Prevention of the Quality Degradation of Antarctic Krill (Euphausia superba) Meal through Two-Stage Drying. Foods 2024, 13, 1706. [Google Scholar] [CrossRef] [PubMed]
- Ni, L.; Jiang, C.; Guo, Q.; Chi, H.; Fan, C.; Shi, J.; Lin, N.; Liu, Z.; Chen, S. Metabolomics analysis of physicochemical properties associated with freshness degradation in frozen Antarctic krill (Euphausia superba). Food Res. Int. 2024, 183, 114190. [Google Scholar] [CrossRef] [PubMed]
- Bao, J.; Chen, L.; Liu, T. Dandelion polysaccharide suppresses lipid oxidation in Antarctic krill (Euphausia superba). Int. J. Biol. Macromol. 2019, 133, 1164–1167. [Google Scholar] [CrossRef] [PubMed]


Disclaimer/Publisher’s Note: The statements, opinions and data contained in all publications are solely those of the individual author(s) and contributor(s) and not of MDPI and/or the editor(s). MDPI and/or the editor(s) disclaim responsibility for any injury to people or property resulting from any ideas, methods, instructions or products referred to in the content. |
© 2024 by the authors. Licensee MDPI, Basel, Switzerland. This article is an open access article distributed under the terms and conditions of the Creative Commons Attribution (CC BY) license (https://creativecommons.org/licenses/by/4.0/).