Article

Analysis of Damage and Permeability Evolution of Sandstone under Compression Deformation

1
Jiangxi Transportation Institute Co., Ltd., Nanchang 330200, China
2
State Key Laboratory of Performance Monitoring and Protecting of Rail Transit Infrastructure, East China Jiaotong University, Nanchang 330013, China
*
Author to whom correspondence should be addressed.
Appl. Sci. 2024, 14(16), 7368; https://doi.org/10.3390/app14167368 (registering DOI)
Submission received: 11 July 2024 / Revised: 18 August 2024 / Accepted: 19 August 2024 / Published: 21 August 2024

Abstract

:
A large number of experimental studies have demonstrated that the permeability and damage of rock are not constant but rather functionally dependent on stresses or stress-induced deformation. Neglecting the influence of damage and permeability evolution on rock mechanics and sealing properties can result in an overestimation of the safety and stability of underground engineering, leading to an incomplete assessment of the risks associated with surrounding rock failure. To address this, the damage and permeability evolution functions of rock under compression were derived through a combination of experimental results and theoretical analysis, unifying the relationship between porosity and permeability in both porous media flow and fractured flow. Based on this, a fluid–solid coupled seepage model considering rock damage and permeability evolution was proposed. More importantly, this model was utilized to investigate the behavior of deformation, damage, and permeability, as well as their coupled effects. The model’s validity was verified by comparing its numerical results with experimental data. The analysis results show that the evolution of permeability and porosity resulted from a competitive interaction between effective mean stress and stress-induced damage. When the effective mean stress was dominant, the permeability tended to decrease; otherwise, it followed an increasing trend. The damage evolution was primarily related to stress- and pressure-induced crack growth and irreversible deformation. Additionally, the influence of the seepage pressure on the strength, damage, and permeability of the investigated rock was evaluated. The model results reveal the damage and permeability evolution of the rock under compression, which has a certain guiding significance for the stability and safety analysis of rock in underground engineering.

1. Introduction

The construction and excavation of underground engineering often cause the redistribution of stresses in the surrounding rock, and the resulting new cracks and damage deformation have adverse effects on the safety and stability of the engineering facilities [1,2,3]. Moreover, stress-induced damage further leads to an increase in permeability and causes leakage accidents, such as natural gas and nuclear waste leakage in underground chambers due to the damage and cracking of surrounding rock, mine cavern collapse, tunnel lining cracking, and water leakage caused by excavation disturbance [4,5]. The interaction of seepage and damage is actually a fluid–solid coupling effect. Stress-induced damage and deformation lead to changes in the pore and crack structure of the rock, and the resulting fluid flow (seepage field) reacts on the stress field, affecting the volume deformation and crack growth, forming a full coupling. One can see that safety accidents in underground engineering are usually not caused by a single factor but are the result of multi-factor coupling.
The deformation and permeability characteristics of rocks or rock formations become complicated under the strong influence of a fluid–solid coupling effect. Laboratory test results and engineering practice indicate that the seepage and mechanical parameters of rock are not constant [6,7,8,9] but are a function of stress or stress-induced deformation, which poses a significant obstacle to analyzing and predicting the flow behavior of fluids in rocks and the deformation behavior of rocks. However, this work has to be conducted because the characteristics of rock permeability and damage evolution widely exist in underground engineering, such as underground energy storage, unconventional petroleum and gas extraction, nuclear waste disposal, carbon dioxide geological storage, and underground chamber excavation.
As a geotechnical material, the crack closure, growth, and propagation in rocks under mechanical loading make a relationship and interaction between seepage and damage. This is best evidenced by the hydraulic fracturing of rocks, and the permeability changes dramatically due to damage in fracturing rocks (also known as the permeability surge phenomenon) [10,11,12]. In fact, whether to consider the flow–solid coupling effect has a huge impact on the flow behavior of fluids and the deformation behavior of rocks. Many scholars have established the relationship between permeability and effective stress based on triaxial compression tests, including logarithmic functions and exponential functions [13,14,15]. These prediction models can well describe the change in permeability during the rock compaction stage but cannot explain the drastic change in permeability in the stage of rock dilatancy. This is because the influence of damage on permeability evolution cannot be ignored, and it is as important as effective stress. Another major problem is to characterize the damage behavior of rocks, which depends on the research tools and methods. At present, studies on rock damage characteristics mainly focus on theoretical analysis based on continuum mechanics, experimental analysis based on acoustic emission tests, and mesoscopic damage analysis based on statistical physics [7,16,17,18]. Revealing the characteristics of permeability and damage evolution in rocks is the key to accurately describing the fluid flow behavior and rock deformation behavior.
The permeability and damage evolution of rocks is not a single problem of mechanics or seepage but the result of the interaction between the stress field and flow field [19,20,21]. Given the complexity of the problem, one of the most effective study methods is numerical simulation. But there is a prerequisite; that is, it is necessary to establish a relationship model that can describe the evolution of rock damage and permeability. Tang et al. [22] proposed damage and permeability evolution equations for rocks using piecewise functions and established a flow–stress–damage coupling model considering the effects of the growth of existing cracks and the formation of new cracks. This model was implemented based on RFPA (Rock Failure Process Analysis code (F-RFPA2D)). Zhang et al. [23] proposed a porosity and permeability model for coal by theoretical analysis and then combined it with Biot’s poroelasticity theory for porous media to establish the fluid–solid coupling model. This model was used for a coupled study on gas flow and coal deformation. Luo et al. [24] developed a three-dimensional seepage–stress coupling model using an extended finite element method. This model was used to simulate the crack propagation paths and pore fluid pressure distribution. It is worth thinking that all theoretical models cannot be separated from experimental phenomena and actual engineering, and their effectiveness needs to be verified. Li et al. [25] investigated the intricate interplay between hydraulic coupling, creep damage, and permeability evolution mechanisms in phyllite and verified the relationship between effective damage and permeability.
The objective of this paper was to reveal the coupling mechanism of damage and permeability in rock under compression deformation. For this purpose, a large number of rock mechanics and permeability tests were carried out. Based on the test results, theoretical analysis, and previous studies, the damage and permeability evolution expressions were proposed, respectively, and introduced into the fluid continuity equation and the solid elastoplastic damage constitutive model. Finally, a fluid–solid coupling seepage model for rocks was established. More importantly, the model was developed by finite element software and applied to investigate the behavior of fluid seepage and rock damage evolution, and their interaction, in sandstone samples that were subjected to both hydraulic and triaxial compressive loads. This coupled model can be used for the analysis of fluid seepage and rock deformation under a fluid–solid coupling as well as the description of damage and permeability evolution behavior. It is expected to provide a theoretical reference for the study of coupled seepage in underground engineering.

2. Coupling Analysis of Rock Damage and Permeability

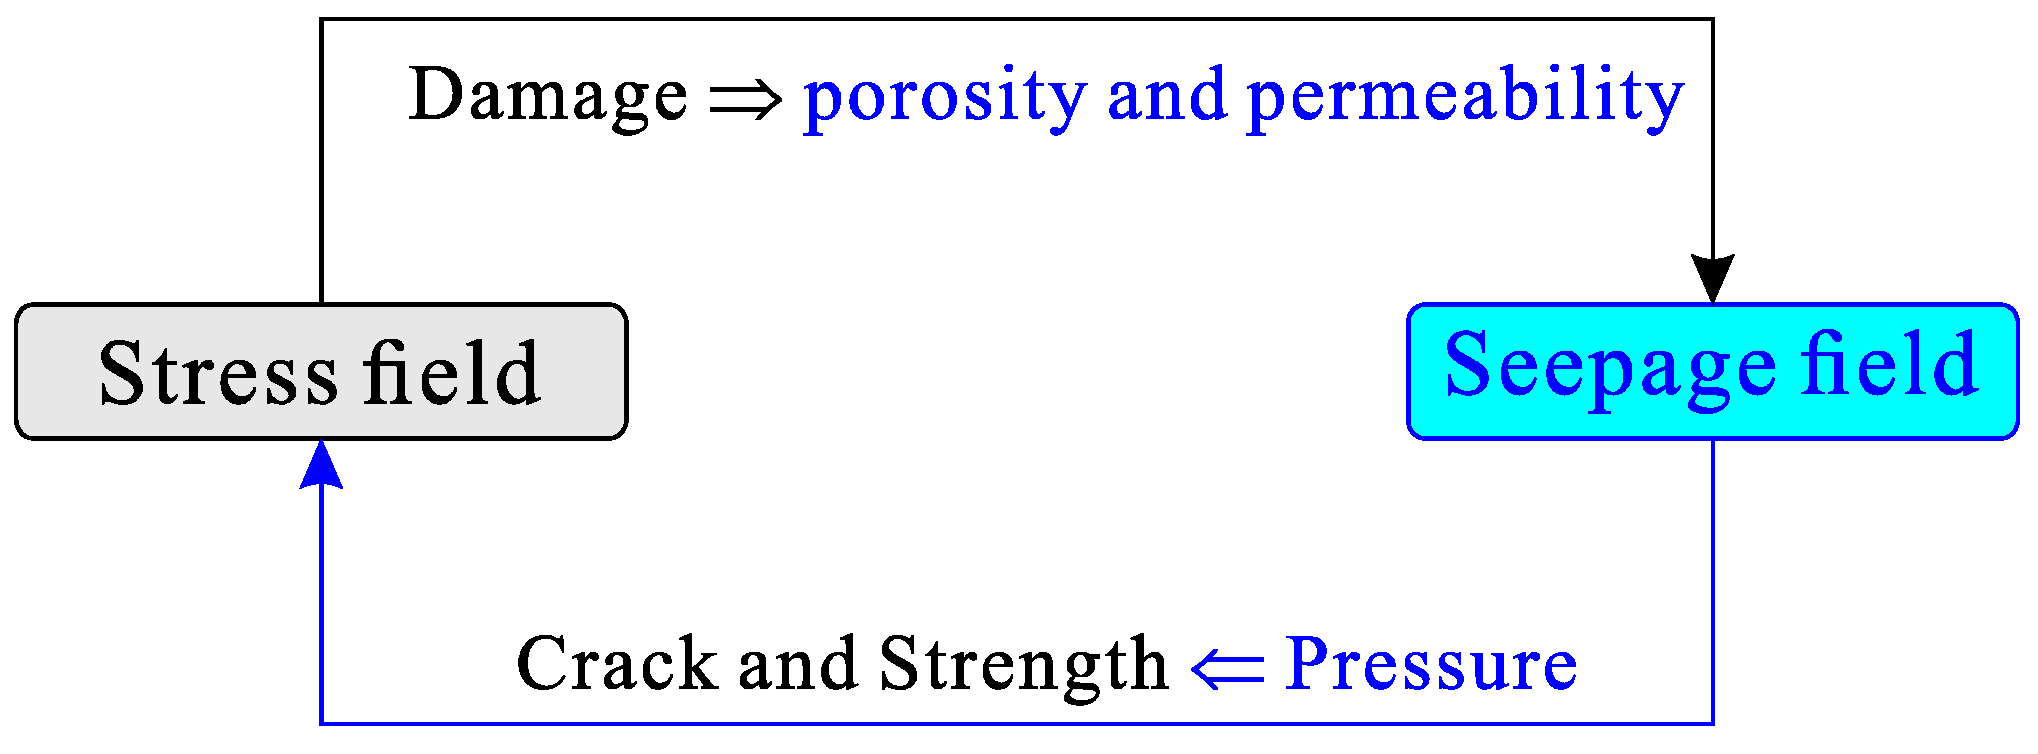
2.1. Coupling Mechanism

Damage and permeability are two characteristics of rock. The former is used to characterize the deterioration of rock mechanical properties under load or the environment. In other words, damage affects the skeleton structure and integrity of rock. The latter is used to measure the ability of the rock to transmit fluids, depending on the skeleton structure and integrity of the rock. Therefore, damage induces changes in the rock’s permeability. The interaction between them usually appears in the case of multi-physics coupling [24,26]. For example, stress-induced damage (stress field) in rocks under compression or shear results in microcracks in the rock. The germination and propagation of microcracks change the size and connectivity of rock pores, thereby affecting the hydraulic characteristics of the rock. Meanwhile, the pore pressure (seepage field) drives the fluid to seep into the damage-induced pores and cracks of the rock, ultimately leading to a reduction in strength, an increase in cracks, and the intensification of damage. The full coupling mechanism of rock damage and permeability due to the interaction of the stress field with the seepage field is shown in Figure 1.

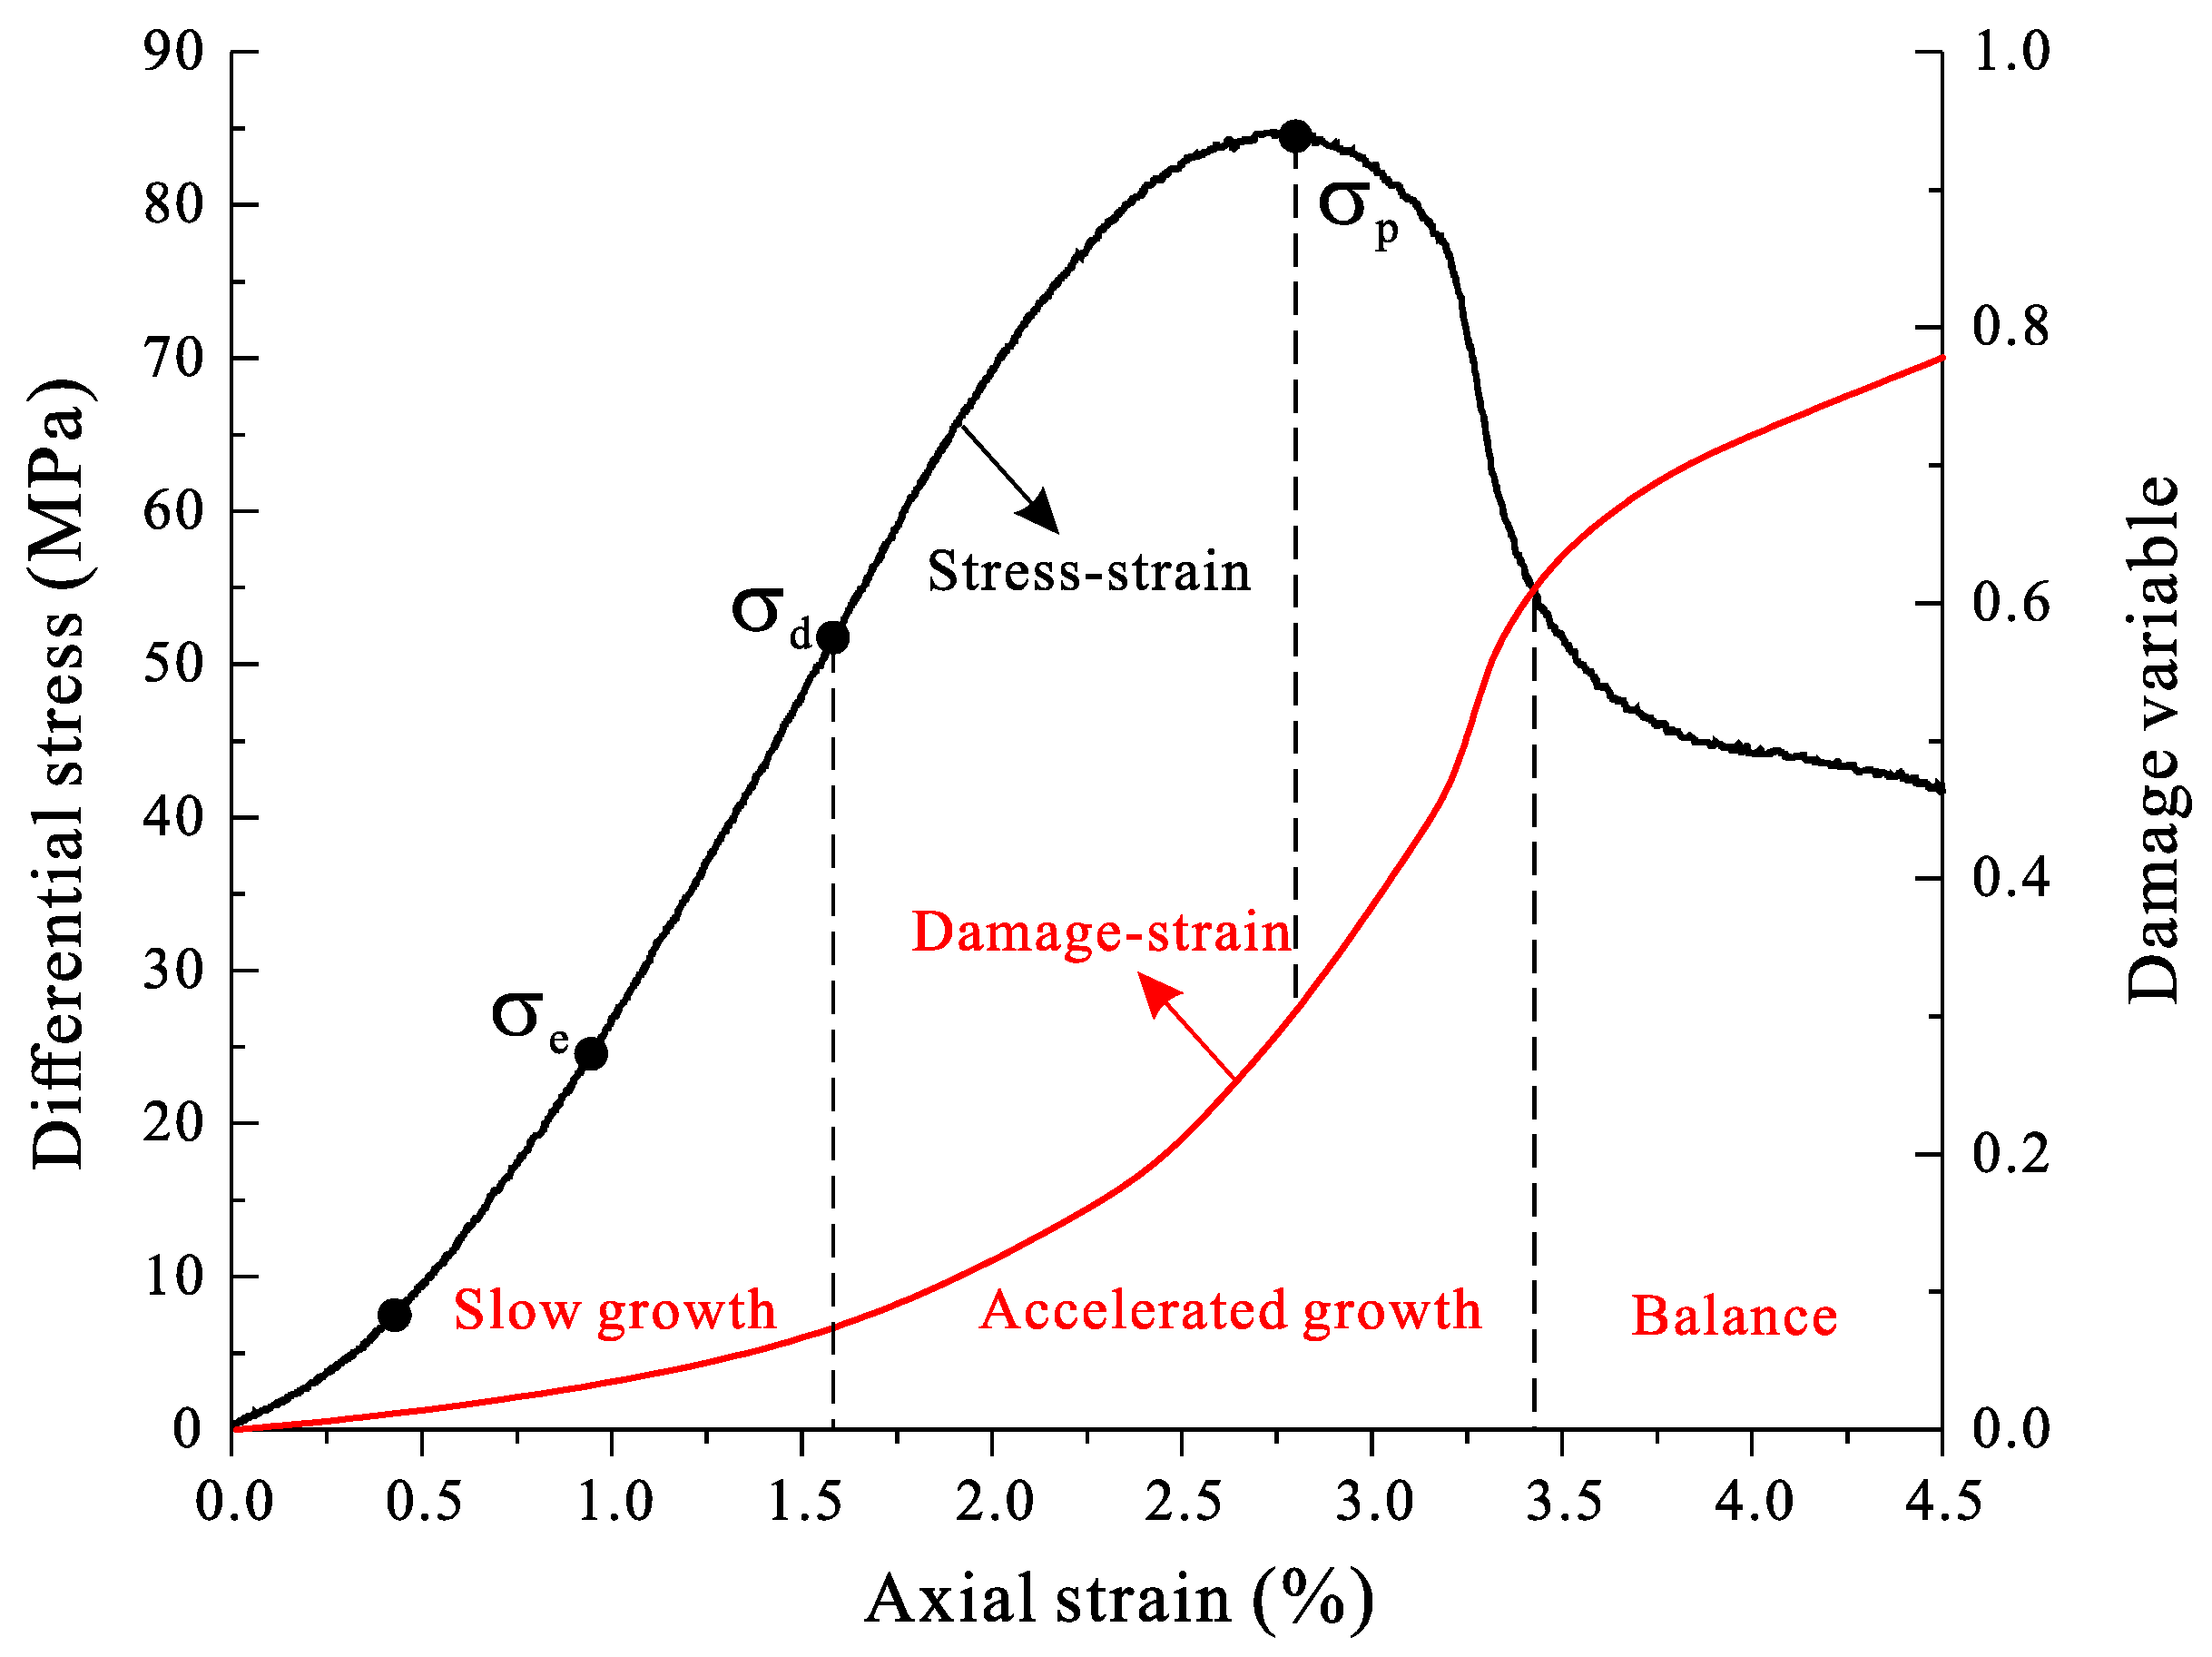
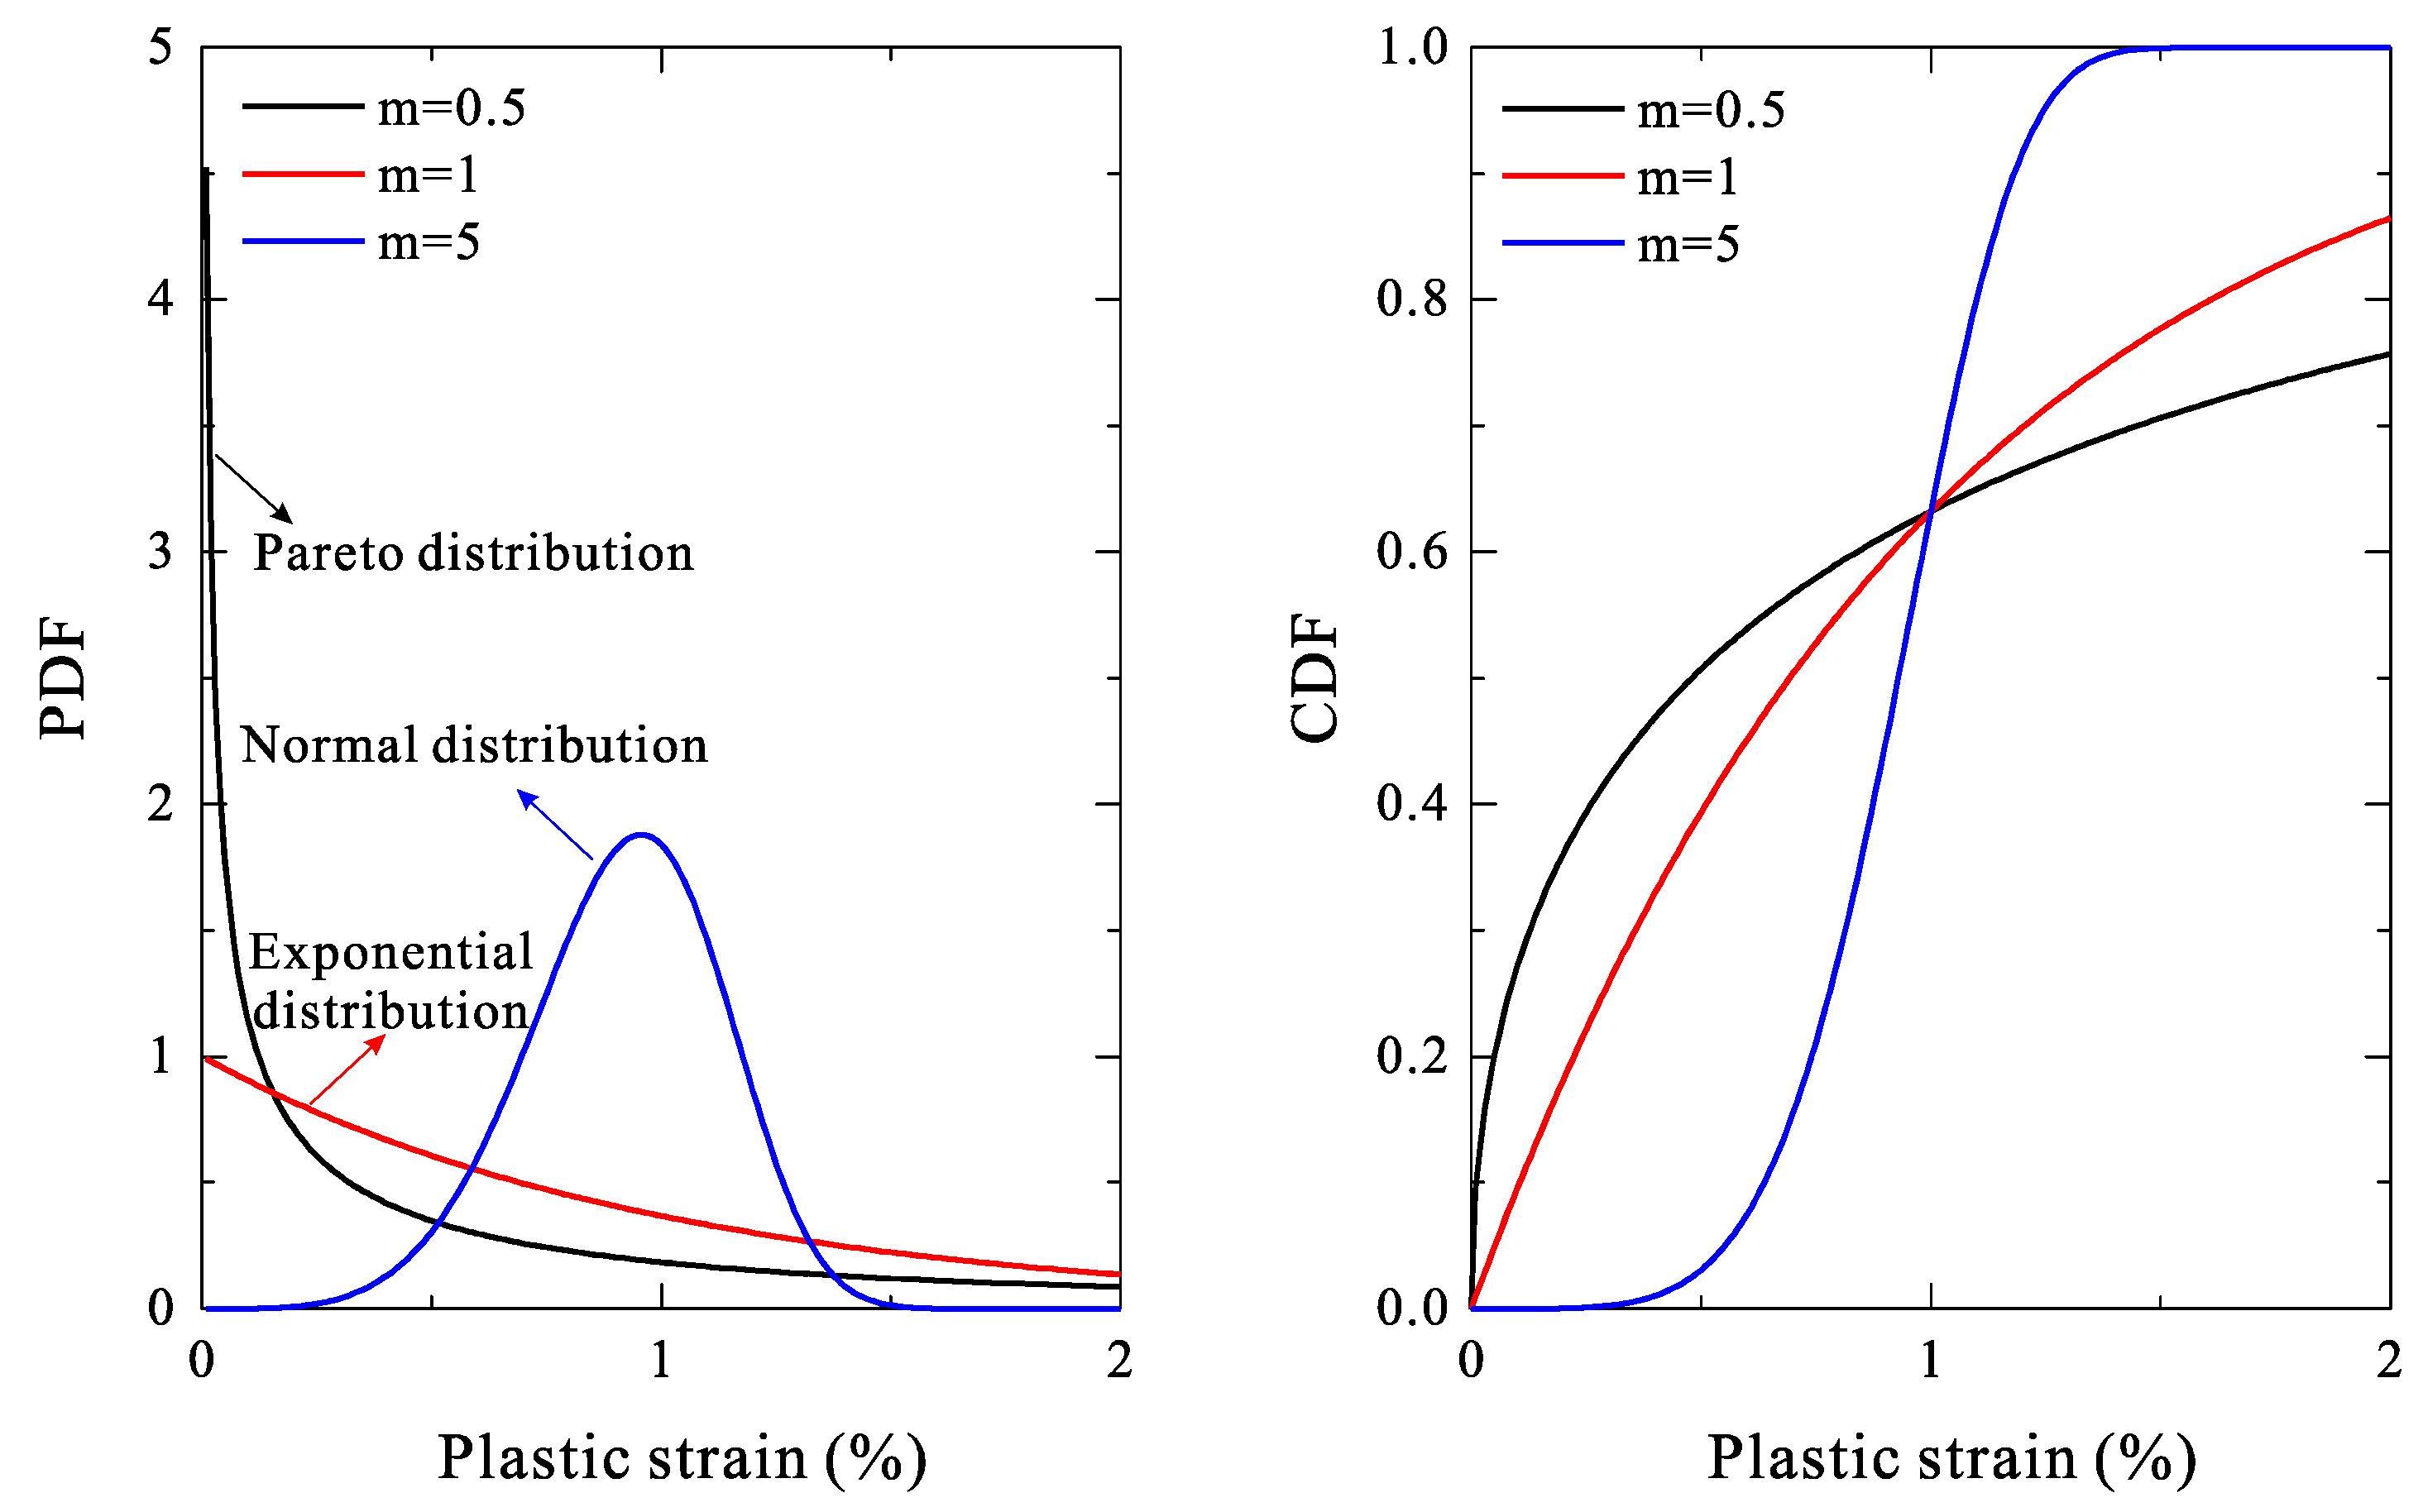
2.2. Damage and Deformation

The definition of the damage variable is not unique in damage mechanics theory. Since stress-induced damage is a permanent defect for rocks that is usually unrecoverable and irreversible, the main dependent variable of damage expression is related to plastic strain [17,27,28]. This relationship between the damage variable and plastic strain can be verified by rock damage experiments. Figure 2 shows the damage–strain and stress–strain curves of sandstone obtained from acoustic emission tests under conventional triaxial compression [29,30]. The test results indicate that sandstone enters the stage of stable crack growth when the differential stress (σ1–σ3) exceeds the elasticity limit σe, at which time the sandstone has undergone irreversible plastic deformation and damage. When the differential stress continues to increase, the rock enters the unstable crack growth, failure, and residual deformation stages in sequence. According to the evolution law of rock damage, the damage–strain curve can be divided into three stages, namely, slow growth, accelerated growth, and balance. The rapid accumulation of damage is mainly concentrated in the period of growth and propagation of rock new cracks, that is, unstable crack growth and failure stages in the stress–strain curve. Therefore, rock damage is closely related to its unrecoverable deformation and crack development.
Based on this, the following unified expression can be used to define the damage variable. It is important to note that the convention of considering compressive stress and strain as positive, and tensile stress and strain as negative, is adopted here.
d D d ε p = { f ( ε p ) ( ε p > 0 ) 0 ( ε p = 0 )
where D and εp are the damage variable and plastic strain, and f(εp) denotes the probability density function (PDF) of damage.
The form of the damage PDF should be determined according to the damage mechanism of the rock. Commonly, there are normal distribution functions and Weibull distribution functions [29]. In fact, the Weibull distribution is related to other distributions, such as Pareto, exponential, and normal distributions, depending on its shape parameter m. Figure 3 shows the PDF and cumulative distribution function (CDF) of the Weibull distribution with different shape parameters. Comparing Figure 2 and Figure 3, it is obvious the evolution law of the CDF of the Weibull distribution with a shape parameter greater than one is more in line with that of rock damage evolution. This is because a value of the shape parameter greater than one indicates that the failure rate increases gradually with time, which is often used to describe aging or defect processes. In addition, the PDF of the Weibull distribution (m > 1) is also consistent with the acoustic emission test results, which fully demonstrates the superiority of using the Weibull distribution to describe rock damage.
Based on the above analysis and theoretical derivation, the PDF of rock damage and its CDF were proposed in our previous studies [30]. The applicability of this damage variable model was demonstrated through experimental comparisons.
D = 1 exp { ( ε e p η ) m }
{ ω = E ε e p p σ p μ ( σ 2 + σ 3 ) m = 1 1 ln ( ω ) η = ε e p p { ln ( ω ) } ln ( ω ) 1
where D represents the damage variable of the rock, εep denotes the equivalent plastic strain of the rock, η and m represent the parameters of the Weibull distribution, ω is a function related to the plastic and elastic parameters of the rock, E and μ are Young’s modulus and Poisson’s ratio, σp denotes the peak stress, ε e p p denotes the equivalent plastic strain corresponding to the peak stress, and σ2 and σ3 are the second and third principal stresses.

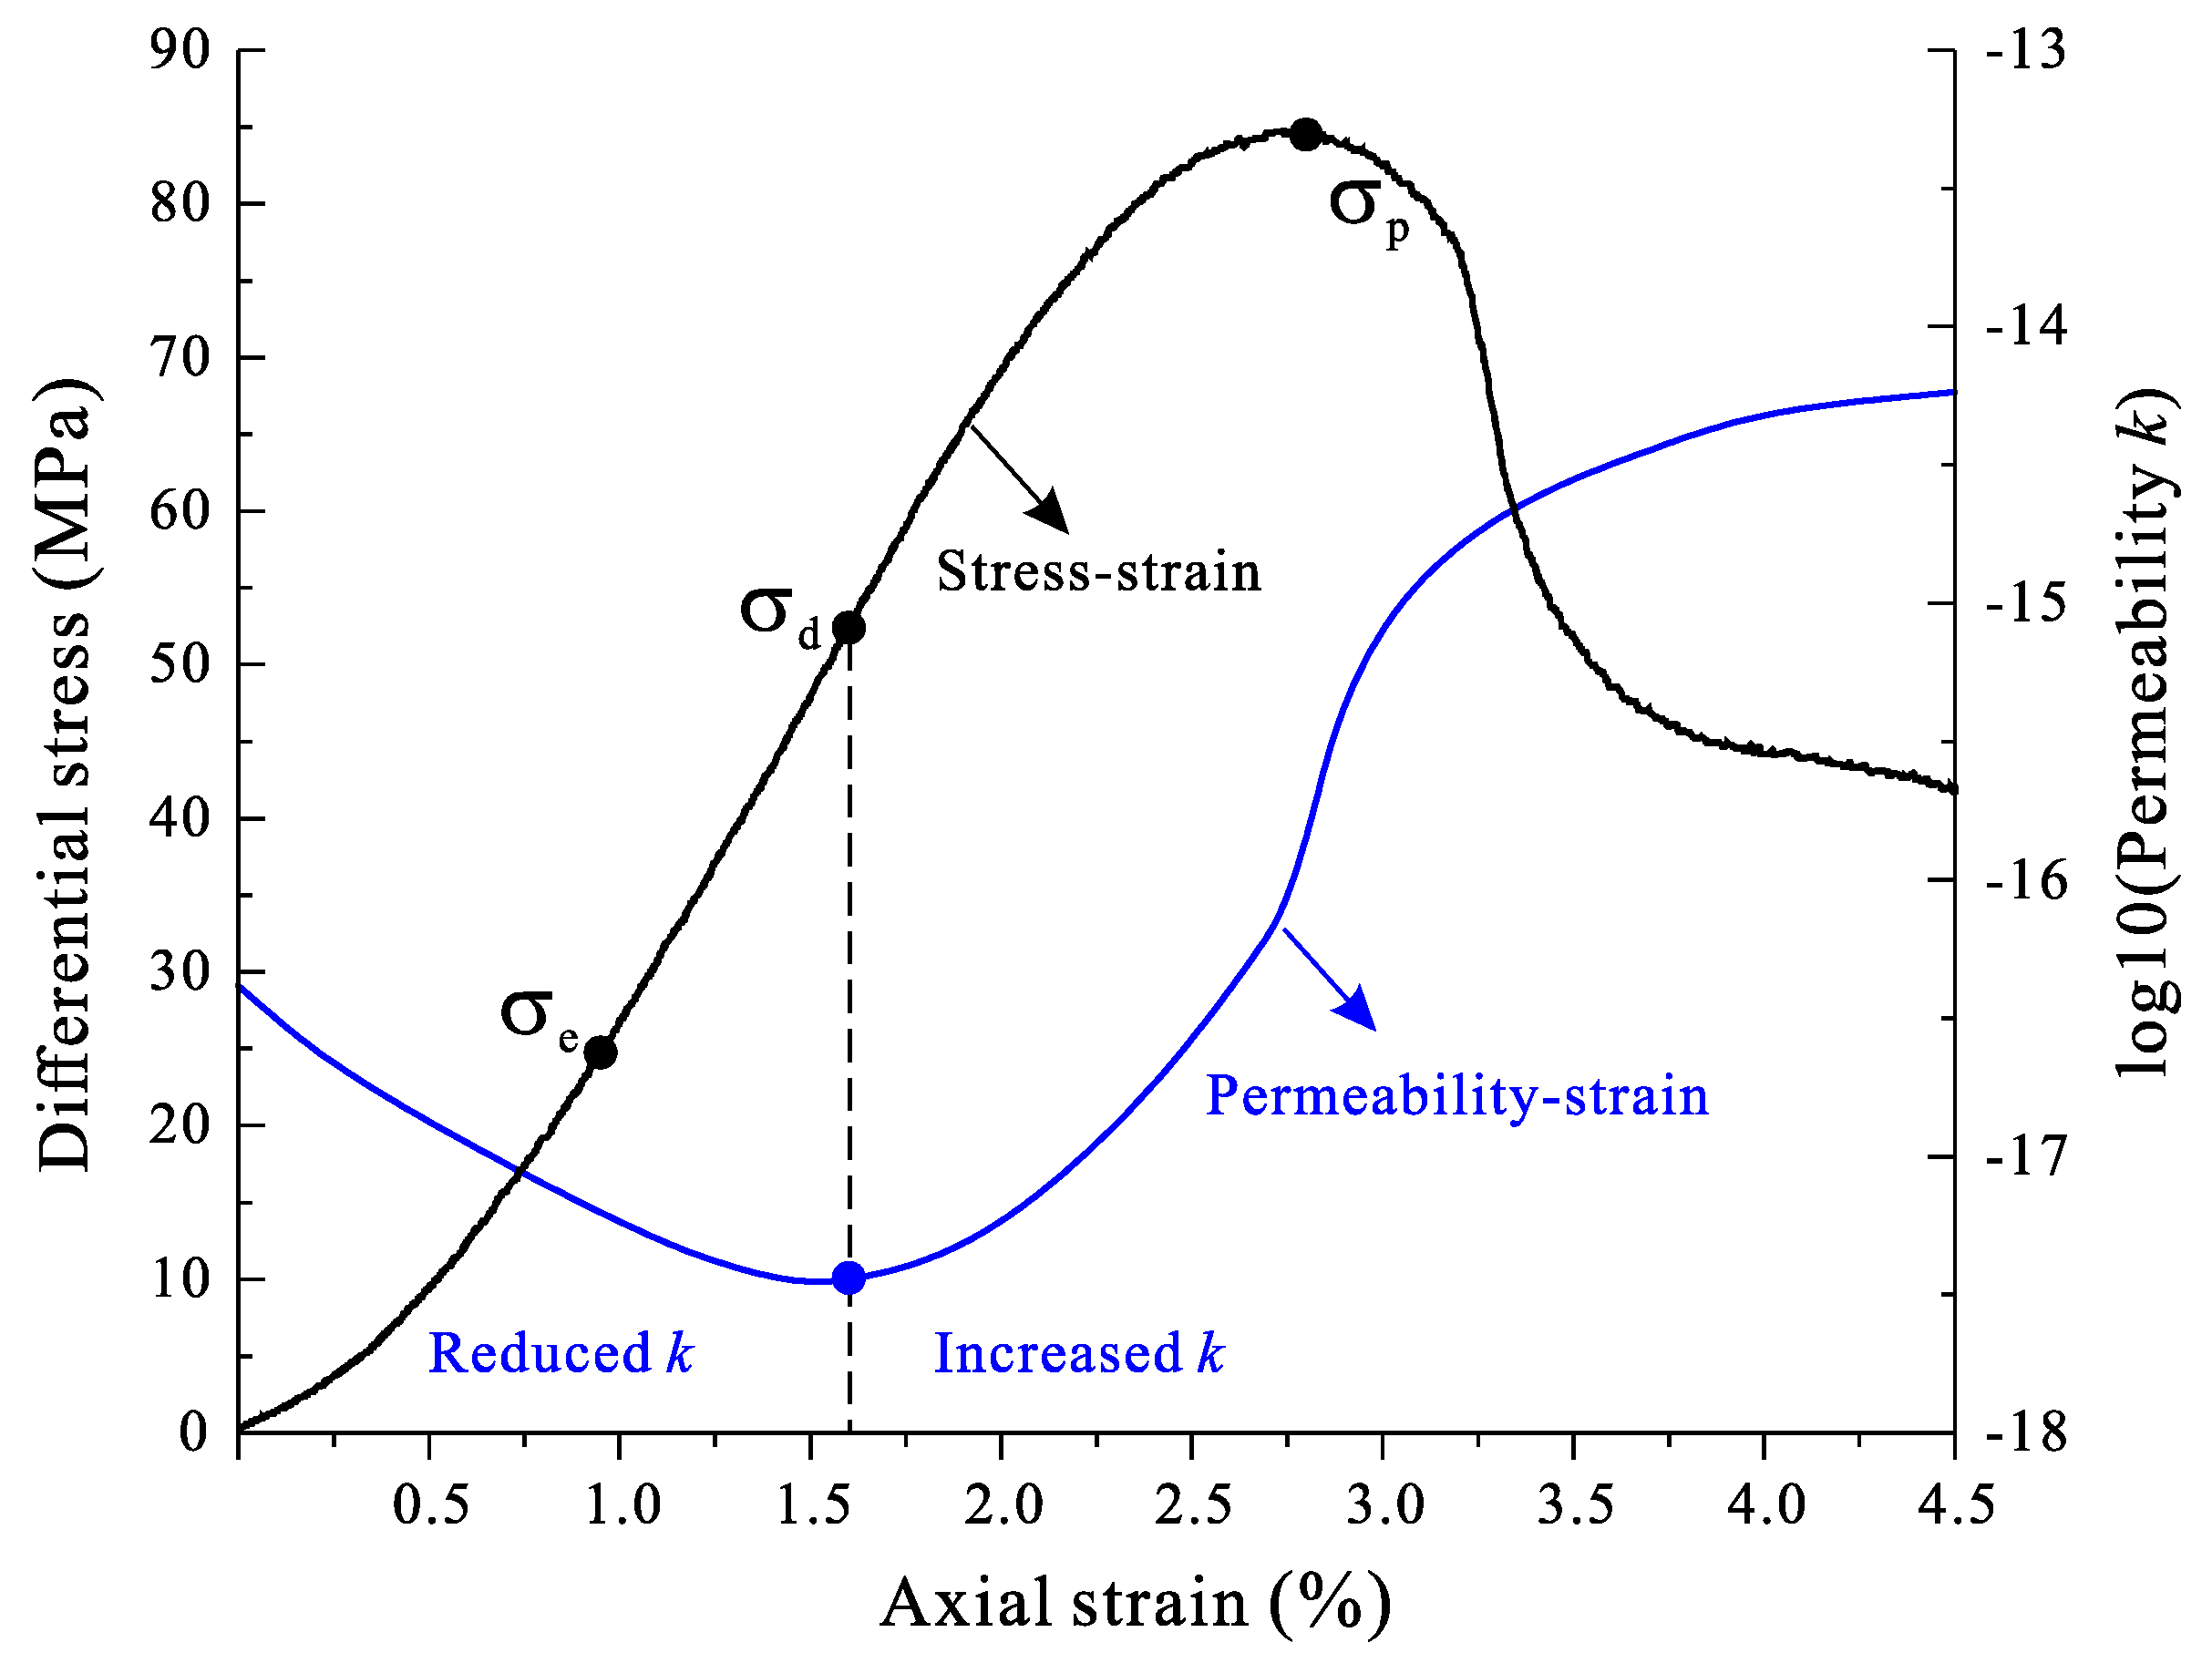
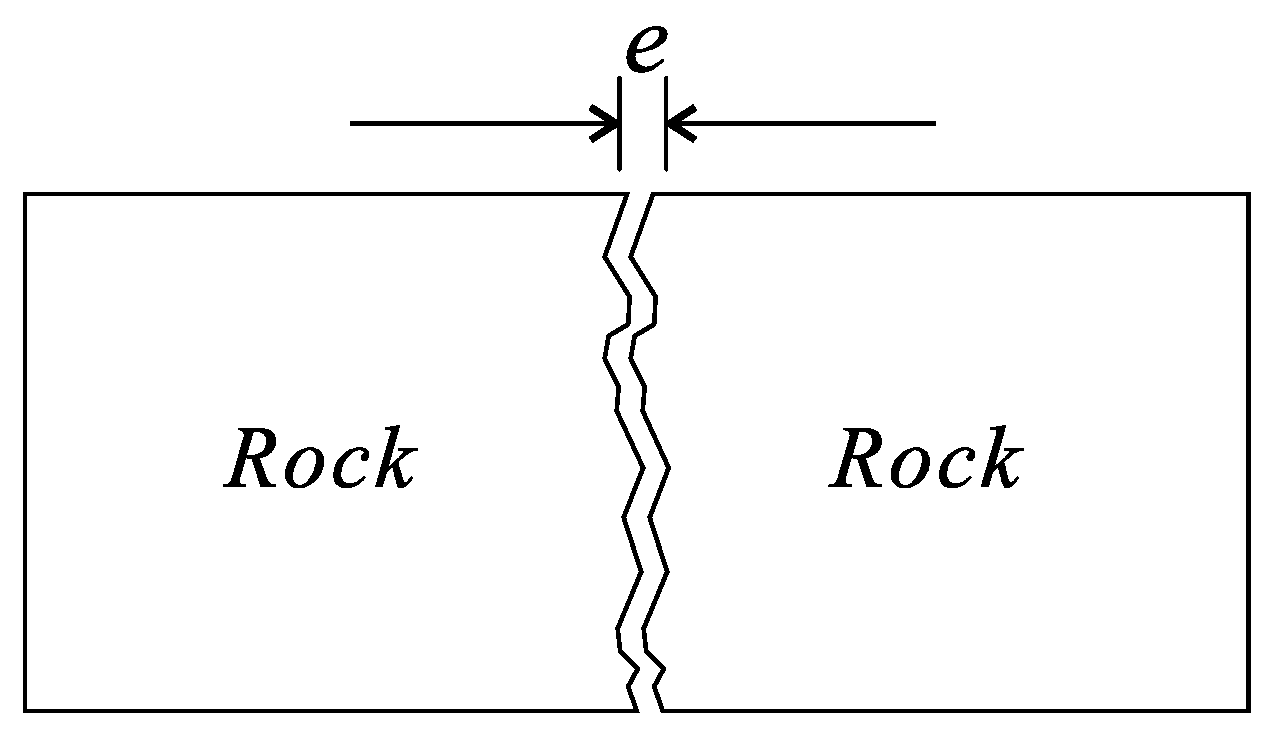
2.3. Permeability and Deformation

The permeability k is related to the pore size and crack aperture of the rock and is an important indicator to measure the connectivity of voids. Compared with porosity, there is no precise defined expression for permeability [26], but it can be obtained indirectly by its relationship with porosity. Figure 4 shows the permeability–strain and stress–strain curves of sandstone obtained from permeability tests under conventional triaxial compression. With the increase in the differential stress, the permeability gradually decreased because of pore and crack closure. When the differential stress increased to a critical value, the permeability began to increase, and the growth rate was faster. The test results show that the critical value was close to the dilatancy stress σd. The main reason for the change in the permeability trend was closely related to the unstable crack propagation because the propagation and penetration of cracks caused the rock volume to expand and then induced the permeability to surge. Interestingly, the trend of the permeability–strain curve is very similar to that of the volumetric strain curve, and the turning points are the dilatancy stress. It can be seen that the permeability and volumetric strain of the rock were both affected by the stress state, but the root cause of the induced permeability surge and volume expansion was damage and crack propagation.
Based on the theoretical analysis and test results, the relationship between the permeability and deformation of rock could not be obtained temporarily, but it was certain that the permeability was positively correlated with the volumetric strain because of their consistent changing trends induced by damage. The evolution equation of permeability can be determined indirectly through the relationship between porosity and rock deformation. According to the definition of rock porosity, the porosity increment can be expressed as:
Δ ϕ = Δ V v V = Δ V Δ V m V = ε V ε V m ( 1 ϕ 0 )
where V, Vm, and Vv are the overall volume, matrix volume, and void volume of the rock, respectively, and εV and εVm are the volumetric strain of the rock and the rock matrix.
Then, the evolution equation of porosity can be obtained.
ϕ = ϕ 0 + ε V + ε V m ( ϕ 0 1 )
In the compaction stage of the rock volume, the fluid seepage is dominated by porous media flow. The relationship between permeability and porosity can be described by the cubic law [31,32]:
k = k 0 ( ϕ / ϕ 0 ) 3
In the dilatancy stage of the rock volume, the fluid seepage is dominated by fracture flow because the crack has entered unstable growth. Based on the concept of an equivalent hydraulic radius (Figure 5), the relationship between permeability and porosity can be described as [13,33]:
k = e 2 b ϕ τ 2
e ϕ χ
where e denotes the equivalent hydraulic radius, τ is the tortuosity, χ is a parameter that depends on the area per unit volume and aperture of the crack, and b is a constant that depends on the shape of the flow channel (it is equal to two for a circular cross-section and three for a slot or crack cross-section).
The tortuosity is the ratio of the actual seepage distance to the apparent distance, which is a function of the porosity:
τ 2 = ϕ 1 s
where s is a constant whose value varies from one to three (this value for most rocks is about two).
Substituting Equations (8) and (9) into Equation (7), the relationship between porosity and permeability can be established for fracture flow.
k = k 0 ( ϕ / ϕ 0 ) 2 χ + s
The coefficient 2χ + s is used to describe the degree of influence on permeability, and its value varies from one to five. Although the forms of Equations (6) and (10) are the same, they still cannot be unified due to the difference in the equation exponents. To unify the relationship between porosity and permeability in porous media flow and fracture flow, we tested the porosity and permeability of 42 cores and cited 39 sets of literature data, a total of 81 cores. The cores investigated were both intact and fractured rocks, including sandstone, mudstone, shale, granite, and rock salt. The porosity and permeability varied from 0.12% to 59.44% and 10−20 m2 to 10−12 m2, respectively. In order to make the theoretical model and experimental data comparable, these test data were normalized here. Taking the rock with the minimum permeability and porosity as a reference, all porosity ratios (ϕ/ϕref) were set as X-coordinate data, and all permeability ratios (k/kref) were set as Y-coordinate data. The analysis results indicate that the theoretical model agreed best with the experimental data when the exponent of the relationship function between porosity and permeability was around 3.0, as shown in Figure 6. This value was the same as with the classic Carman–Kozeny model [31,32].
Based on the above comparison results, the relationship between porosity and permeability in porous media flow and fracture flow can be unified. Substituting Equation (5) into Equation (10), the evolution function of rock permeability can be obtained.
k = k 0 ( 1 + ε V m + ε V ε V m ϕ 0 ) 3 .

2.4. Coupling Equation

Establishing the damage–permeability evolution equation is the key to coupled analysis. It is well known that the volumetric strain of rock consists of elastic and plastic volumetric strain. For porous media such as rock and soil, the elastic volumetric strain can be derived from Biot’s poroelasticity theory [34].
ε V e = 1 K ( σ m α b p ) = σ e K
where ε V e denotes the elastic volumetric strain of the rock, αb and p are Biot’s coefficient and the pore pressure, σm and σe are the mean stress and effective mean stress of the rock, and K denotes the bulk modulus of the rock.
Equation (2) can be transformed into the following form:
ε V p = Φ η ( ln ( 1 1 D ) ) 1 / m
where ε V p denotes the plastic volumetric strain of the rock, and Φ is used to describe the relationship between the equivalent plastic strain and plastic volumetric strain.
Since the volume change in the rock matrix in the compressed state was much smaller than that in the void (εVm << εV), the volumetric strain of the rock matrix was neglected in the subsequent theoretical analysis. Substituting Equations (12) and (13) into Equation (11), the damage–permeability evolution equation can be derived.
k = k 0 { 1 σ e K ϕ 0 + f ( D ) K ϕ 0 } 3
f ( D ) = Φ η K { ln ( 1 1 D ) } 1 / m
The value of function f(D) is always positive due to the damage variable varying from zero to one. In the case of determining the bulk modulus, scale, and shape parameters, the relationship between f(D) and the damage variable can be obtained according to Equation (15). As shown in Figure 7, f(D) is an “S-shaped” curve with slow growth in the early stage and rapid growth in the later stage. The permeability evolution of rock throughout the compression process can be described based on the relationship between f(D) and the effective mean stress. For example, when the growth rate of f(D) is lower than that of the effective mean stress, the rock is in the compression stage and the permeability decreases; when the growth rate of f(D) is equal to that of the effective mean stress, the permeability and volume of the rock reach the minimum; and when the growth rate of f(D) is higher than that of the effective mean stress, the rock is in the dilatancy stage, and the permeability increases. Therefore, the derived evolution equation of damage–permeability conforms to the experimental results and phenomena and is reasonable and reliable.
The coupled seepage equation can be derived by introducing the evolution equation of porosity and permeability Equations (5) and (11) into the continuity equation of fluid seepage in porous media:
p t { 2 ϕ ( α b 1 ) + 1 K } ε V + ε V t = { ( k μ ) ε V p }
{ σ x x x + σ y x y + σ z x z + F x α b p x = 0 σ x y x + σ y y y + σ z y z + F y α b p y = 0 σ x z x + σ y z y + σ z z z + F z α b p z = 0
[ σ ] = [ σ ] [ I D ]
where [σ] and [σ*] are the stress matrix and effective stress matrix, and I and D are the identity matrix and damage variable. For isotropic damage, the damage variable is scalar. Fx, Fy, and Fz denote the body force.
The coupled deformation equation can be also obtained by introducing the evolution equation of damage Equation (2) into Biot’s poroelasticity theory:
ε V = 1 K ( σ m α b p ) + Φ η ( ln ( 1 1 D ) ) 1 / m
Through a series of analyses of stress-induced damage, damage-induced seepage, and seepage-induced deformation, the fully coupled modeling of the stress field and seepage field of rock under compression was finally achieved.

3. Numerical Implementation of Damage–Permeability Model

The seepage equation considering the coupling effect of damage and permeability is a partial differential equation, which is extremely difficult to solve theoretically. The validation and application of the model require the help of numerical methods. The coupled model is usually solved by the iterative method, but the mutual invocation of various parameters greatly increases the difficulty of solving. The solution steps in this paper were as follows:
(1)
First, a constitutive model that can well describe the damage evolution and deformation characteristics of rock was proposed and implemented numerically.
(2)
Second, the deformation and damage parameters in the stress field were implemented in the seepage field to induce the fluid flow.
(3)
Third, the effective stress and pore pressure in the seepage field were implemented in the stress field for influencing the rock deformation.
(4)
Finally, the last iteration was repeated until the end.
Step 1 has been completed in our previous works; that is, an elastoplastic damage constitutive model that can describe the characteristics of rock deformation and damage has been proposed [30]. More importantly, this model has been implemented by finite element programming code and verified by a series of triaxial compression tests. The next core problem was to realize seepage analysis with a fluid–solid coupling. The non-linear partial differential equation with multivariate interaction could be solved with the help of numerical methods. The COMSOL Multiphysics software version 5.6 provides a user-defined material model interface where any constitutive model can be programmed and applied. The elastoplastic damage constitutive model in Step 1 could be compiled in the C-program and linked to an external material model of this finite element software, which can be implemented at any time when it is used. The implementation of Step 2 and Step 3 required a specific application situation, such as fluid seepage in strata, leakage analysis in formations surrounding salt cavern gas storage, and seepage analysis in rocks under triaxial compression.

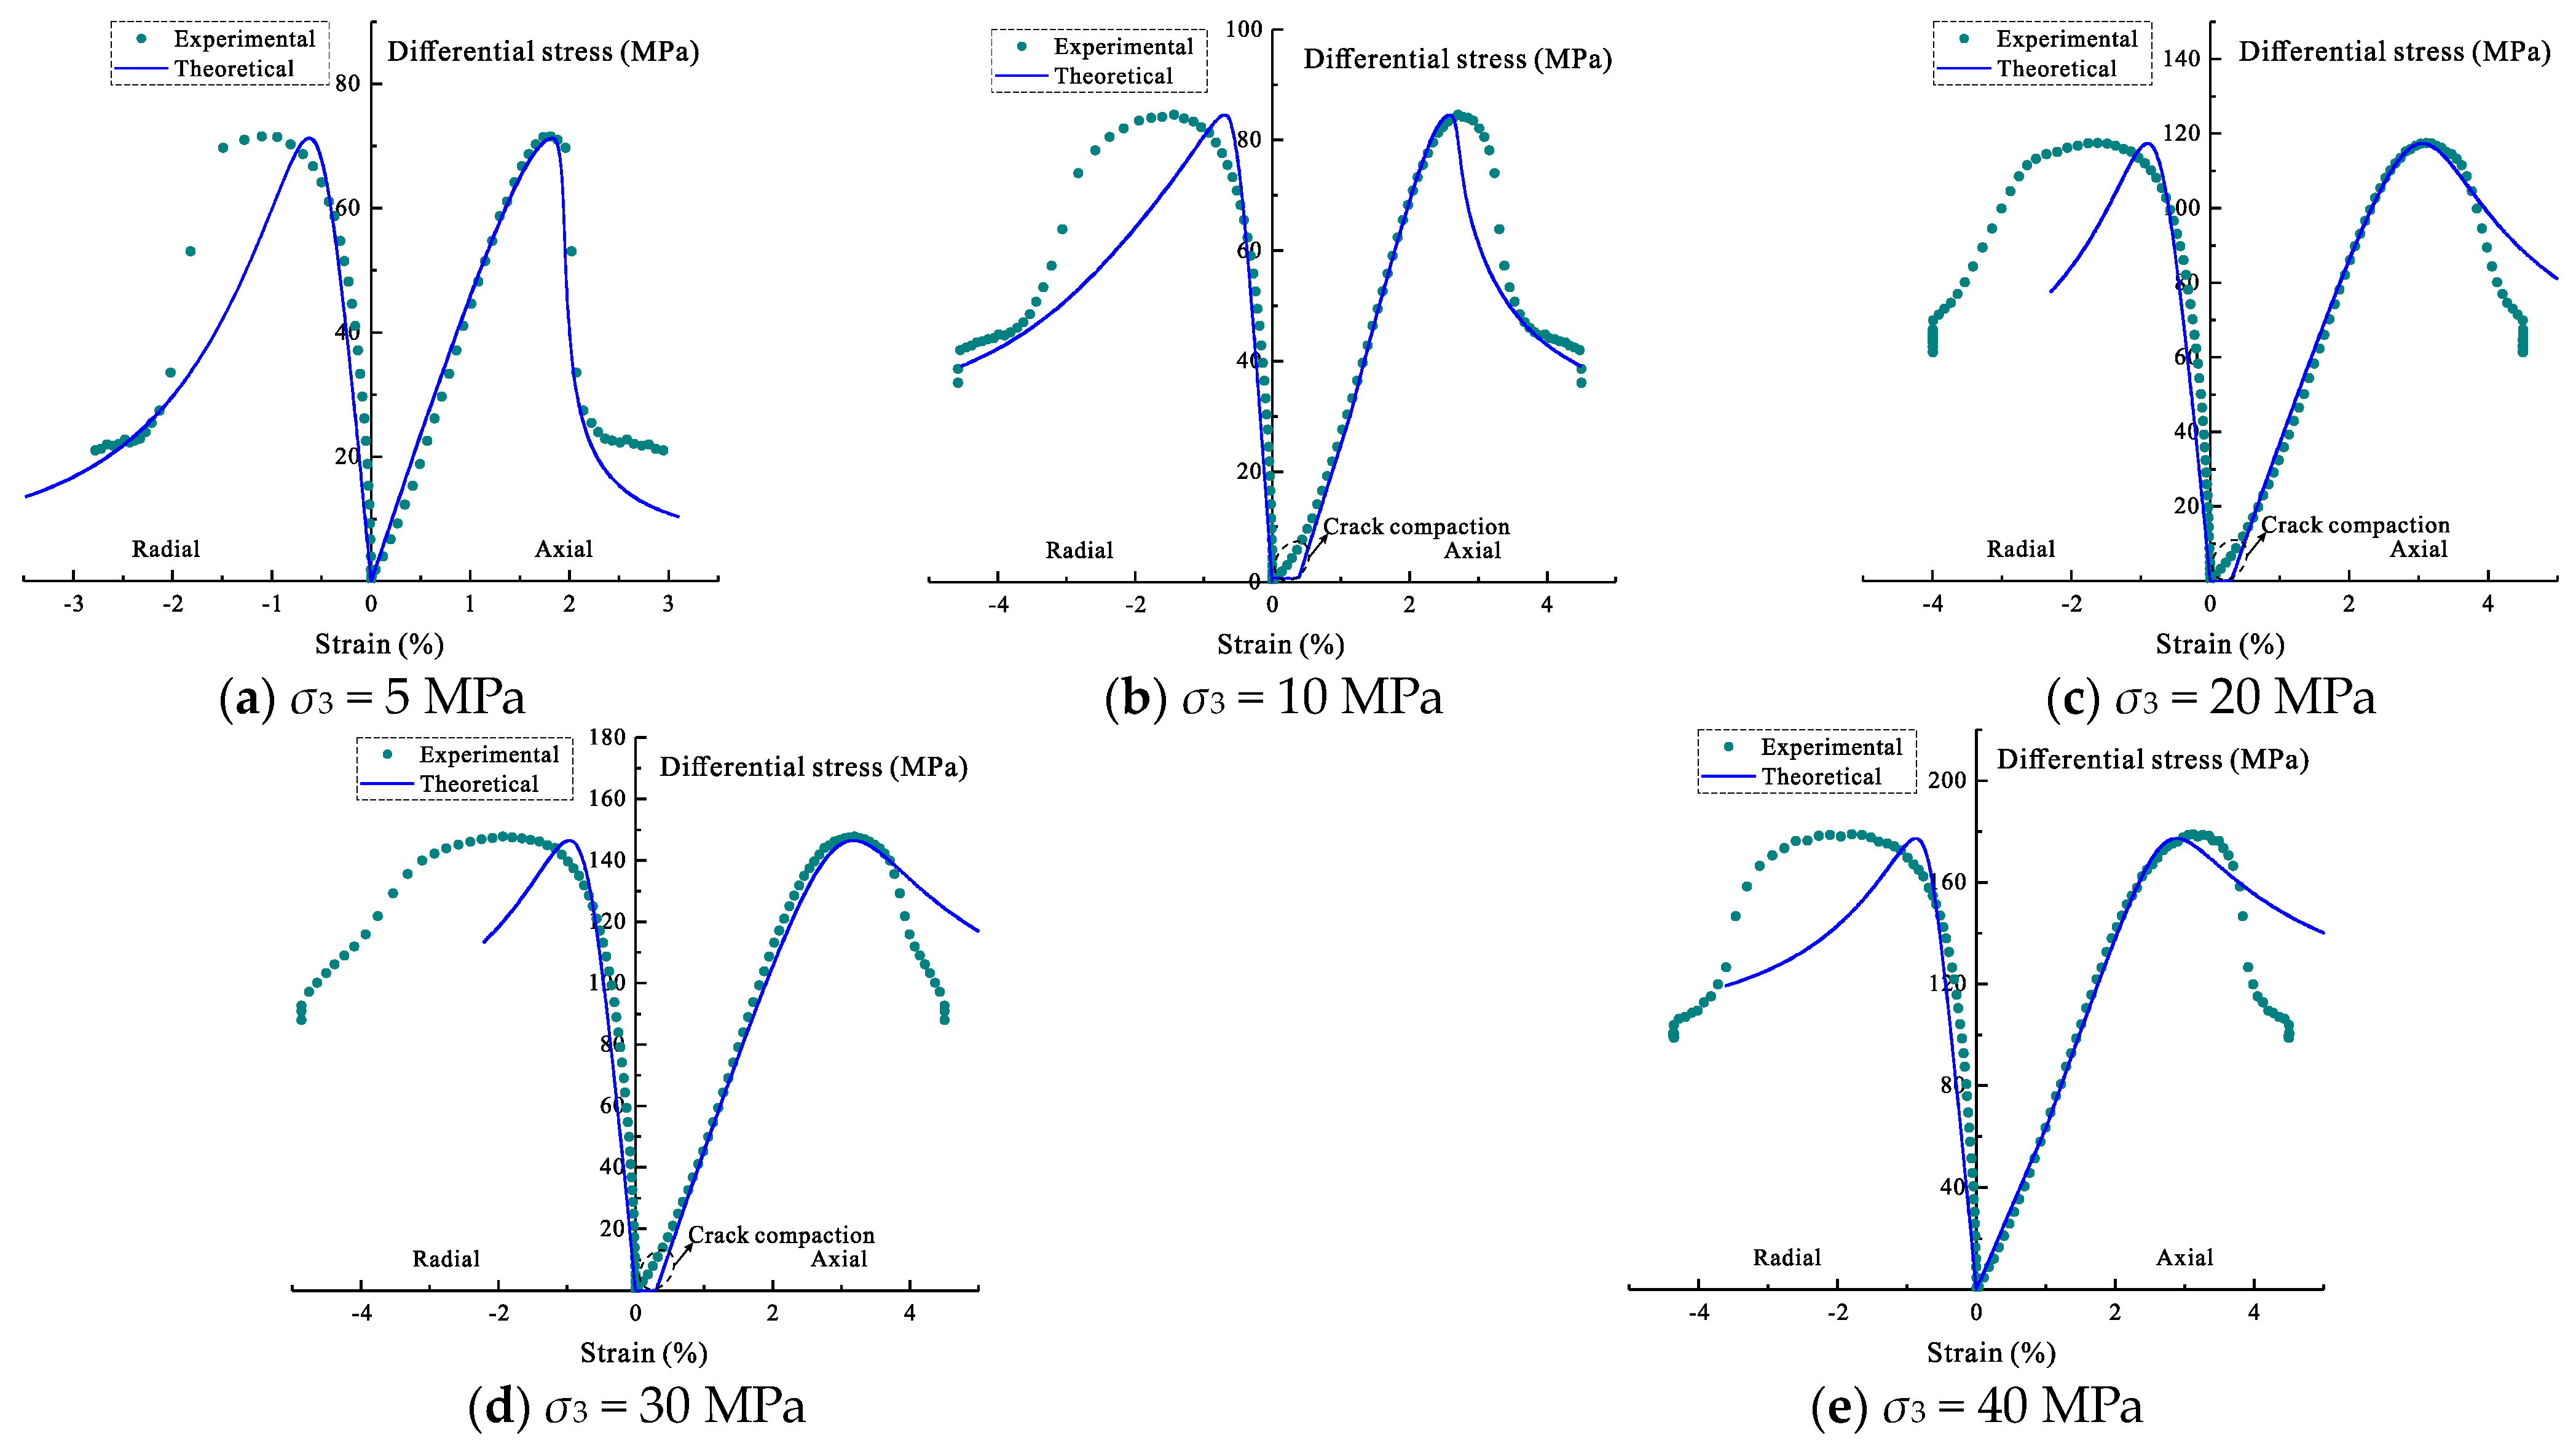
4. Model Validation and Results Analysis

In this section, we embedded the damage–permeability model into the COMSOL Multiphysics software to achieve the purpose of model verification and application.

4.1. Fluid–Solid Coupling Analysis Model

In order to further investigate the coupling mechanism of the damage–permeability of the rock, a simulation model of conventional triaxial compression tests considering the fluid–solid coupling effect was established and solved. As shown in Figure 8, the cylindrical specimen used in the triaxial compression test could be simplified by considering the two-dimensional axial symmetry. The selected specimen for the test was sandstone with a diameter of 50 mm and a height of 100 mm. The seepage medium was nitrogen. The bottom of the model adopted a fixed constraint, the center line served as the axis of symmetry, and a prescribed displacement was applied at the top in accordance with the triaxial compression test method. During the fluid–solid coupling simulation, the bottom and top of the specimen acted as the seepage inlet and outlet, respectively. To ensure the accuracy and representativeness of the calculation results, a uniform tetrahedral mesh was used in the two-dimensional axisymmetric model.
It was necessary to perform isotropic compression (σ1 = σ2 = σ3) before axial compression (σ1 > σ2 = σ3) and then apply differential stress and fluid pressure. The relationship between the prescribed displacement and differential stress can be described by the reaction force in the vertical direction.
σ d i f f = F r e π r 2 σ 3
where σdiff denotes the differential stress in the axial compression stage, r is the radius of the specimen, and Fre denotes the reaction force.
The basic calculation parameters of sandstone and nitrogen are listed in Table 1. These parameters were obtained from the experimental results, such as the mechanical and permeability tests. The scale parameter and shape parameter were obtained from the above-derived equations and varied with the confining pressure. In order to ensure the comparability of the calculation results, five levels of confining pressures of 5 MPa, 10 MPa, 20 MPa, 30 MPa, and 40 MPa were set in this analytic simulation.
The compressibility and density of nitrogen are the function of gas pressure and can be derived by the ideal gas law.
ρ g = p M R T
χ = 1 ρ g ( ρ g p )
where ρg and M are the density and molar mass of nitrogen, R and T are the universal gas constant and absolute temperature, and χ denotes the compressibility of nitrogen.
The flow–solid coupling analysis used Darcy’s law as the governing equation for fluid flow in the sandstone. The primary reasons were as follows: (1) the test medium (nitrogen) was a Newtonian fluid; (2) the initial permeability of the sandstone was 3.99 × 10⁻¹⁶ m2, which was tested using the steady-state method and fell within the applicable range of Darcy’s law.

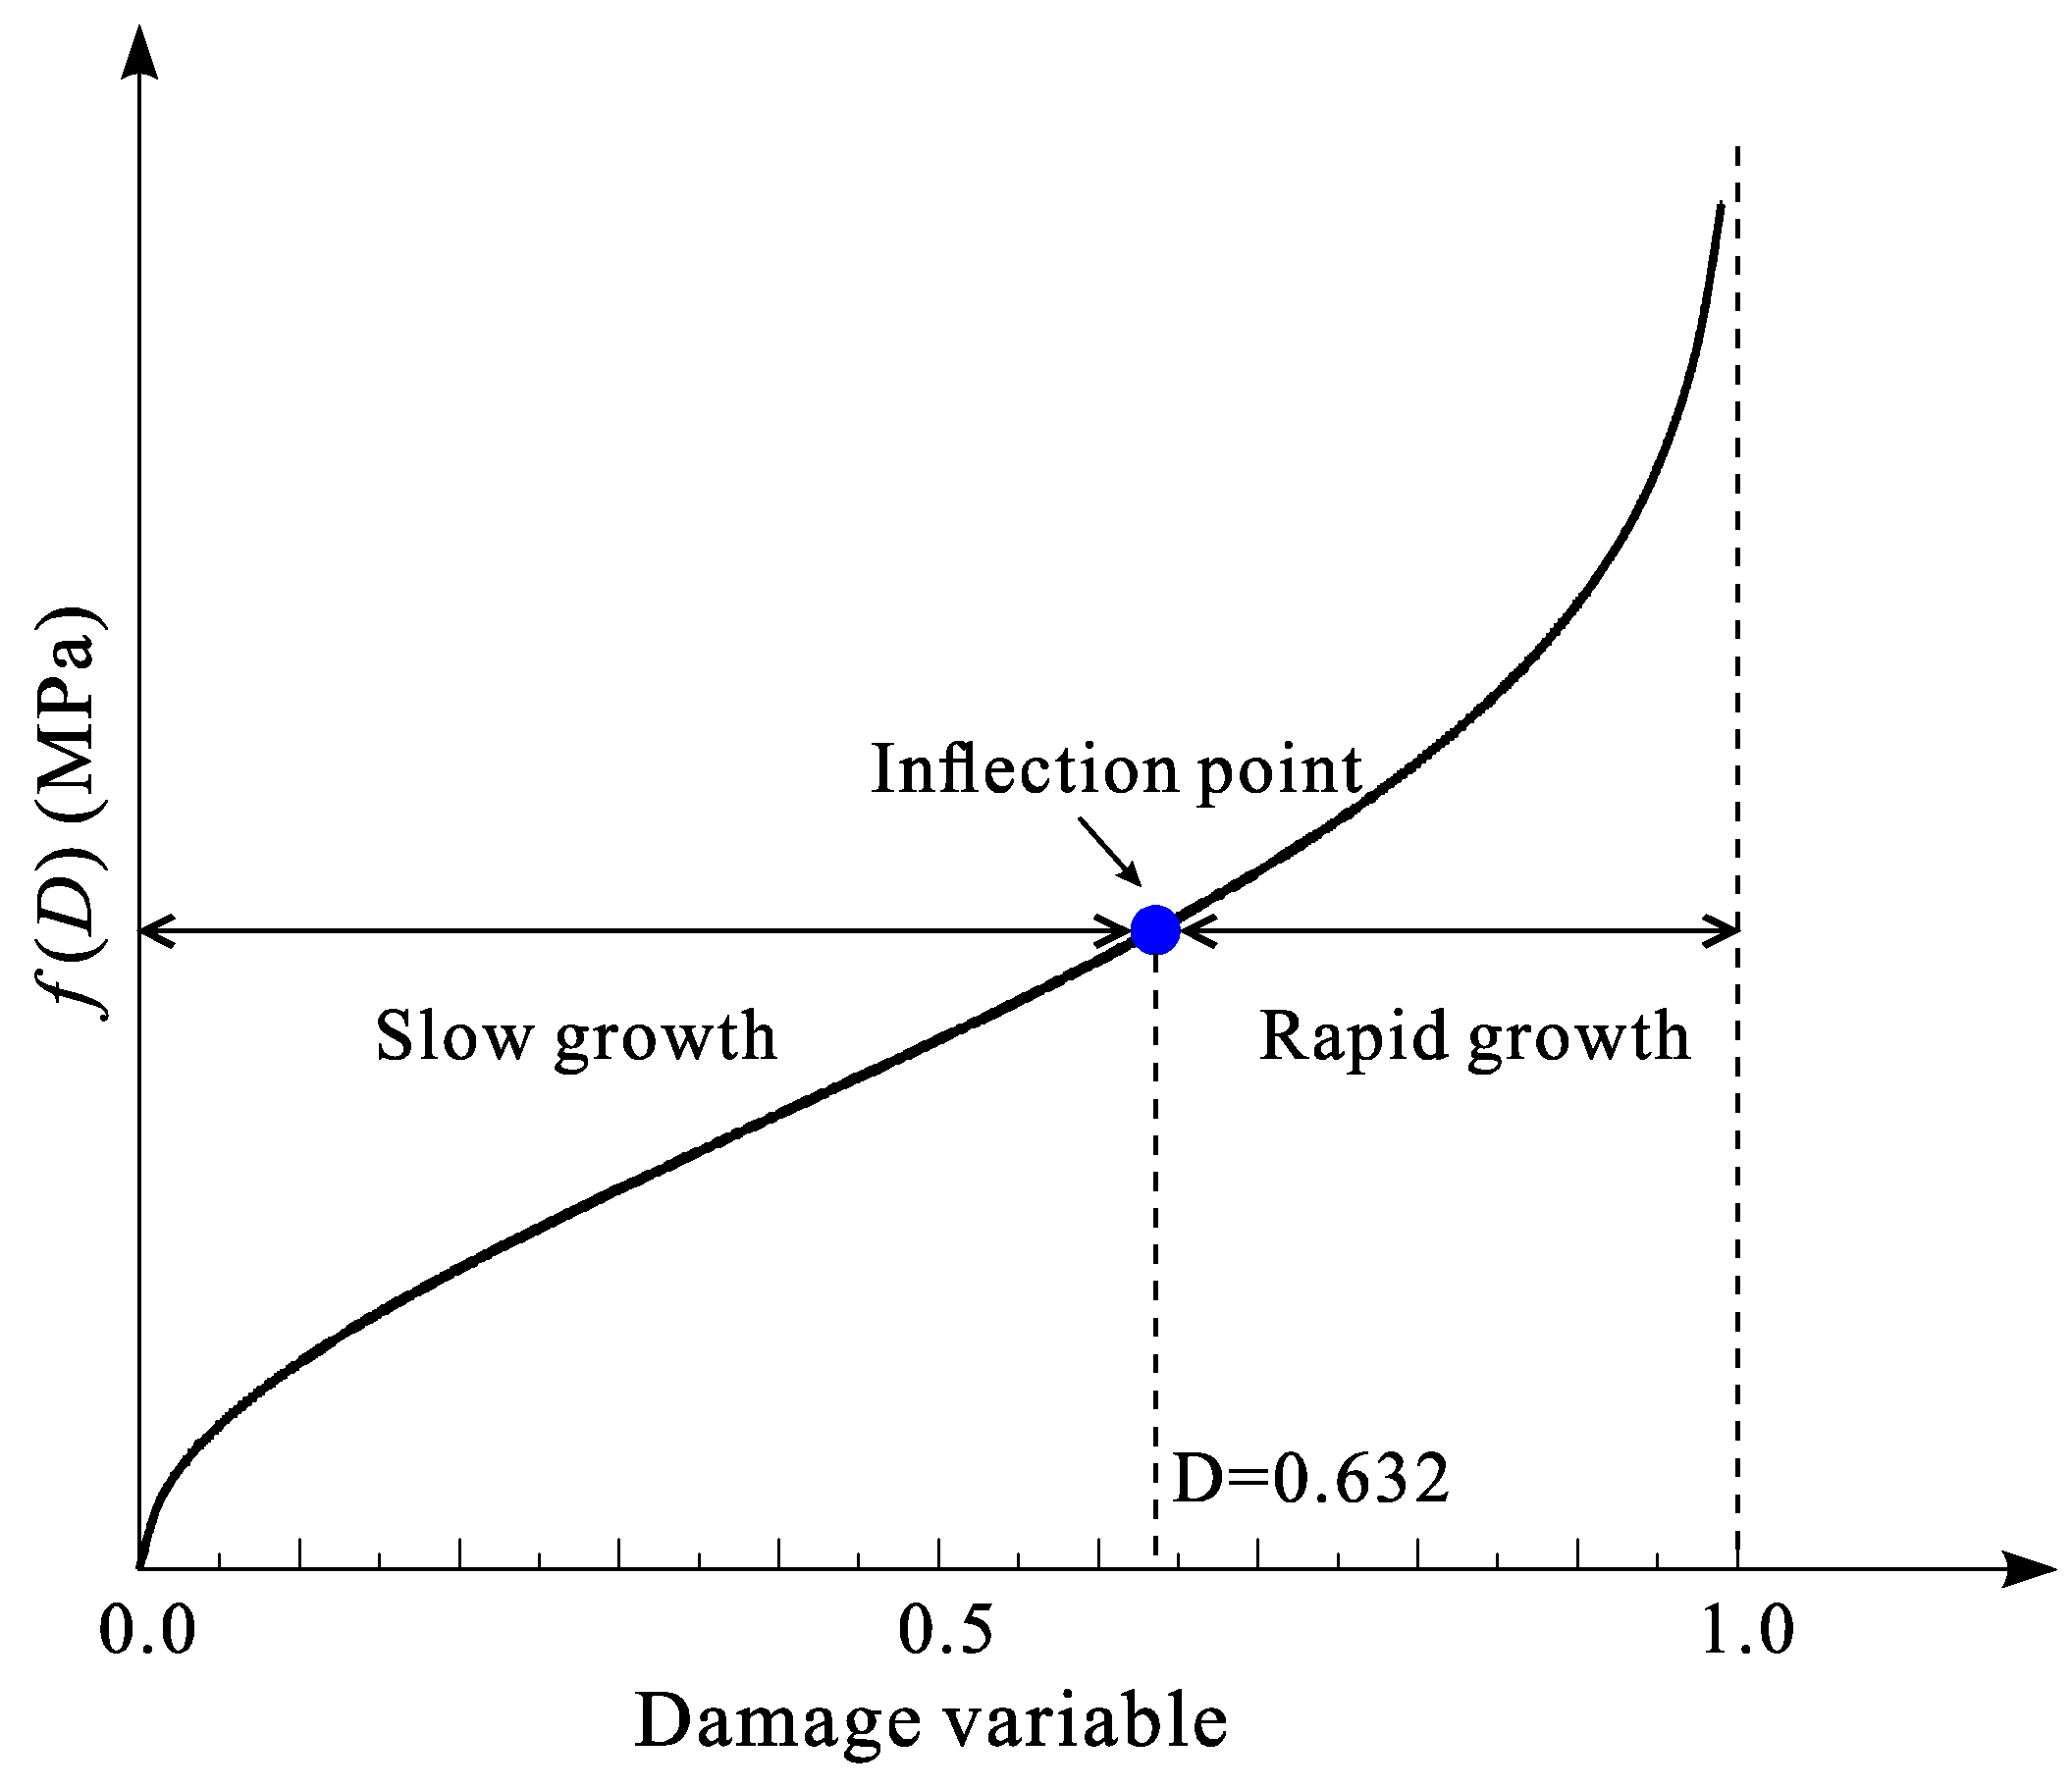
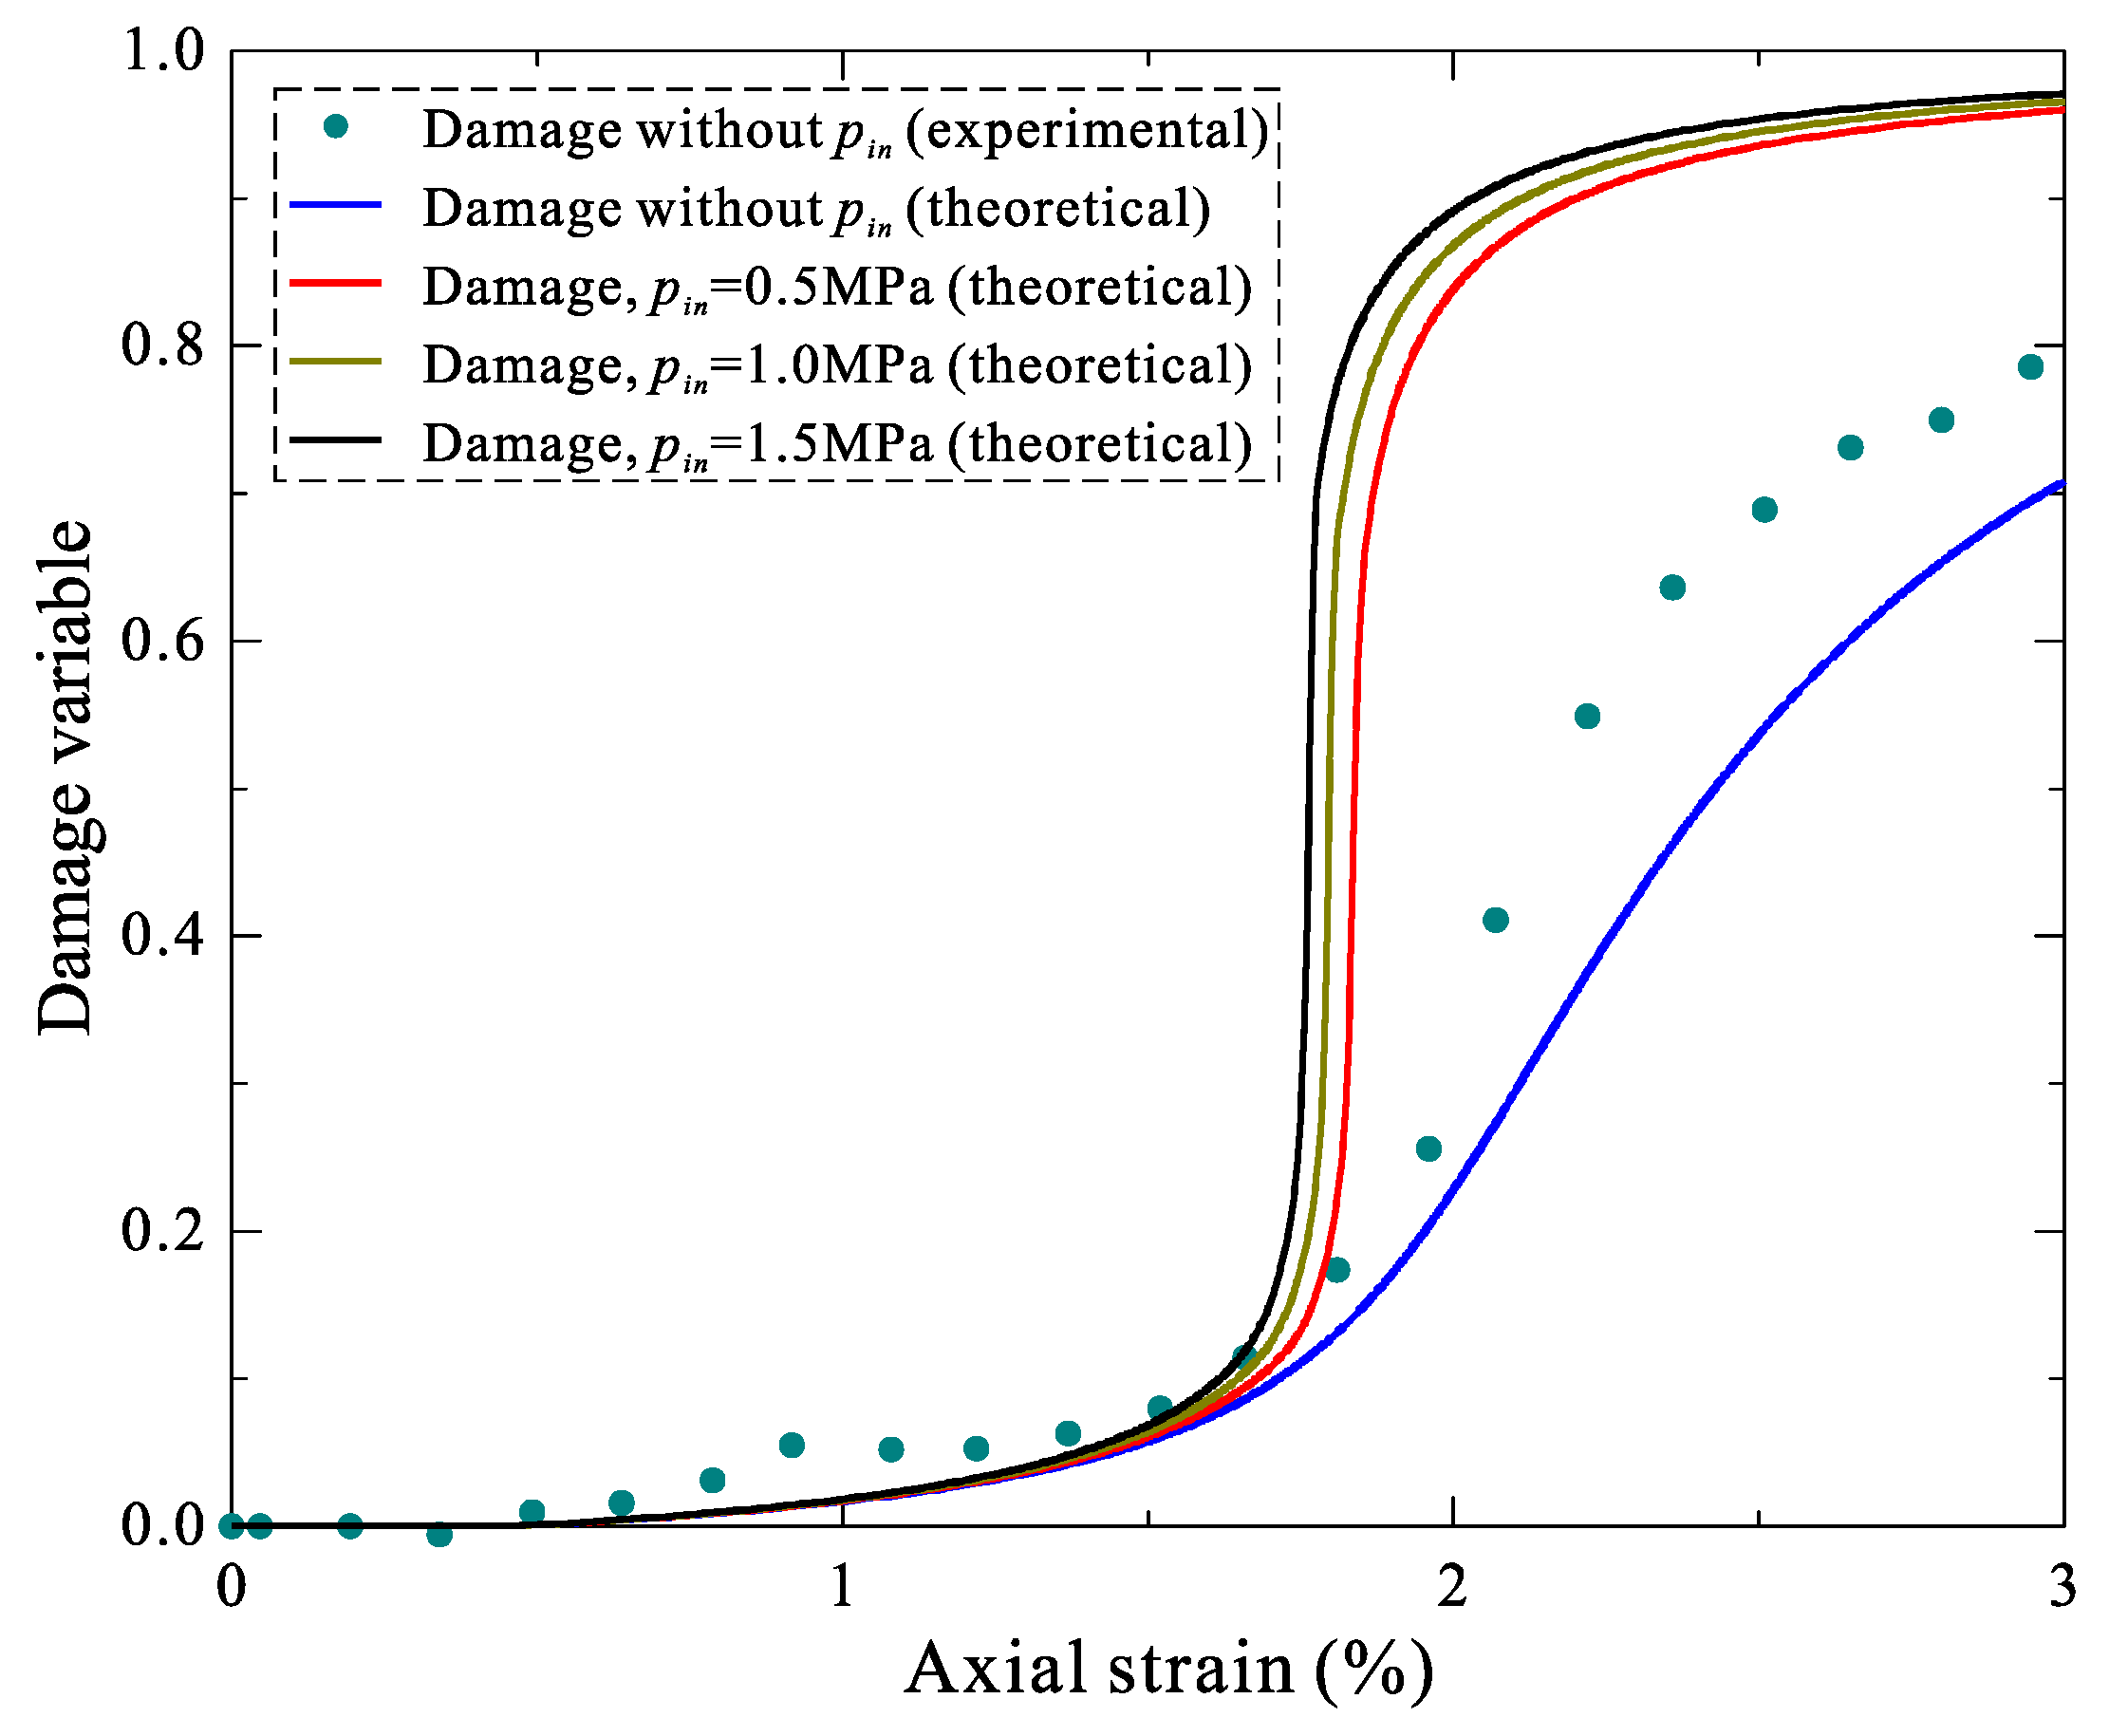
4.2. Damage Evolution Analysis

A series of model parameter analyses and conventional triaxial compression tests were investigated. The comparison results of the stress–strain curves between the theoretical analysis and experimental data are shown in Figure 9. It can be seen that the numerical results are in good agreement with the experimental data, especially the elastic and plastic deformation, strain softening, and residual strength. However, the numerical results of this model in the crack compaction stage of rock have some deviations from the tests when the confining pressure is equal to 10, 20, and 30 MPa because the elastoplastic damage constitutive model has some shortcomings in describing the compaction behavior of rock cracks and pores [35]. Therefore, the proposed model is more suitable for rocks with a short compaction stage and a low confining pressure, such as granite, limestone, and dense sandstone. Figure 10 shows the stress–strain curves of sandstone under the fluid–solid coupling conditions with a confining pressure of 5 MPa and different inlet seepage pressures. Seepage pressure weakens rock strength and accelerates rock failure. Both the peak and residual strength of the rock decrease with the increase in the seepage pressure, which conforms to the Mohr–Coulomb strength criterion considering the effective stress.
Figure 11 shows the numerical results of the damage evolution of sandstone under the fluid–solid coupling conditions with a confining pressure of 5 MPa and different inlet seepage pressures. One can see that the damage evolution trend obtained from the analytical simulation and experimental tests is basically consistent, especially in the slow growth and early accelerated growth stages. There is a deviation between the theoretical prediction results and the experimental data in the later accelerated growth and balance stages, with a maximum error of about 10.13%. The main reason for this deviation is that the current theory is temporarily unable to consider the cumulative effect of primary cracks and initial damage on rock failure. But it is certain that this effect is positive; that is, the existence of primary cracks and initial damage is conducive to rock failure. Therefore, the theoretical prediction results are lower than the experimental data.
It is also noticed that under the same boundary and deformation conditions, the higher the seepage pressure, the larger the rock damage. In other words, the seepage pressure aggravates the damage and failure of rocks. The influence degree decreases with the increase in the seepage pressure. If the influence of fluid–solid coupling on the strength and damage of rock is ignored in practical engineering, its stability and safety will be misjudged, which may lead to engineering accidents, especially in tunnel engineering and underground engineering.

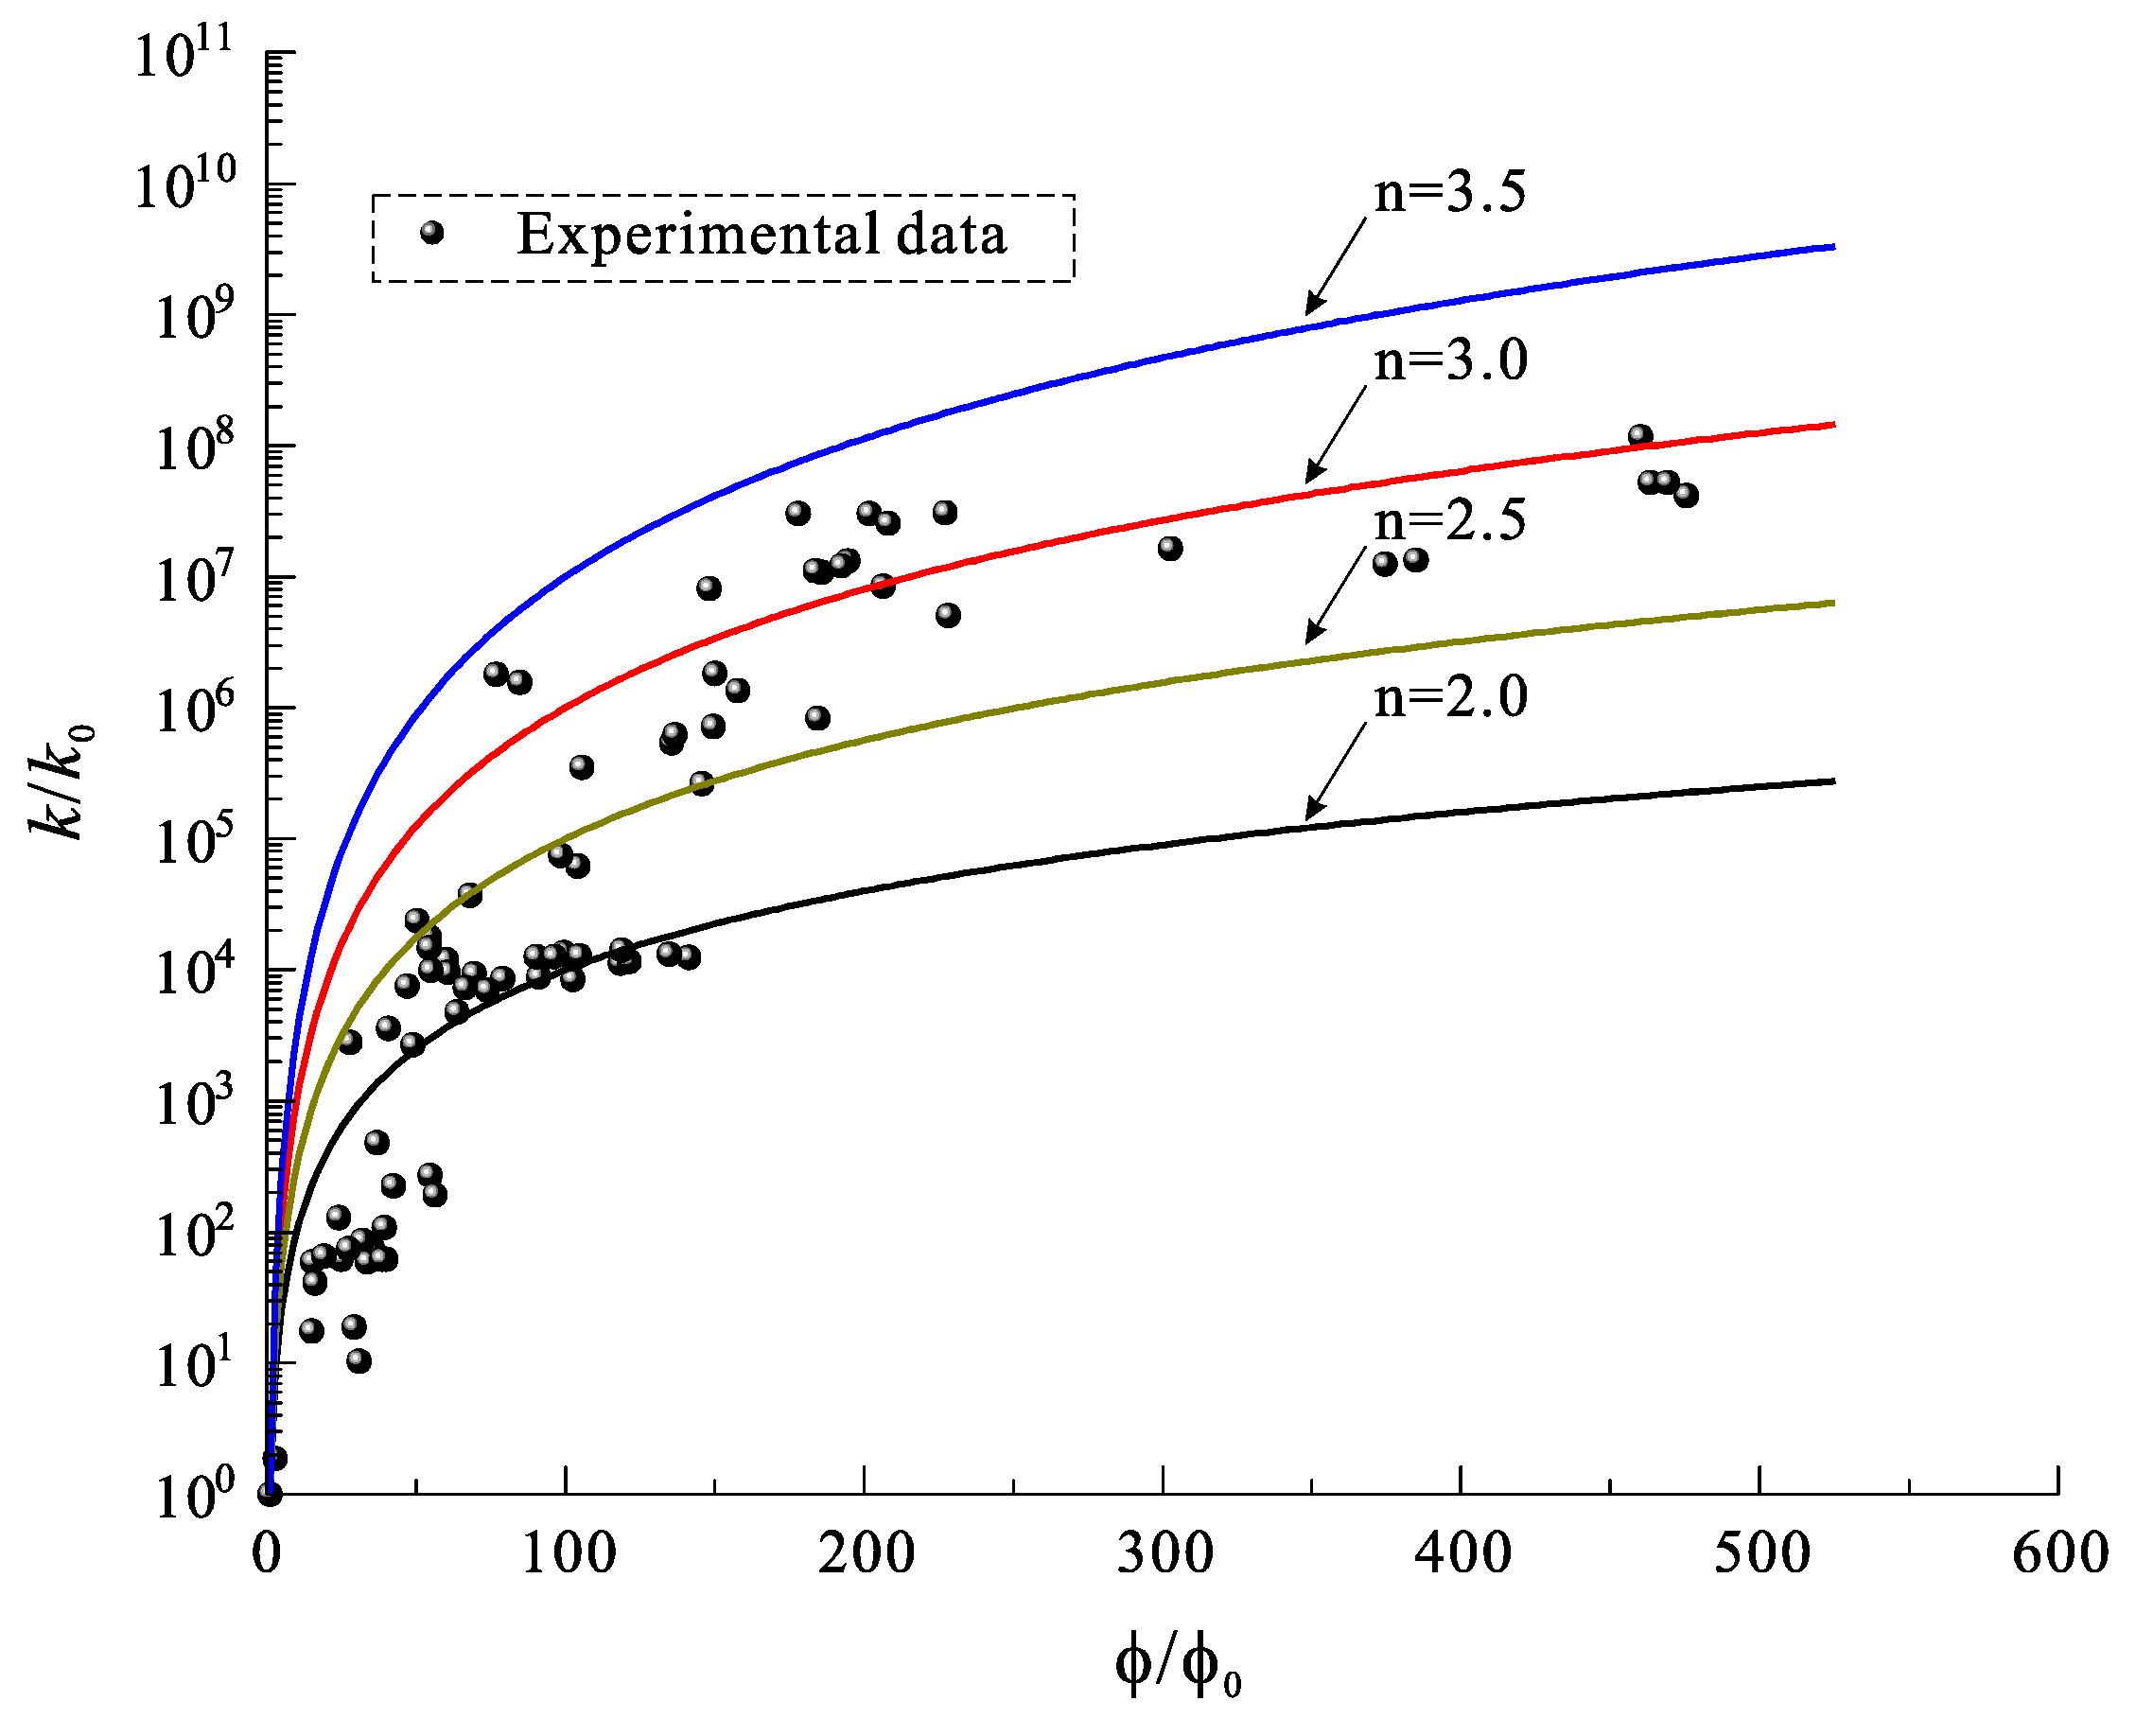
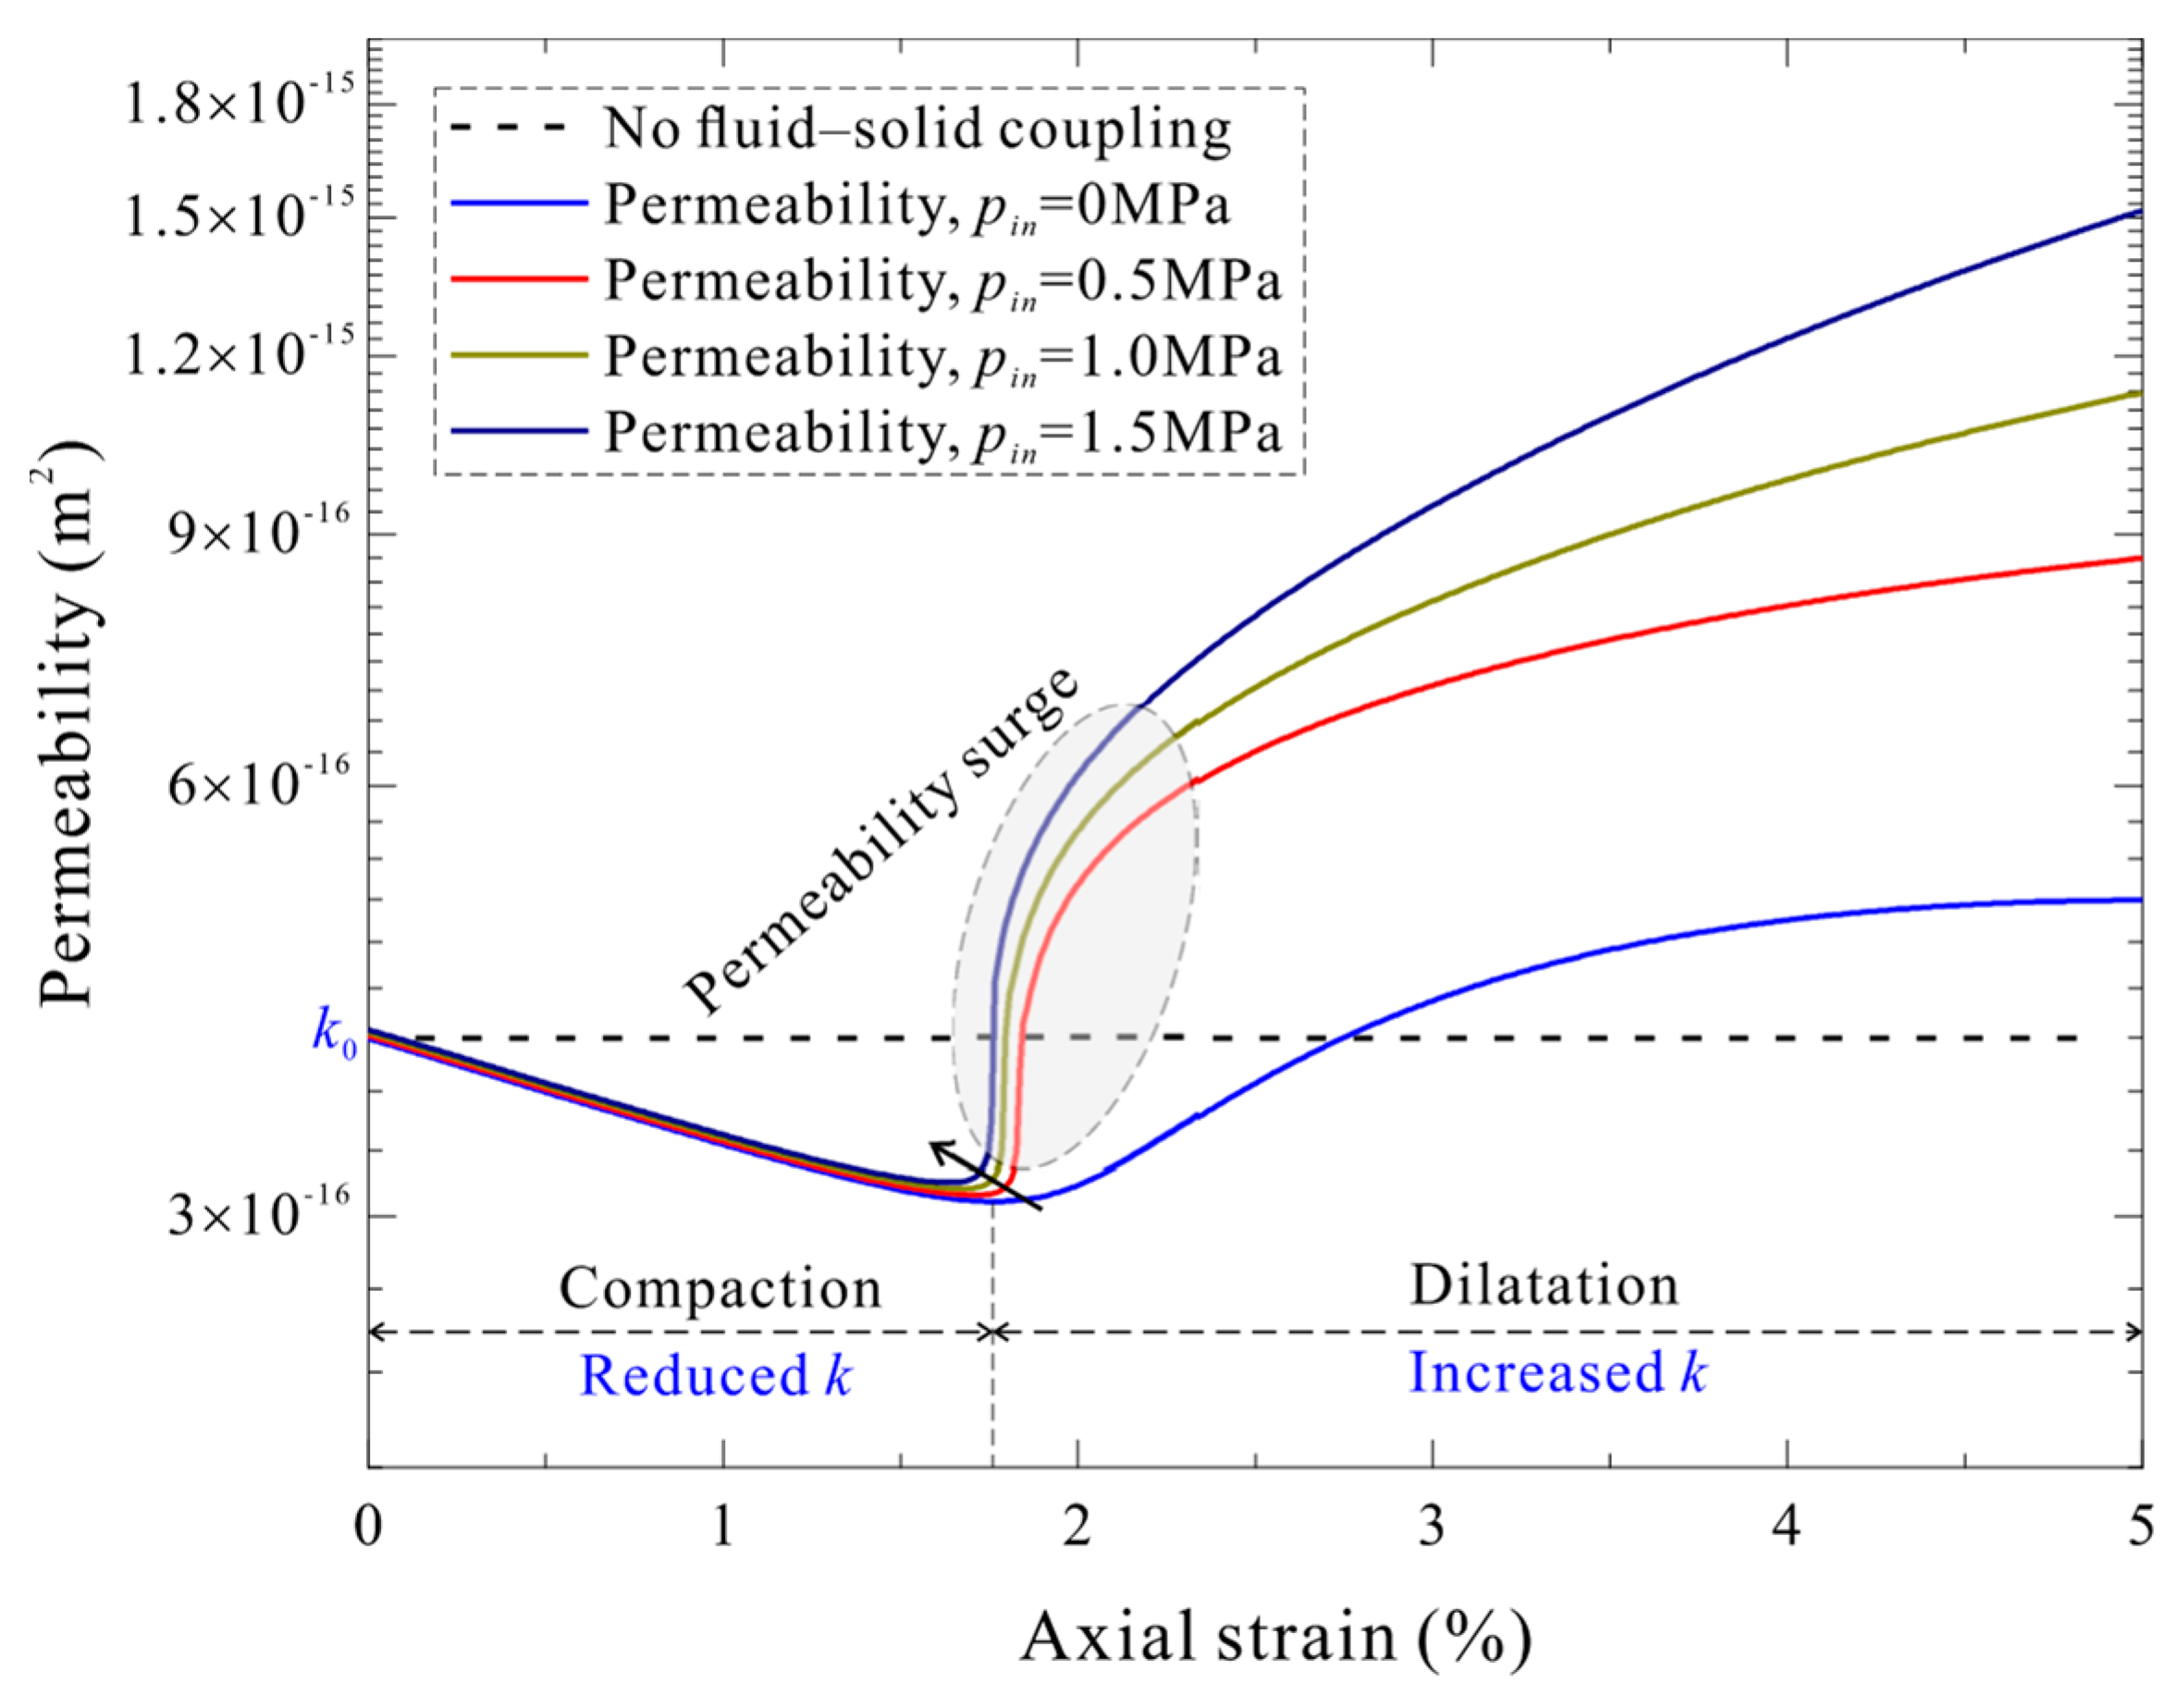
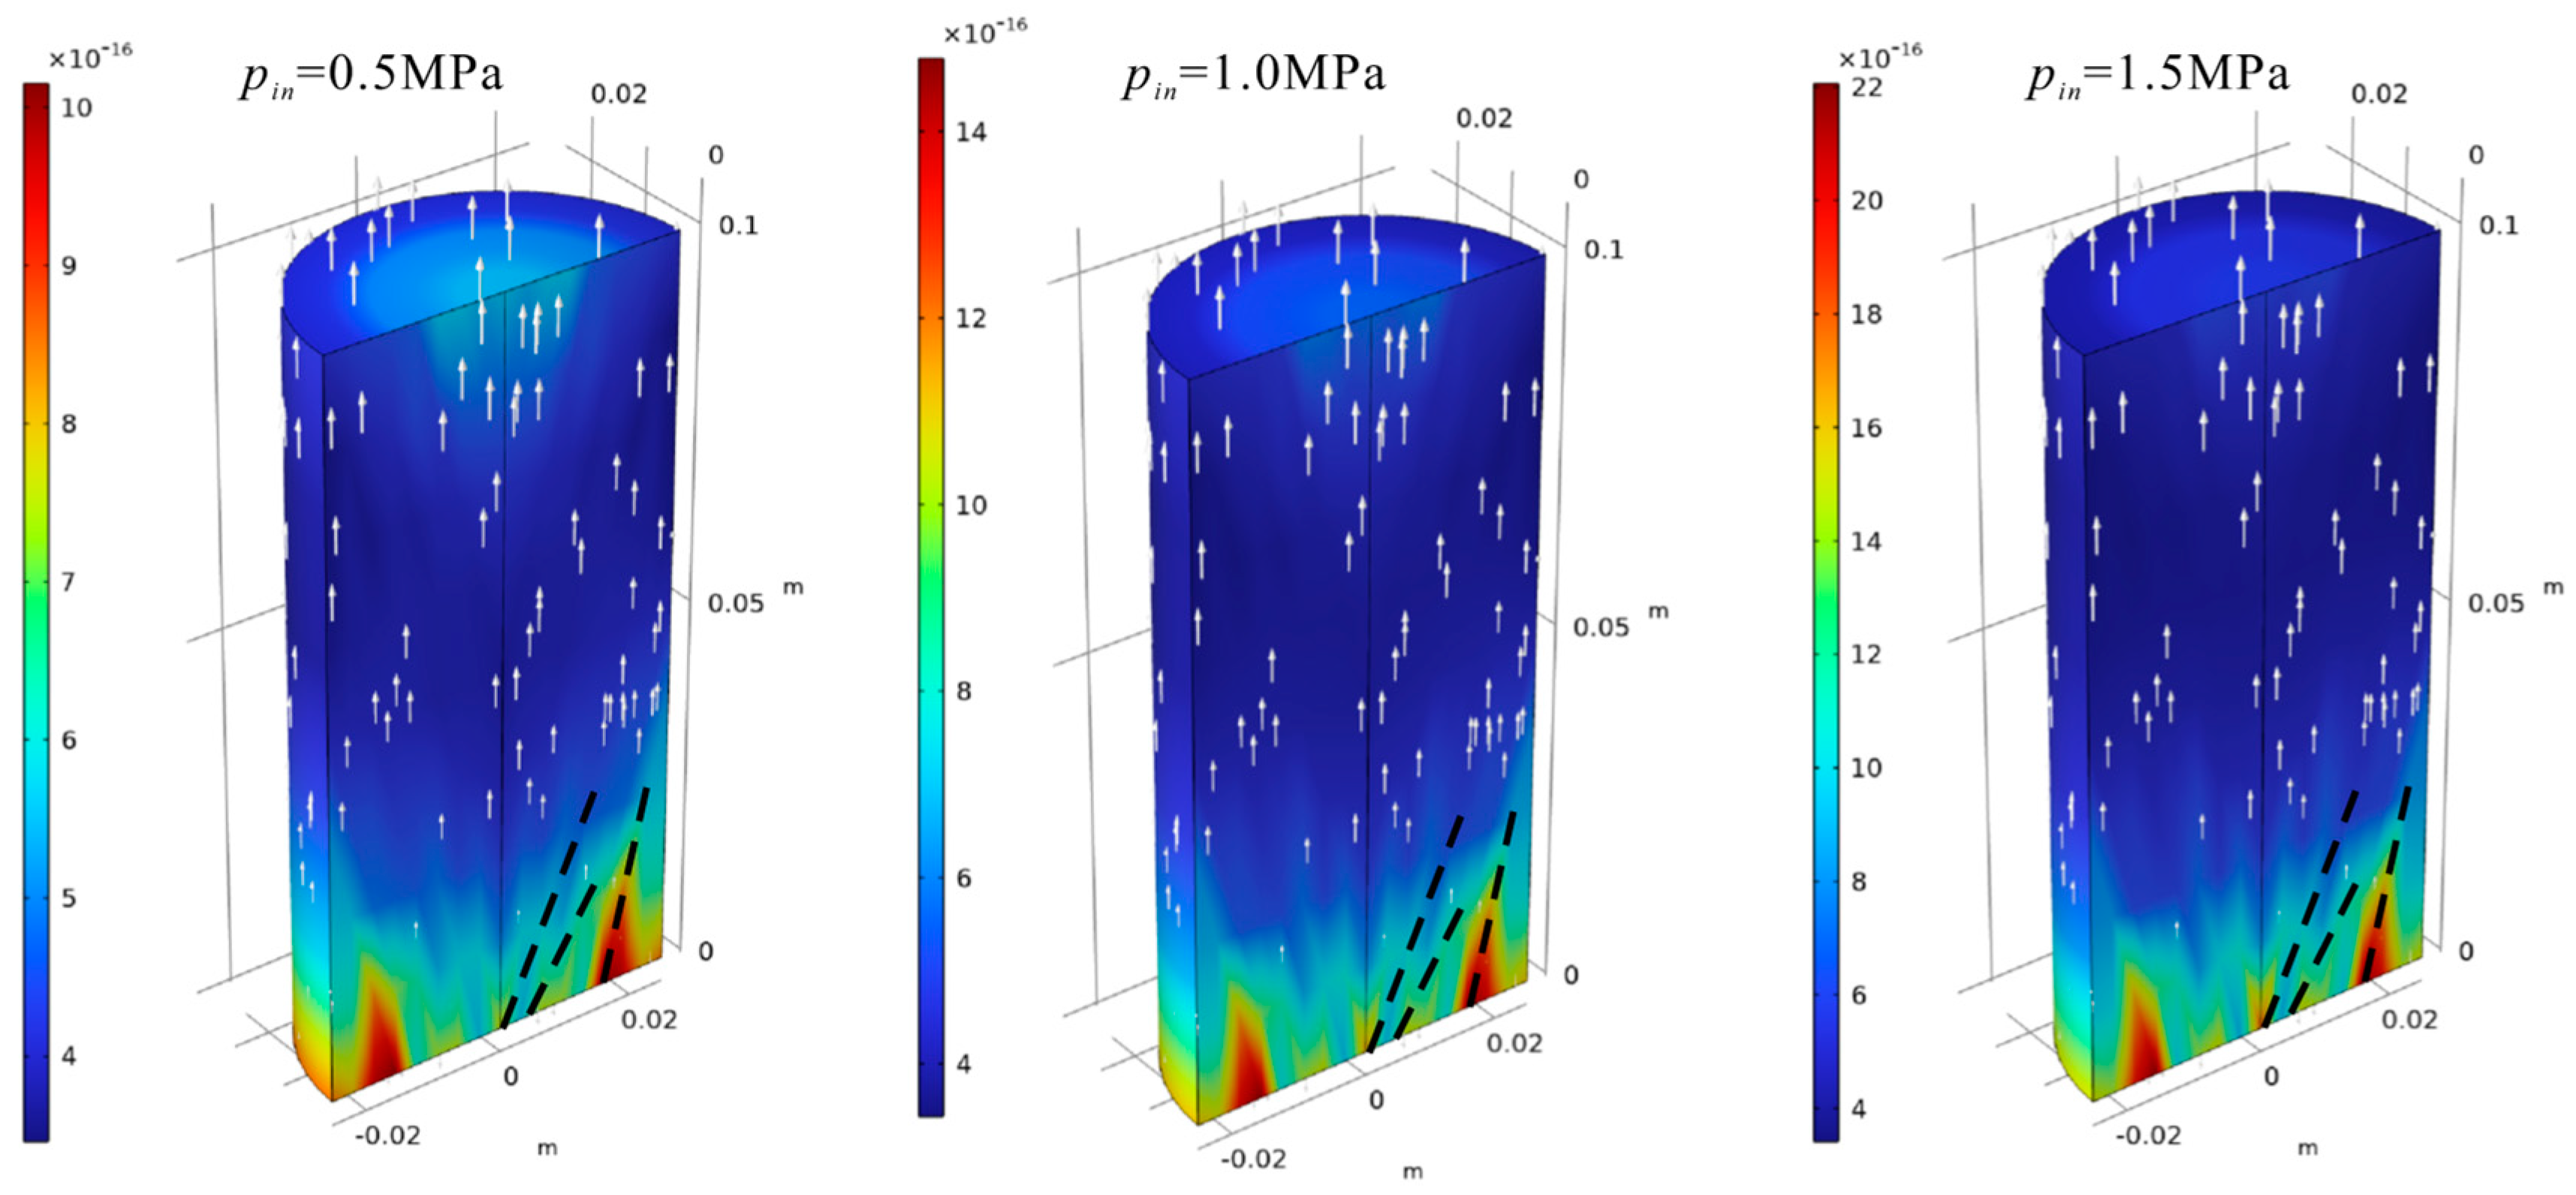
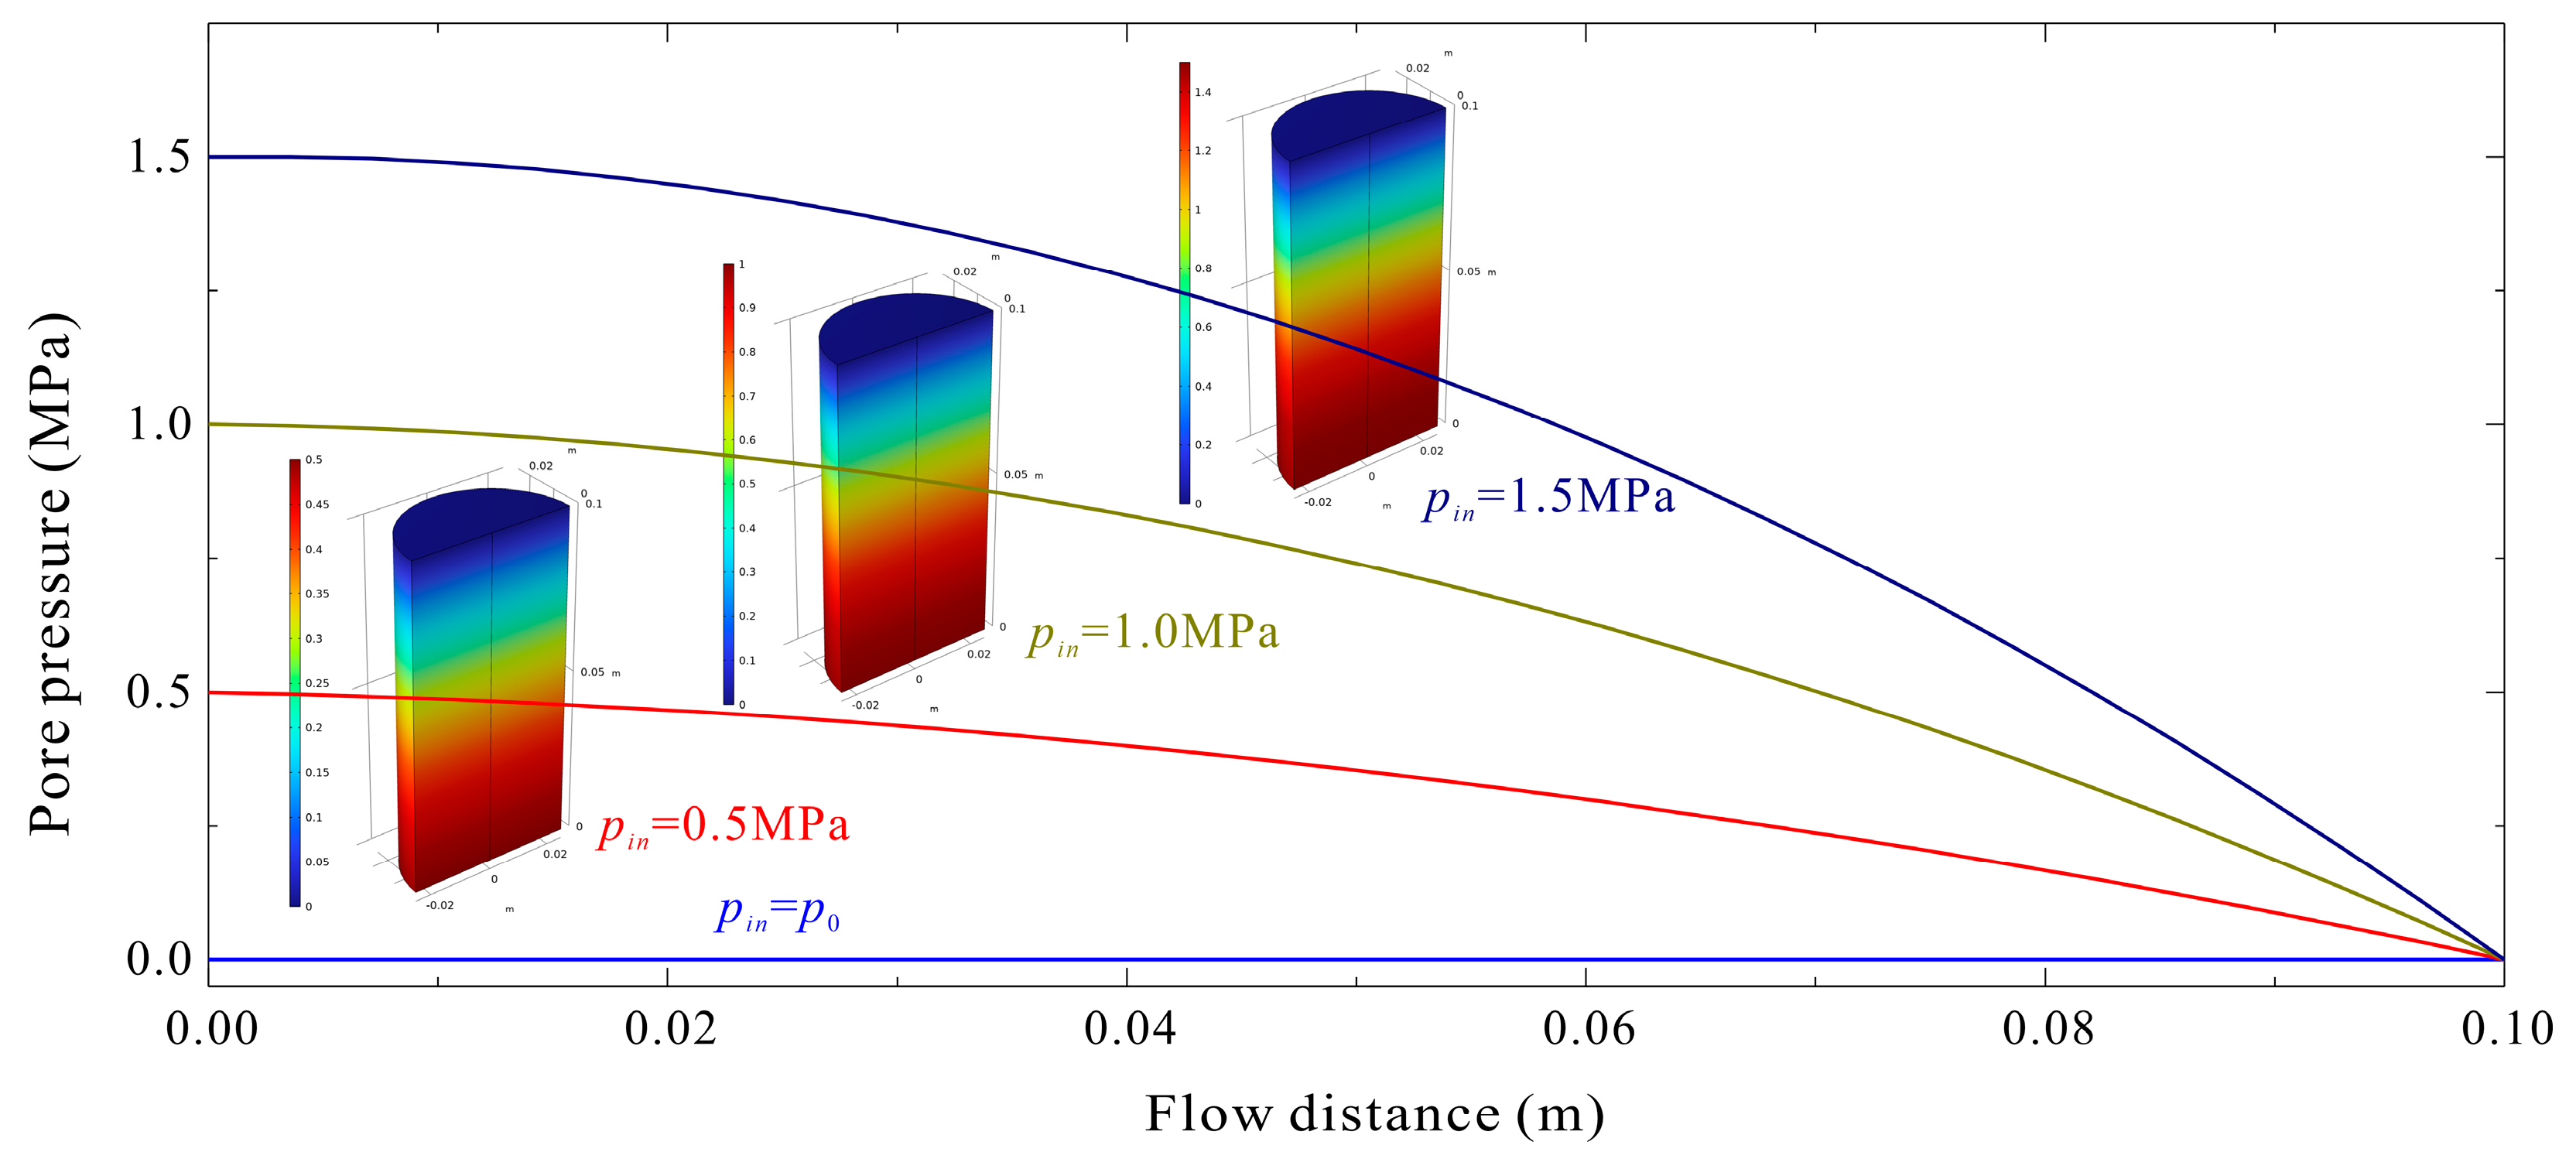
4.3. Permeability Evolution Analysis

Figure 12 shows the analytical predictions of the permeability evolution of the sandstone specimen under loading deformation at a confining pressure of 5 MPa. The permeability evolution of the rock under compression can be divided into two stages, decreasing and increasing, corresponding to the compaction and dilatation of the rock deformation, respectively. The evolution trend is consistent with experimental results. The influence of the seepage pressure on the permeability evolution is mainly concentrated in the increasing stage. With the increase in the seepage pressure, the growth rate of the permeability rapidly increases. Taking the seepage pressure of 1.5 MPa as an example, the permeability considering the effect of the fluid–solid coupling is about 10 times higher than that without the fluid–solid coupling. During the period from rock dilatation to failure, the permeability surge phenomenon can be clearly observed. This phenomenon becomes more obvious with the increase in the seepage pressure. Thereafter, the permeability enters slow growth until it stabilizes.
The turning point at which the permeability changes from decreasing to increasing moves forward with the increase in the seepage pressure (Figure 12), the corresponding permeability surge comes earlier. This reflects that the presence of seepage pressure (pore pressure) under the same boundary conditions reduces the strength and aggravates the damage to the rock. This conclusion is consistent with the existing geotechnical theories and engineering practices. Based on the relationship between porosity and permeability (Equation (10)), the trend of the porosity evolution is the same as that of the permeability.
The permeability contours and velocity streamline in the sandstone specimen in the case of failure are shown in Figure 13. One can see that the permeability gradually decreases from the bottom to the top of the sandstone specimen due to the influence of damage and deformation. Interestingly, the spatial variation in the permeability is not uniform in the height direction but has a deflection angle (the black dashed line in Figure 13). The direction and angle of this deflection largely coincide with the shear failure of the rock, which further validates the coupling relationship between damage and permeability and the reliability of the model.
According to the numerical and experimental results, it is found that the permeability of rock in the compaction stage has an exponential function relationship with the effective confining pressure (σ3p). However, the relationship in the dilatancy stage is extremely complicated due to the permeability surge phenomenon and cannot be expressed by a single function for the time being.
k = k 0 exp ( β p c e )
where pce denotes the effective confining pressure, and β is the equation coefficient.
Figure 14 shows the variation curves and contours of the pore pressure in the height direction. It is noticed that the pore pressure decreases with the increase in the flow distance, but the pressure gradient increases with the increase in the seepage distance. Therefore, the seepage velocity depends on the competitive influences of the permeability evolution and pressure gradient. For the proposed flow–solid coupling analysis model, the analysis results indicate that there is no significant difference in the seepage velocity in the horizontal direction. However, the outlet seepage velocity is higher than the inlet seepage velocity in the vertical direction, and the seepage velocity in the deflection direction is higher than that of the nearby part.

5. Discussion

The damage and permeability evolution of rocks is widely encountered in mining engineering, tunnel engineering, and underground energy storage, making them a key focus of research in the field of rock mechanics [36,37]. Revealing the coupling mechanism of each physical field plays an important role in understanding the properties of rocks such as strength, deformation, and permeability in complex geological environments. The focus of this study was sandstone, a brittle rock with strain-softening characteristics. Based on this evolution model of stress-induced sandstone permeability and damage, future studies will expand this study’s scope by investigating coupled damage evolution across different types of rocks.
Additionally, the impact of temperature on rock deformation and fluid flow in complex geological environments cannot be ignored, particularly in applications such as hot dry rock geothermal energy extraction, shale gas extraction, and carbon dioxide geological storage [38,39,40]. The effect of temperature on rock deformation can be realized through thermal stress, while the impact of temperature on fluid flow can be reflected in properties such as fluid viscosity, density, and pressure. If these effects are incorporated into the rock constitutive model and fluid continuity equation, thermal–hydro–mechanical (THM) coupling can be achieved. Future theoretical and experimental studies will continue to explore rock damage and permeability evolution under the influence of coupled multi-physics fields.

6. Conclusions

In this study, a new coupled seepage theory model for sandstone was developed. Drawing on extensive mechanical and permeability tests, the evolution equation for rock damage and permeability under compression was derived based on theoretical analysis and experimental observations. Moreover, the relationship between porosity and permeability in both porous media flow and fractured flow was unified. To solve the coupled seepage equation and verify its validity, the model was implemented in finite element software through programming and applied to the fluid–solid coupling analysis of rocks under triaxial compression.
Comparisons between the numerical results and experimental data indicated that this model can well describe the entire process of the investigated rock deformation and reproduce the damage and permeability evolution behavior, particularly the phenomenon of damage-induced permeability surge. The numerical results for stress-induced damage, damage-induced permeability, and seepage-induced deformation show strong agreement with the experimental data. The damage–strain curve resembles an “S-shaped” curve, characterized by slow growth, accelerated growth, and balance. The permeability–strain curve follows a “V-shaped” pattern, initially decreasing and then rapidly increasing. The turning point when the permeability changes from decreasing to increasing is the starting point of rock dilatancy. The permeability surge is mainly concentrated in the stage of rock dilatancy–failure.
Damage and effective mean stress (σmαbp) play a crucial role in the evolution of rock permeability and porosity. Among these factors, the effective mean stress has a dominant effect on permeability during the compaction stage of the rock, so the permeability shows a decreasing trend. When the effect of damage exceeds the effective mean stress, the permeability begins to turn into an increasing trend. This is the fundamental reason for the evolution of permeability.
To summarize, damage and permeability evolution exist in actual engineering and cannot be ignored. Seepage pressure not only reduces the strength of rocks but also aggravates the damage and thus induces an increase in permeability. This model reveals the mechanisms behind damage and permeability evolution in rocks and has significant application value in practical engineering fields, such as stability analysis of surrounding rock, leakage analysis in underground energy storage, and shale gas extraction.

Author Contributions

Conceptualization, Y.R., X.C. and C.X.; Methodology, Y.R. and H.D.; Software, Y.S.; Validation, Y.S., H.D. and C.X.; Formal analysis, X.C. and H.D.; Investigation, X.C.; Resources, Y.R. and Y.S.; Data curation, H.D.; Writing—original draft, Y.R. and H.D.; Writing—review & editing, X.C.; Supervision, Y.S. and C.X.; Project administration, C.X.; Funding acquisition, X.C. and C.X. All authors have read and agreed to the published version of the manuscript.

Funding

The authors would gratefully like to acknowledge the financial support from the National Key R&D Program of China (grant no. 2023YFC3009400), the National Natural Science Foundation of China (grant nos. 52208342 and 52068033), the Jiangxi Provincial Natural Science Foundation (grant nos. 20242ACB214008, 20232BAB204072, and 20232BCJ23069), and the Foundation of the Department of Transportation of Jiangxi Province (grant no. 2021C0006).

Institutional Review Board Statement

Not applicable.

Informed Consent Statement

Not applicable.

Data Availability Statement

The original contributions presented in the study are included in the article, further inquiries can be directed to the corresponding author.

Conflicts of Interest

Authors Yao Rong and Yang Sun were employed by the company Jiangxi Transportation Institute Co., Ltd. The remaining authors declare that the research was conducted in the absence of any commercial or financial relationships that could be construed as a potential conflict of interest.

References

  1. Bérest, P. Cases, causes and classifications of craters above salt caverns. Int. J. Rock Mech. Min. Sci. Géoméch. Abstr. 2017, 100, 318–329. [Google Scholar]
  2. Chen, X.; Wang, J. Stability analysis for compressed air energy storage cavern with initial excavation damage zone in an abandoned mining tunnel. J. Energy Storage 2021, 45, 103725. [Google Scholar] [CrossRef]
  3. He, M.; Sui, Q.; Li, M.; Wang, Z.; Tao, Z. Compensation excavation method control for large deformation disaster of mountain soft rock tunnel. Int. J. Min. Sci. Technol. 2022, 32, 951–963. [Google Scholar]
  4. Bérest, P.; Réveillère, A.; Evans, D.; Stöwer, M. Review and analysis of historical leakages from storage salt caverns wells. Oil Gas Sci. Technol. Rev. d’IFP Energies Nouv. 2019, 74, 27. [Google Scholar]
  5. Liu, C.; Zhang, D.; Zhang, S. Characteristics and treatment measures of lining damage: A case study on a mountain tunnel. Eng. Fail. Anal. 2021, 128, 105595. [Google Scholar]
  6. Lyu, C.; Liu, J.; Ren, Y.; Liang, C.; Zeng, Y. Mechanical characteristics and permeability evolution of salt rock under thermal-hydro-mechanical (THM) coupling condition. Eng. Geol. 2022, 302, 106633. [Google Scholar] [CrossRef]
  7. Chang, S.-H.; Lee, C.-I. Estimation of cracking and damage mechanisms in rock under triaxial compression by moment tensor analysis of acoustic emission. Int. J. Rock Mech. Min. Sci. Géoméch. Abstr. 2004, 41, 1069–1086. [Google Scholar] [CrossRef]
  8. Ashby, M.F.; Sammis, C.G. The damage mechanics of brittle solids in compression. Pure Appl. Geophys. 1990, 133, 489–521. [Google Scholar]
  9. Alkan, H. Percolation model for dilatancy-induced permeability of the excavation damaged zone in rock salt. Int. J. Rock Mech. Min. Sci. 2009, 46, 716–724. [Google Scholar]
  10. Salimzadeh, S.; Paluszny, A.; Zimmerman, R.W. Three-dimensional poroelastic effects during hydraulic fracturing in permeable rocks. Int. J. Solids Struct. 2017, 108, 153–163. [Google Scholar] [CrossRef]
  11. Wanniarachchi, W.; Ranjith, P.; Perera, M.; Rathnaweera, T.; Zhang, D.; Zhang, C. Investigation of effects of fracturing fluid on hydraulic fracturing and fracture permeability of reservoir rocks: An experimental study using water and foam fracturing. Eng. Fract. Mech. 2018, 194, 117–135. [Google Scholar]
  12. Shao, H.; Wang, Y.; Nagel, T.; Kolditz, O.; Yoshioka, K. Determination of permeability for hydrocarbon release due to excavation-induced stress redistribution in rock salt. Int. J. Rock Mech. Min. Sci. 2020, 136, 104525. [Google Scholar]
  13. Stormont, J.; Daemen, J. International Journal of Rock Mechanics and Mining Sciences & Geomechanics Abstracts; Elsevier: Amsterdam, The Netherlands, 2017; pp. 325–342. [Google Scholar]
  14. Zhao, Y.; Liu, Q.; Zhang, C.; Liao, J.; Lin, H.; Wang, Y. Coupled seepage-damage effect in fractured rock masses: Model development and a case study. Int. J. Rock Mech. Min. Sci. Géoméch. Abstr. 2021, 144, 104822. [Google Scholar] [CrossRef]
  15. Walsh, J.B. Effect of pore pressure and confining pressure on fracture permeability. Int. J. Rock Mech. Min. Sci. 1981, 18, 429–435. [Google Scholar]
  16. Lemaitre, J.; Desmorat, R. Engineering Damage Mechanics Ductile, Creep, Fatigue and Brittle Failures; Springer Science & Business Media: Berlin/Heidelberg, Germany, 2006; pp. 1–7. [Google Scholar]
  17. Unteregger, D.; Fuchs, B.; Hofstetter, G. A damage plasticity model for different types of intact rock. Int. J. Rock Mech. Min. Sci. Géoméch. Abstr. 2015, 80, 402–411. [Google Scholar]
  18. Deng, J.; Gu, D. On a statistical damage constitutive model for rock materials. Comput. Geosci. 2011, 37, 122–128. [Google Scholar] [CrossRef]
  19. Stormont, J. In situ gas permeability measurements to delineate damage in rock salt. Int. J. Rock Mech. Min. Sci. 1997, 34, 1055–1064. [Google Scholar]
  20. Fu, J.; Li, B.; Ren, C.; Cheng, Q.; Ye, P.; Zhou, S. Study on Elastoplastic Damage Constitutive Model and Permeability Evolution Law of Gas-Bearing Coal. Rock Mech. Rock Eng. 2024, 1–23. [Google Scholar] [CrossRef]
  21. Vu, M.N.; Nguyen, S.T.; To, Q.D.; Dao, N.H. Theoretical predicting of permeability evolution in damaged rock under compressive stress. Geophys. J. Int. 2017, 209, 1352–1361. [Google Scholar]
  22. Tang, C.; Tham, L.; Lee, P.; Yang, T.; Li, L. Coupled analysis of flow, stress and damage (FSD) in rock failure. Int. J. Rock Mech. Min. Sci. Géoméch. Abstr. 2002, 39, 477–489. [Google Scholar]
  23. Zhang, H.; Liu, J.; Elsworth, D. How sorption-induced matrix deformation affects gas flow in coal seams: A new FE model. Int. J. Rock Mech. Min. Sci. Géoméch. Abstr. 2008, 45, 1226–1236. [Google Scholar] [CrossRef]
  24. Luo, Z.; Zhang, N.; Zhao, L.; Yao, L.; Liu, F. Seepage-stress coupling mechanism for intersections between hydraulic fractures and natural fractures. J. Pet. Sci. Eng. 2018, 171, 37–47. [Google Scholar] [CrossRef]
  25. Li, T.; Peng, F.; Chen, C.; Ma, C.; Li, Y.; Wang, Y.; Li, Y. Investigating the Creep Damage and Permeability Evolution Mechanism of Phyllite Considering Non-Darcy’s Flow. Rock Mech. Rock Eng. 2024, 1–16. [Google Scholar] [CrossRef]
  26. Chen, X.; Li, Y.; Shi, Y.; Yu, Y.; Jiang, Y.; Liu, Y.; Dong, J. Tightness and stability evaluation of salt cavern underground storage with a new fluid–solid coupling seepage model. J. Pet. Sci. Eng. 2021, 202, 108475. [Google Scholar]
  27. Salari, M.; Saeb Sa Willam, K.; Patchet, S.; Carrasco, R. A coupled elastoplastic damage model for geomaterials. Comput. Methods Appl. Mech. Eng. 2004, 193, 2625–2643. [Google Scholar]
  28. Zhou, H.; Jia, Y.; Shao, J. A unified elastic–plastic and viscoplastic damage model for quasi-brittle rocks. Int. J. Rock Mech. Min. Sci. Géoméch. Abstr. 2008, 45, 1237–1251. [Google Scholar]
  29. Weibull, W. A Statistical Distribution Function of Wide Applicability. J. Appl. Mech. 1951, 18, 293–297. [Google Scholar]
  30. Chen, X.; Li, Y.; Tong, L.; Geng, D.; Dong, Z.; Yang, P. Elastoplastic Damage Behavior of Rocks: A Case Study of Sandstone and Salt Rock. Rock Mech. Rock Eng. 2023, 56, 5621–5634. [Google Scholar] [CrossRef]
  31. Carman, P.C. Fluid flow through granular beds. Trans. Inst. Chem. Eng. 1937, 15, 150–166. [Google Scholar] [CrossRef]
  32. Kozeny, J. Uber kapillare leitung der wasser in boden. R. Acad. Sci. Vienna Proc. Class I 1927, 136, 271–306. [Google Scholar]
  33. Brace, W.F.; Walsh, J.; Frangos, W. Permeability of granite under high pressure. J. Geophys. Res. 1968, 73, 2225–2236. [Google Scholar]
  34. Biot, M.A. Theory of elasticity and consolidation for a porous anisotropic solid. J. Appl. Phys. 1955, 26, 182–185. [Google Scholar]
  35. Zhao, L.-Y.; Zhang, W.-L.; Lai, Y.-M.; Niu, F.-J.; Zhu, Q.-Z.; Shao, J.-F. A Heuristic Elastoplastic Damage Constitutive Modeling Method for Geomaterials: From Strength Criterion to Analytical Full-Spectrum Stress–Strain Curves. Int. J. Géoméch. 2021, 21, 04020255. [Google Scholar]
  36. Chen, X.; Yu, J.; Tang, C.A.; Li, H.; Wang, S. Experimental and numerical investigation of permeability evolution with damage of sandstone under triaxial compression. Rock Mech. Rock Eng. 2017, 50, 1529–1549. [Google Scholar]
  37. Xu, T.; Tang, C.A. Modeling of stress-induced permeability evolution and damage of rock. Adv. Mater. Res. 2008, 33, 609–616. [Google Scholar]
  38. Huang, S.; Liu, Q.; Cheng, A.; Liu, Y.; Liu, G. A fully coupled thermo-hydro-mechanical model including the determination of coupling parameters for freezing rock. Int. J. Rock Mech. Min. Sci. 2018, 103, 205–214. [Google Scholar]
  39. Liang, X.; Meng, T.; Feng, G.; Zhao, G.; Wang, Z.; Liu, P. Evolution of permeability and pore structure of salt rock and its self-healing mechanism under coupled thermo-hydro-mechanical environment. J. Energy Storage 2023, 66, 107476. [Google Scholar]
  40. Reppas, N.; Gui, Y.; Wetenhall, B.; Davie, C.T.; Ma, J. A fully coupled thermo-hydro-mechanical elastoplastic damage model for fractured rock. Geomech. Geophys. Geo Energy Geo-Resour. 2024, 10, 29. [Google Scholar]
Figure 1. Coupling mechanism of rock damage and permeability under stress and seepage fields.
Applsci 14 07368 g001
Figure 2. Damage–strain and stress–strain curves of sandstone at a confining pressure of 10 MPa; σe, σd, and σp are the elasticity limit, dilatancy stress, and peak stress [30].
Applsci 14 07368 g002
Figure 3. PDF and CDF of Weibull distribution with different shape parameters.
Applsci 14 07368 g003
Figure 4. Permeability−strain and stress−strain curves of sandstone at a confining pressure of 10 MPa; k denotes permeability.
Applsci 14 07368 g004
Figure 5. Schematic of the equivalent hydraulic radius in fracture flow.
Applsci 14 07368 g005
Figure 6. Comparison results between theoretical model and experimental data in terms of porosity and permeability.
Applsci 14 07368 g006
Figure 7. The curve of f(D) with the damage variable.
Applsci 14 07368 g007
Figure 8. Simulation model for evolution analysis of rock damage and permeability.
Applsci 14 07368 g008
Figure 9. Comparison results of stress−strain curves obtained by experimental data and theoretical analysis under different confining pressures.
Applsci 14 07368 g009
Figure 10. Stress–strain curves of sandstone specimen with different inlet seepage pressures pin.
Applsci 14 07368 g010
Figure 11. Damage evolution of sandstone specimen under triaxial compression conditions with different inlet seepage pressures pin.
Applsci 14 07368 g011
Figure 12. Permeability evolution of sandstone specimen under triaxial compression conditions with different inlet seepage pressures pin.
Applsci 14 07368 g012
Figure 13. Permeability contours and velocity streamline with different inlet seepage pressures.
Applsci 14 07368 g013
Figure 14. The variation curves of pore pressure with flow distance.
Applsci 14 07368 g014
Table 1. Property parameters of selected sandstone and nitrogen.
ParameterValue
Density of sandstone, ρ (kg/m3)2650.00
Young’s modulus of sandstone, E (GPa)4.75
Poisson’s ratio of sandstone, ν (1)0.28
Cohesion of sandstone, c (MPa)10.88
Angle of internal friction of sandstone, φ (°)31.56
Initial porosity of sandstone, ϕ0 (%)7.76
Initial permeability of sandstone, k0 (m2)3.99 × 10⁻¹⁶
Dynamic viscosity of nitrogen, μ (Pa·s)1.76 × 10⁻⁵
Disclaimer/Publisher’s Note: The statements, opinions and data contained in all publications are solely those of the individual author(s) and contributor(s) and not of MDPI and/or the editor(s). MDPI and/or the editor(s) disclaim responsibility for any injury to people or property resulting from any ideas, methods, instructions or products referred to in the content.

