Abstract
Connected Autonomous Vehicles (CAVs) have the potential to revolutionize traffic systems by autonomously handling complex maneuvers such as freeway ramp merging. However, the unpredictability of manual-driven vehicles (MDVs) poses a significant challenge. This study introduces a novel decision-making approach that incorporates the uncertainty of MDVs’ driving styles, aiming to enhance merging efficiency and safety. By framing the CAV-MDV interaction as an incomplete information static game, we categorize MDVs’ behaviors using a Gaussian Mixture Model–Support Vector Machine (GMM-SVM) method. The identified driving styles are then integrated into the flexible merging decision process, leveraging the concept of pure-strategy Nash equilibrium to determine optimal merging points and timing. A deep reinforcement learning algorithm is employed to refine CAVs’ control decisions, ensuring efficient right-of-way acquisition. Simulations at both micro and macro levels validate the method’s effectiveness, demonstrating improved merging success rates and overall traffic efficiency without compromising safety. The research contributes to the field by offering a sophisticated merging strategy that respects real-world driving behavior complexity, with potential for practical applications in urban traffic scenarios.
1. Introduction
1.1. Background
Unreasonable driving behaviors in urban freeway merging zones are a significant cause of traffic congestion and accidents. Implementing autonomous driving technology can assist or even replace manual driving, thereby offering a promising solution. Connected Autonomous Vehicles (CAVs) leverage Vehicle-to-Everything (V2X) communication to gather comprehensive driving status information on all vehicles and the road infrastructure. This real-time, stable communication also facilitates cooperative capabilities among CAVs.
As CAVs evolve, the decision-making process for freeway merging must be refined [1]. While single-vehicle intelligence can mitigate erratic driving, the absence of a cooperative mechanism can result in overly cautious merging decisions. Global cooperation methods, which require high CAV penetration rates and assume fixed merging points, do not align with the flexible merging strategies employed by human drivers. Moreover, the transition to CAVs will be gradual, with freeways featuring a mix of manual driving vehicles (MDVs) and CAVs for the foreseeable future. The diverse and unpredictable driving styles of MDVs introduce complexity and uncertainty to the traffic environment. Accurately discerning the driving patterns of MDVs and gauging their cooperative intent is essential for CAVs to achieve safe and efficient merging. This study aims to explore the interaction between CAVs and MDVs during freeway merging. By analyzing driving conflict characteristics, modeling key issues, and proposing a tailored merge decision algorithm, this research holds significant theoretical and practical value for enhancing urban freeway traffic efficiency and ensuring road safety.
1.2. Related Works
1.2.1. Merging Decision-Making Methods
Merging decision-making methods can be categorized into five main types: model-based, learning-based, game-based, global optimization-based, and rule-based approaches. Model-based methods conceptualize the merging challenge as an insertion process, necessitating the creation of models for selecting optimal merging timing, gap, point, and trajectory planning [2,3,4,5]. However, due to the highly non-linear nature of traffic systems, constructing these models is exceedingly complex.
Learning-based methods offer an alternative perspective, harnessing historical trajectory data to learn from human merging behaviors and providing a more adaptive approach to the merging problem [6,7,8].
Game theory is extensively applied to address conflicts between two vehicles. Game-based methods analyze the interplay of behavioral decisions between oncoming and merging vehicles, factoring in safety, comfort, and efficiency [9,10,11,12,13]. They operate on the rational premise that each vehicle aims to maximize its own benefit, using equilibrium concepts from game theory for right-of-way allocation, such as pure-strategy Nash equilibrium and mixed-strategy Nash equilibrium.
Global optimization-based methods focus on objective optimization, either maximizing a single goal or balancing multiple indicators. These centralized approaches coordinate the movements of all CAVs within a controlled area to achieve optimal merging outcomes [14,15,16,17,18].
Lastly, rule-based methods are distinguished by their low computational cost, stability, high efficiency, and strong interpretability [19,20,21,22,23,24]. Examples include the “First In, First Out (FIFO)” rule and similar straightforward protocols that facilitate clear and consistent decision-making processes.
1.2.2. Driving Style Recognition
Elander [25] introduced the concept of driving style, defining it as a set of habits that drivers develop over time through their driving experiences. Currently, there are two primary approaches to defining driving style. Some researchers categorize drivers into distinct styles using classification techniques. For example, Hanwool et al. classify driving styles into general, aggressive, and conservative [26,27]. Others quantify driving style intensity into multiple levels, with higher levels indicating more aggressive behavior [28].
There are three principal methods for identifying driving styles: subjective questionnaires, rule-based analysis, and learning-based algorithms. Subjective questionnaires assess a driver’s style by designing surveys and collecting responses from drivers [29,30,31]. However, these methods are not easily implemented in real-time applications. As a result, the development of models that use objective driving data to recognize driving styles online is gaining traction among researchers [32,33,34,35,36].
Rule-based methods classify driving styles by setting thresholds for key performance indicators and comparing actual values against these thresholds. Yet, these methods suffer from limited generalizability and require extensive data to establish accurate thresholds [37]. In contrast, learning-based methods analyze data to train models, offering advantages such as effective learning and robust generalization capabilities. For instance, Wang [38] and colleagues combined the K-means clustering algorithm with Support Vector Machines (SVMs) to create a driving style recognition model, which showed improved accuracy. Mantouka [39] and others used K-means clustering to categorize driver styles and further analyzed the behavioral traits of drivers based on the clusters. Zhang [40] and colleagues proposed a semi-supervised model integrating the K-Nearest Neighbor algorithm, which achieved high recognition rates even with small sample sizes.
Furthermore, driving style is closely related to the driving context and environment. Not only do drivers exhibit different styles in various scenarios but the styles can also vary within the same scenario depending on the driver’s position. The design of driving style recognition models must be tailored to specific research objectives and the driving environment. While existing studies have made progress in classifying and recognizing driving styles, they often overlook the dynamic nature of these styles. There is a need to consider how driving styles evolve over time and across different settings, as well as the relationship between driving styles and potential vehicle actions.
1.2.3. Review of Research Status
The above briefly introduces the core ideas of different merging methods. This section briefly reviews the above methods. The merging decision model of single-vehicle intelligence has achieved satisfactory results in terms of safety but there are still many strong assumptions, such as that of a complete perception, that decisions can be fully implemented, etc. Some model-based decision-making methods are sometimes too conservative. The local collaborative decision-making algorithm improves the conservative decision-making of single-vehicle intelligence due to the lack of information interaction to a certain extent and further improves the efficiency of traffic, but it is still not perfect. For example, the above methods assume that all autonomous vehicles on the scene have the same decision algorithm and no communication delay and that the main-road driving fleet is stable, which cannot be effectively applied in mixed-traffic scenarios. The method of global coordination can maximize the capacity of the merging area. The optimal traffic sequence can be planned based on the global optimal centralized decision, but the computational burden is the biggest obstacle to its application. Rule-based multi-vehicle scheduling decisions can reduce the computational burden, but these rules have shortcomings. In addition, such studies pay little attention to driving style, ignoring the recognition of human drivers for traffic sequences and the enforceability of vehicles.
Based on the above discussion, we find that game-based decision-making is more suitable for the theme of this paper. Among the various methods, game-based merging decision algorithms are particularly well suited for mixed-traffic scenarios characterized by low CAV penetration, diverse vehicle preferences, and the need for cooperation from main-road vehicles. Consequently, this study opts for game theory as the merging decision-making approach. Some researchers have designed a variety of merging methods based on game theory. For example, one study [9] believes that sometimes drivers may choose poor strategies due to their misjudgment of the environment, assuming that manual drivers always make rational choices, but still make wrong decisions according to the probability distribution. From the number of rounds of the game, it can be divided into static games and dynamic games. Another study [10] built a game model between ramp vehicles and mainline vehicles based on a static game and determined the optimal action of each vehicle and planned its trajectory according to the revenue. A third study [11] uses the method of dynamic games to design the space–time trajectory of conflicting vehicle combinations and solves the dynamic game by enumerating various combinations. Especially when the initial gap is not enough to realize the immediate import, this method effectively induces the action of competitive vehicles through comprehensive action game theory and dynamic programming. In addition, study [12] believes that game decisions are not made at the same time, but that one party reacts after observing the actions of the other party. Therefore, based on the partially observable leader–follower game theory, this paper models the inflow problem. Study [13] proposes a data-driven method to model the behavior of MDVs and regards MDVs as the player of the game. The game payoff matrix is used as the data of the IRL learning reward function, and a DQN is used to simulate the behavior of MDVs. However, existing game-based methods have their shortcomings:
- Strategy Quantification Issue: The game’s strategy space, often based on semantic information like “yield or merge”, makes it challenging to select strategies that align with individual preferences.
- Decision Implementation Issue: Pure-strategy Nash equilibria, if used as non-allocation mechanisms, may fail to produce an equilibrium in some game rounds. Mixed-strategy Nash equilibria yield probabilistic outcomes, posing a dilemma for decision-making under these conditions.
- Incomplete Information on MDVs: Without communication tools, MDVs’ strategies, payoffs, and potential actions remain unknown, presenting a significant research challenge.
- Inadequate Modeling of MDV Behavior: Some studies presume MDVs act with complete rationality, avoiding obvious errors. Yet, in reality, drivers’ rationality is bounded, and the likelihood of mistakes, especially uncoordinated actions, can significantly impact CAVs’ merging decisions.
In addition, the existing research has provided rich theoretical support for driving style recognition. However, the research on integrating style recognition into confluence decision-making is still insufficient. The research on ramp merging on expressways usually regards the conflict object as a uniform feature, without considering the individual differences between drivers. Personal driving style also has dynamic characteristics affected by the environment. There is time–space inconsistency when the distance between manual driving vehicles on the main road and the ramp junction is different. Ignoring the heterogeneity of vehicles may lead to modeling errors of mainline vehicle behaviors, affecting the practicability, authenticity, and generalization ability of the model. In particular, the neglect of the spatio-temporal inconsistency of the driving style of the decision-makers has led to the wrong estimation of the intention of the others, which directly affects the spatio-temporal adaptability of the merging vehicles into the decision-making system and then leads to the conservative or radical output. Therefore, it is of great significance to design a driving style and intention recognition algorithm for improving the robustness of merging decision systems that comprehensively consider the inconsistency of driving styles.
1.3. Motivation and Contribution
To sum up, although the current merging decision-making methods of expressways consider the coordination rules of conflicting vehicles to a certain extent, the research at this stage seldom considers the complex interaction process. The partial decision algorithm assumes that the driving style of the target vehicle is uniform, that there is no significant difference in the decision objectives, and that it is also completely rational in the import process, not making any obvious irrational decisions. However, in real scenarios, there are different degrees of “selfish driving” among the conflict subjects in merging areas. And, the rational behavior of the drivers of manual driving vehicles is limited. There are differences in the core benefits of decision-making among different decision-makers. If these significant differences are ignored, the intention of other vehicles will be seriously misjudged, which will significantly affect the decision-making of CAVs. This study believes that manual driving style changes with the surrounding environment, attempts to explore the basic patterns and time-varying characteristics of MDVs’ driving styles, and proposes a driving conflict decision-making solution considering the heterogeneity in driving styles. The synthesis of the research on merging decision-making methods yields several key insights. Model-based and learning-based approaches, lacking a cooperative framework, tend to be overly cautious when gaps do not meet insertion criteria, leading to a low success rate in merging. Objective optimization and rule-based methods struggle at low CAV penetration rates and assume uniform merging points on the main road. In contrast, game-based methods adeptly accommodate individual drivers’ flexible preferences for merging timing, location, and maneuvers, aligning well with the varied choices of human drivers. The rational human assumption in game theory also resonates with drivers’ self-interested behaviors.
In summary, current merging decision algorithms, while accounting for the potential cooperation of main-road vehicles, often overlook the relationship between the degree of cooperation and the vehicles’ spatial–temporal distribution. Most studies assume a fixed driving style for the target vehicle, ignoring the spatial–temporal variability inherent in drivers’ styles. This oversight is evident in the varying cooperation levels of main-road vehicles and the behavioral patterns influenced by their positions in the merging zone. Ignoring this vehicle heterogeneity could lead to incorrect assessments of main-road vehicle intentions, resulting in overly conservative or aggressive decision-making outputs, which in turn affect the performance and generalizability of the decision-making system.
This study introduces a novel, flexible game-based merging decision-making method that takes into account the heterogeneity of manual driving vehicles’ (MDVs) driving styles to tackle the aforementioned challenges. We have developed an incomplete information heterogeneous vehicle merging game decision-making model that addresses incomplete information by identifying MDVs’ driving styles and incorporates changes in these styles into the decision-making process. A pure-strategy Nash equilibrium serves as the mechanism for the deallocation of the right-of-way. The proposed method combines game theory with deep reinforcement learning (DRL) to expedite the process by which merging Connected Autonomous Vehicles (CAVs) achieve favorable game equilibrium outcomes. This research advances the field by offering a sophisticated approach to merging decisions that respects the complexity and variability of real-world driving behaviors, enhancing both traffic efficiency and safety. Real-world scenarios are faithfully recreated, and simulation experiments are conducted, demonstrating the effectiveness of the proposed algorithms. The main contributions of this paper are as follows:
- We propose a merging decision-making method that integrates game theory for timing decisions and DRL for behavior decisions. This integration effectively addresses the challenge of making vehicle behavior decisions in the absence of game equilibrium.
- The study delves into the dynamic nature of MDVs’ driving styles, concluding that styles vary by location. A GMM-SVM-based dynamic recognition framework is introduced, adept at handling both the diversity and variability of driving styles across different locations, and effectively simulating MDV behavior.
- Analyzing the preferences of each driving style type for various payoffs, we dynamically estimate the weights for MDVs’ considerations of timeliness, safety, comfort, and economy, allowing for a more nuanced prediction of their cooperation levels.
The rest of this study is organized as follows. Section 2 presents the problem description and overall architecture of this study. Section 3 introduces the design of the merging decision model. Section 4 introduces the driving style dynamic recognition method. Section 5 is the simulation experiment. Finally, Section 6 is the conclusion and outlook.
2. Problem Description and Framework
2.1. Description of the Flexible Merger Problem
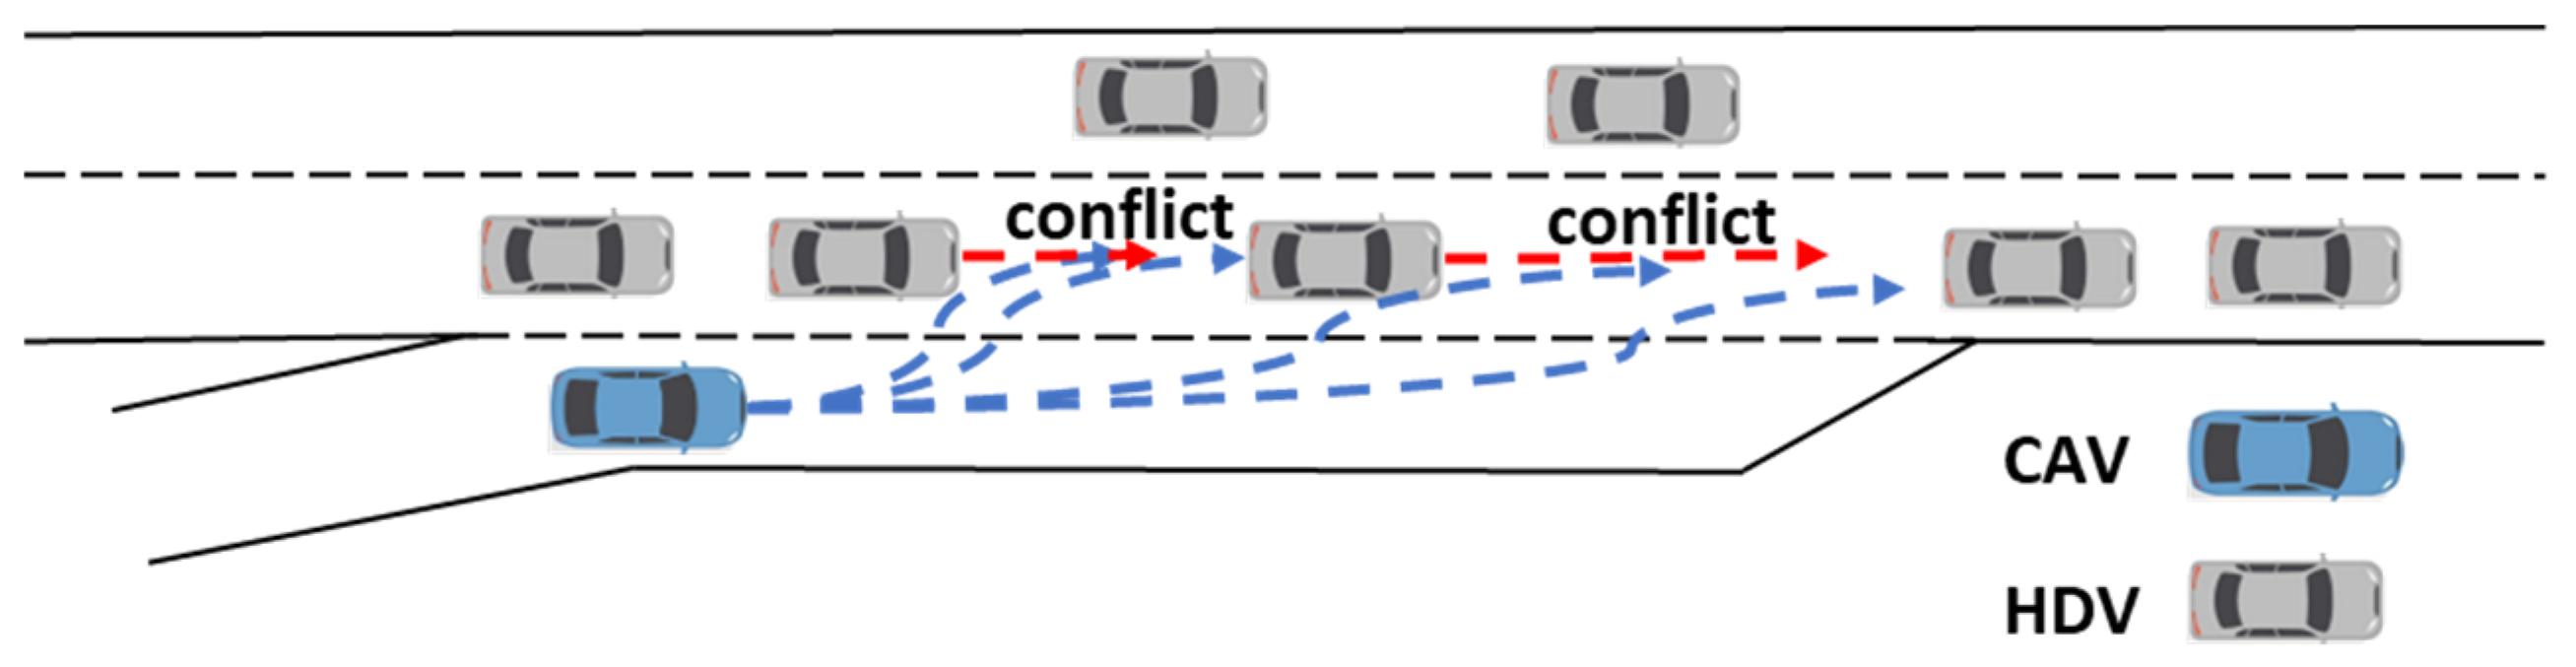
Flexible ramp merging means that the location of the merge is not fixed. The merging vehicle can choose the timing, location, and trajectory of merging according to its own preference in the acceleration lane. As shown in Figure 1, when the main-road traffic is denser, if only relying on the model-based merging determination mechanism, it is difficult for the merging vehicle to find a gap that meets the merging conditions. The dotted bule and red lines are the actions on-ramp vehicles and mainline vehicles may take. This situation requires the main-road vehicle to take cooperative action, which often results in the loss of the interest of the main-road vehicle. Therefore, the difficulty of the problem is related to how to judge the willingness of the main-road traffic to cooperate, as well as modeling the possible actions taken by MDVs. This problem can be modeled as an incomplete information static game due to the conflicts of interest, the simultaneous decision-making, and the unknown benefits and possible actions taken by the MDVs.

Figure 1.
Schematic diagram of flexible merging.
2.2. Method Architecture
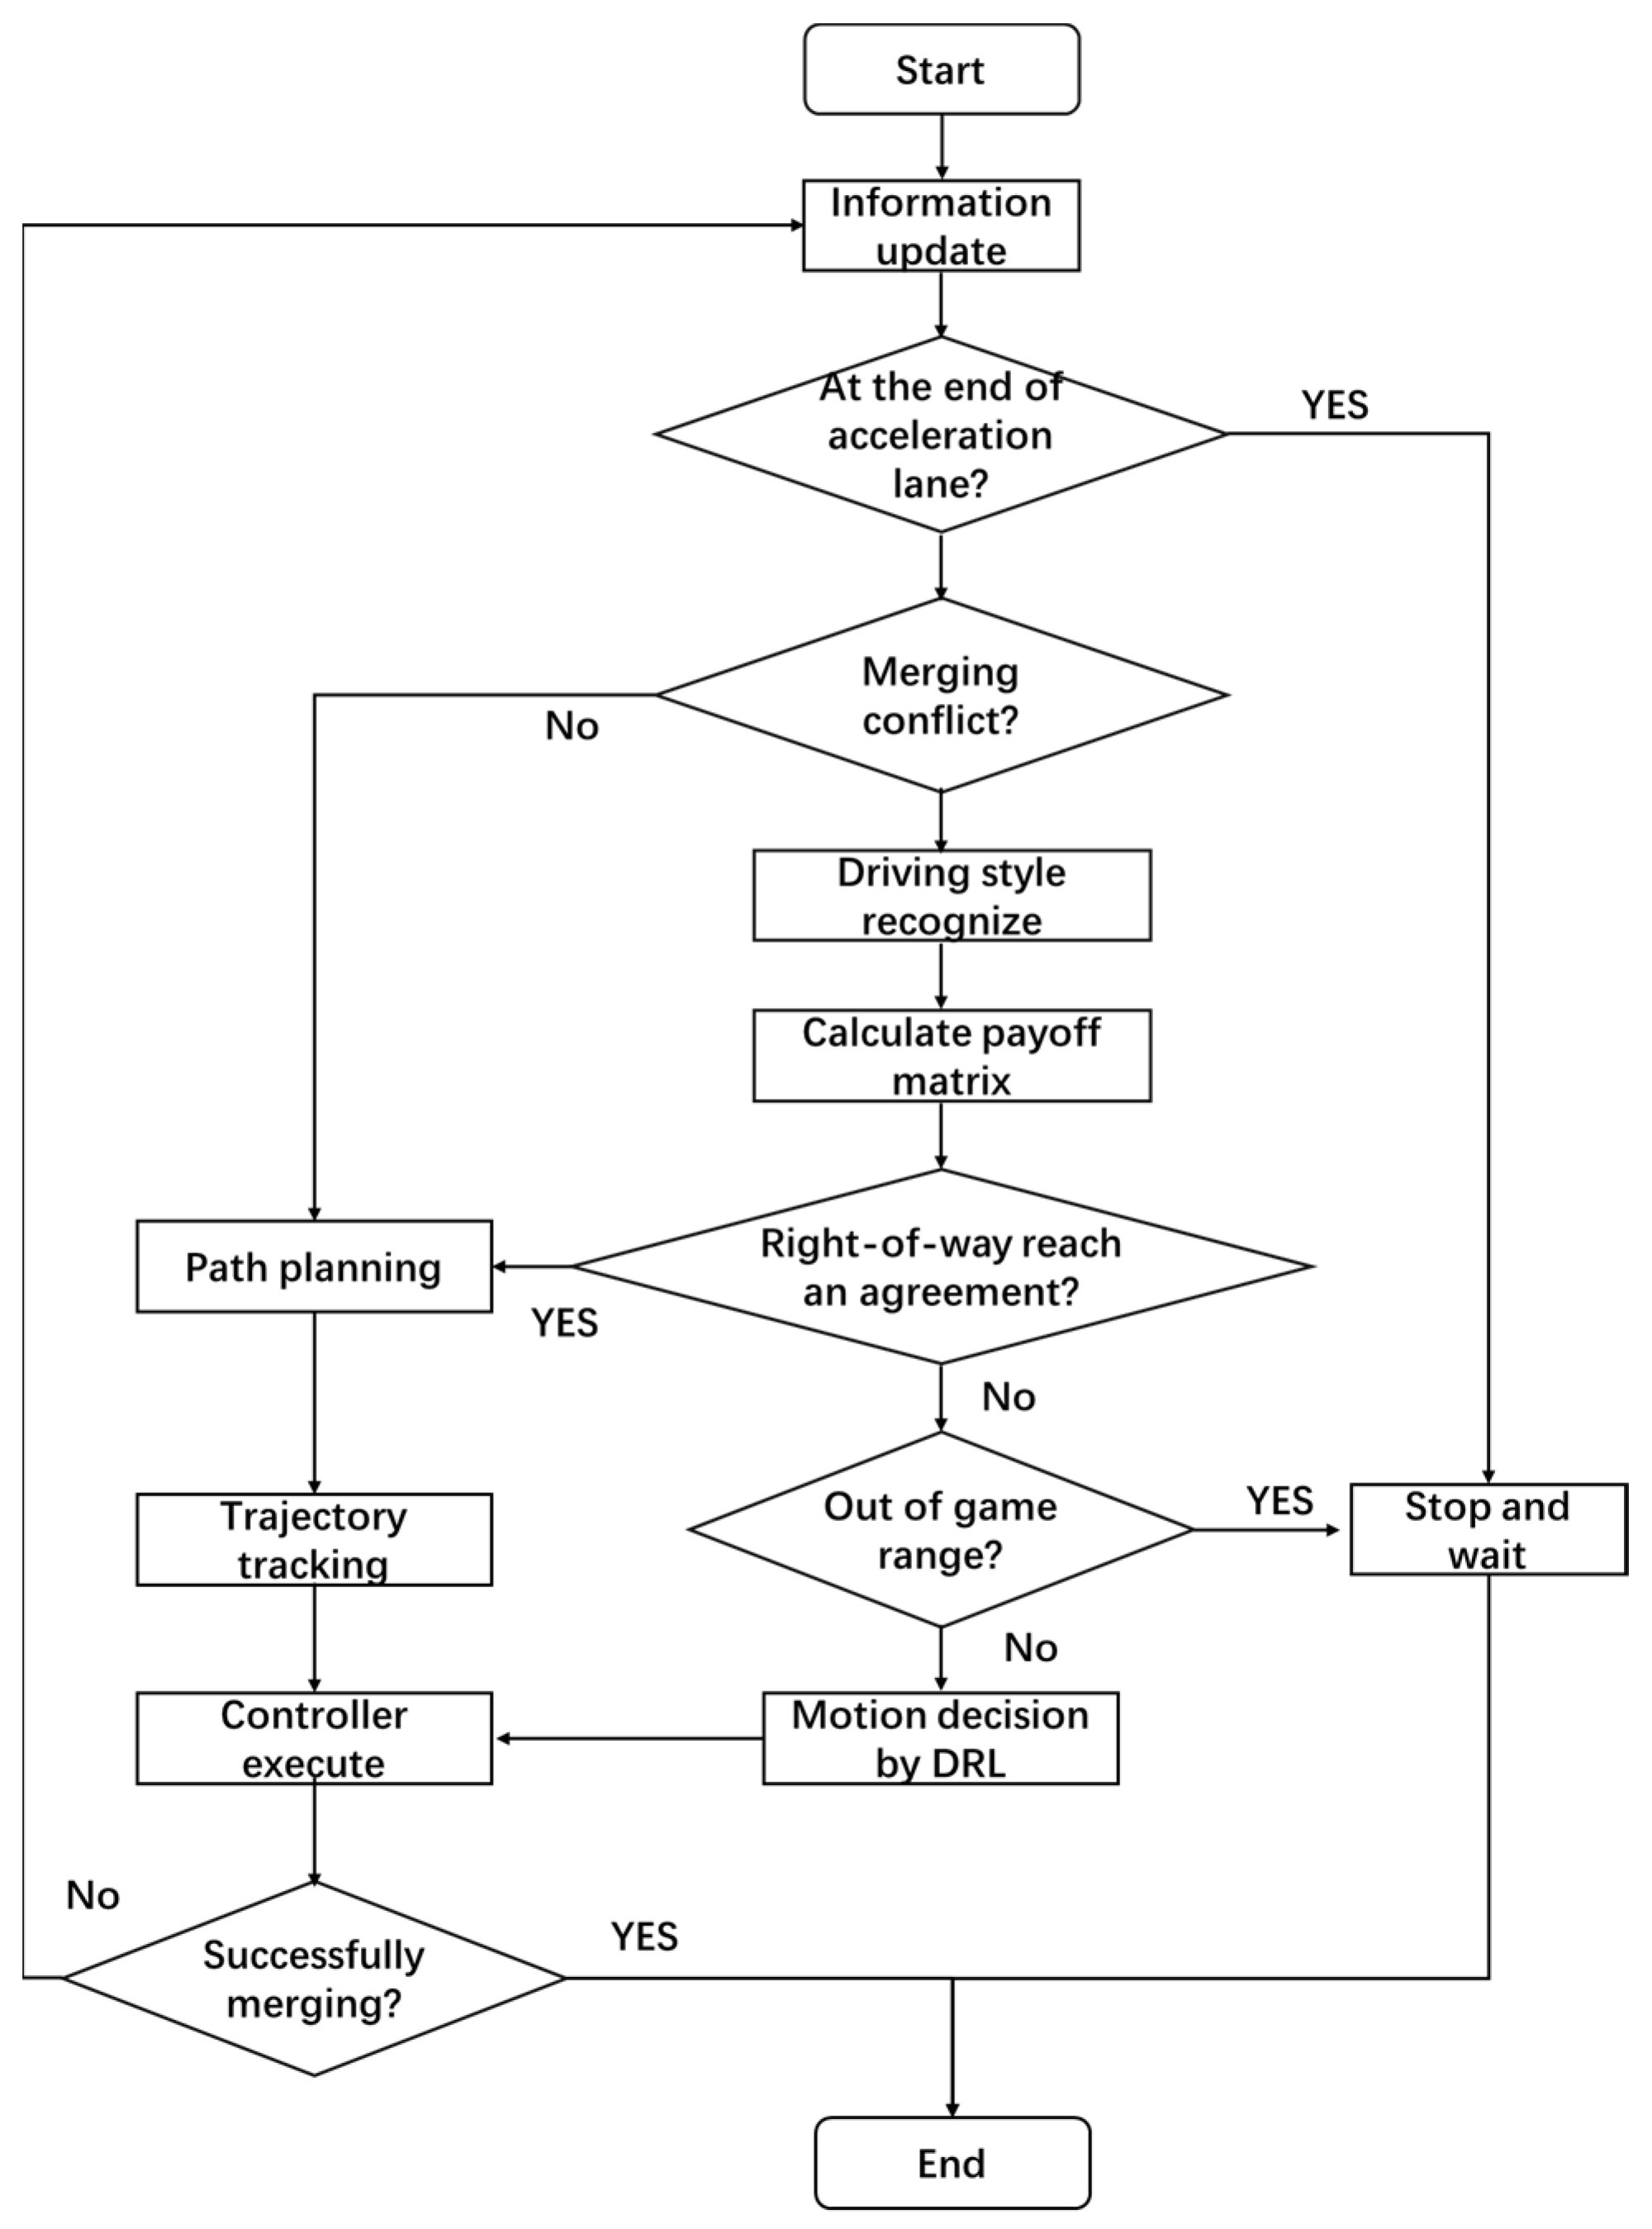
The proposed method is shown in Figure 2. The framework consists of three main parts: a dynamic driving style recognition module, a game-based merging time decision module, and a DRL-based vehicle motion control module. Firstly, CAVs judge whether to reach the end of the acceleration lane (needing to stop and wait). Secondly, the CAVs need to determine whether they meet the conditions for merging. If the conditions are met, CAVs can take merging maneuvers; if they are not met, CAVs need to identify the driving style of main-road MDVs and compute the payoff matrix. Then, if an agreement is reached on the right-of-way assignment, a merging route can be planned; if not, then the DRL-based vehicle motion state control module is invoked to accelerate the acquisition of the game results. If CAVs reach the boundary of the game area and still cannot agree on the priority order, CAVs must give way to the main-road vehicles.

Figure 2.
Flowchart of merging decision-making considering MDVs’ driving style.
3. Flexible Merging Decision Methods
3.1. Incomplete Information Static Game Models
The components of the game are the participants , the set of strategies of the participants, and the payoff , which is represented by the tuple . The merging CAVs and mainline MDVs are the participants, . The strategy sets of MDVs and CAVs are and . and are payoffs of CAVs and MDVs, respectively. The possible game outcomes are shown in Table 1.

Table 1.
Game outcomes.
3.1.1. Quantification of Strategies
Because the strategy is semantic information, this needs to be quantified as the desired speed. But the quantized set of strategies has an infinite number of elements, resulting in an extremely large computation of the returns. The optimal strategy can be found from the set for the game, but the selection of the optimal strategy is also difficult. However, this problem is greatly simplified if it does not consider the merging states and focuses only on the final steady state. If MDVs choose “Allow”, the final steady state is that MDVs follow CAVs. Its desired speed is the CAV’s speed, so strategy is . If MDVs choose “Not Allow”, the final steady state is that MDVs follow the mainline front loader. So, its desired speed is the front loader’s speed , and the strategy is . If CAVs choose “Merge”, steady state is following MDV’s front loader, strategy ; if CAV choose “Not Merge”, the final steady state is that CAVs follow their front loader and for their desired speed to equal the front loader’s speed , and the strategy is . Therefore, steady state is used in this study to quantify the strategy. Then, the intelligent driver model is used to calculate the desired acceleration as shown in Equation (1).
where is the desired acceleration, is the maximum acceleration, is the current speed, is the desired speed, is the acceleration index, is the current distance between the main vehicle and the vehicle in front of it, and is the desired following distance.
3.1.2. Payoff Function
The payoff function decides whether the result of the game is reasonable or not. The payoff function consists of four parts, namely timeliness payoff , safety payoff , comfort payoff , and economics payoff .
- (1)
- Timeliness payoff Rtime
is measured by the difference between the vehicle’s desired speed and its current momentary speed—the greater the difference, the higher the gain. The formula is shown in Equation (2):
where is the maximum speed and is the minimum speed.
- (2)
- Safety payoff Rsafe
During merging, vehicles need to maintain a safe distance from the gaming opponent. Therefore, is measured by the displacement difference between the two vehicles, and the greater the distance, the safer it is. The distance and the minimum distance between two vehicles are shown in Equations (3) and (4), respectively:
where and indicate the distance of CAV and MDV to the end of the acceleration lane, respectively; and are speed functions of CAV and MDV, which are decided by strategy ; is the current decision time; and is the estimated lane-changing time interval.
is equal to
where and are the minimum and maximum safety passing distances.
- (3)
- Comfort payoff Rcomf
The calculation of consists of two parts, , which are the discomfort caused by the change in acceleration and the change in speed, respectively, as shown in Equations (6) and (7):
where is the sample time interval, ; is the acceleration at the last moment; and are maximum and minimum comfort values of the change rate of acceleration; and represents the hyperparameters used to reflect different individual perceptions of comfort.
- (4)
- Economics payoff Reco
The energy consumption change value is used to express the of CAVs. The vehicle’s instantaneous energy consumption function [41] is
where η is the efficiency of the vehicle driveline, is the mass of the vehicle, is the gravity acceleration, is the coefficient of rolling resistance, is the coefficient of air resistance, is the windward area of the vehicle, and is the conversion factor for the rotating mass of the vehicle.
is
In summary, the overall payoff is
where are the weights of , , , and . is the normalization process, mapping between 0 and 1; .
3.1.3. Merging Timing Decision Based on Pure-Strategy Nash Equilibrium
The preceding paragraphs describe the calculation of the expected payoffs of each strategy, considering the safety, timeliness, comfort, and environmental impact of each. The resulting matrix of expected payoffs is presented in Table 2. This study employs the pure-strategy Nash equilibrium as the basis for road allocation. If a strategy combination allows any player to maintain their maximum payoffs while changing the strategies of other players, it is considered a Nash equilibrium. The most widely used equilibria are pure-strategy Nash equilibrium and mixed-strategy Nash equilibrium. Due to space limitations, a detailed description of Nash equilibrium is omitted. However, it is necessary to explain why the mixed-strategy Nash equilibrium is not suitable for this study. This is because the output of mixed-strategy Nash equilibrium is probability. In the practical engineering application related to safety, the output in the form of probability is extremely terrible because even if the probability is small, it may occur (causing accidents). Therefore, the Bool variable of pure-strategy Nash equilibrium output is more suitable for this study. In static games, multiple pure-strategy Nash equilibria may exist or may not exist. This creates ambiguity in determining whether the current MDV driver is willing to cooperate. Consequently, the CAV is unable to determine whether it should insert itself into the main lane. Therefore, when the equilibrium is only “Merge and Allow”, the CAV can take the action of merging, and in this study, a smooth and continuous micro-Sigmoid curve is used to plan the merging trajectory for the CAVs. Alternatively, when the equilibrium is only “Not Merge and Not Allow”, CAVs should give up inserting MDV fronts. In the rest of the cases, CAVs are at a loss for what to do. Therefore, this study introduces the DRL algorithm to guide CAVs to take appropriate actions to achieve equilibrium as soon as possible.
Table 2.
Matrix of game payoffs.
3.2. Motion Decision Based on DRL
Since the game at each moment may not have a pure-strategy Nash equilibrium or multiple equilibria, causing disagreements in the former, this raises the question of what action the vehicle should take at the current moment. The static game can be viewed as a finite-stage Markov decision process and, thus, can be combined with DRL algorithms to model the game. DRL optimizes reactive decision-making through continuous trial-and-error exploration and backtracking on experience. DRL’s elements include observing the state , action space , reward , and decision networks , which can present as a tuple . is the input of and is the output of . The decision network is used to fit the functional relationship from the observed state to the output decision, and the reward is used to correct the decision network parameter .
- (1)
- Observation state
The designed observation state should have completeness, which can completely reflect the traffic state at the current moment. Considering that the front vehicle in the same lane must be avoided, the observation state of the CAV needs to contain the longitudinal position, speed, and acceleration information of the target vehicle, its own vehicle, and the respective front vehicle. Therefore, the observation state is equal to
where are distances to the end of the acceleration lane of each vehicle, speed, and acceleration, respectively, and their subscripts CAV, MDV, Hf, and Cf represent on-ramp CAVs, mainline MDVs, front vehicle MDVs, and front vehicle CAVs.
- (2)
- Action space
The change in driving state is mainly reflected in the change in speed. But, the speed is continuous. Therefore, considering the accuracy and performance of the control as well as the sampling interval, the action space needs to be discretized. Also taking into account the discomfort caused by the speed change, this study also sets constraints on the amount of speed change possible for each step length. The action space is in the range of with an interval of :
- (3)
- Reward function
The reward function plays an important role in DRL for evaluating the effectiveness and safety of the decision and is the only signal to modify the parameters of the decision network. For the problem to be solved in this study, the reward function needs to consider the safety, comfort, timeliness, length of the remaining acceleration lanes, and number of games. The reward takes the form of round rewards:
where is the effectiveness factor, advance car’s , give-way car’s , is the game attenuation coefficient, and is the number of times the game is played. When the minimum distance during convergence is greater than the safe distance, ; otherwise, . is equal to the variance of the speed during merging. is the remaining acceleration lane length bonus component, and and are the remaining acceleration lane lengths at the start and end of the game, respectively.
- (4)
- Decision networks
Since the value learning-based DRL has the advantage of being easy to learn, the Deep Q Network (DQN) algorithm is used in this study as the base algorithm for decision-making. However, the DQN algorithm has a large theoretical error due to the maximum estimation method. Therefore, an improved algorithm of DQN—DDQN with Prioritized Experience Replay (PER)—is used in this study to enhance the effectiveness and efficiency of learning. The improvement of the DDQN method over the traditional DQN method embodies the use of two sets of neural networks with the same structure but different parameters to temporarily freeze the correlation, which in turn reduces the estimation error on the value of the optimal action for future states’ estimation errors [42]. Meanwhile, the literature [43] states that when updating the decision network, the use of experiences with large errors is more helpful for fast learning, i.e., state transfer information with large errors is learnt preferentially. The PER technique works by calculating the error of the state transfer information before updating the parameters of the neural network and giving the experience, with large errors its higher priority. For more details about the DDQN and PER algorithms, please refer to related studies [42,43]. In summary, the decision of DDQN with PER is shown in Equation (15), and the loss function is shown in Equations (16) and (18):
where is the reward decay factor, is the reward agent obtained from the environment, is the minibatch size, is the weight of experience in the minibatch, is the learning rate, and and are parameters of the decision and evaluation networks, respectively.
4. Dynamic Driving Style Recognition Method
Recognizing the inherent variability among drivers, this study categorizes driving styles into three clear groups: aggressive, normal, and conservative. Aggressive drivers are the least cooperative, displaying the most assertive behaviors. Conversely, conservative drivers are the most cooperative. Normal drivers fall in the middle, balancing these two extremes. The study also highlights the cooperation dynamics between merging vehicles and those on the main road. Merging drivers often enter the main road early to prevent being forced to stop, while main-road drivers anticipate and accommodate this behavior.
From this analysis, a dynamic driving style recognition system has been developed. Integrated into a game model, it adjusts the driving preferences of game characters in real time, based on preset parameters and player behaviors. This system allows the game to simulate the diverse driving styles found in real-world scenarios. This innovation not only enriches the gaming experience but also has implications for driver training and advanced driver assistance systems, enhancing the ability to predict and respond to a variety of driving behaviors on the road.
4.1. Data Acquisition
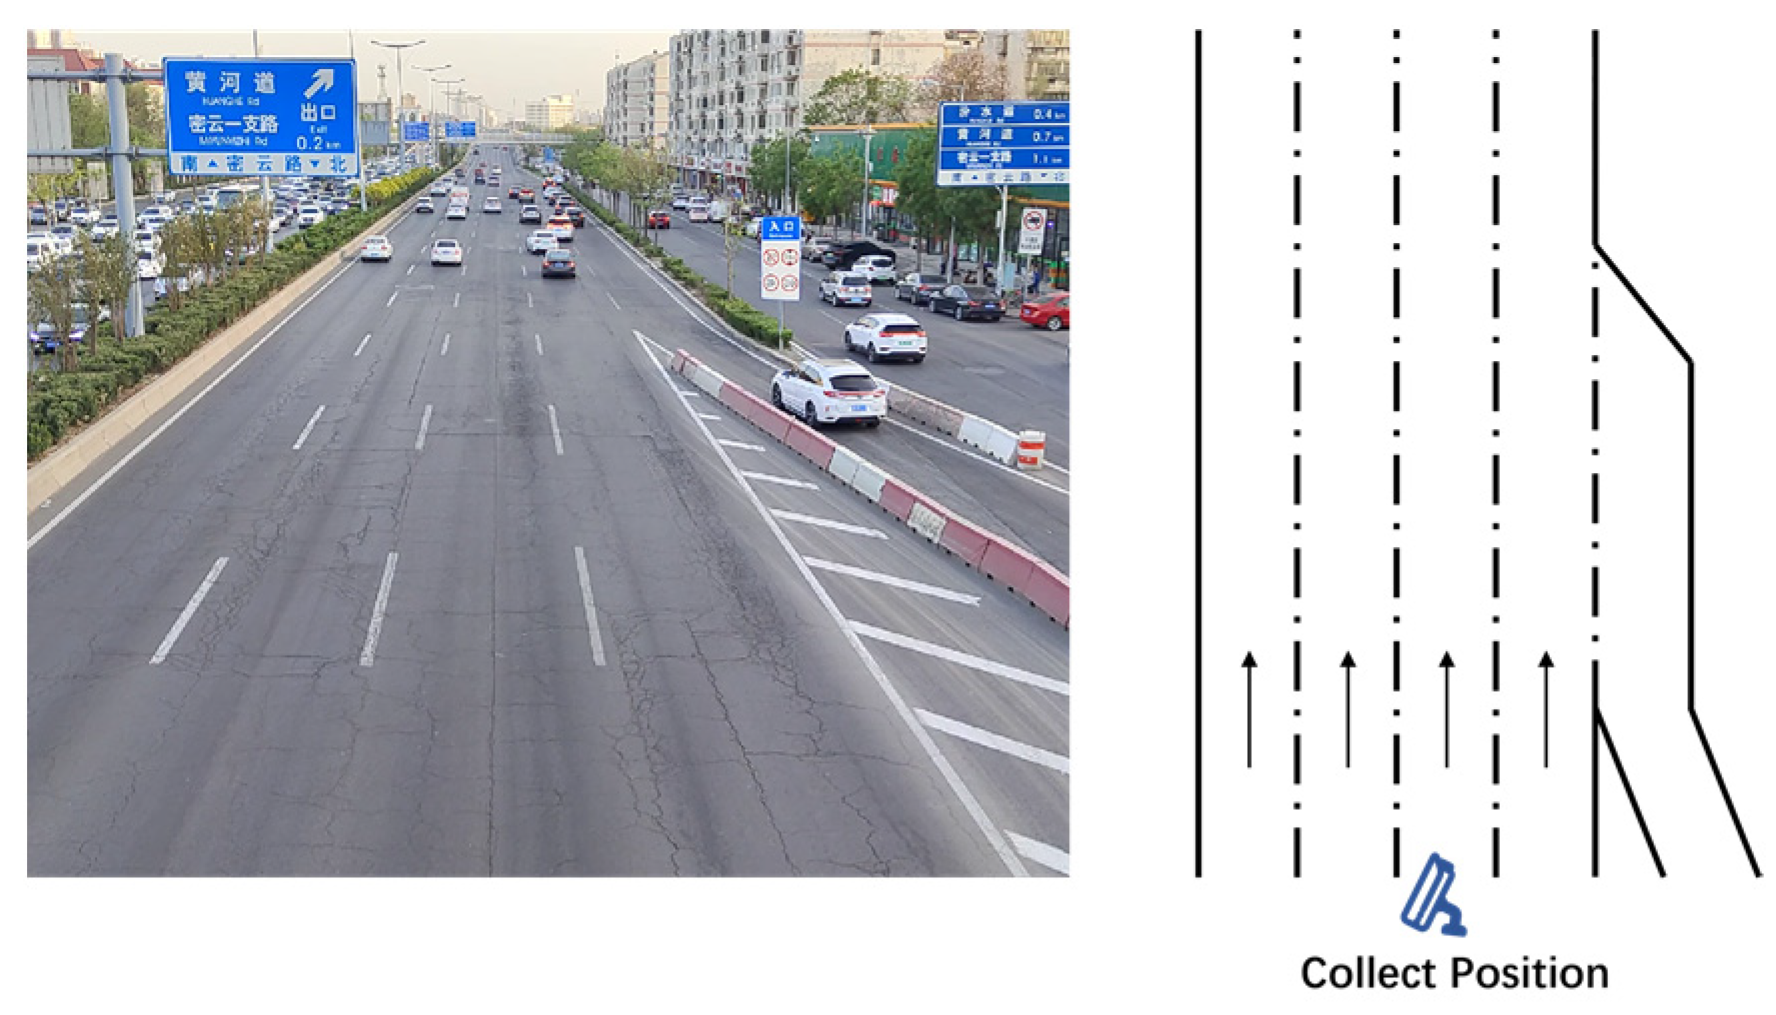
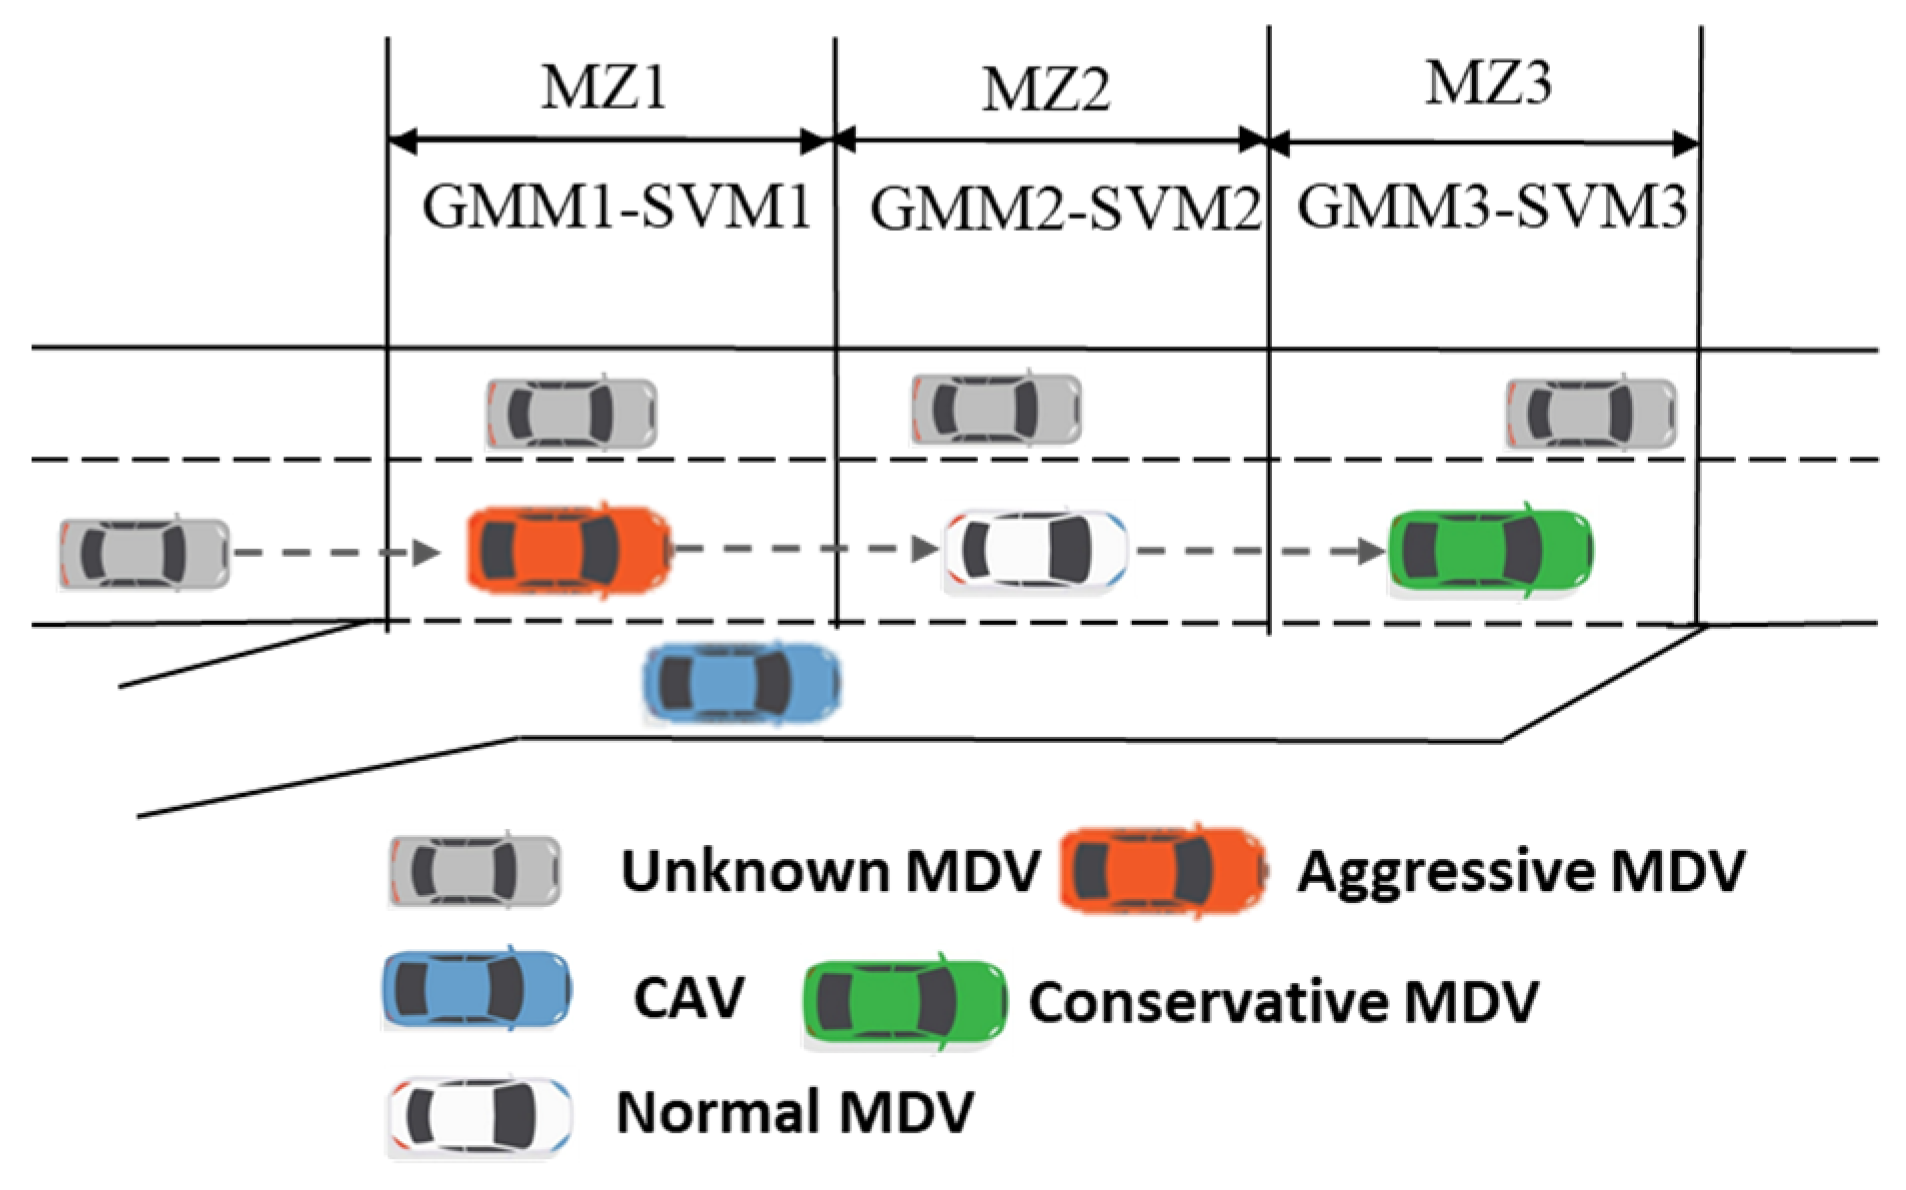
The surveillance video data were collected from the Miyun Road section of the urban freeway in Tianjin, China. Figure 3 illustrates a comprehensive video screenshot of the collected data. Over the course of the evening rush hour, fifteen hours of video data were recorded. The video was processed using George 2.1 [44], a vehicle trajectory calibration software developed by researchers at Nagoya University. Additionally, the trajectories were smoothed using the Kalman filtering algorithm. A total of 1070 sets of coordinated convergence cases were extracted from video data. It was found from the surveillance video that due to the uncoordinated behavior caused by the driving conflict, the average speed of the outermost lane on the main road was less than 40 km/h and congestion happened when on-ramp traffic flow density was near 500 veh/h. Moreover, the wrong estimation of the other intention caused both parties to accelerate or decelerate at the same time. The distribution of vehicles’ merging locations was analyzed, and it was found that there were approximately three centers. The first center was located 15 m into the acceleration lane, the second at the midpoint of the acceleration lane, and the last near the end of the acceleration lane. Furthermore, the proportion of driving styles observed near each center varied. This was evidenced by a lower proportion of aggressive drivers and a greater magnitude of slowing down to yield the right-of-way the closer they were to the end of the acceleration lane. Therefore, this study divides the ones adjacent to the acceleration lane into three segments, as shown in Figure 4.
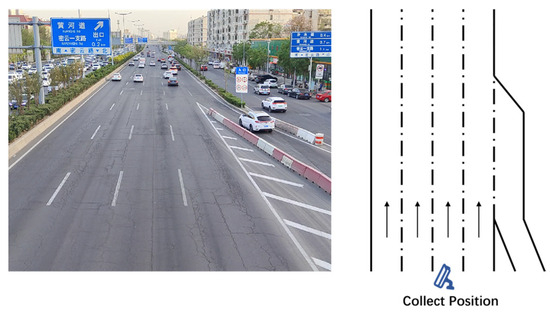
Figure 3.
Video screenshot and data acquisition.
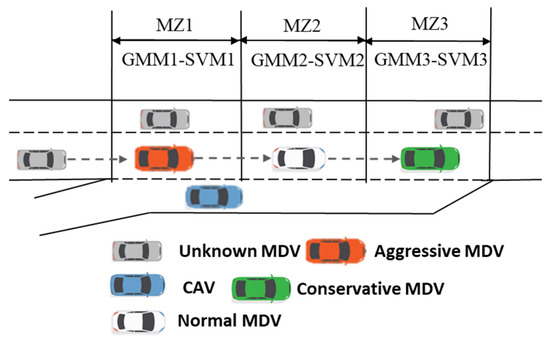
Figure 4.
Distribution of merging locations and diagram of merging zones.
4.2. Driving Style Recognition Based on GMM-SVM
The clustering of driving styles is a common application of cluster analysis, which is performed using both K-means clustering and hierarchical clustering methods. However, the K-means clustering method is only applicable to cases that can be divided linearly. In comparison to other clustering methods, the GMM can handle the shape and size of clusters in a more flexible manner, and assign different weights to each cluster to reflect their relative importance [45]. In addition, the GMM expresses the likelihood of a data point belonging to a specific cluster in probabilistic form, thereby allowing for more flexible assumptions within the model. Furthermore, after fitting the trajectory data using the Gaussian mixture clustering model, the acceleration distribution of drivers belonging to each category of driving style during driving can be output. This allows for the simulation of limited rational behavioral decisions made by human drivers, which is a key advantage of the Gaussian mixture clustering approach.
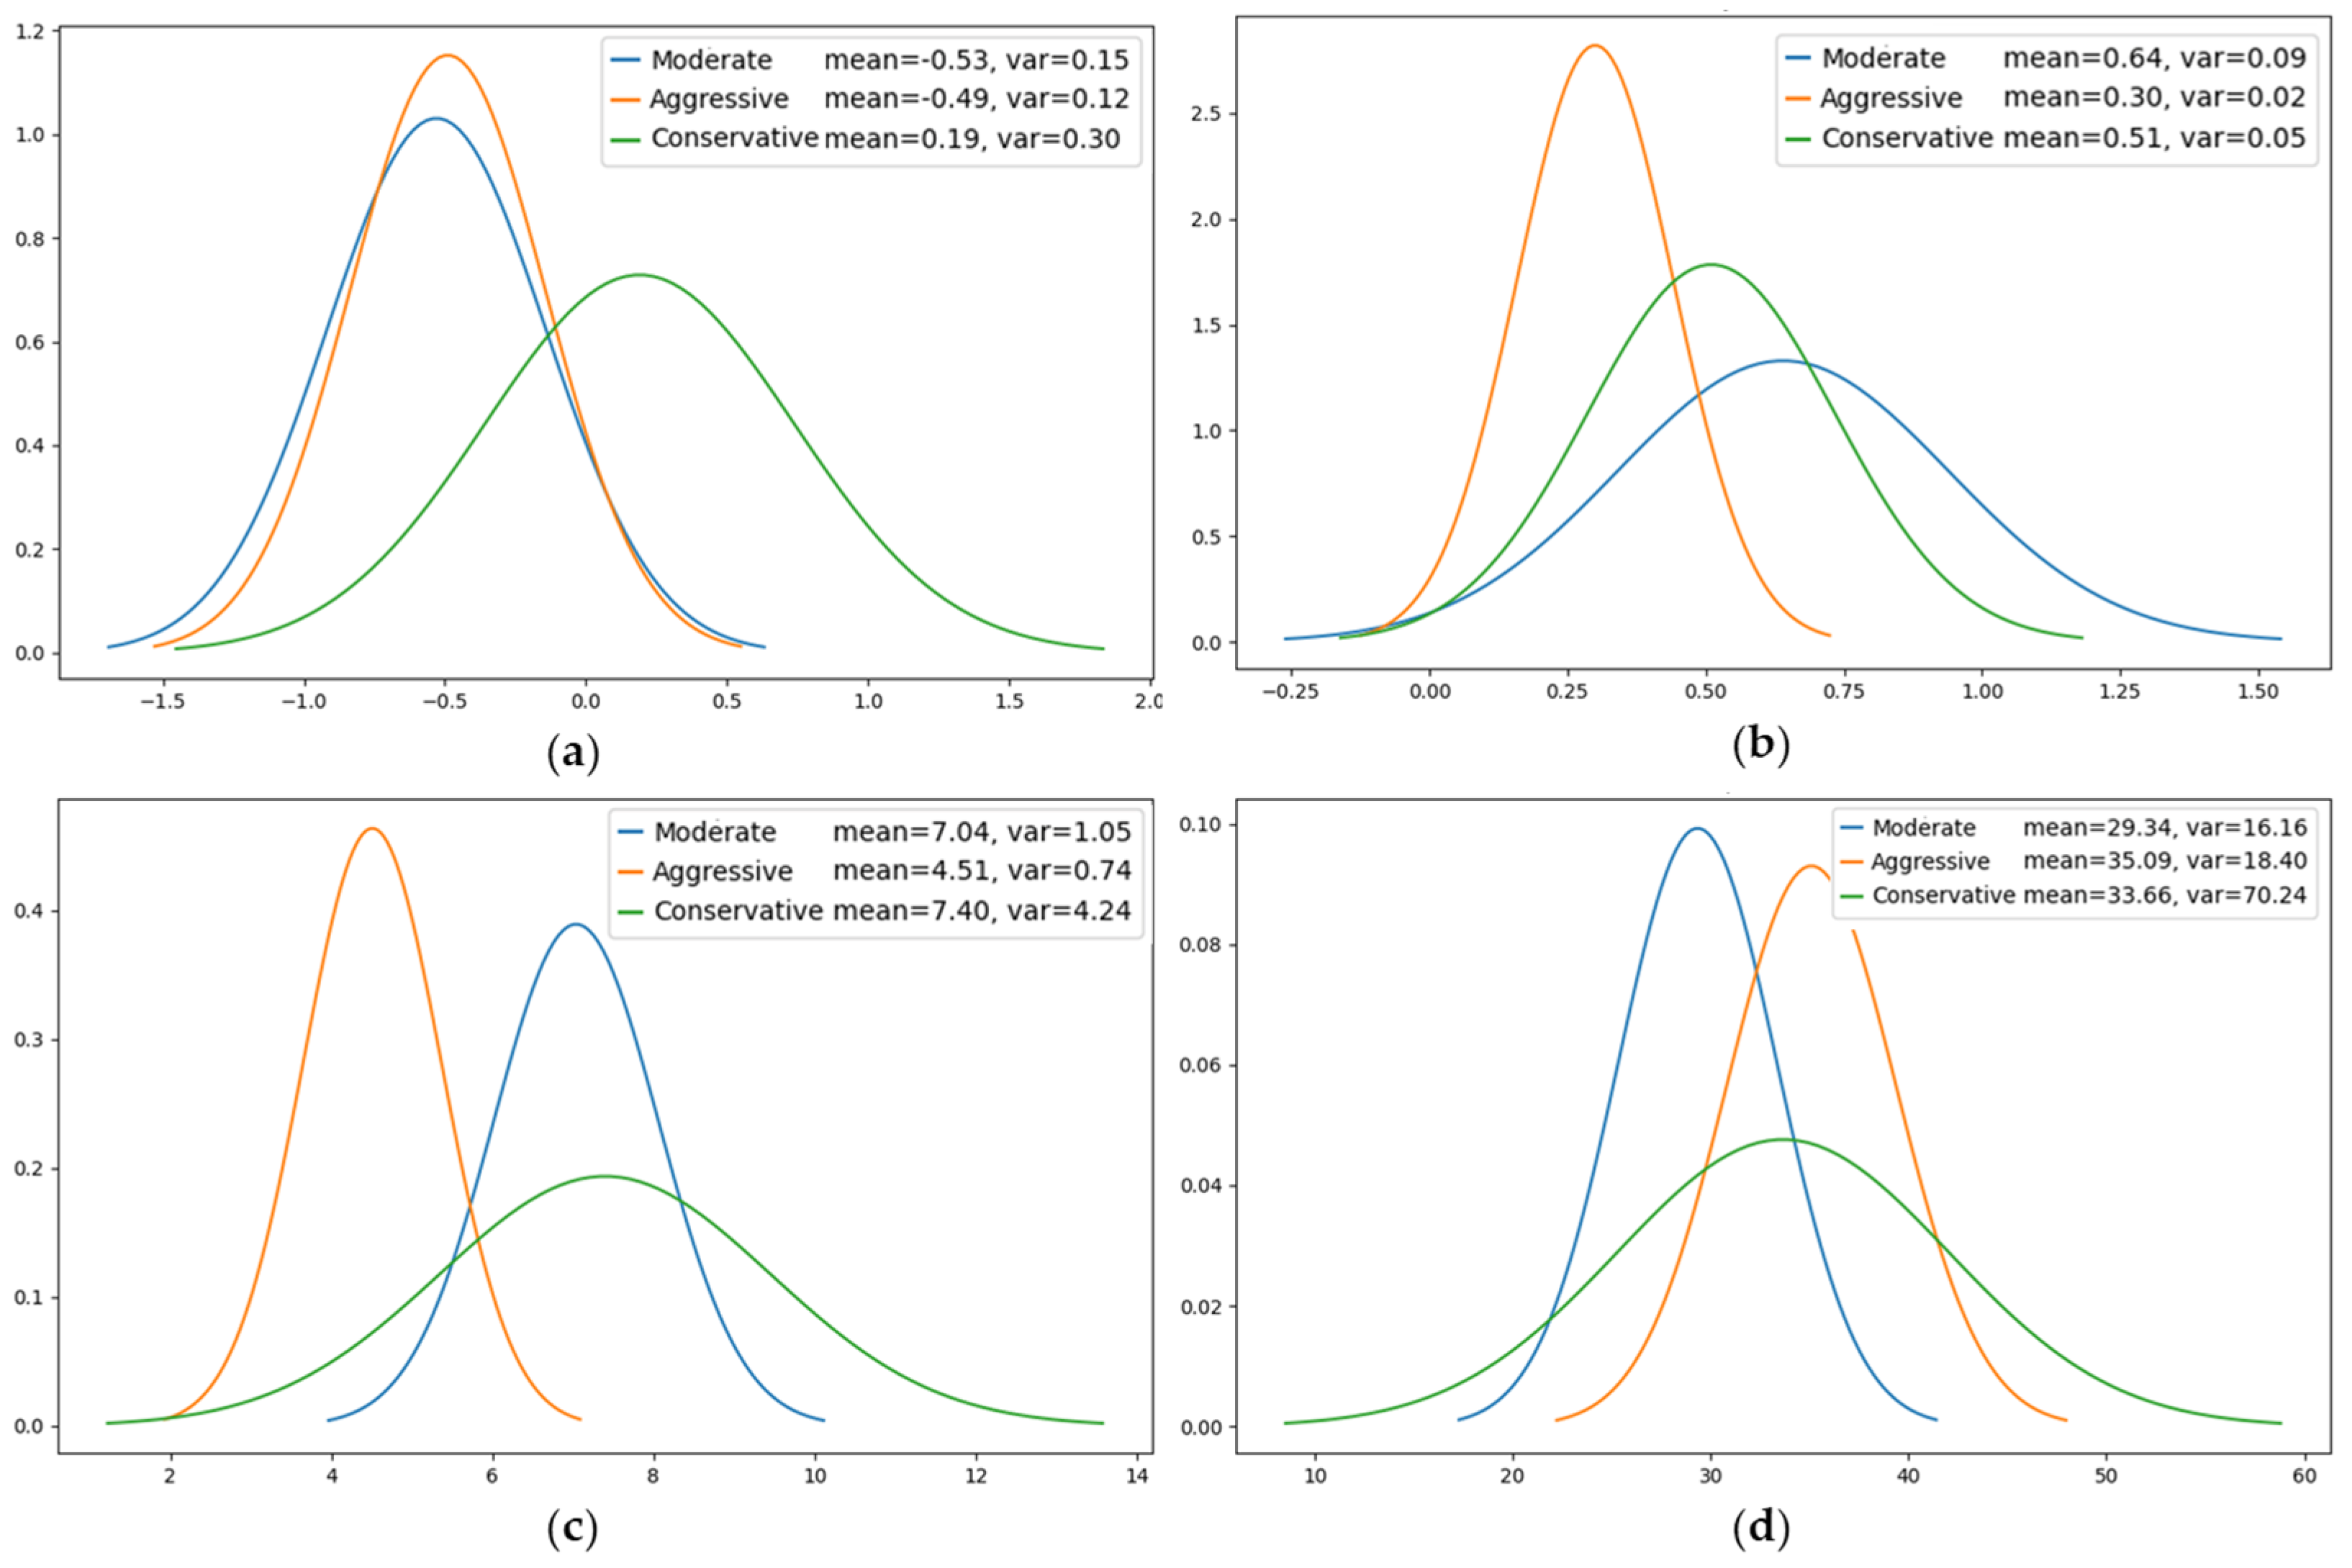
Due to the spatial–temporal inconsistency of driving styles, this study clusters driving styles for each of the three zones. For clustering analysis, feature vectors were extracted from the game scenarios of selected road sections, including the minimum distance between vehicle pairs, the average value of speed, the variance in speed, the average value of acceleration, and the maximum value of jerk. The driving styles are clustered into three categories: the driving style that defines a small following distance and sharp speed fluctuation is aggressive; the one that defines the maximum following distance is conservative; and the rest are moderate. The second merging zone (MZ2) provides an illustrative example. Figure 5 depicts the distribution curves of the characteristic parameters of the three types of driving styles. The blue, orange, and green curves represent the distribution of the parameters of normal drivers, aggressive drivers, and conservative drivers, respectively. It is evident that there are notable discrepancies in the way drivers operate their vehicles, contingent upon their individual driving styles.
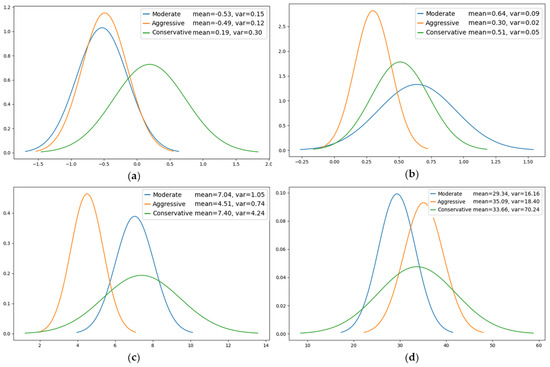
Figure 5.
Distribution curves of characteristic parameters of the three types of driving styles in MZ2. (a) Acceleration distribution. (b) Mean Jerk distribution. (c) Minimum distance distribution. (d) Mean speed distribution.
The original data, augmented with driving style categories, may be employed as labeled data to train the driving style recognition model. In this section, the Support Vector Machine (SVM) model is selected as the driving style recognition model for training. The SVM is a binary classification model, and its fundamental principle is to identify a separating hyperplane that can accurately differentiate the training dataset and has the largest geometric interval [46]. There are an infinite number of such hyperplanes for datasets that can be linearly divided (i.e., perceptual machines), but the separating hyperplane with the largest geometric interval is unique. The key idea of SVM is to find an optimal hyperplane in high-dimensional space to separate different classes of data points. This is achieved by finding the closest data points, i.e., support vectors, and maximizing their distance (interval) to the hyperplane. Due to the constraints of the length of the article and the prevalence of GMM and SVM as clustering and classification algorithms, the principles, and designs of GMM and SVM will not be elucidated in exhaustive detail.
The experimental results of Gaussian mixture clustering are used to calculate clustering centers for each class of driving style, including average speed center , variance in the speed center , average acceleration center , maximum value of jerk , and minimum distance center . This is in order to prevent overfitting such that the trained model performs too well in the training dataset but performs poorly in unknown cases. Therefore, the dataset is divided into a training set and a test set, with a ratio of 7:3, of which 70% of the data are used for training the model, and 30% of the data are used for validation. There are 1070 groups of data in total. Although the amount of data is not very large, the purpose of this study is to provide solutions for future practical applications. Because the driving style recognition module can be deployed in the roadside unit, it can obtain a large amount of data. And, it can adapt to the different style distribution of different sections and constantly update offline. SVMs are constructed for different locations for training purposes, with SVM1, SVM2, and SVM3 being the corresponding models. The last 3 s of data of the game object’s trajectories are selected as the input data for identifying driving style. The pre-trained SVM models are called according to the location of the main-road game object for driving style recognition. Table 3 presents a summary of the clustering centers and SVM recognition accuracies for the different driving style metrics in each region. While the SVM recognition accuracy is not particularly high, it is above 90%, which is a consequence of the changes in driving styles at the intersection of two adjacent regions.
Table 3.
Clustering centers and recognition accuracy of different driving styles.
4.3. Calibration of Payoff Weights
The identification of driving styles is not a critical factor; however, it is of greater importance to determine how the variability in driving styles of the main-road MDVs is reflected in the weighting of the payoff functions. The importance that MDVs place on safety is reflected in the minimum distance, while comfort is reflected in the variance in the jerk as well as the speed, and the acceleration parameter reflects the importance that the main-road vehicles place on the timeliness of the gains. The economy payoff is a function of the correlation with the mean speed and acceleration. Therefore, the distance of the parameters from the clustering center is used as the weight of the gain function. As an example, the weights of safety gains for aggressive drivers are calculated as follows:
The remaining three payoff weights are calculated in the same way, and their gain function weights are obtained. The weights of the four gains are then normalized for each volume of car. Table 4 shows the results of the accuracy of dynamic driving styles and the weights of the four gains for different driving styles. The results are only for the collected dataset and only give a simple and convenient implementation from theory. However, in practice, this work should be carried out by the roadside unit, which is able to dynamically adjust the weights according to different traffic flows, different visibility, different numbers of zones, and different car types.
Table 4.
Dynamic driving style weight settings.
5. Simulation Experiments
5.1. DRL Model Training
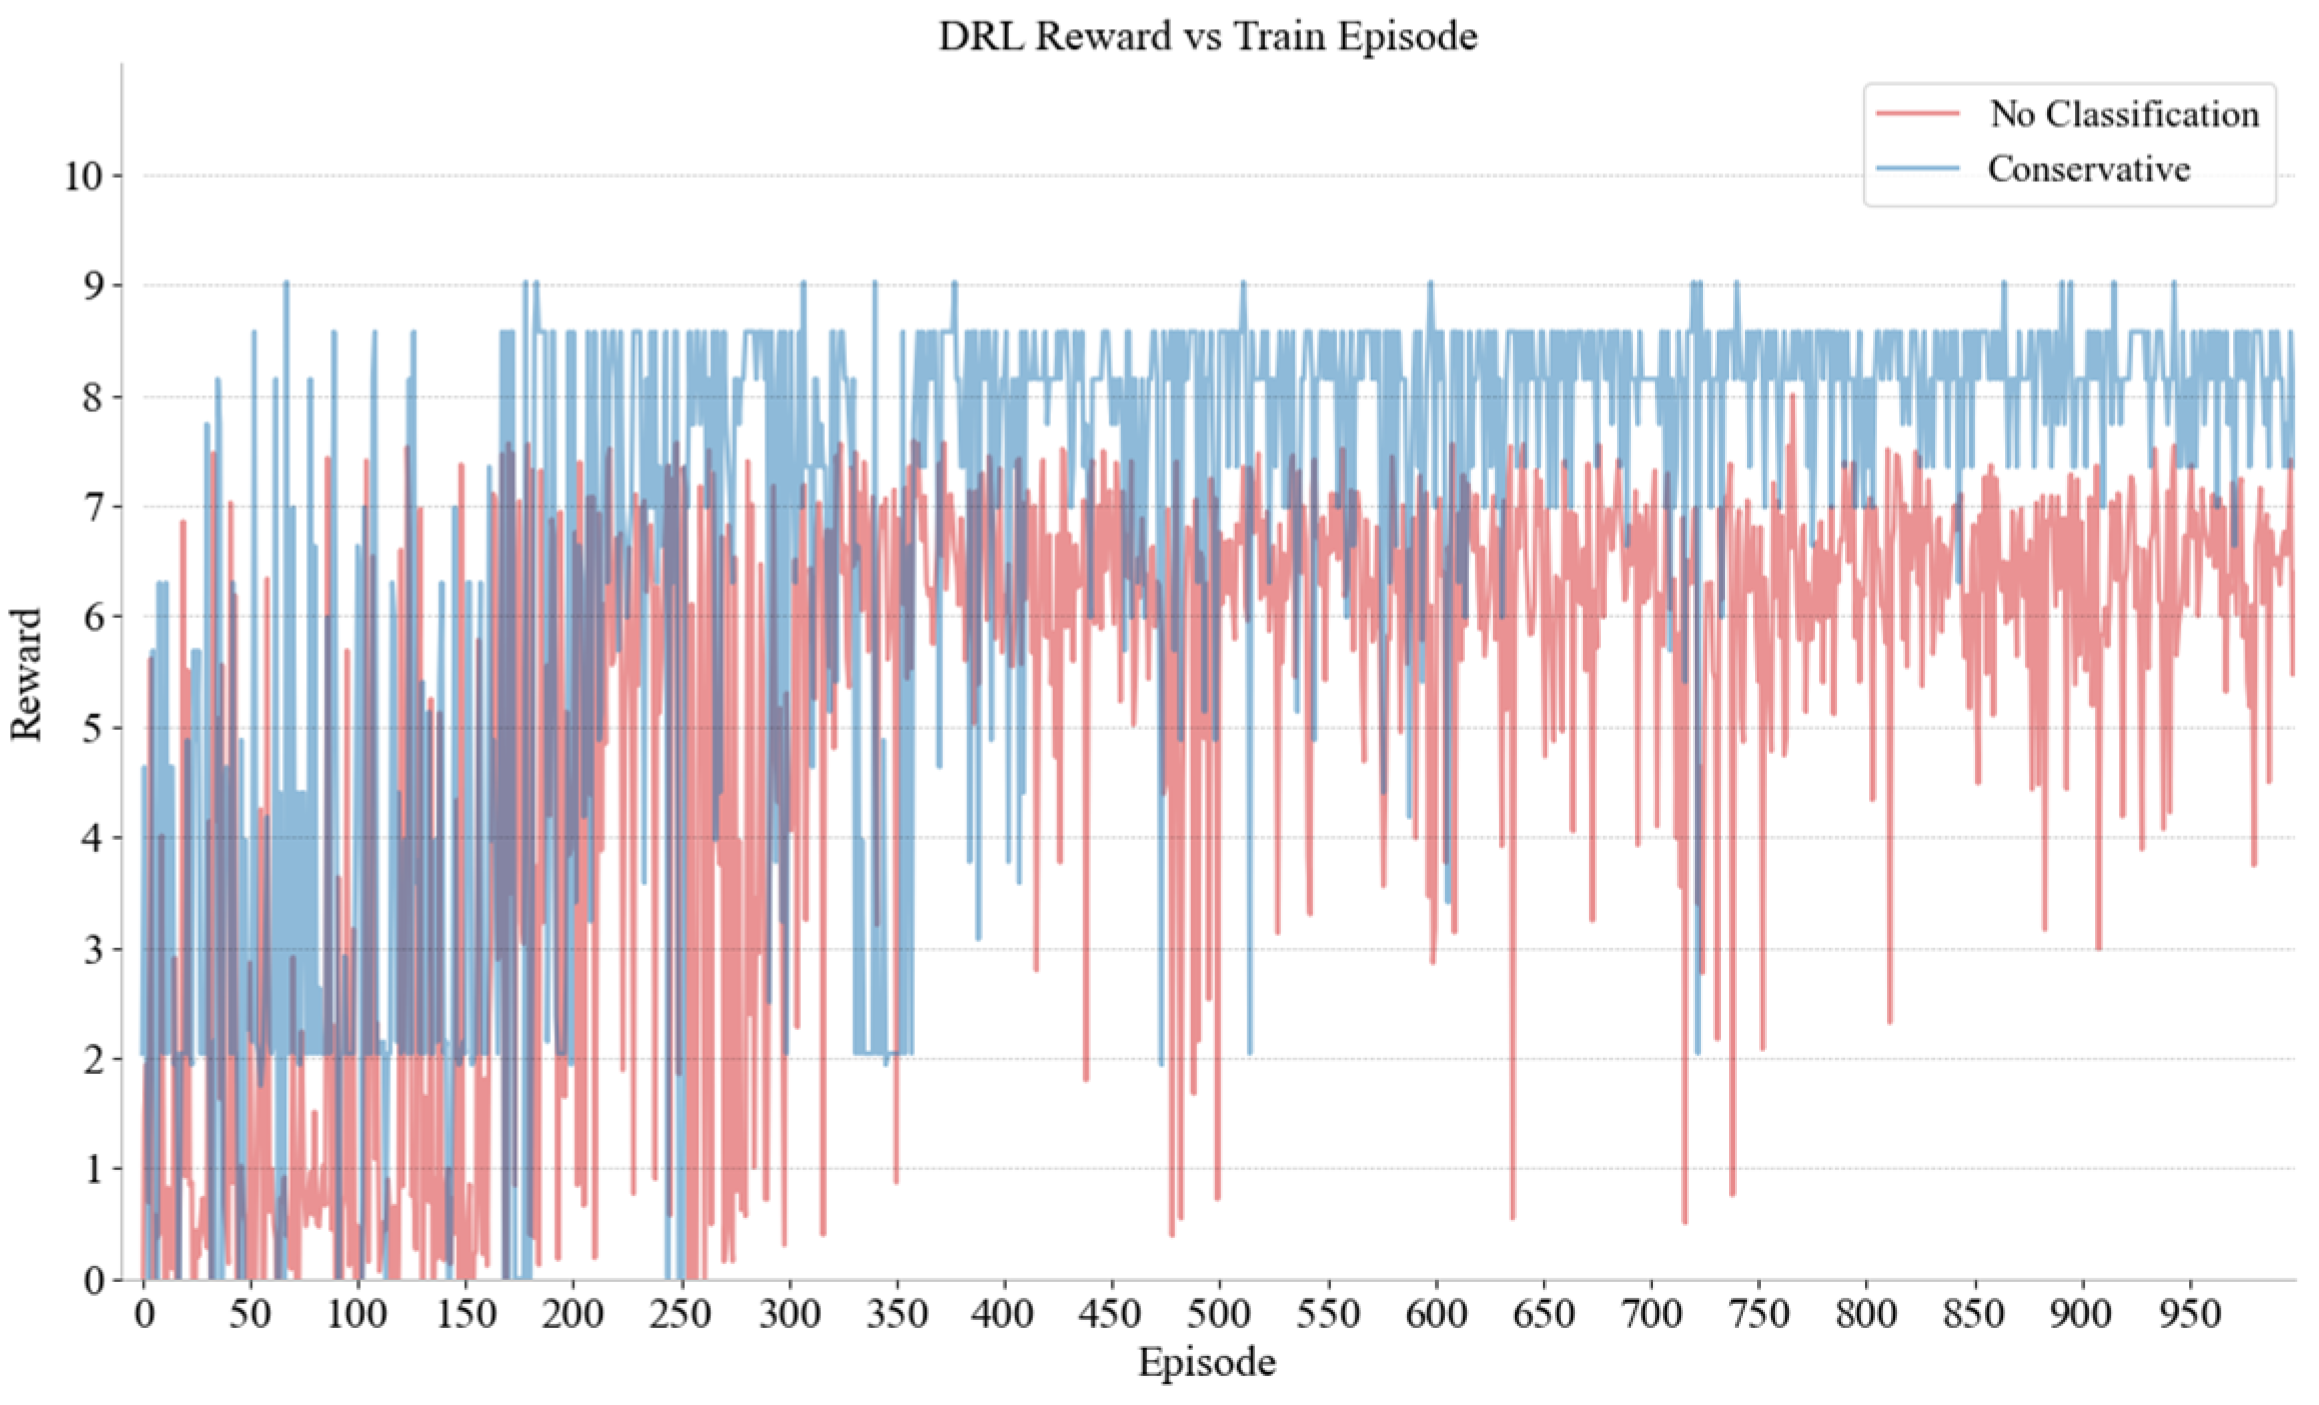
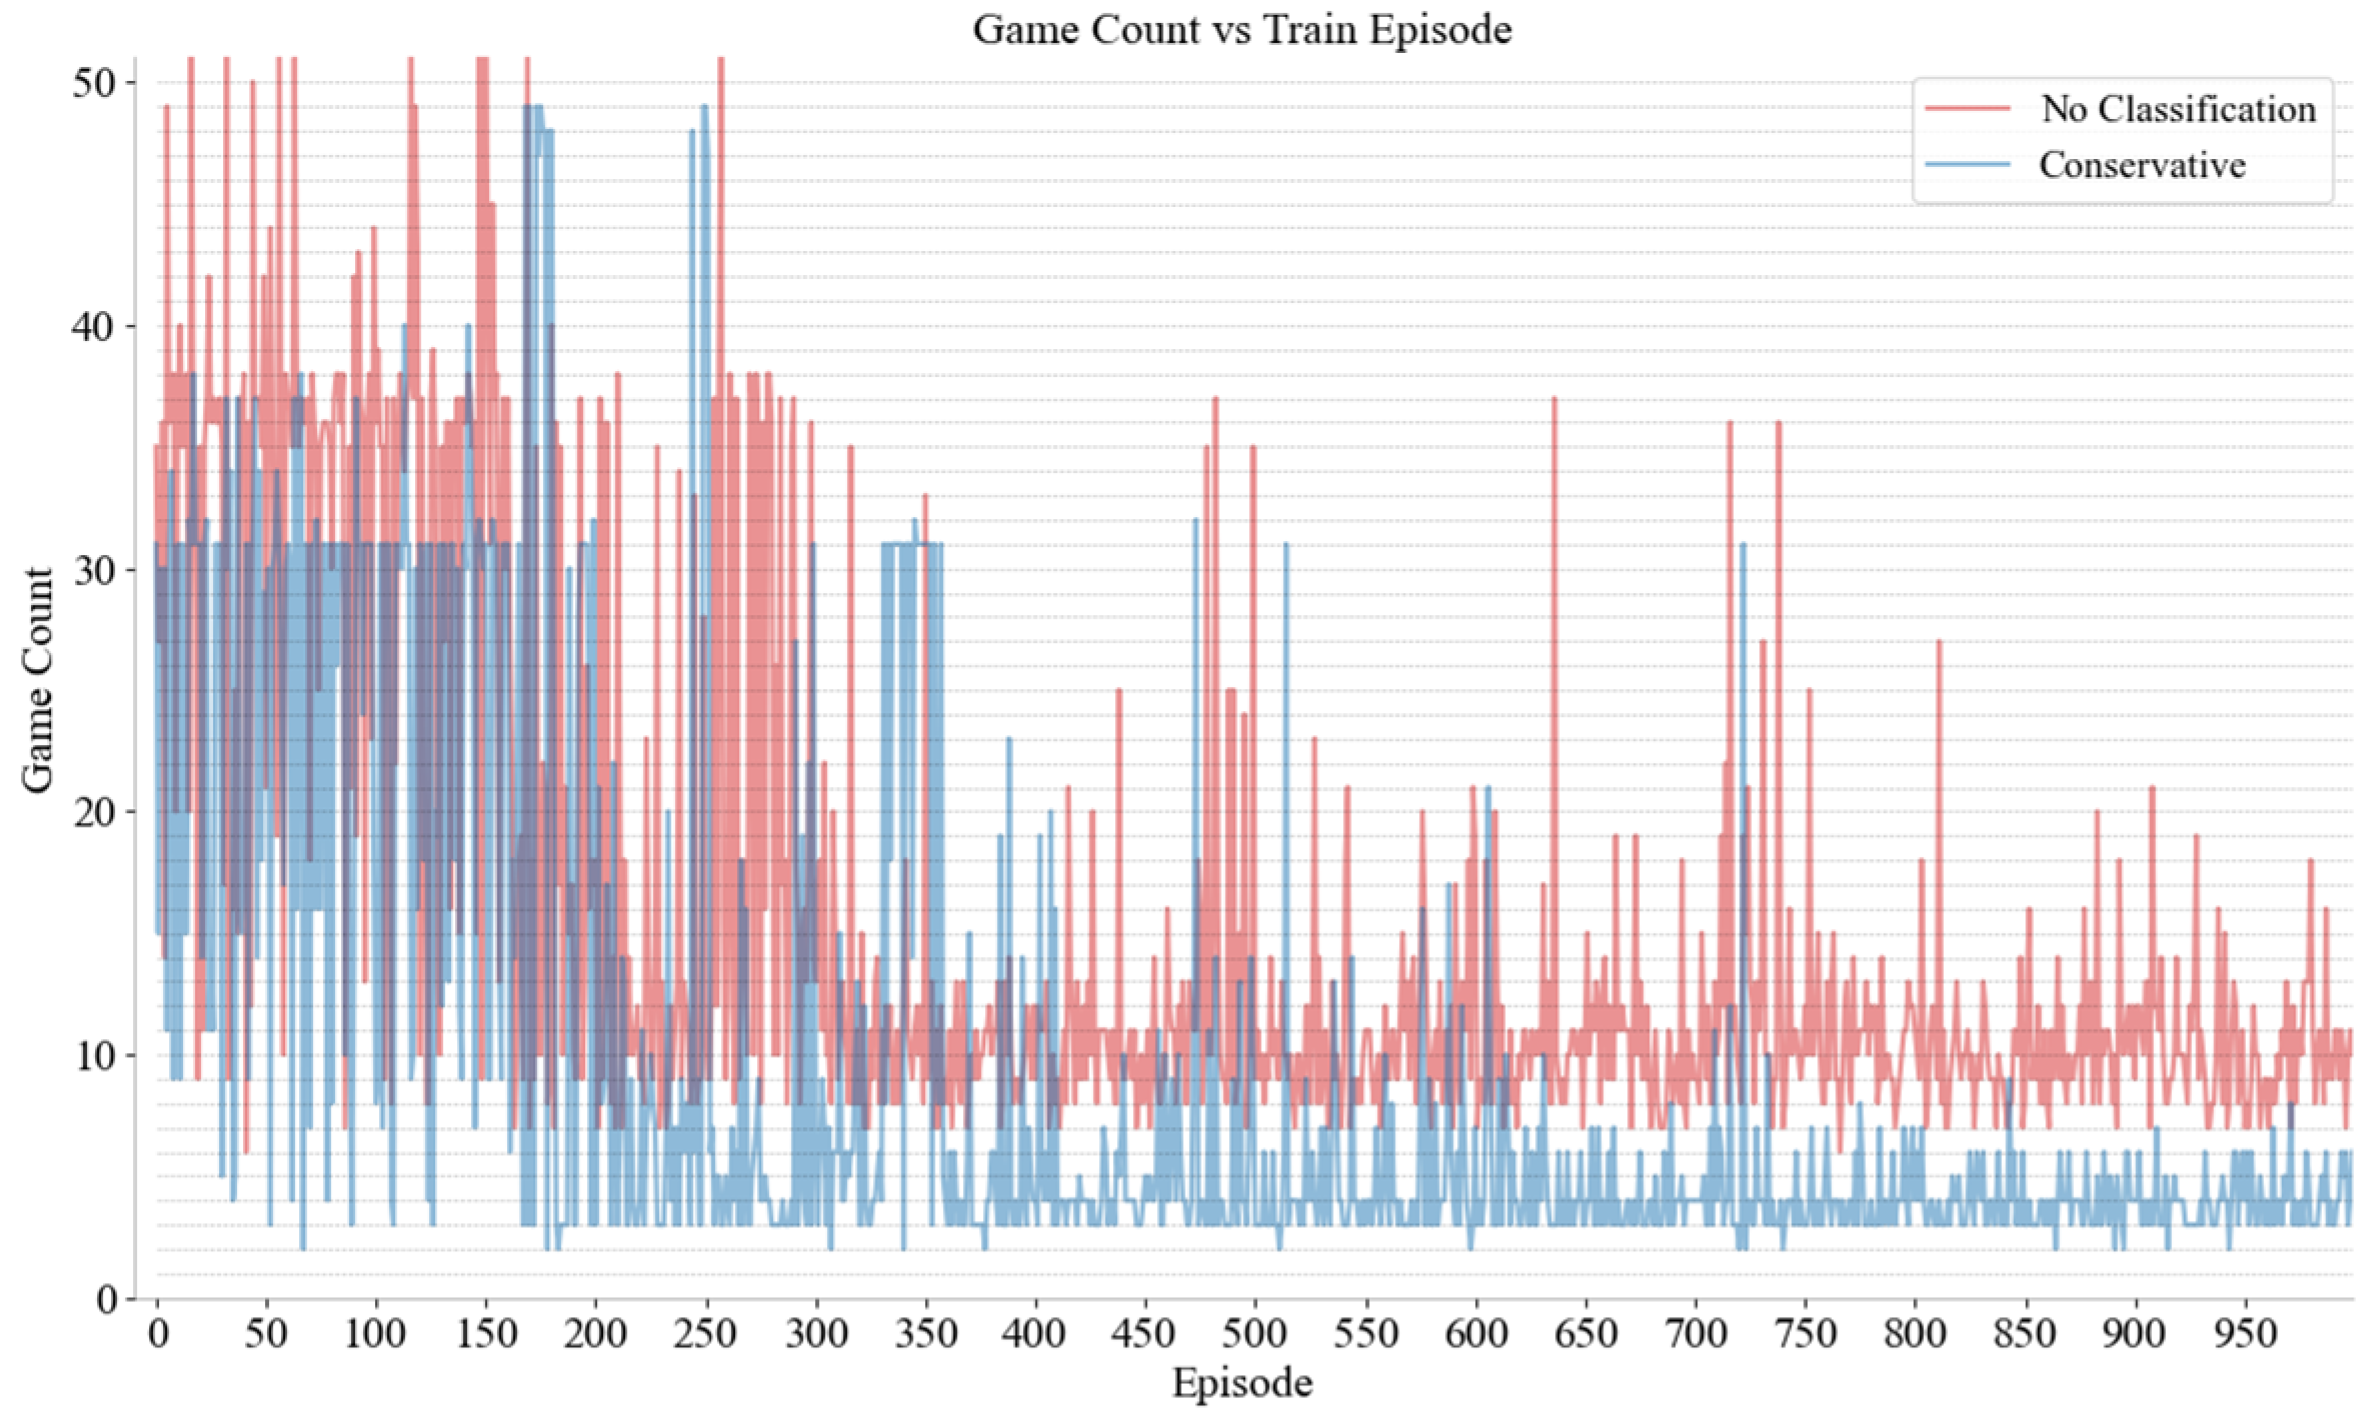
The SUMO simulation software (V 1.8.0) was utilized as the experimental platform and the neural network was constructed using Pytorch. The network comprises five layers. The first is an input layer with 128 nodes that employs the Leaky Relu activation function. The subsequent three hidden layers are structured as follows: the first hidden layer contains 64 nodes, the second contains 32 nodes, and the third contains 16 nodes. Finally, the output layer, which has 13 nodes (equal to the size of the action space of DRL), employs the Softmax activation function. The Adam optimizer was employed with a learning rate of 0.005 and a reward decay coefficient equal to 0.97. The training involved the adoption of a greedy strategy. In addition, the feedforward neural network is used in this study. Except that the number of neurons in the output layer should be equal to the size of the action space, the rest are superparameters including the network structure, which is determined by experience. Since the learning methods are not interpretable, this study evaluates the parameter settings from the perspective of results. Future research can adjust the parameters according to its needs to obtain better performance. Nine distinct decision networks were constructed for the purpose of gaming with MDVs at various positions and different driving styles. Figure 6 and Figure 7, respectively, show the rewards and game rounds of CAVs and conservative MDVs in region 2; curves of different colors show the improvement brought by distinguishing driving styles. If different driving styles are not considered as the same driver, the model must deal with the several styles. However, training multiple models for different styles can effectively solve this problem. Because different drivers react differently, the DRL model is difficult to converge. The game results between CAVs and both aggressive and moderate MDVs in other regions are comparable to those presented cases. Through the results, it can be clearly seen that the rewards obtained by the CAVs through the training of reinforcement learning when merging different driving styles have been significantly enhanced and stabilized. Concurrently, the number of gaming sessions has been significantly reduced, thereby shortening the duration of the stalemate.

Figure 6.
The rewards of gaming CAVs with conservative MDVs and unclassified MDVs.

Figure 7.
The rounds of gaming with conservative MDVs and unclassified MDVs.
5.2. Micro Case Study
This case compares the control effects of a no-control, a pure game, and a reinforcement learning game condition. The scenario comprises a total of six vehicles. The initial state design of the simulation and the vehicle number names are presented in Table 5. In the simulations, the MDV is modeled using the IDM car-following model prior to the game, and the output of each round during the game is determined by the acceleration distribution of different driving styles in the GMM. The MDV’s driving style is moderate. In addition, the conflict determination mechanism for the experiment was that the distance between the CAV in the acceleration lane and its MDV behind the left lane was less than 15 m.
Table 5.
Vehicle parameters for simulation scenarios.
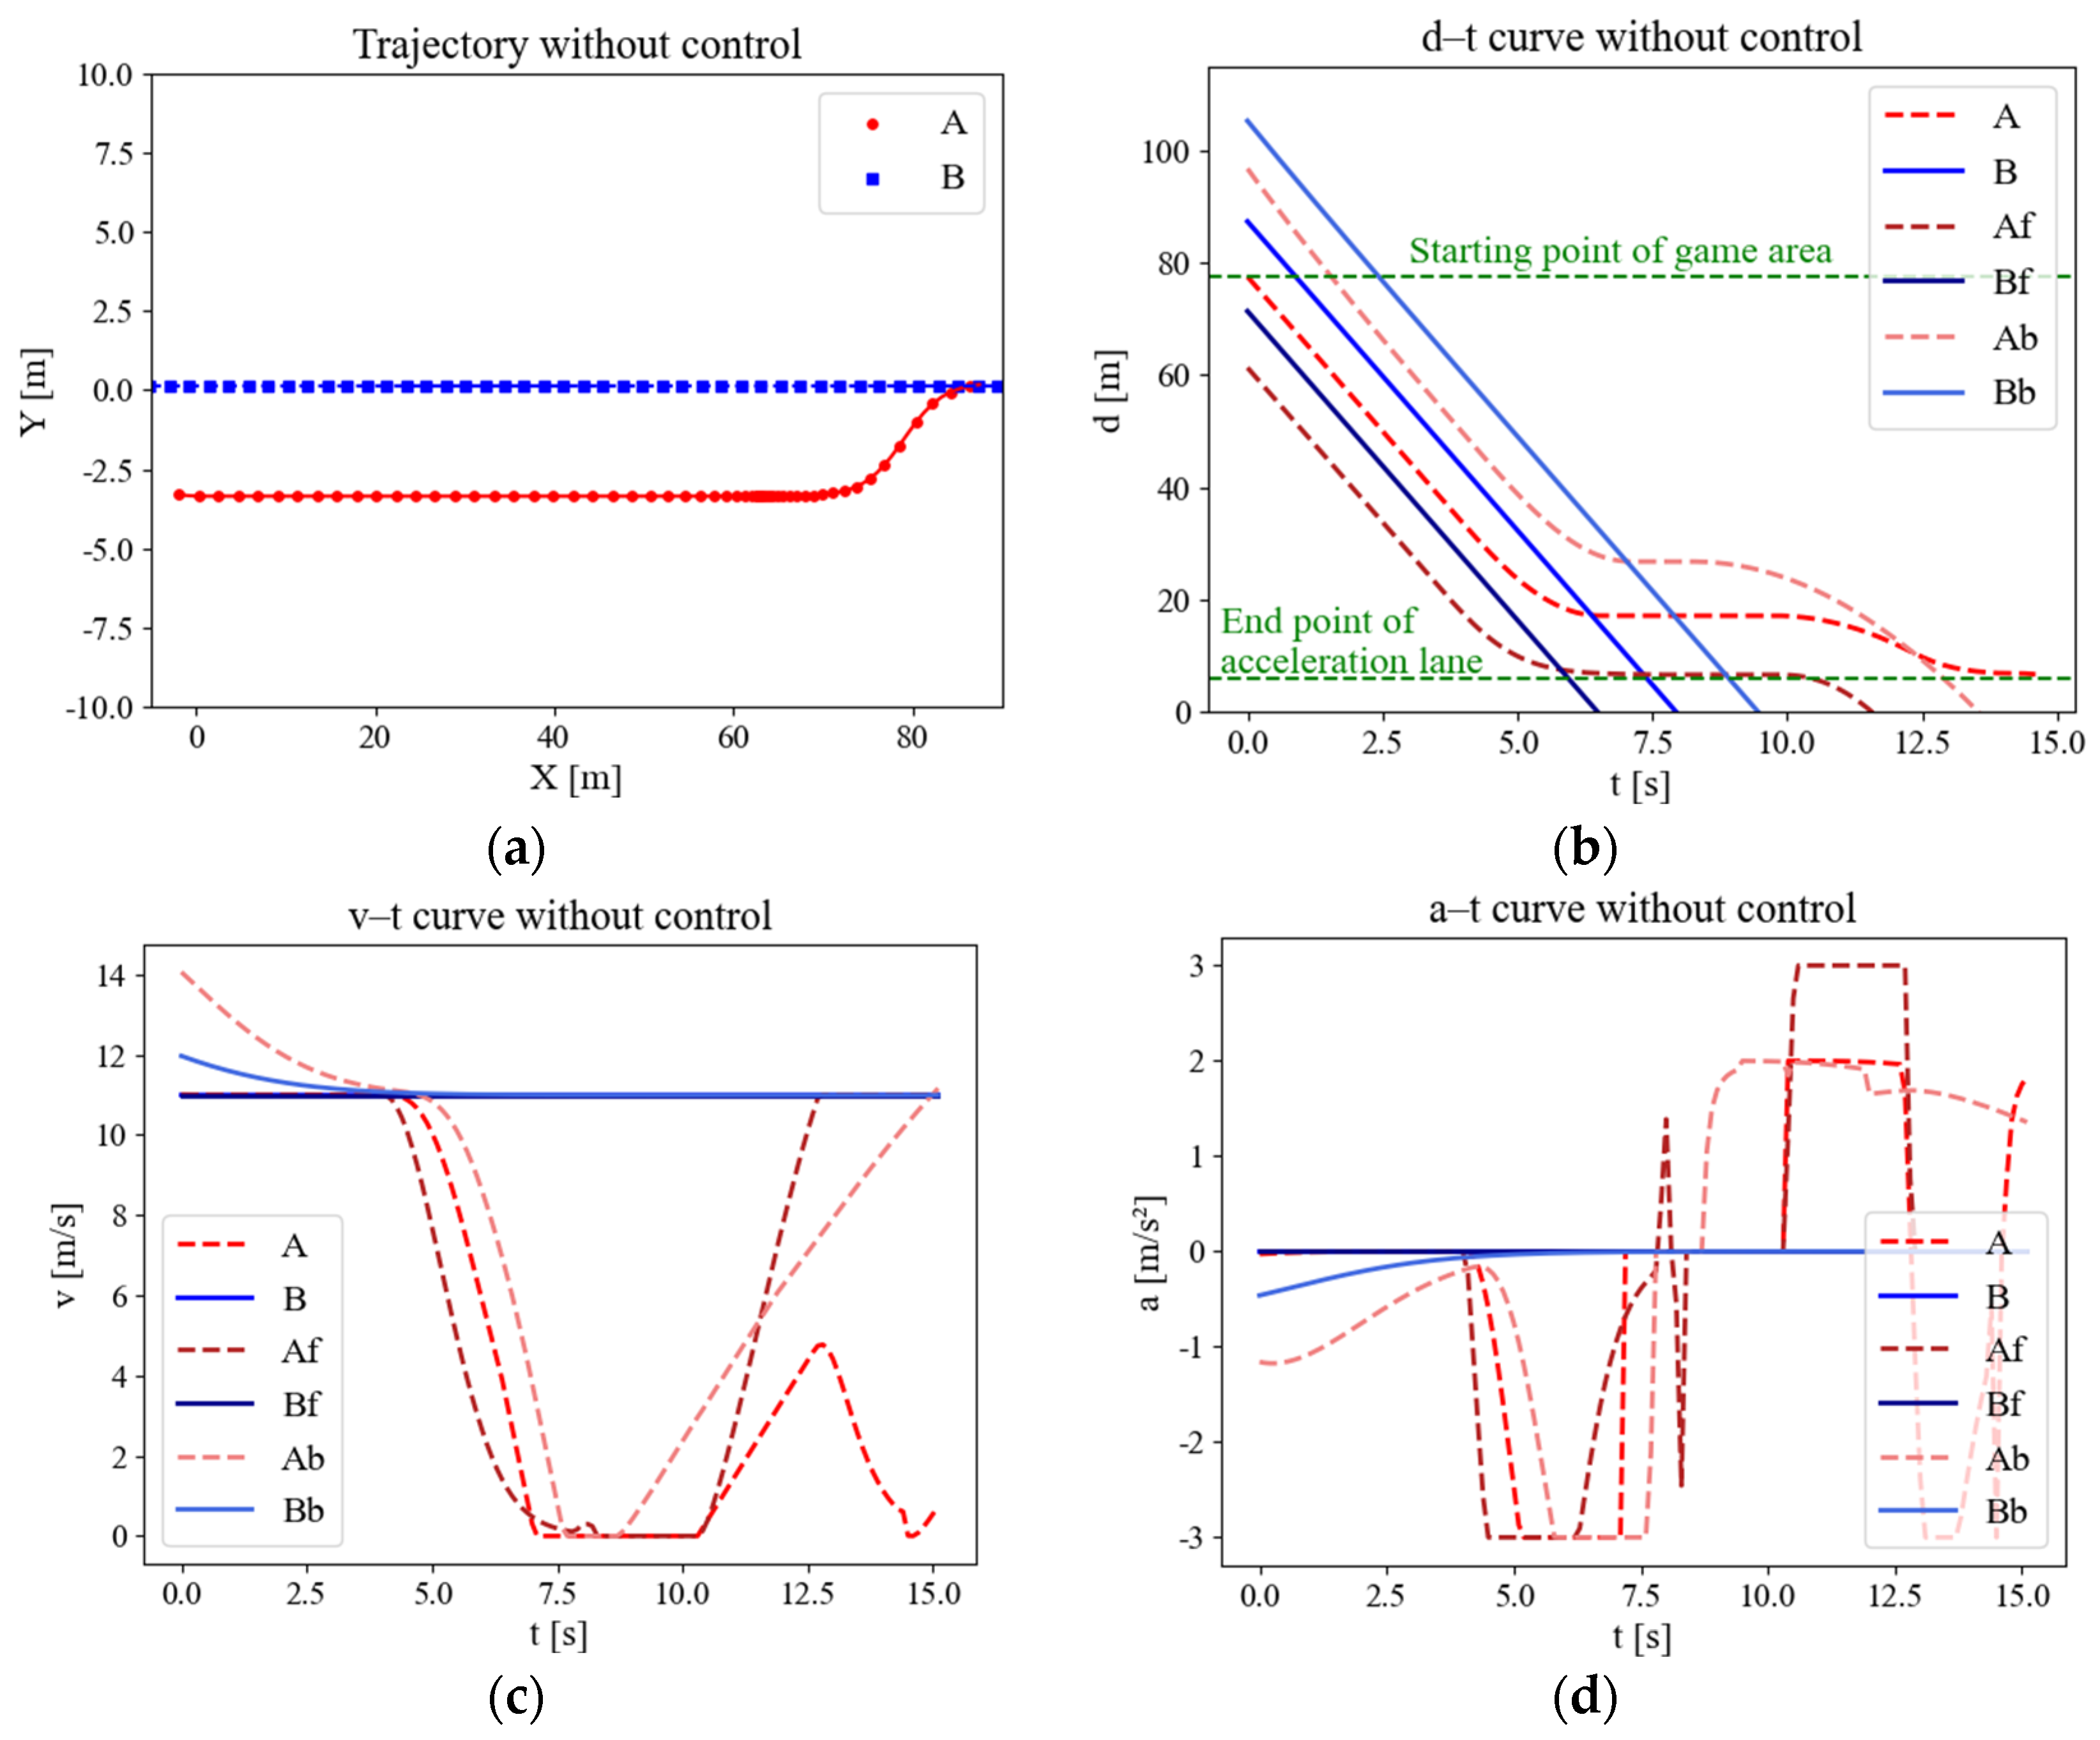
Figure 8 depicts the track, displacement, speed curve, and acceleration curve of the uncontrolled merging process. The merging of the CAV without control is represented by a model derived from SUMO’s LC2013. The results indicate that under high traffic densities on the main road, vehicles attempting to merge have difficulty in identifying an insertable gap that meets the safety constraints and consequently stop and wait in the acceleration lane, which can be seen in subgraph (c) speed curve, where the speed of the merging vehicle is equal to zero. Both dense points in Figure 8a and lines with small slopes in Figure 8b also indicate slow speeds.
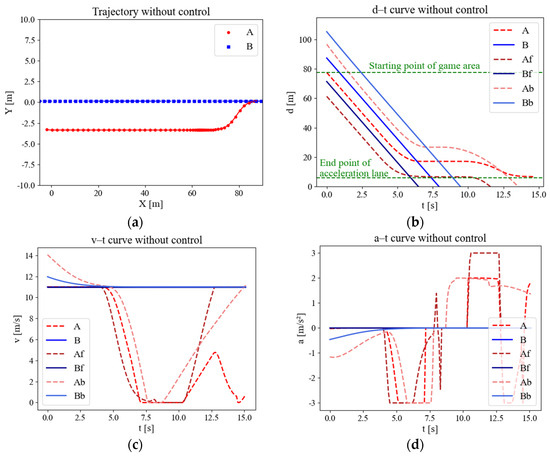
Figure 8.
Variation curves of merging parameters in uncontrolled scenes. (a) Trajectory scatter diagram. (b) Displacement curve. (c) Speed curve. (d) Acceleration curve.
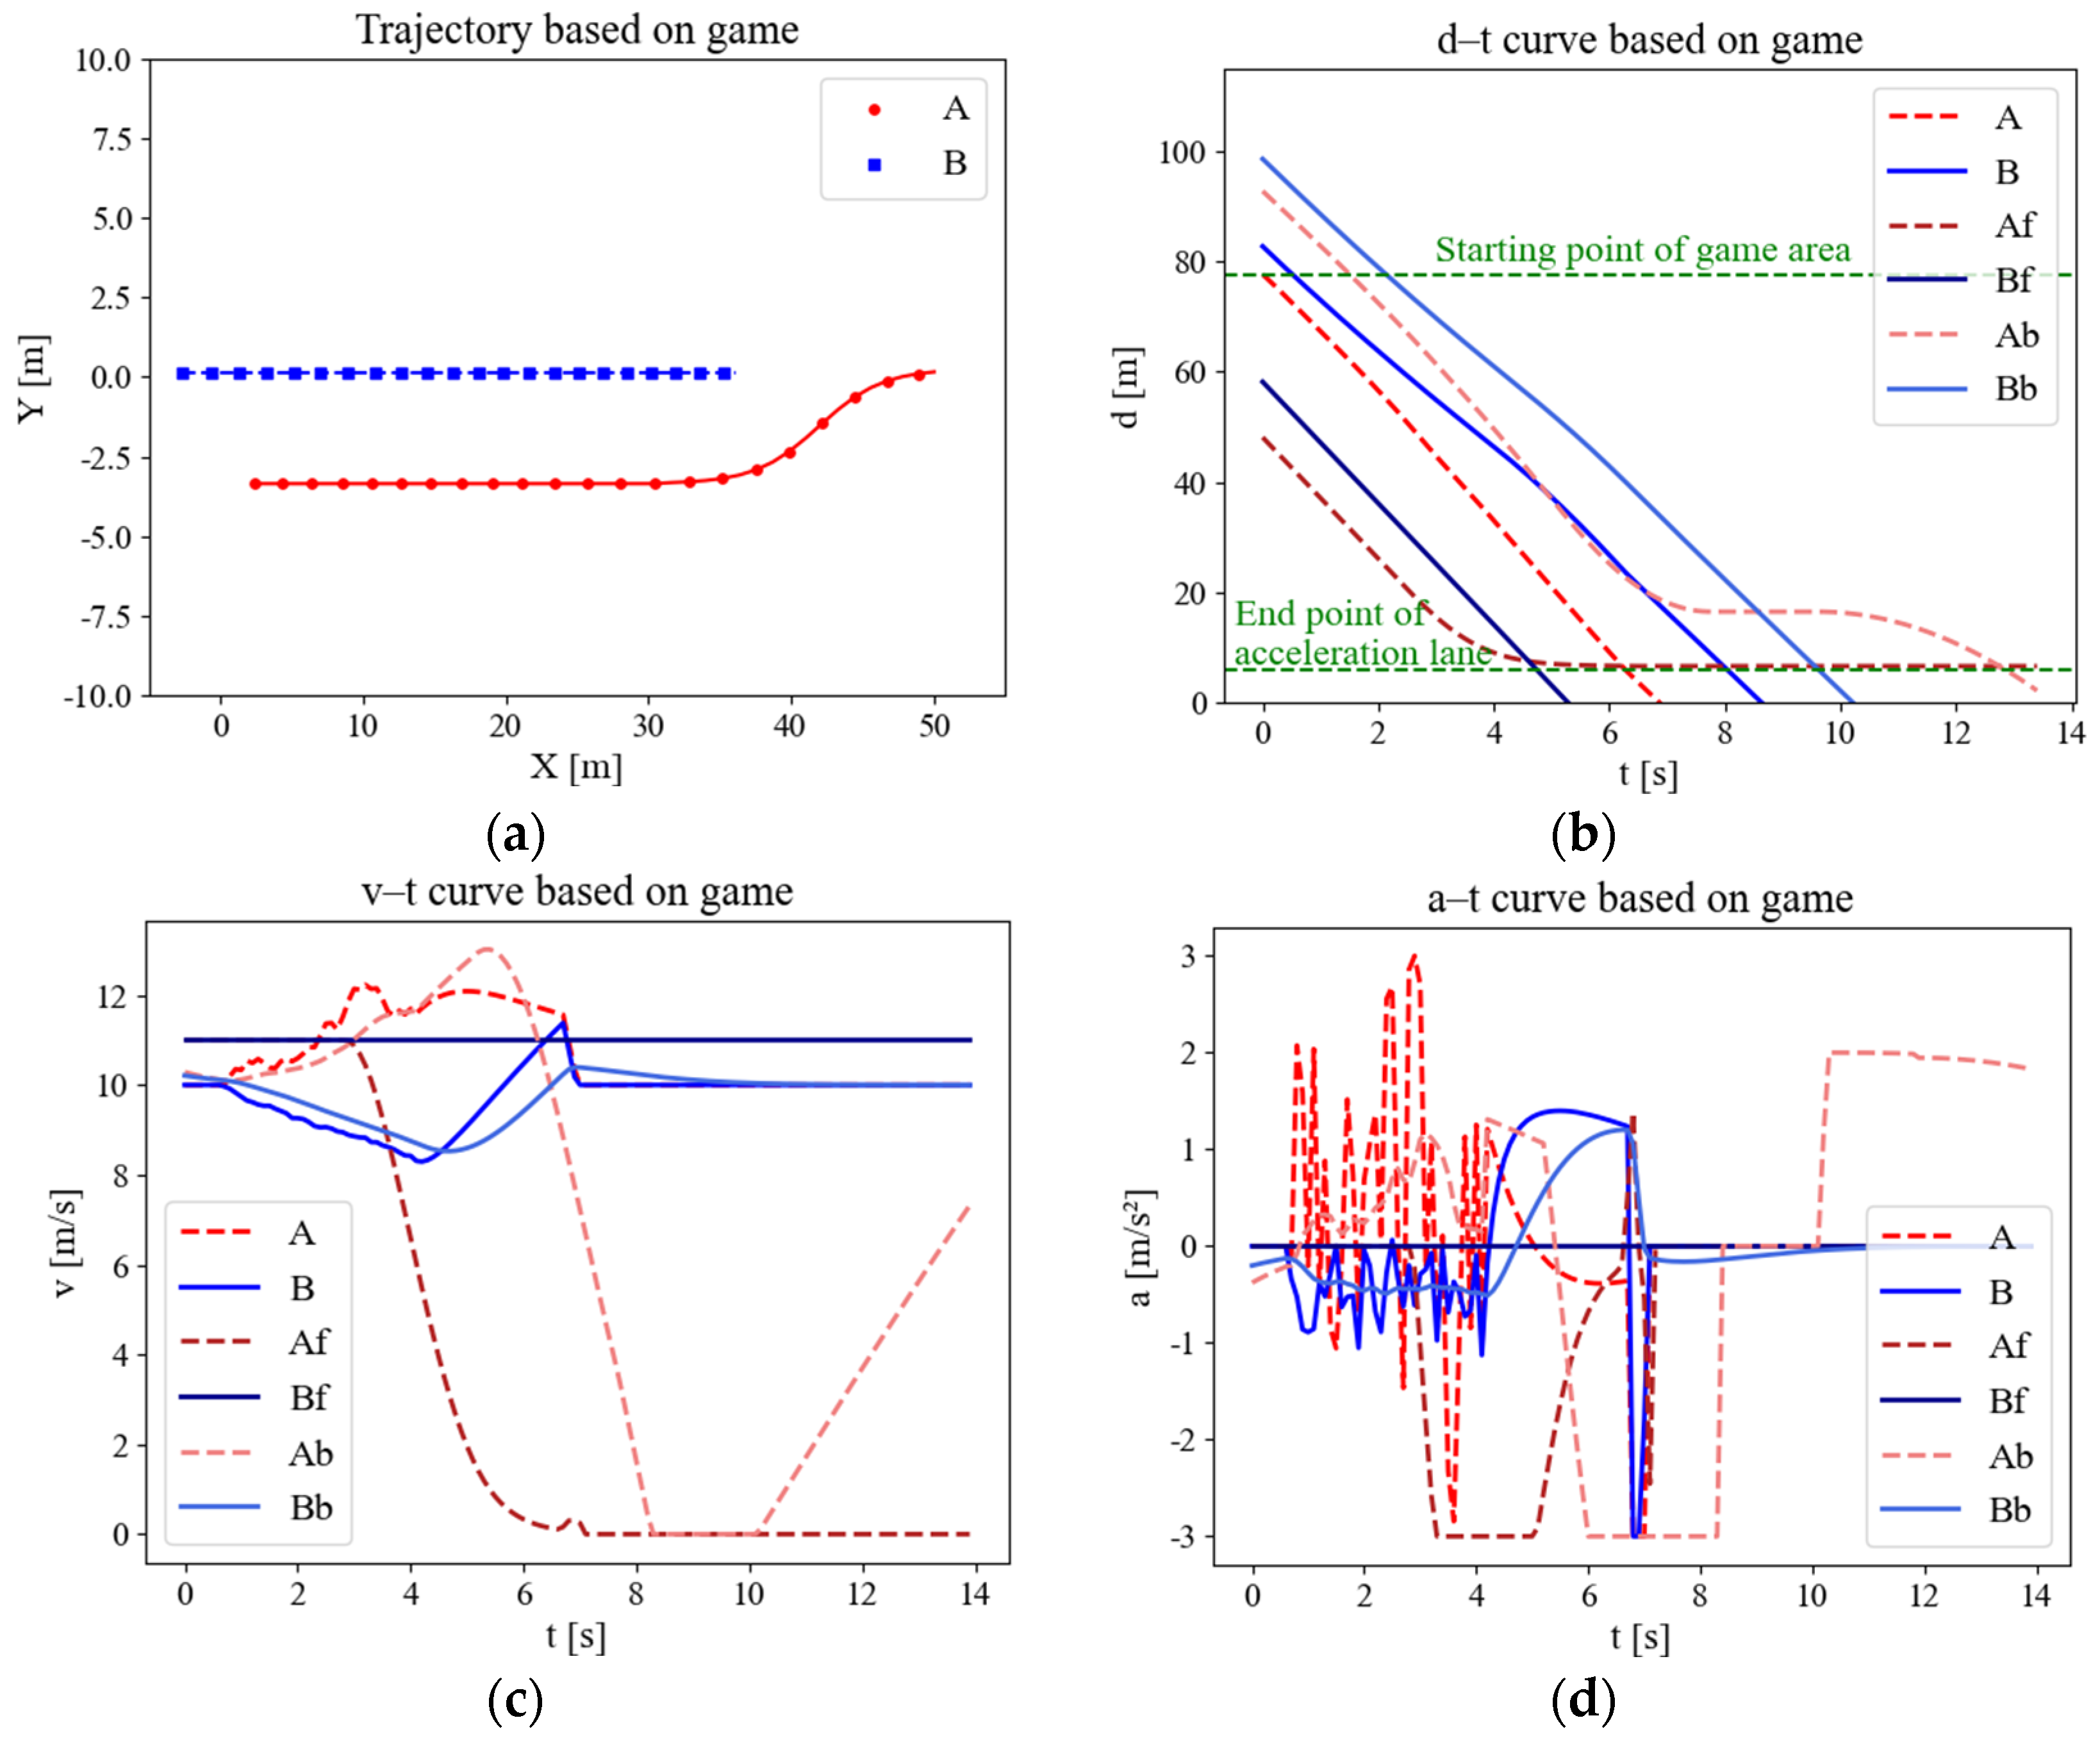
The variation in the parameters of the merging scenario based on the game model is shown in Figure 9. The lack of effective guidance regarding the driving strategy between each round of the game, in the absence of external control, resulted in a stalemate situation and sharp speed fluctuations in Figure 9c,d, which led to a lack of comfort and a low level of performance. Eventually, when it threatens the safety of vehicles on the main road, it forces them to slow down significantly, while merging vehicles accelerate sharply to achieve merging. Nevertheless, the pure gaming approach barely achieves a state of coordination compared to the uncontrolled approach; it can be observed that the slope of the displacement curve of CAV A in Figure 9b is always large compared with Figure 8b. This approach avoids the stop-and-wait gap that typically occurs at the end of the acceleration lane, which improves the timeliness of the merging vehicles. However, this comes at a significant cost, not only in terms of the sacrifice of comfort but also in terms of the creation of potential safety hazards.
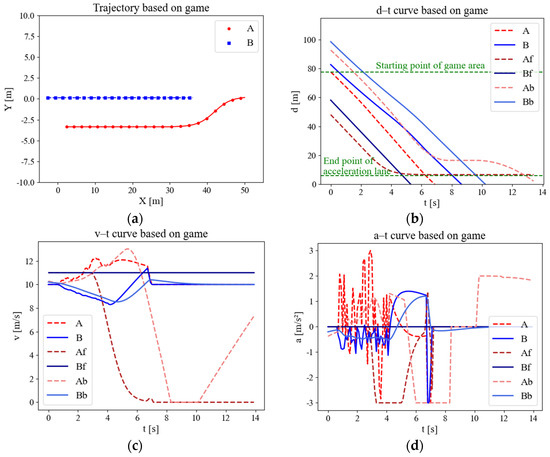
Figure 9.
Variation curves of merging parameters based on gaming model. (a) Trajectory scatter diagram. (b) Displacement curve. (c) Speed curve. (d) Acceleration curve.
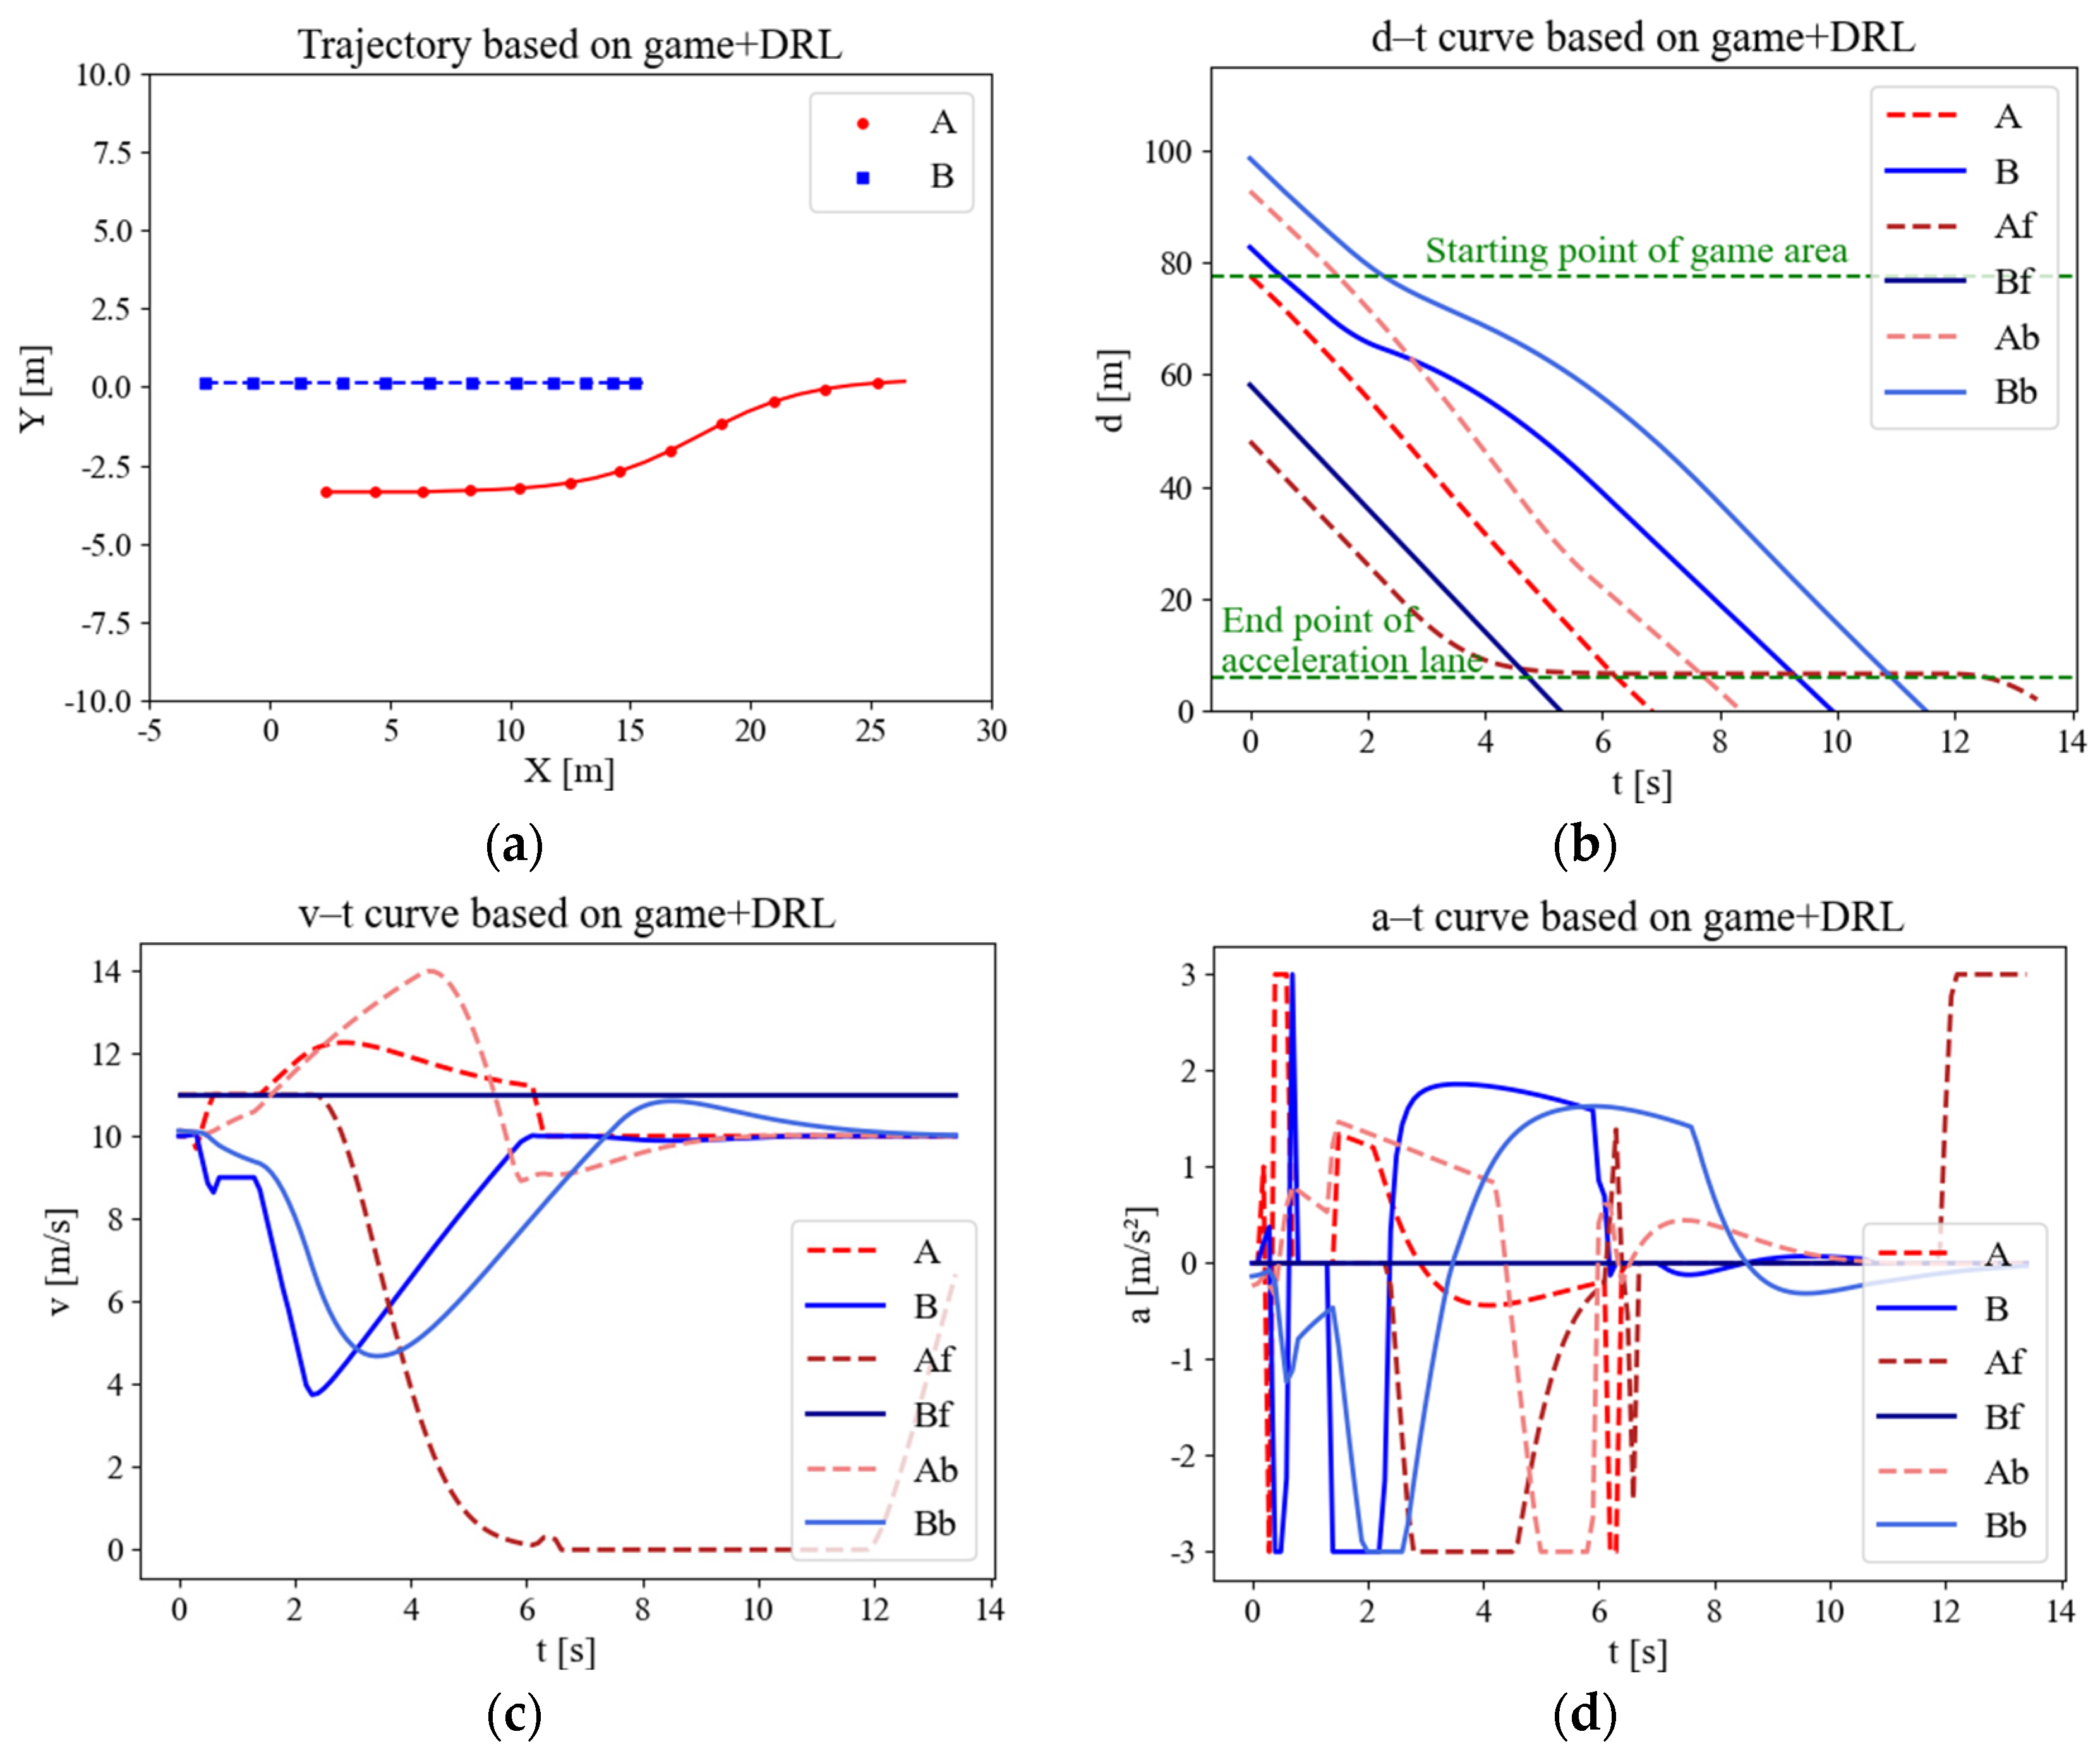
Figure 10 shows the reinforcement learning game modeling the merging process. The processing time of the game is much shorter, which results from the number of trajectory points in Figure 10a compared with only game-based in Figure 10a. Guided by reinforcement learning, the CAV is able to anticipate the MDV’s willingness to coordinate to a certain degree and adopt a more aggressive strategy to merge. By analyzing the speed and acceleration curve in Figure 10c,d, it is clear that there is a significant increase in comfort compared to the pure gaming control scenario. In the uncontrolled case, the time for the research subject to pass through the area is 14 s as observed in Figure 8b. However, under the control of the algorithm proposed, the research subject is observed to traverse the area at the 7th second in Figure 10b. For this case, the CAV’s access efficiency was found to have increased by 50%.
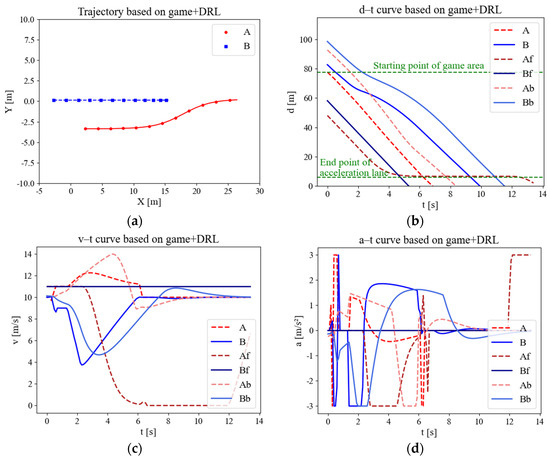
Figure 10.
Variation curves of merging parameters for game models incorporating reinforcement learning. (a) Trajectory scatter diagram. (b) Displacement curve. (c) Speed curve. (d) Acceleration curve.
5.3. Macro Traffic Flow Case Study
This section presents a simulation conducted in accordance with the real situation depicted in the video data, specifically with regard to the traffic flow. The scenario involves 500 vehicles per hour on the ramp, of which 50% are CAVs. The main-road traffic flow is 1700 vehicles per hour, all of which are MDVs. Among them, large, medium, and small vehicles account for 1%, 2%, and 97%, respectively. This study considered the size and maneuverability of different vehicle types. The parameters are adjusted accordingly during the simulation. The study found that 50% of participants were conservative, 30% were moderate, and 20% were aggressive, respectively.
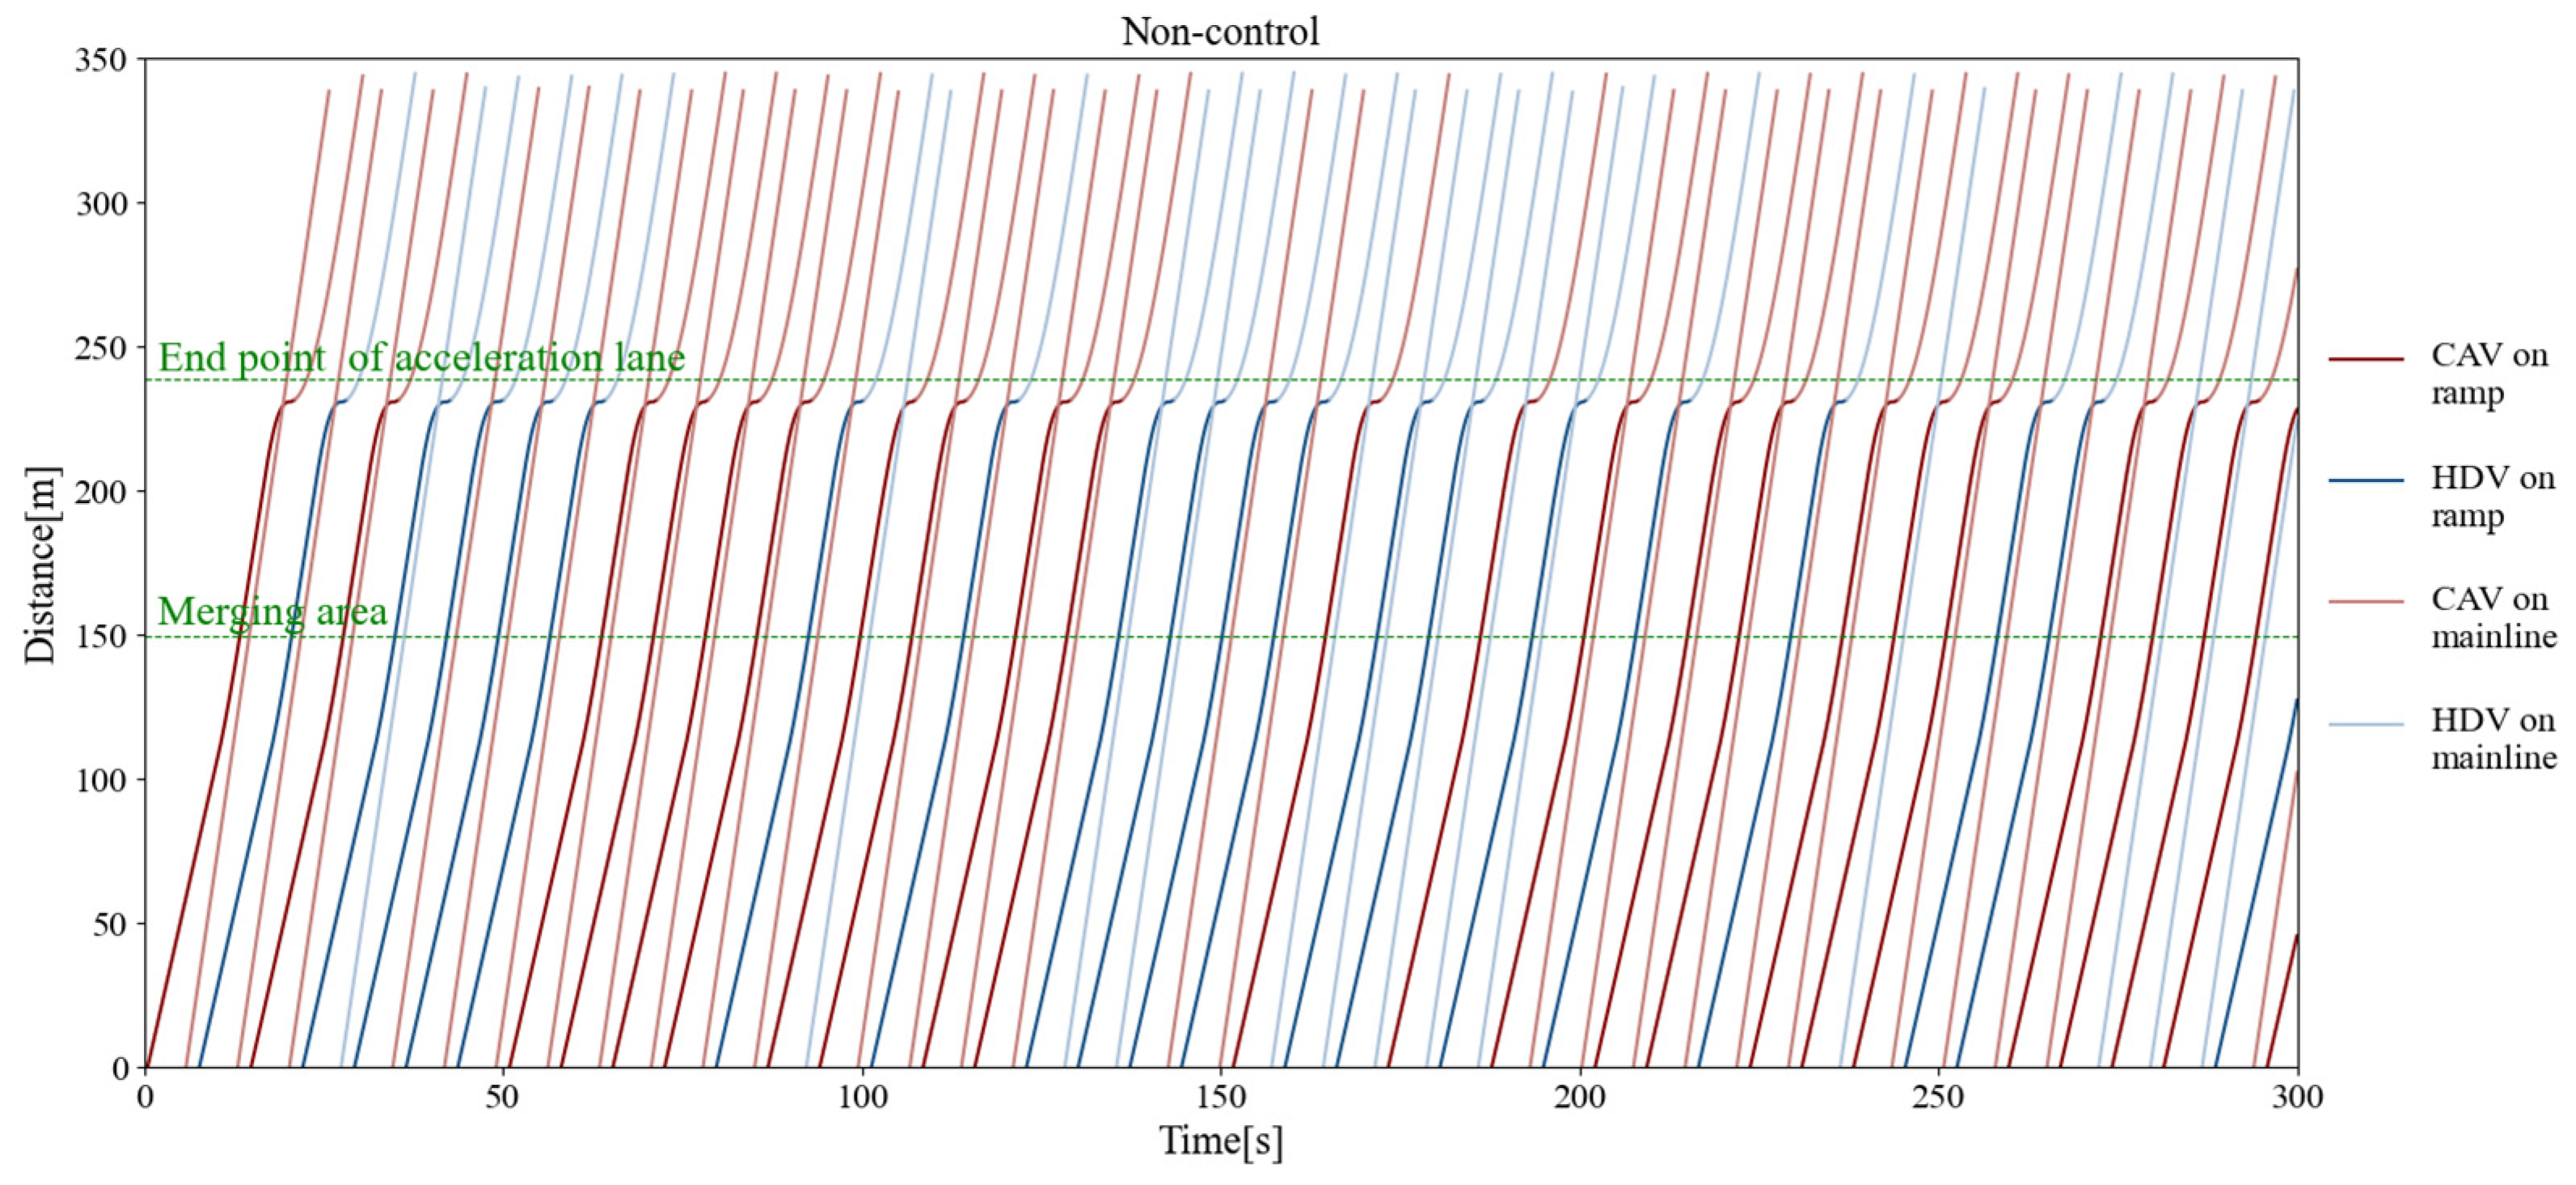
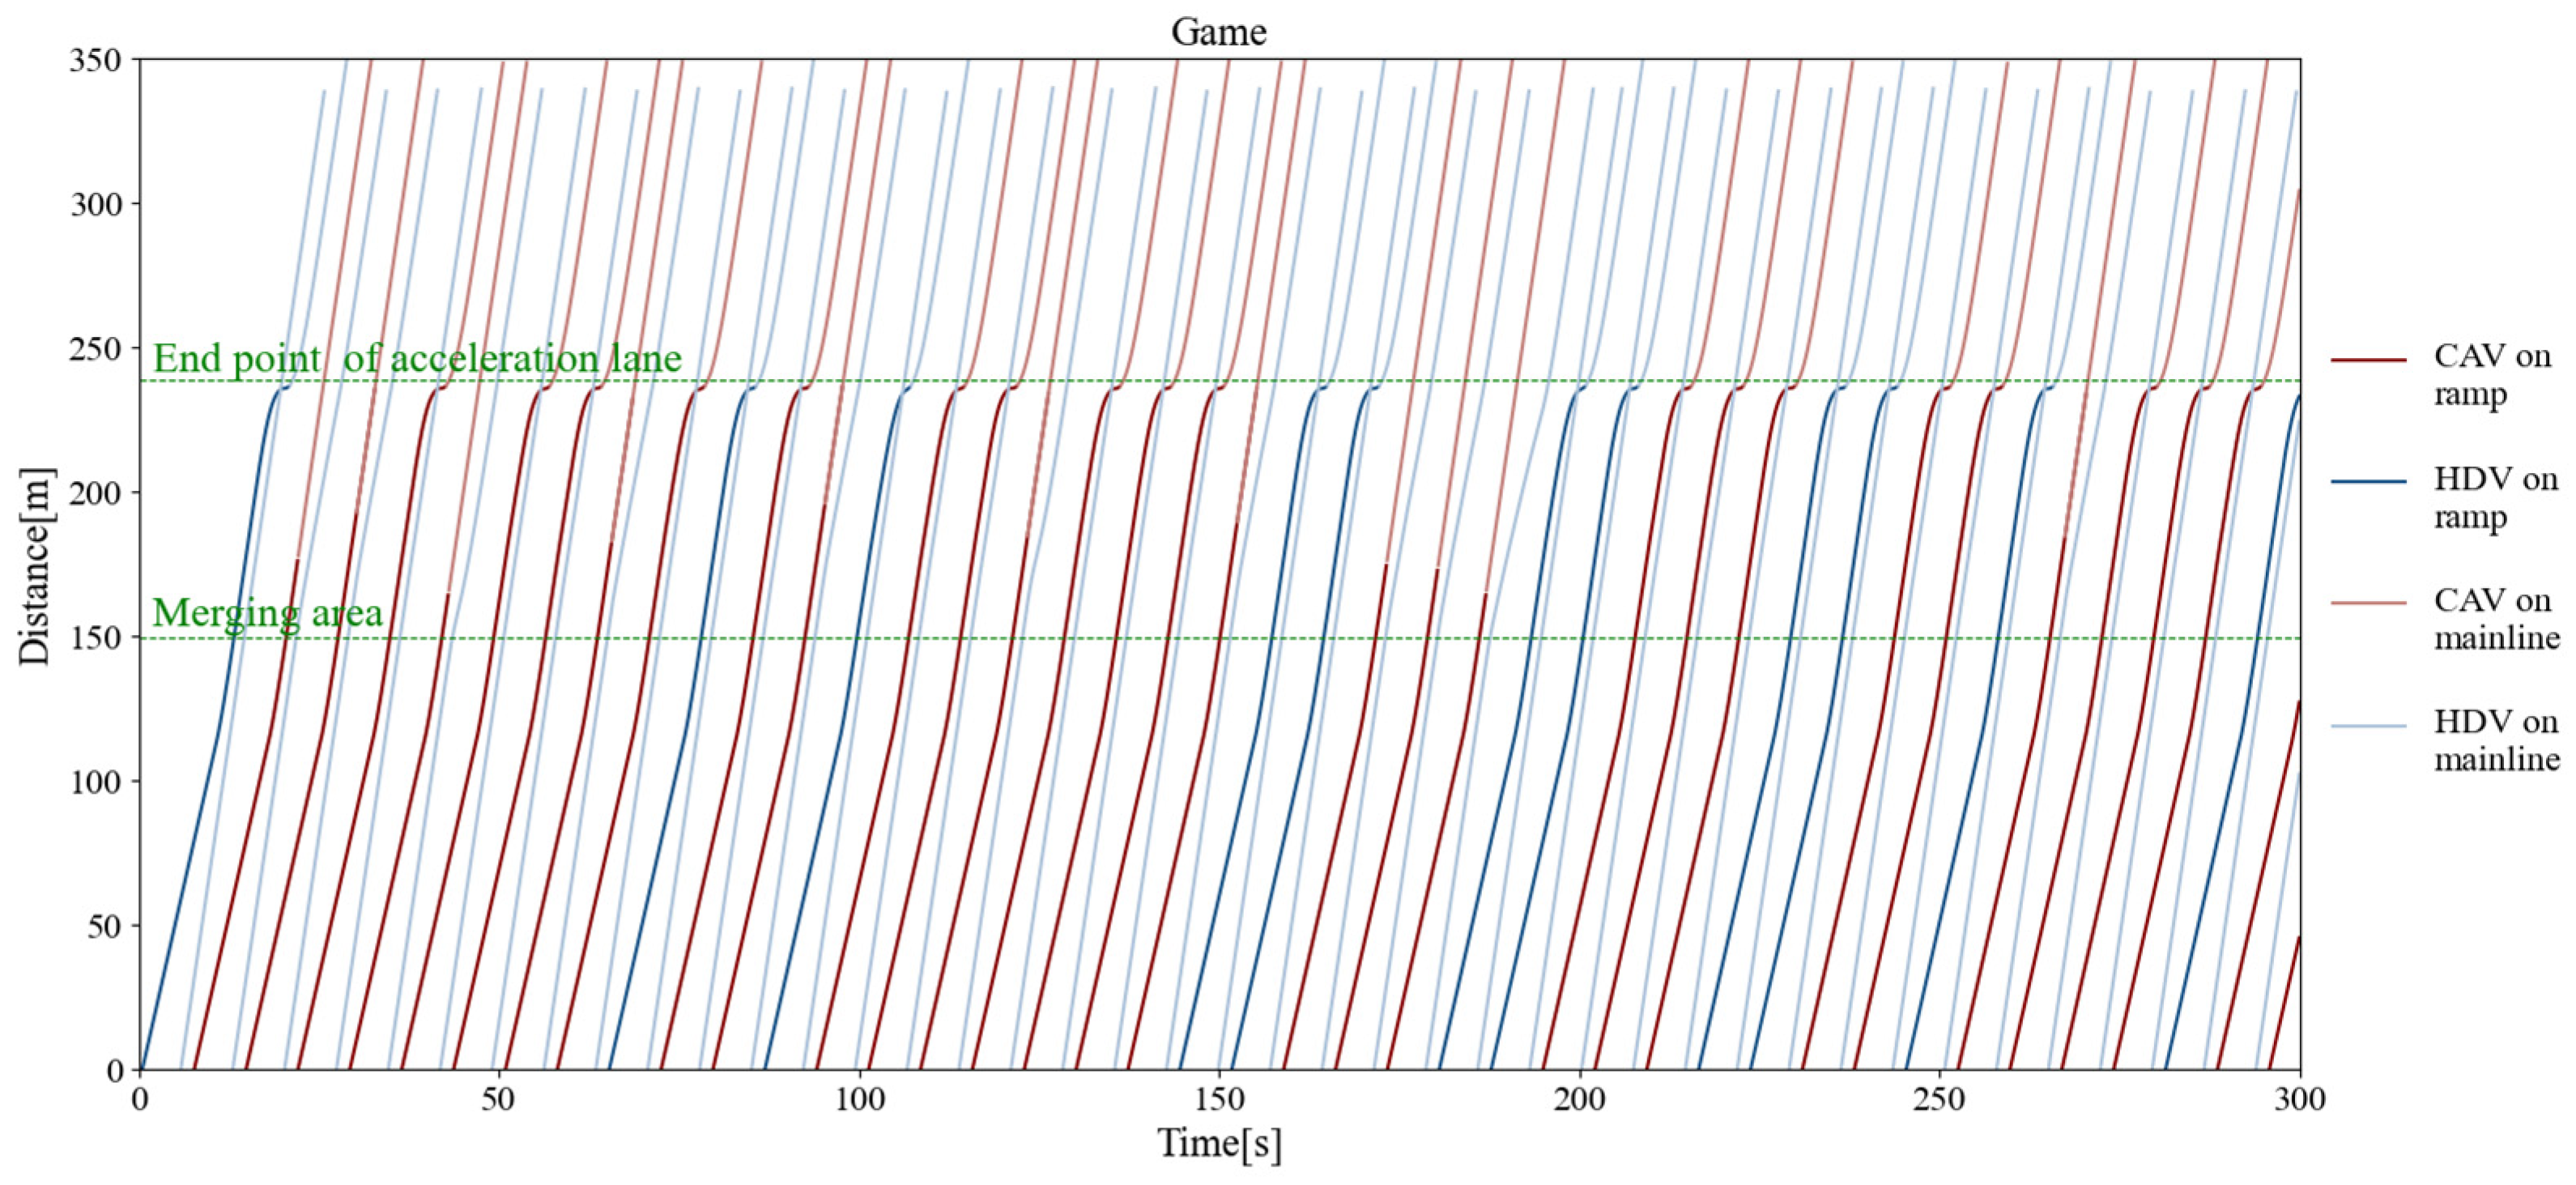
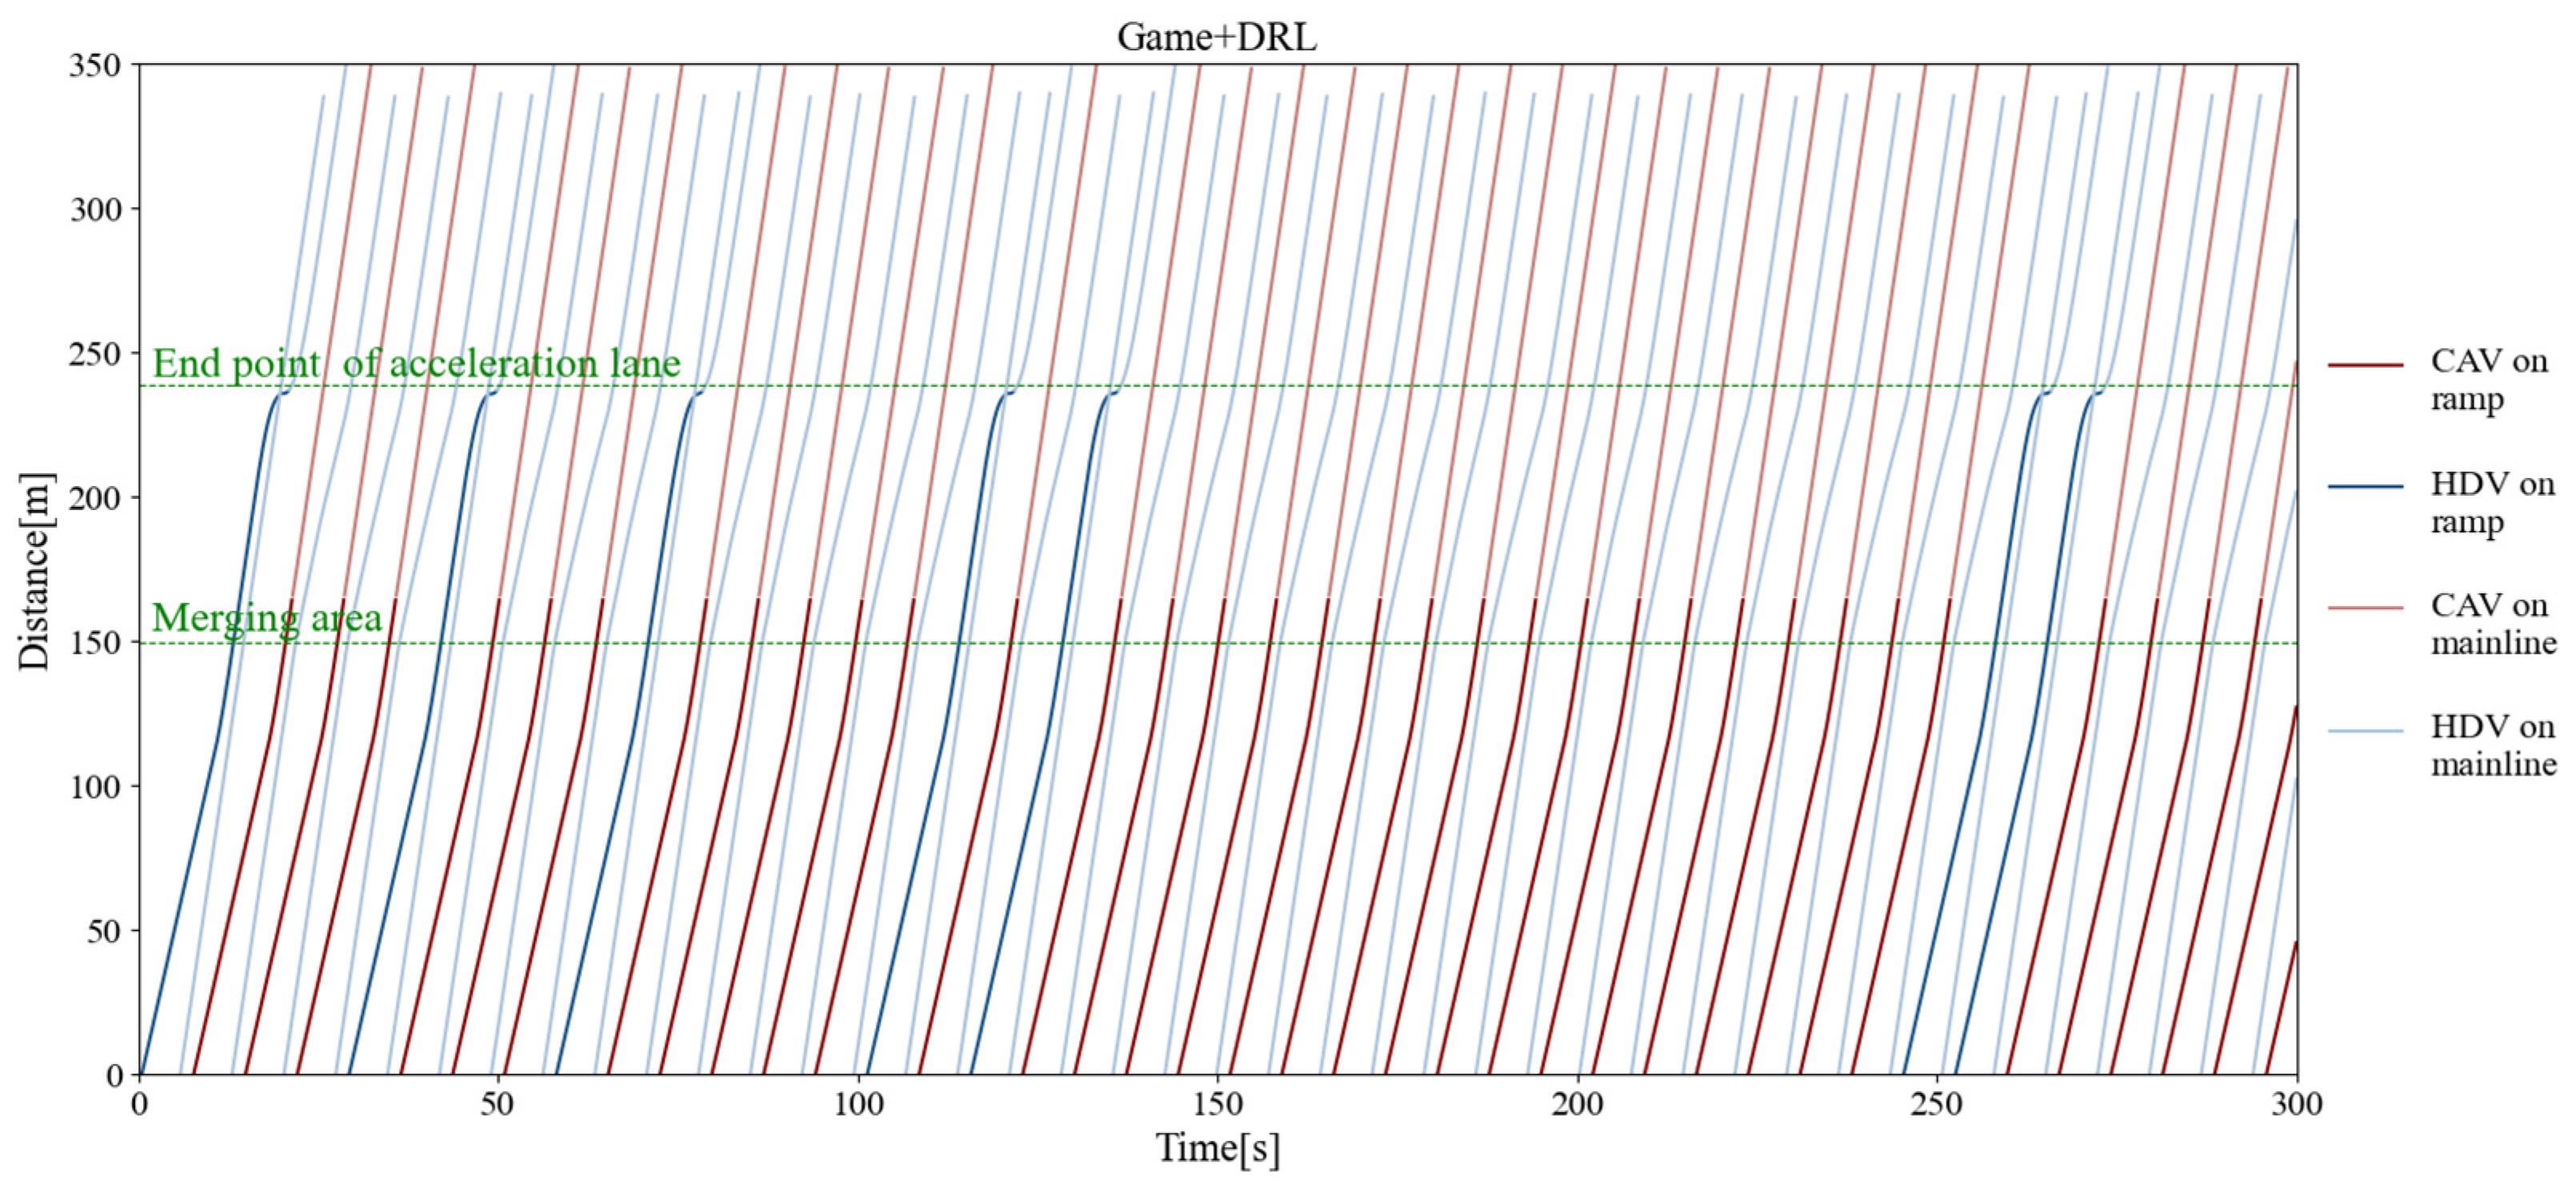
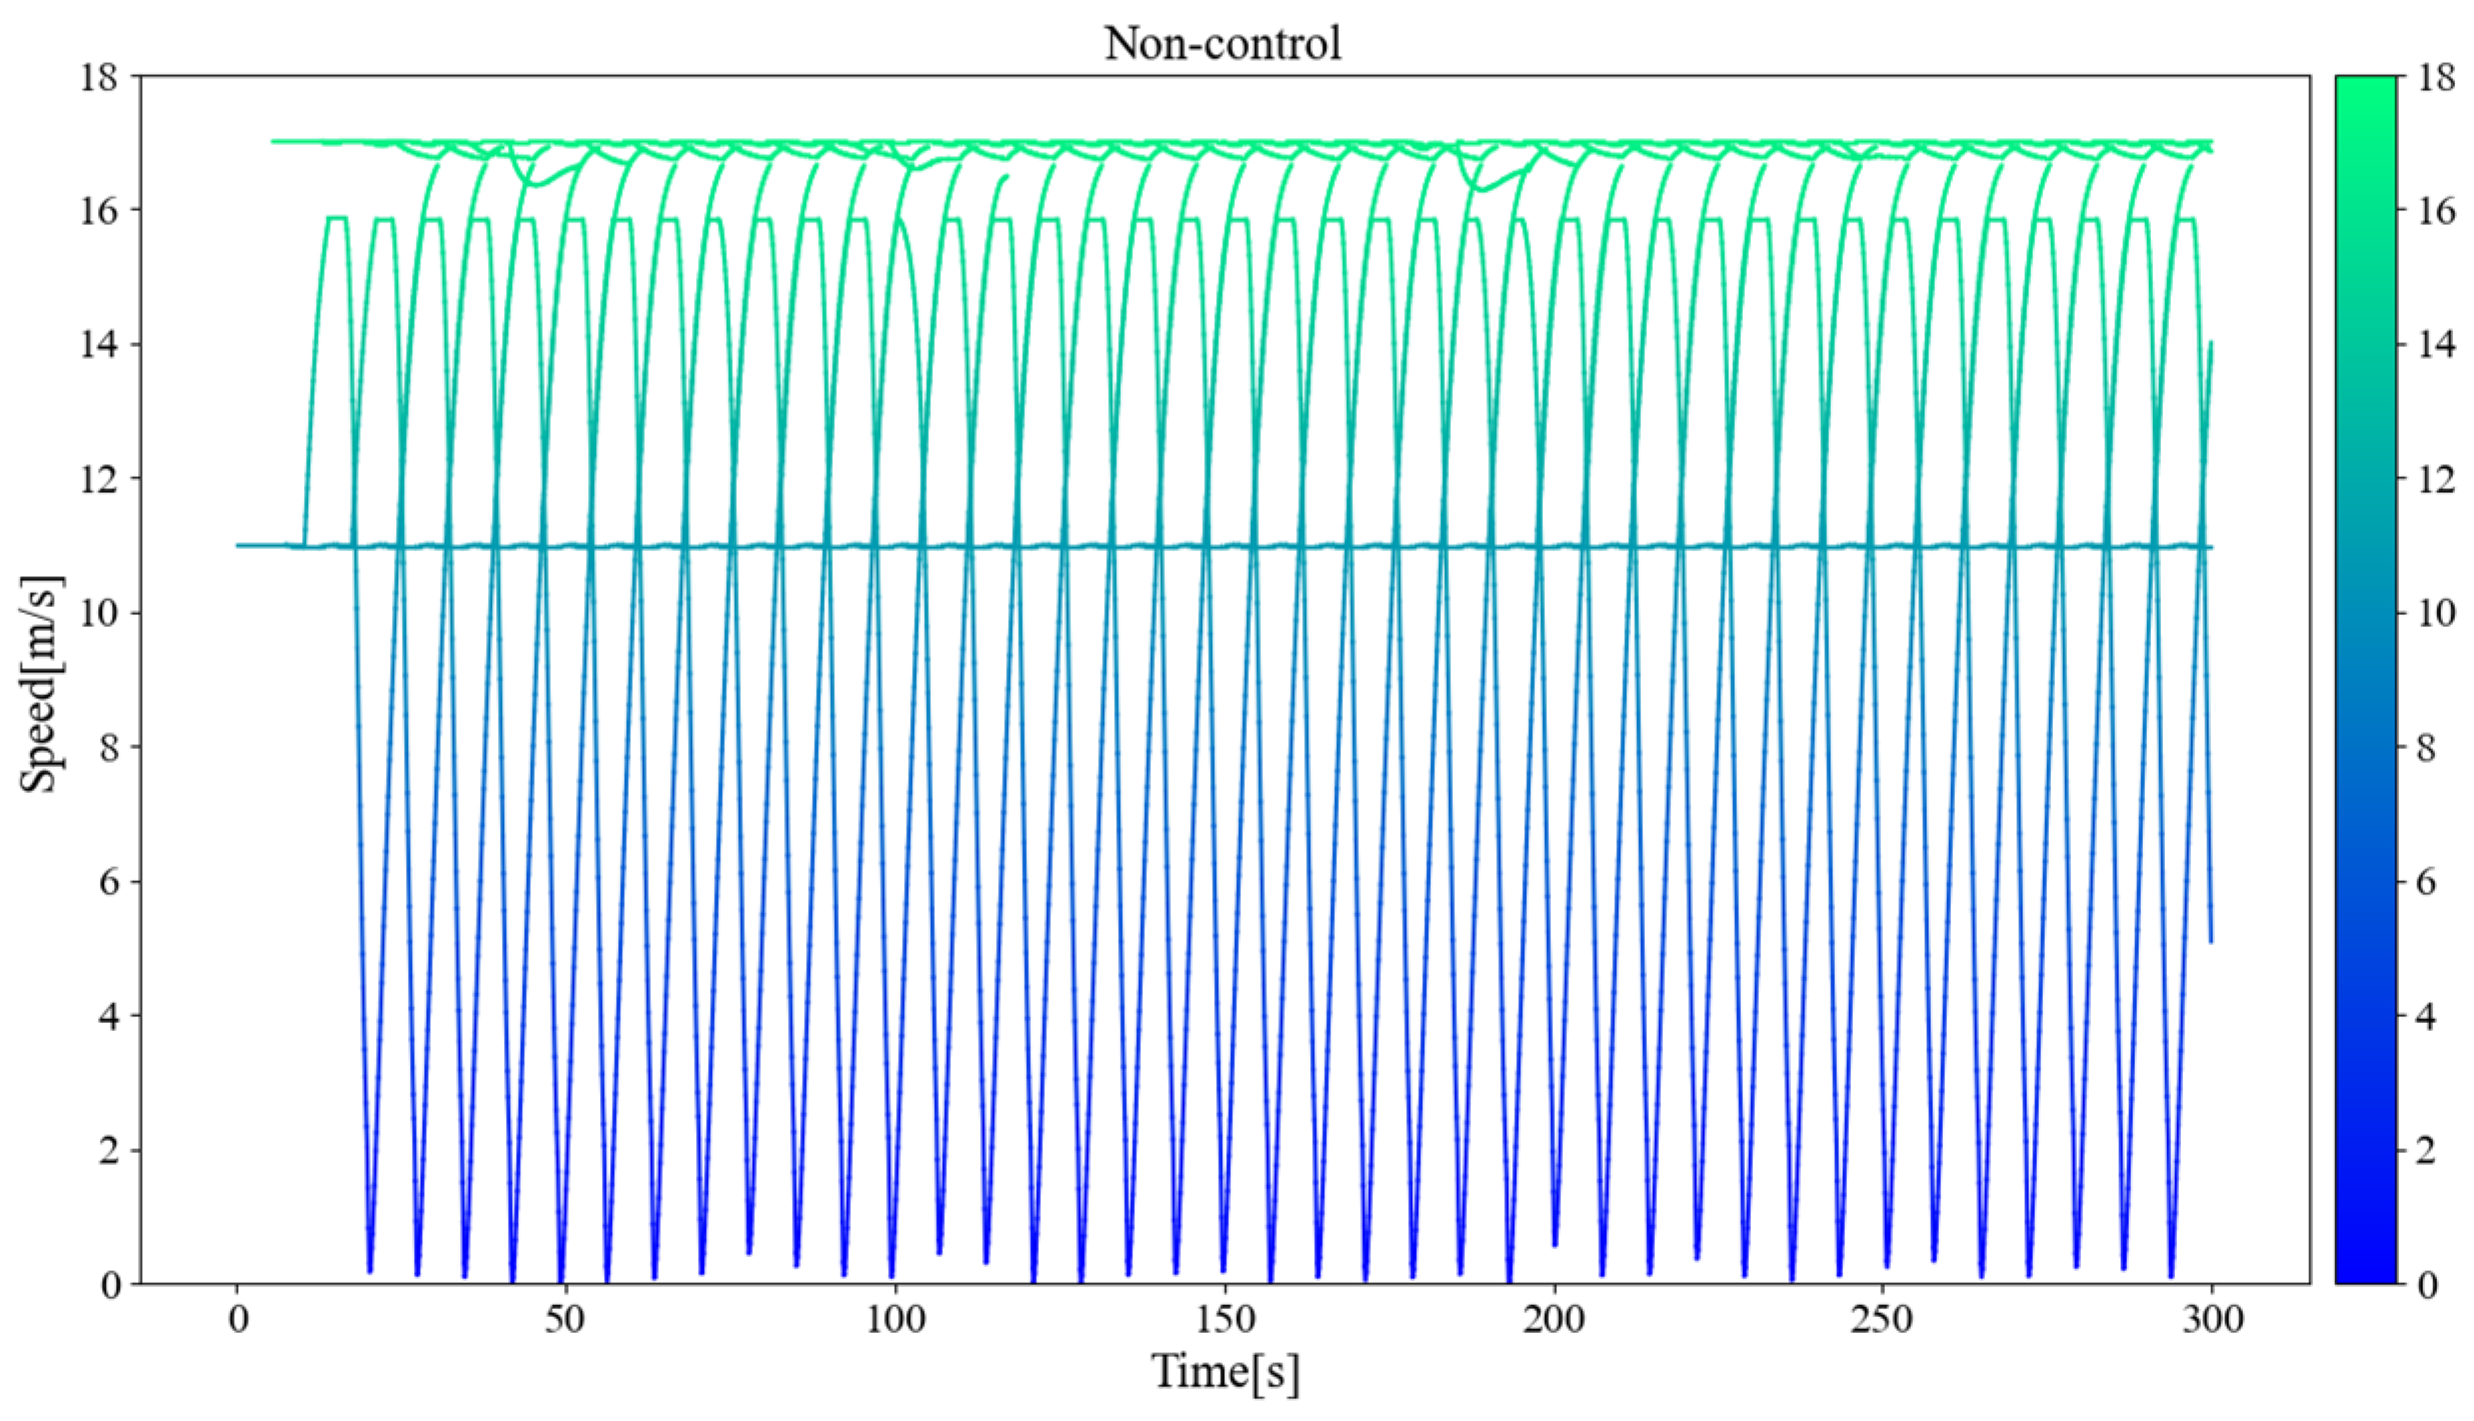
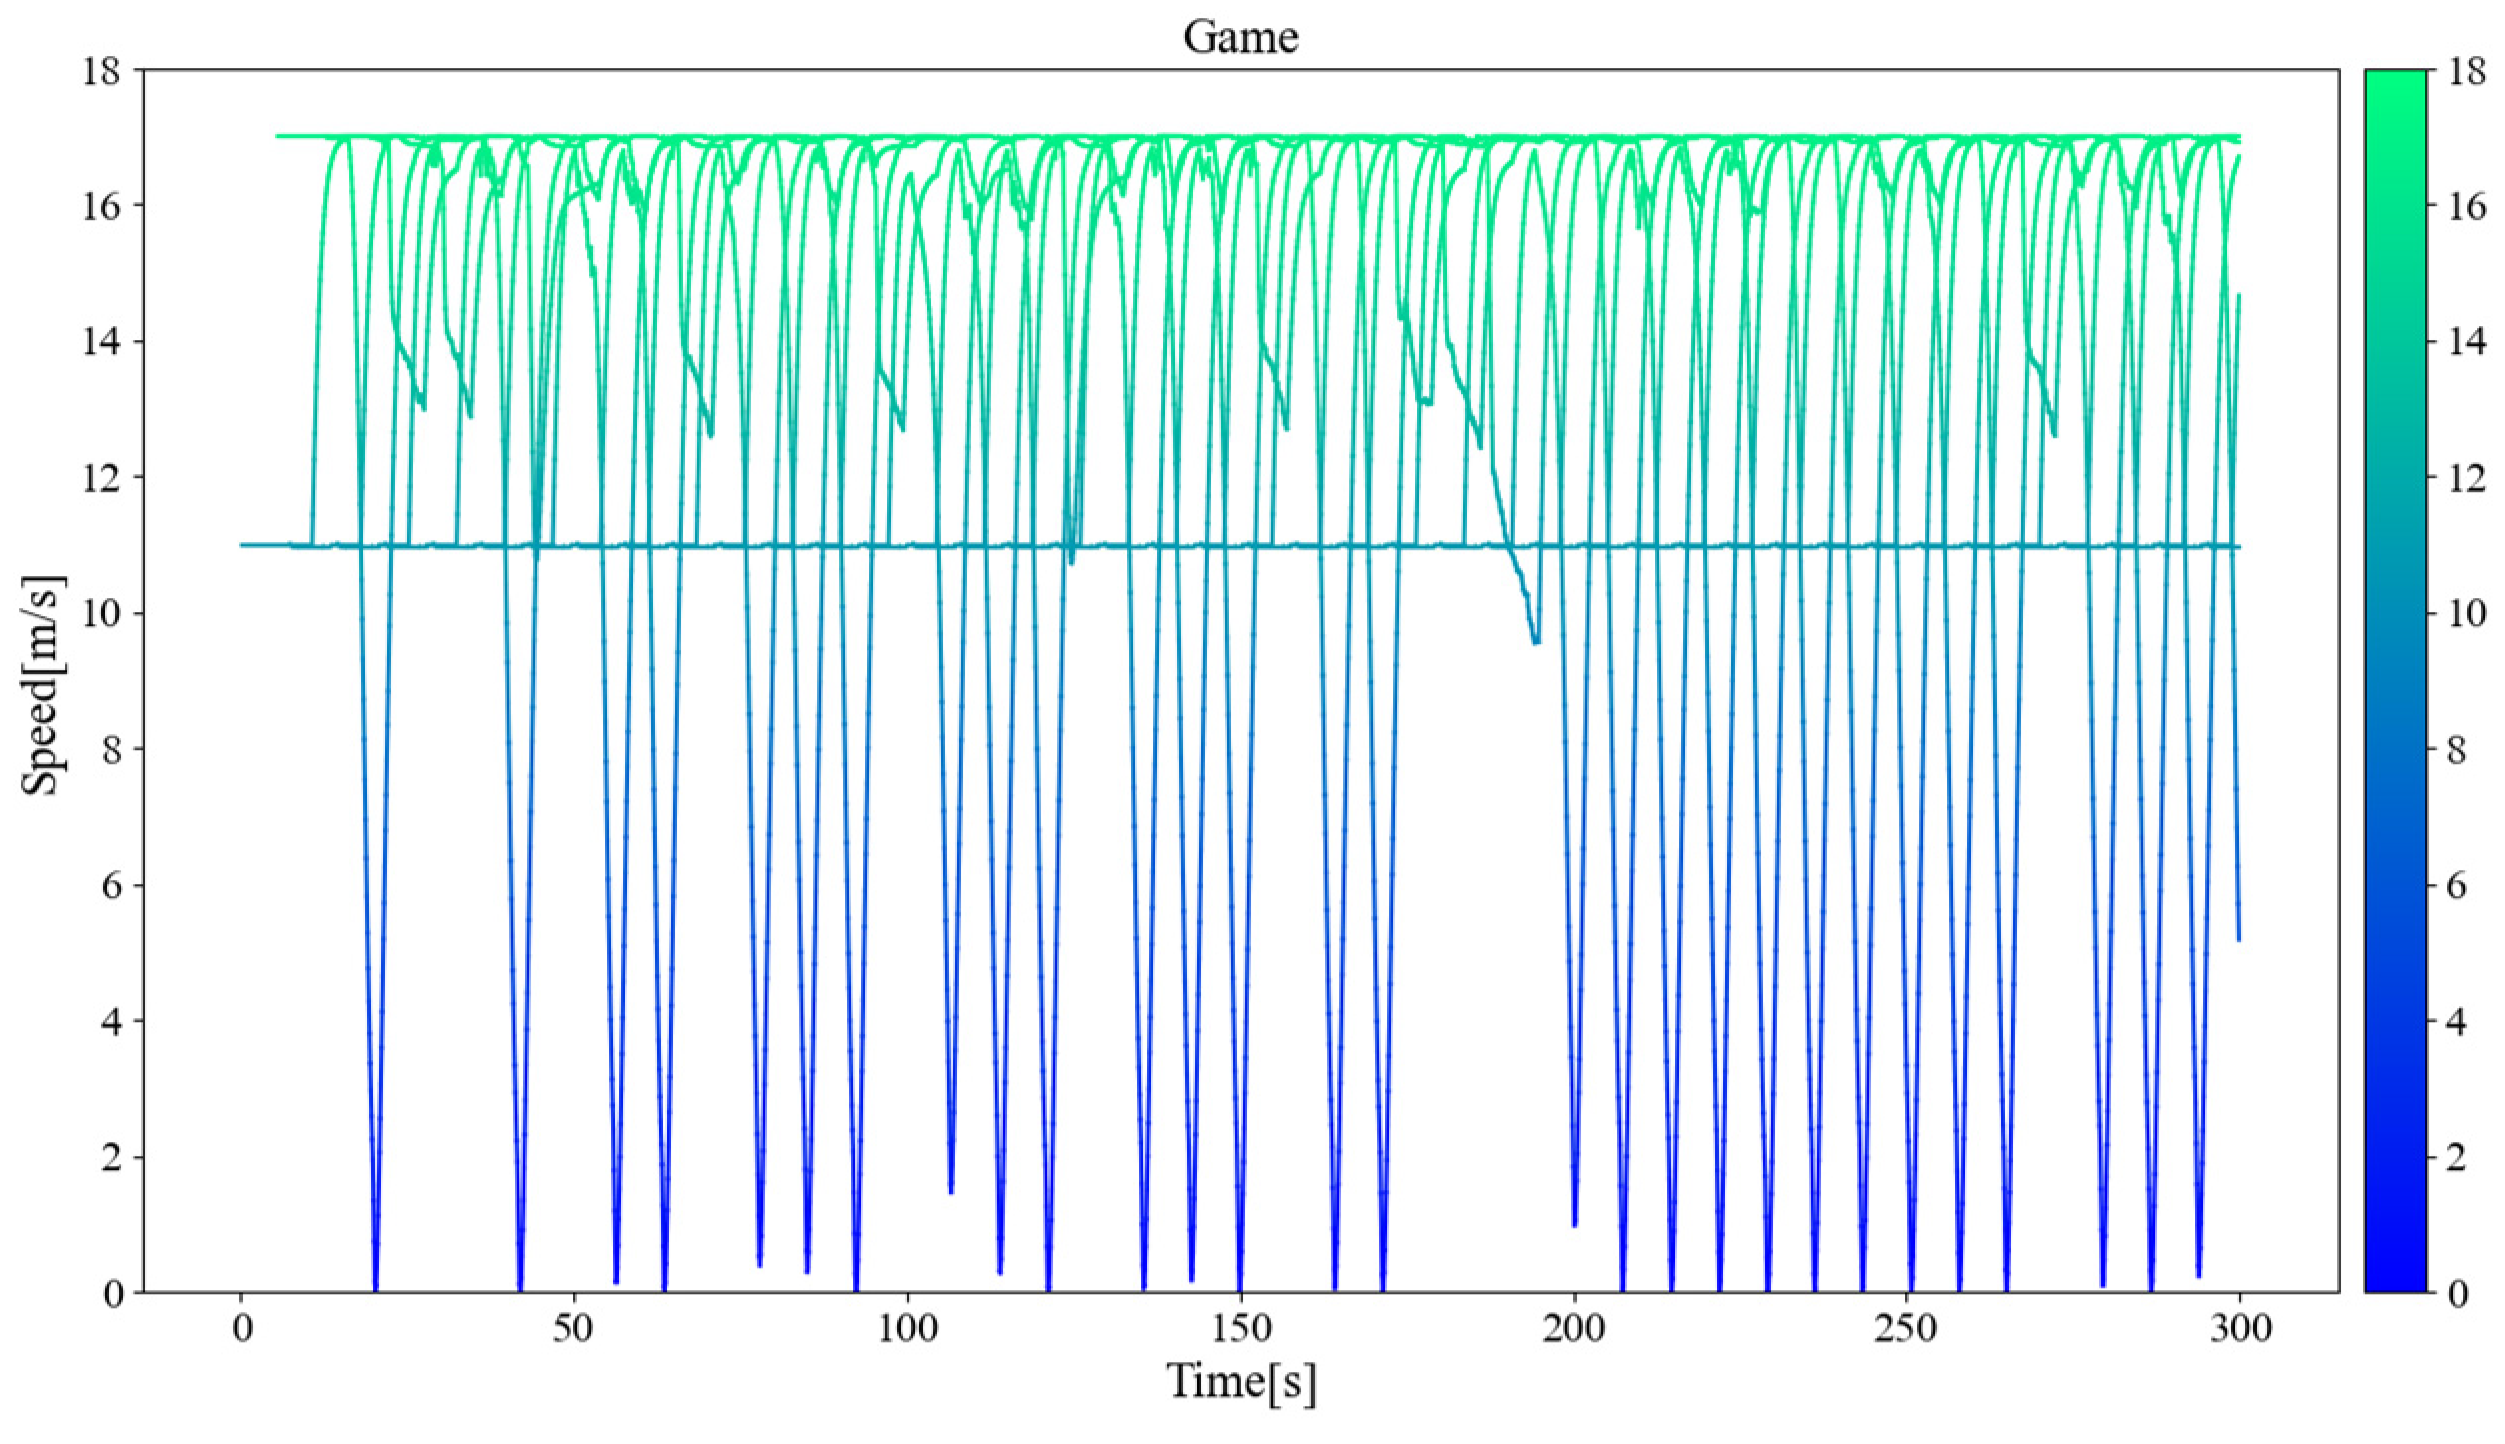
Figure 11, Figure 12, and Figure 13 separately show the displacement–time curves of vehicles with no control, pure game control, and reinforcement learning game control. This set of figures clearly shows the location of the merging vehicles completing their merges. In the figures, the red curve represents CAVs, the blue represents MDVs, the dark curve represents vehicles on ramps and acceleration lanes, and the light curve represents vehicles on the main road. The slope of the curve represents the speed of the vehicle, and the transition point from dark to light on the curve represents the location and timing of the vehicle merging into the main road. By comparing these three figures, it can be clearly seen that under the control of the proposed method, the position of the on-ramp CAV merging into the main road is farther away from the end of the acceleration lane and with higher speed. Figure 14, Figure 15, and Figure 16 show the speed–time curves of the vehicle, respectively. Comparing Figure 15 and Figure 16, speed fluctuation under the control of DRL and the game is significantly less than that under the game only. Because of integrating DRL into the game, the success rate and security have been further improved, and the fluctuation of speed has also been alleviated. These results demonstrate that the uncontrolled case presents a challenging scenario for merging due to the high density of traffic flow on the main road and that it fails to consider the potential for MDVs to engage in cooperative actions. In the case of pure game control, the results are similar to the simulation of the micro case study. The game model is unable to identify a strategy that can reach equilibrium quickly, and it is difficult to coordinate the actions of conflicting vehicle pairs in most cases. The speed also shows more dramatic fluctuations in the car. The reinforcement learning game serves to regulate the actions of merging CAVs, which are able to respond to the varying styles of MDVs that effectively predict their degree of coordination. In the case of conservative and moderate games, the realization of coordination is largely achieved. In the case of aggressive games, due to the high proportion of MDVs refusing to yield, it is difficult for merging vehicles to be inserted in front. Such a scenario is not implausible.
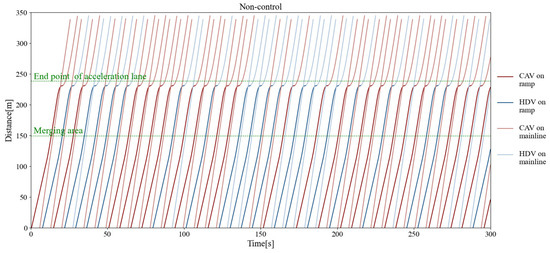
Figure 11.
Vehicle displacement–time curve without control.
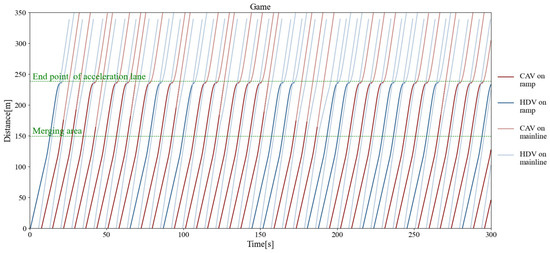
Figure 12.
Vehicle displacement–time curve under pure game control.
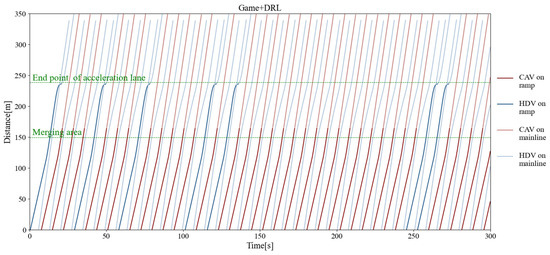
Figure 13.
Vehicle displacement–time curve under reinforcement learning game control.
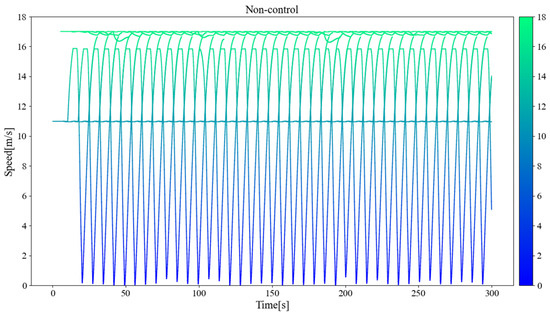
Figure 14.
Vehicle speed–time curve without control.
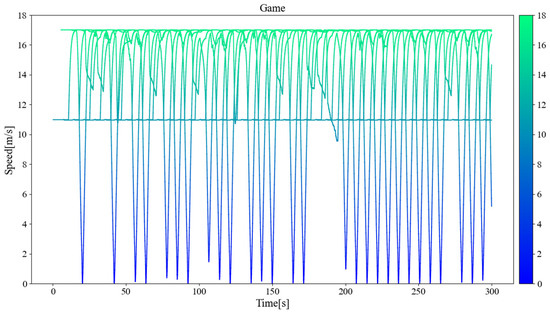
Figure 15.
Vehicle speed–time curve under pure game control.
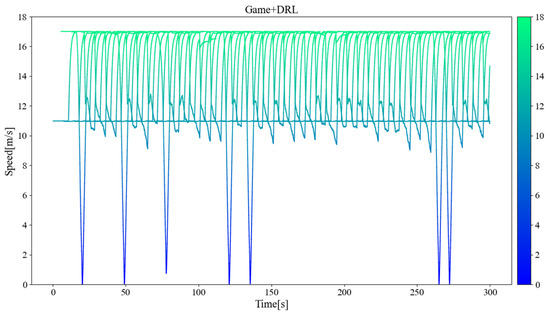
Figure 16.
Vehicle speed–time curve under reinforcement learning game control.
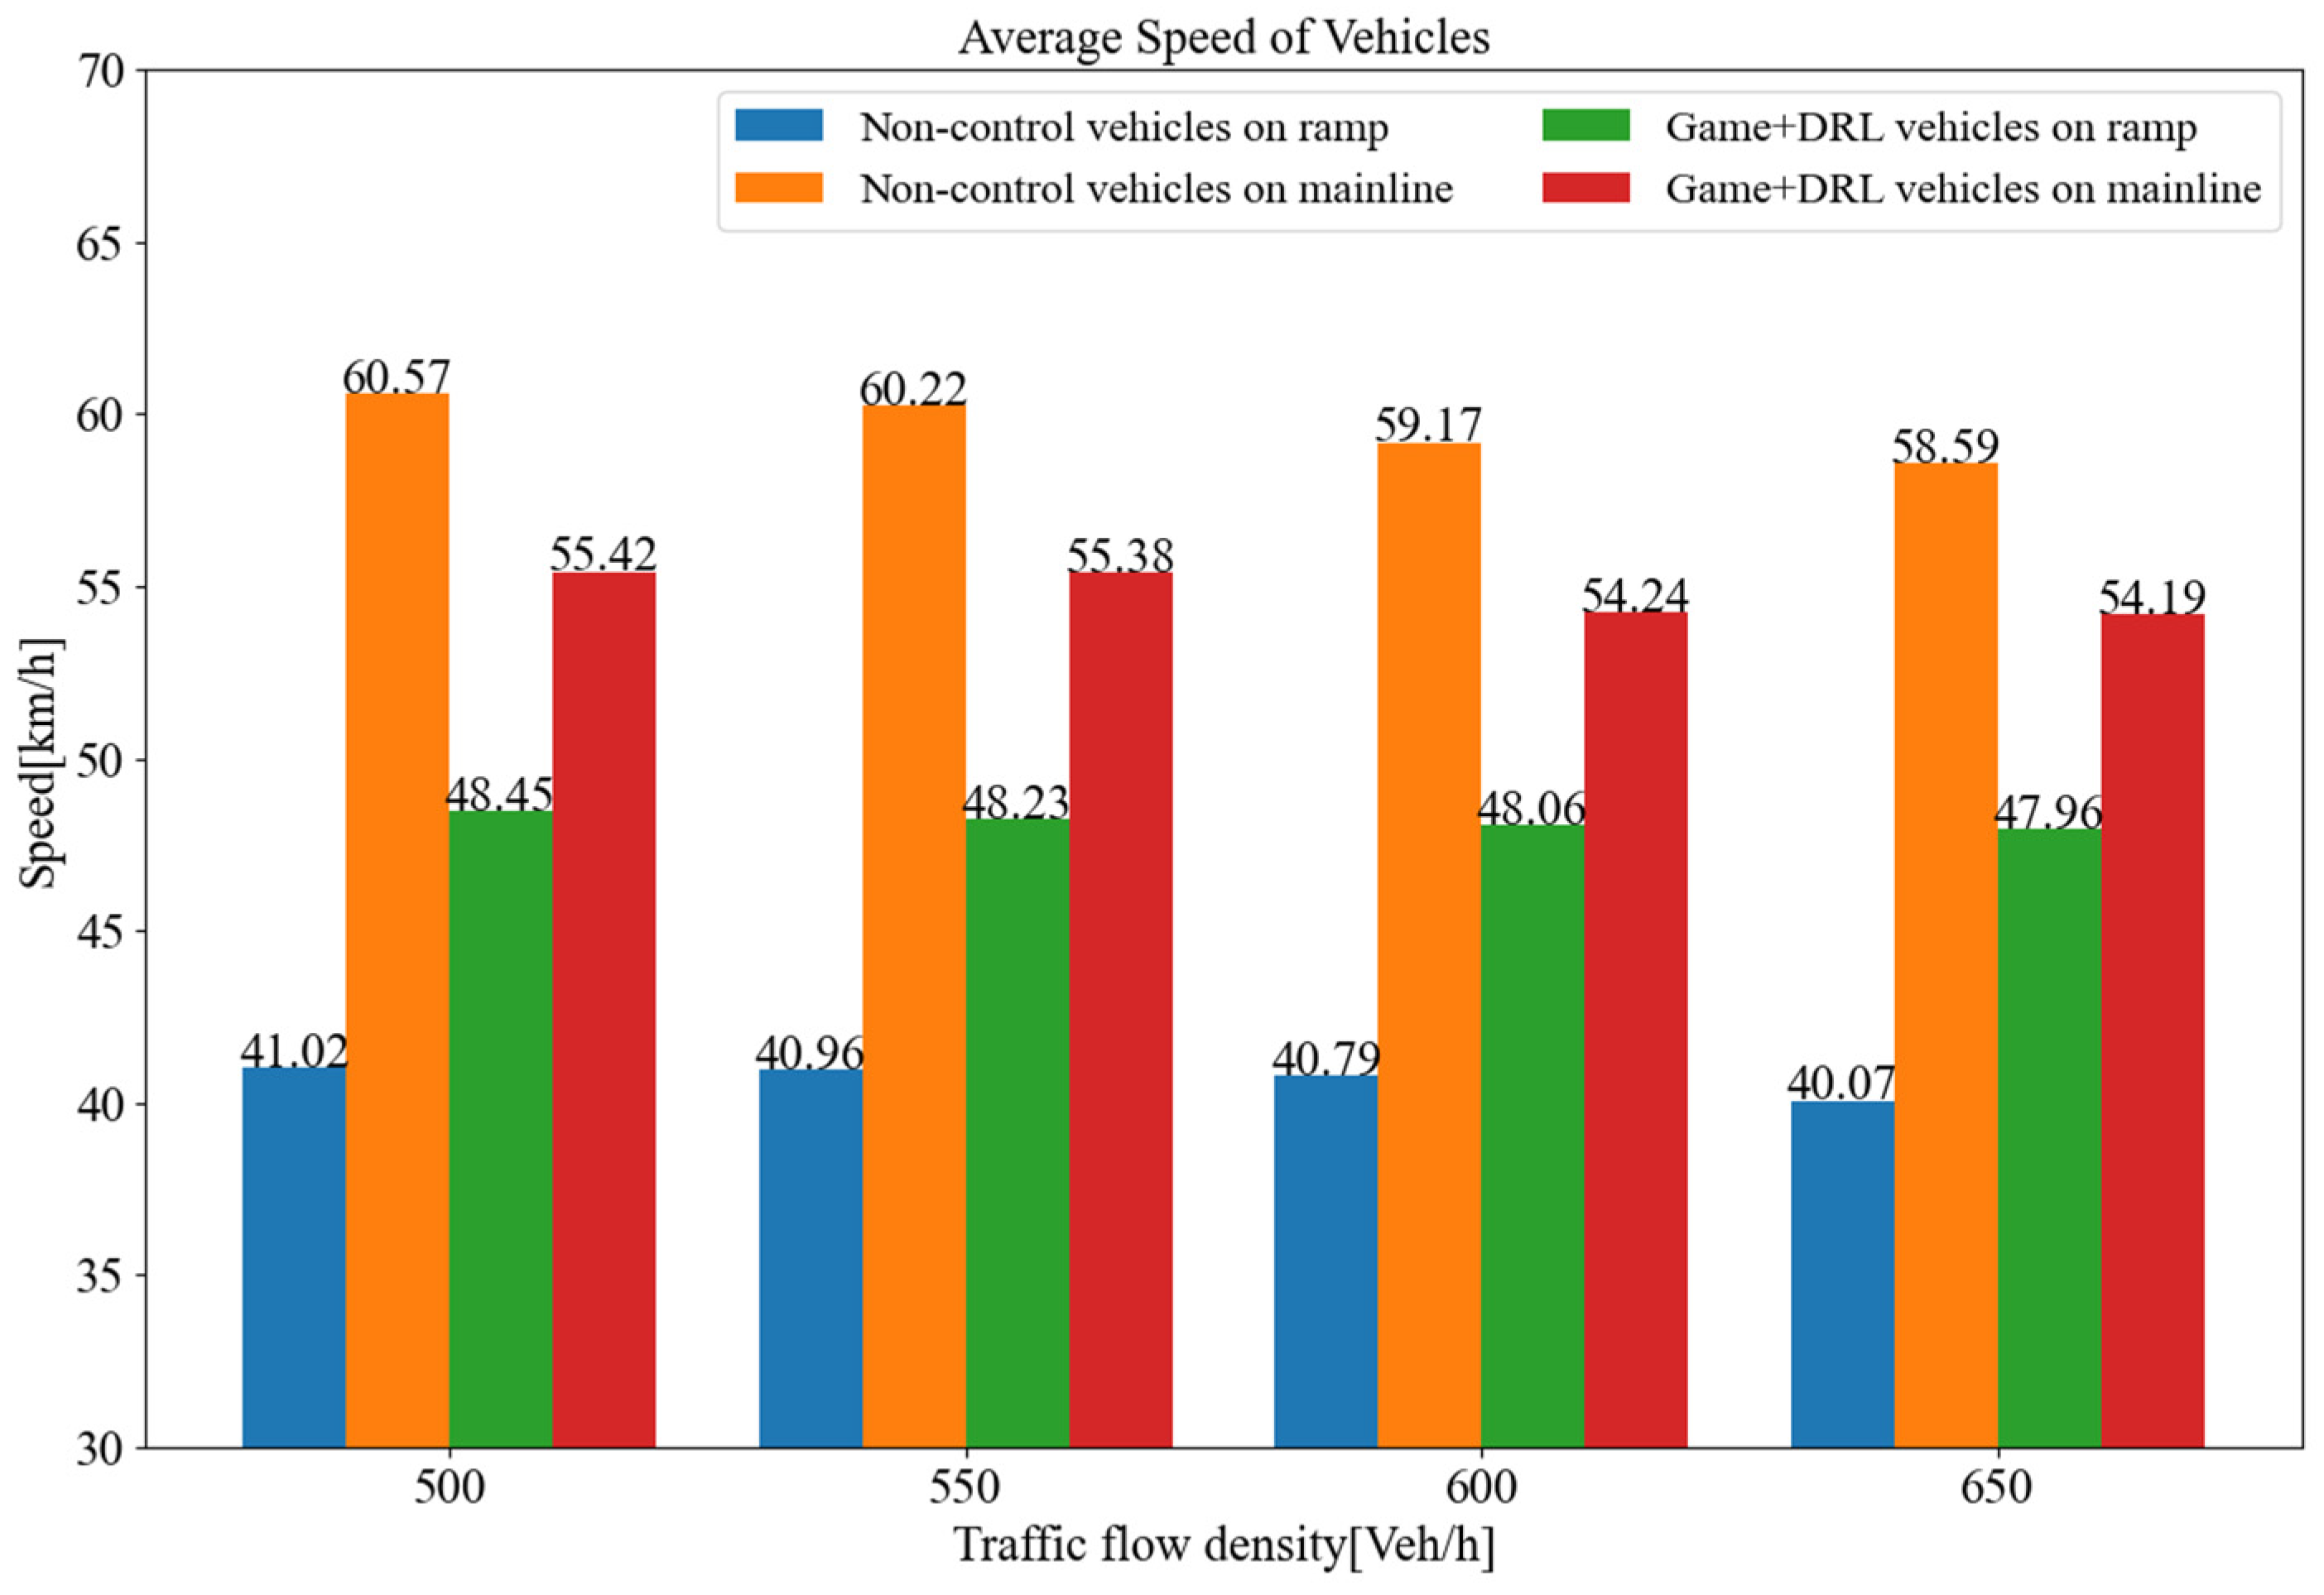
The results of this study indicate that the maximum merging traffic flow that the roadway can withstand without control is approximately 700 vehicles per hour. However, under the control of the decision algorithm proposed, the maximum merging traffic flow is more than 850 vehicles per hour, an increase of about 21.4%. Figure 17 depicts the average speeds attained through the roadway for varying traffic volumes. The results show that the average speed of the merging vehicle is increased by 18.3% when it coordinates with the main-road vehicle by inserting itself in front of it, in comparison to the no-coordination strategy. Although the average speed of vehicles on the main road decreases by approximately 8.1%, the gain in merging vehicles outweighs the loss of main-road vehicles, and there is no reduction in terms of overall efficiency.

Figure 17.
Average driving speed on this roadway under different traffic flows.
5.4. Discussion
This paper proposes a solution to the problem of collaborative merging of CAVs and MDVs on urban expressways, which is mainly reflected in two aspects. Firstly, a decision-making method combining DRL and game theory is proposed. This method refers to the previous research and takes the equilibrium in game theory as the right-of-way allocation mechanism. However, previous studies have not considered how vehicles should act without pure-strategy equilibrium. Therefore, this study simulates the decision-making of MDVs according to the acceleration distribution of different driving styles. Similarly, CAVs randomly select actions from the action space. From the micro and macro simulation experiments herein, it can be clearly observed that without the guidance of strategy, it is difficult for game participants to achieve equilibrium. Therefore, this study provides a new solution for researchers, using DRL methods to guide the game. Because some parameters in previous studies are difficult to obtain, it is difficult to reproduce previous studies when designing comparative experiments. Therefore, this paper compares the pure game method with the proposed method. Although the game payoff functions are different from others, the core components are similar, including timeliness, safety, comfort, and economic benefits. To a certain extent, it also simulates the collaborative import method based on the static game. Table 6 counts the merging success rate of on-ramp vehicles (without waiting at the end of the acceleration lane), average speed, average minimum car following distance, and speed fluctuation under different control methods. Compared with no control, the merging method based on game theory has a higher success rate, which is mainly due to the estimation of MDVs’ driving intentions. It clearly reflects that the proposed method can quickly determine the cooperation degree of the MDVs and avoid the discomfort caused by too many game attempts. At the same time, combined with driving style recognition technology, it can make corresponding decisions for manual driving vehicles with different driving styles.
Table 6.
Simulation results of mixed traffic flow.
As for driving style recognition, the biggest innovation of this paper is to explore the relationship between style and vehicle position, which was completely ignored in previous studies. The differences in driving styles in different regions can be clearly seen from both monitoring video and clustering results. In addition, another type of research on individual driving style modeling is not applicable to this study. For example, reference [13] uses inverse reinforcement learning to model a special manually driven vehicle. Although this can better simulate the behavior of each driver, the style of each driver is different. And, the decisions made by drivers in the same scene are similar but not exactly the same. It is also difficult for roadside units to obtain historical information on the same vehicle passing through the road many times. Therefore, there are still many problems to be solved in the decision-making modeling for specific drivers. But, style clustering methods can greatly simplify this process.
6. Conclusions and Future Works
This paper presents a cooperative flexible merging decision model grounded in incomplete information game theory, tailored to address the intricacies of mixed-traffic scenarios on urban freeways. It delves into the diverse driving styles of MDVs, their impact on the payoff function during the game process, and the spatial–temporal inconsistencies in driving styles that lead to varied responses from MDVs to CAV merging requests.
A driving style clustering method leveraging the Gaussian Mixture Model (GMM) is established, alongside a Support Vector Machine (SVM) model that identifies driving styles and adjusts the gain function. This approach offers a decision support model for merging CAVs, trained on actual data. By integrating DRL algorithms, the model significantly reduces the number of gaming rounds and enhances the smoothness and comfort of the merging process. Simulation experiments demonstrate that the DRL-augmented game model swiftly reaches a decision equilibrium and efficiently adapts to the complexities of urban traffic, outperforming pure game models and those without control.
Despite these advancements, the study acknowledges several limitations. Firstly, while the model captures the inherent uncertainty in drivers’ decision-making, there are discrepancies between the actual decisions of specific drivers and the modeled distribution categories. Future research will delve deeper into individual behaviors. Secondly, the study’s consideration of vehicle types is not exhaustive; upcoming research will focus on modeling the behavior of specific vehicle types, such as trucks. Lastly, the current study assumes the perfect execution of decisions by vehicles, overlooking their maneuverability. Future work will incorporate the design of high-precision controllers to address this aspect. By addressing these limitations, future research can further refine the merging decision model, leading to more robust and realistic applications in complex traffic environments.
Author Contributions
Conceptualization, Z.D., H.X., S.Y. and K.L.; methodology, Z.D., H.X., P.Z., S.Y. and J.W.(Jiangbo Wang); software, P.Z. and Y.L.; validation, Z.D., P.Z., S.Y. and K.L.; formal analysis, P.Z. and S.Y.; investigation, Z.D., P.Z. and K.L.; resources, Z.D., S.Y. and Y.L.; data curation, S.Y. and Y.L.; writing—original draft preparation, Z.D. and P.Z.; writing—review and editing, J.W. (Jiao Wang) and K.L.; visualization, P.Z., S.Y. and Y.L.; supervision, Z.D. and K.L.; project administration, Z.D.; funding acquisition, Z.D. All authors have read and agreed to the published version of the manuscript.
Funding
The research leading to these results received funding from the Major Science and Technology Projects of Tianjin under Grant Agreement No. 21ZXJBGX00030.
Institutional Review Board Statement
Not applicable.
Informed Consent Statement
Not applicable.
Data Availability Statement
The data that support the findings of this study are included in the article and have been referenced accordingly.
Conflicts of Interest
Authors Zhibin Du, Shoutong Yuan and Yupeng Li were employed by the CATARC Intelligent and Connected Technology Co., Ltd. The remaining authors declare that the research was conducted in the absence of any commercial or financial relationships that could be construed as a potential conflict of interest.
References
- Wan, X.; Jin, P.J.; Gu, H.; Chen, X.; Ran, B. Modeling Freeway Merging in a Weaving Section as a Sequential Decision-Making Process. J. Transp. Eng. Part A Syst. 2017, 143, 05017002. [Google Scholar]
- Choudhury, C.F.; Ramanujam, V.; Ben-Akiva, M.E. Modeling Acceleration Decisions for Freeway Merges. Transp. Res. Rec. 2009, 2124, 45–57. [Google Scholar]
- Lu, X.-Y.; Hedrick, K.J. Longitudinal Control Algorithm for Automated Vehicle Merging. In Proceedings of the 39th IEEE Conference on Decision and Control, Sydney, Australia, 12–15 December 2000; Volume 5, pp. 450–455. [Google Scholar]
- Lu, X.-Y.; Tan, H.-S.; Shladover, S.E.; Hedricket, J.K. Implementation of Longitudinal Control Algorithm for Vehicle Merging. In Proceedings of the 5th International Symposium on Advanced Vehicle Control, Ann Arbor, MI, USA, 22–24 August 2000; pp. 25–32. [Google Scholar]
- Yang, C.; Kurami, K. Longitudinal guidance and control for the entry of vehicles onto automated highways. In Proceedings of the 32nd IEEE Conference on Decision and Control, San Antonio, TX, USA, 15–17 December 1993; Volume 2, pp. 1891–1896. [Google Scholar]
- He, X.; Lv, C. Toward personalized decision making for autonomous vehicles: A constrained multi-objective reinforcement learning technique. Transp. Res. Part C Emerg. Technol. 2023, 156, 104352. [Google Scholar]
- el abidine Kherroubi, Z.; Aknine, S.; Bacha, R. Novel Decision-Making Strategy for Connected and Autonomous Vehicles in Highway On-Ramp Merging. IEEE Trans. Intell. Transp. Syst. 2022, 23, 12490–12502. [Google Scholar]
- Lin, Y.; McPhee, J.; Azad, N.L. Anti-Jerk On-Ramp Merging Using Deep Reinforcement Learning. In Proceedings of the 2020 IEEE Intelligent Vehicles Symposium (IV), Las Vegas, NV, USA, 19 October–13 November 2020; pp. 7–14. [Google Scholar]
- Wang, M.; Hoogendoorn, S.P.; Daamen, W.; van Arem, B.; Happee, R. Game theoretic approach for predictive lane-changing and car-following control. Transp. Res. Part C Emerg. Technol. 2015, 58, 73–92. [Google Scholar]
- Chen, W.; Ren, G.; Cao, Q.; Song, J.; Liu, Y.; Dong, C. A Game-Theory-Based Approach to Modeling Lane-Changing Interactions on Highway On-Ramps: Considering the Bounded Rationality of Drivers. Mathematics 2023, 11, 402. [Google Scholar] [CrossRef]
- Liu, J.; Zhao, W.; Wang, C.; Zhou, Y.; Zhang, Z.; Qin, Y. Interactive on-ramp merging decision-making with motion prediction considering merging motivation. Proc. Inst. Mech. Eng. Part D J. Automob. Eng. 2023. [Google Scholar] [CrossRef]
- Fukuyama, S. Dynamic game-based approach for optimizing merging vehicle trajectories using time-expanded decision diagram. Transp. Res. Part C Emerg. Technol. 2020, 120, 102766. [Google Scholar]
- Li, W.; Qiu, F.; Li, L.; Zhang, Y.; Wang, K. Simulation of Vehicle Interaction Behavior in Merging Scenarios: A Deep Maximum Entropy-Inverse Reinforcement Learning Method Combined with Game Theory. IEEE Trans. Intell. Veh. 2024, 9, 1079–1093. [Google Scholar]
- Liu, K.; Li, N.; Tseng, H.E.; Kolmanovsky, I.; Girard, A.; Filev, D. Cooperation-Aware Decision Making for Autonomous Vehicles in Merge Scenarios. In Proceedings of the 60th IEEE Conference on Decision and Control (CDC), Austin, TX, USA, 13–17 December 2021; pp. 5006–5012. [Google Scholar]
- Ding, H.; Di, Y.; Zheng, X.; Bai, H.; Zhang, W. Automated cooperative control of multilane freeway merging areas in connected and autonomous vehicle environments. Transp. B Transp. Dyn. 2021, 9, 437–455. [Google Scholar]
- Xie, Y.; Zhang, H.; Gartner, N.H.; Arsava, T. Collaborative merging strategy for freeway ramp operations in a connected and autonomous vehicles environment. J. Intell. Transp. Syst. 2017, 21, 136–147. [Google Scholar]
- Pei, H.; Feng, S.; Zhang, Y.; Yao, D. A Cooperative Driving Strategy for Merging at On-Ramps Based on Dynamic Programming. IEEE Trans. Veh. Technol. 2019, 68, 11646–11656. [Google Scholar]
- Shi, J.; Li, K.; Chen, C.; Kong, W.; Luo, Y. Cooperative Merging Strategy in Mixed Traffic Based on Optimal Final-State Phase Diagram with Flexible Highway Merging Points. IEEE Trans. Intell. Transp. Syst. 2023, 24, 11185–11197. [Google Scholar]
- Ding, J.; Li, L.; Peng, H.; Zhang, Y. A Rule-Based Cooperative Merging Strategy for Connected and Automated Vehicles. IEEE Trans. Intell. Transp. Syst. 2020, 21, 3436–3446. [Google Scholar]
- Xu, H.; Feng, S.; Zhang, Y.; Li, L. A Grouping-Based Cooperative Driving Strategy for CAVs Merging Problems. IEEE Trans. Veh. Technol. 2019, 68, 6125–6136. [Google Scholar]
- Yang, W.; Dong, C.; Wang, H. A cooperative merging speed control strategy of CAVs based on virtual platoon in on-ramp merging system. Transp. B Transp. Dyn. 2023, 11, 1432–1454. [Google Scholar]
- Hu, X.; Sun, J. Trajectory optimization of connected and autonomous vehicles at a multilane freeway merging area. Transp. Res. Part C Emerg. Technol. 2019, 101, 111–125. [Google Scholar]
- Shi, Y.; Yu, H.; Guo, Y.; Yuan, Z. A Collaborative Merging Strategy with Lane Changing in Multilane Freeway On-Ramp Area with V2X Network. Futur. Internet 2021, 13, 123. [Google Scholar]
- Han, L.; Zhang, L.; Guo, W. Multilane freeway merging control via trajectory optimization in a mixed traffic environment. IET Intell. Transp. Syst. 2023, 17, 1891–1907. [Google Scholar]
- Elander, J.; West, R.; French, D. Behavioral correlates of individual differences in road-traffic crash risk: An examination of methods and findings. Psychol. Bull. 1993, 113, 279. [Google Scholar]
- Woo, H.; Ji, Y.; Tamura, Y.; Kuroda, Y.; Sugano, T.; Yamamoto, Y.; Yamashita, A.; Asama, H. Dynamic state estimation of driving style based on driving risk feature. Int. J. Automot. Eng. 2018, 9, 31–38. [Google Scholar]
- Sysoev, M.; Kos, A.; Guna, J.; Pogačnik, M. Estimation of the driving style based on the users’ activity and environment influence. Sensors 2017, 17, 2404. [Google Scholar] [CrossRef]
- Han, W.; Wang, W.; Li, X.; Xi, J. Statistical-based approach for driving style recognition using Bayesian probability with kernel density estimation. IET Intell. Transp. Syst. 2019, 13, 22–30. [Google Scholar]
- Reason, J.; Manstead, A.; Stradling, S.; Baxter, J.; Campbell, K. Errors and violations on the roads: A real distinction? Ergonomics 1990, 33, 1315–1332. [Google Scholar] [PubMed]
- Taubman-Ben-Ari, O.; Mikulincer, M.; Gillath, O. The multidimensional driving style inventory—Scale construct and validation. Accid. Anal. Prev. 2004, 36, 323–332. [Google Scholar] [PubMed]
- Ishibashi, M.; Okuwa, M.; Doi, S.I.; Akamatsu, M. Indices for characterizing driving style and their relevance to car following behavior. In Proceedings of the SICE Annual Conference, Takamatsu, Japan, 17–20 September 2007; IEEE: Piscataway, NJ, USA, 2007; pp. 1132–1137. [Google Scholar]
- Chen, S.-W.; Fang, C.-Y.; Tien, C.-T. Driving behaviour modelling system based on graph construction. Transp. Res. Part C Emerg. Technol. 2013, 26, 314–330. [Google Scholar]
- Wang, W.; Xi, J.; Chen, H. Modeling and recognizing driver behavior based on driving data: A survey. Math. Probl. Eng. 2014, 2014, 245641. [Google Scholar]
- Chu, D.; Deng, Z.; He, Y.; Wu, C.; Sun, C.; Lu, Z. Curve speed model for driver assistance based on driving style classification. IET Intell. Transp. Syst. 2017, 11, 501–510. [Google Scholar]
- Bellem, H.; Thiel, B.; Schrauf, M.; Krems, J.F. Comfort in automated driving: An analysis of preferences for different automated driving styles and their dependence on personality traits. Transp. Res. Part F Traffic Psychol. Behav. 2018, 55, 90–100. [Google Scholar]
- Van Huysduynen, H.H.; Terken, J.; Eggen, B. The relation between self-reported driving style and driving behaviour. A simulator study. Transp. Res. Part F Traffic Psychol. Behav. 2018, 56, 245–255. [Google Scholar]
- Murphey, Y.L.; Milton, R.; Kiliaris, L. Driver’s style classification using jerk analysis. In Proceedings of the 2009 IEEE Workshop on Computational Intelligence in Vehicles and Vehicular Systems, Nashville, TN, USA, 30 March–2 April 2009; IEEE: Piscataway, NJ, USA, 2009; pp. 23–28. [Google Scholar]
- Wang, W.; Xi, J. A rapid pattern-recognition method for driving styles using clustering-based support vector machines. In Proceedings of the 2016 American Control Conference (ACC), Boston, MA, USA, 6–8 July 2016; IEEE: Piscataway, NJ, USA, 2016; pp. 5270–5275. [Google Scholar]
- Mantouka, E.G.; Barmpounakis, E.N.; Vlahogianni, E.I. Identifying driving safety profiles from smartphone data using unsupervised learning. Saf. Sci. 2019, 119, 84–90. [Google Scholar]
- Zhang, H.; Fu, R. An Ensemble Learning—Online Semi-Supervised Approach for Vehicle Behavior Recognition. IEEE Trans. Intell. Transp. Syst. 2022, 23, 10610–10626. [Google Scholar]
- Hu, Y.; Jin, X.; Wang, Y.; Guo, J.; Zhang, L.; Hu, J.; Lu, Q. Eco-Driving of Connected and Automated Vehicles in Mixed and Power-Heterogeneous Traffic Flow. China J. Highw. Transp. 2022, 35, 15–27. [Google Scholar]
- Van Hasselt, H.; Guez, A.; Silver, D. Deep Reinforcement Learning with Double Q-Learning. In Proceedings of the 30th Association-for-the-Advancement-of-Artificial-Intelligence (AAAI), Conference on Artificial Intelligence, Phoenix, AZ, USA, 12–17 February 2016; pp. 2094–2100. [Google Scholar]
- Schaul, T.; Quan, J.; Antonoglou, I.; Silver, D. Prioritized Experience Replay. In Proceedings of the 4th International Conference on Learning Representations (ICLR), San Juan, PR, USA, 2–4 May 2016. [Google Scholar]
- Suzuki, K.; Nakamura, H. Development and performance evaluation of a video image processing system for traffic flow analysis–traffic analyzer. In Proceedings of the Civil Society Proceedings, Tokyo, Japan, 25 October 2006; pp. 276–287. (In Japanese). [Google Scholar]
- Dou, H.; Liu, Y.; Chen, S.; Zhao, H.; Bilal, H. A hybrid CEEMD-GMM scheme for enhancing the detection of traffic flow on highways. Soft Comput. 2023, 27, 16373–16388. [Google Scholar]
- Chauhan, V.K.; Dahiya, K.; Sharma, A. Problem formulations and solvers in linear SVM: A review. Artif. Intell. Rev. 2019, 52, 803–855. [Google Scholar]

Disclaimer/Publisher’s Note: The statements, opinions and data contained in all publications are solely those of the individual author(s) and contributor(s) and not of MDPI and/or the editor(s). MDPI and/or the editor(s) disclaim responsibility for any injury to people or property resulting from any ideas, methods, instructions or products referred to in the content. |
© 2024 by the authors. Licensee MDPI, Basel, Switzerland. This article is an open access article distributed under the terms and conditions of the Creative Commons Attribution (CC BY) license (https://creativecommons.org/licenses/by/4.0/).