Abstract
In assisted reproductive technology, in vitro fertilization involves cultivating embryos in an artificial environment, often yielding lower-quality embryos compared to in vivo conditions. This study investigated core body temperature (CBT) fluctuations in mice during early pregnancy. Their CBT was measured with a high temporal resolution to identify the optimal thermal conditions during the first five days post-fertilization, aiming to improve in vitro culture conditions. Data were collected from 12 female mice, with 8 becoming pregnant, using temperature loggers every minute for 11 days. Data analysis focused on trends, circadian rhythms, frequency components, and complexity using multiscale entropy (MSE). The results for the pregnant mice showed a mean CBT increase from 37.23 °C to 37.56 °C post-mating, primarily during the light phase, with a significant average rise of 0.58 °C. A Fourier analysis identified dominant 24, 12, 8, and 6 h components, with the 24 h component decreasing by 57%. Irregular fluctuations decreased, and MSE indicated increased complexity in the CBT time series post-mating. These results suggest that reducing diurnal temperature variations and maintaining a slightly elevated mean CBT of approximately 37.5 °C, with controlled minor fluctuations, may enhance embryo quality in pregnant mice. This study provides a reference for temperature regulation in embryo culture, improving embryo quality by aligning in vitro conditions with the natural thermal environment of the fallopian tubes.
1. Introduction
In assisted reproductive technology (ART), in vitro fertilization (IVF) involves cultivating embryos in an artificial environment outside the body (in vitro) for approximately five days before implantation into the mother’s womb. Embryos developed in vitro are generally considered to be of lower quality than those developed in the natural environment of the fallopian tube (in vivo). Although IVF represents a significant advancement in infertility treatment, the pregnancy rate following a single fresh embryo transfer remains relatively low, at 21.7% in Japan in 2021 [1]. This low rate may be attributed, at least in part, to the lower quality of embryos resulting from in vitro culture [2]. While it is challenging to determine the exact quality differences between in vivo and in vitro-developed human embryos, a study on mouse embryos reported a 53% reduction in blastocyst cell numbers with in vitro culture [3]. Consequently, one of the most significant challenges in ART is developing new culture methods to improve embryo quality.
The fundamental approach to improving even today’s highly optimized culture methods is to replicate the internal environment of the body as closely as possible [4]. Consequently, it is recommended to use a culture medium similar to oviductal fluid and to incubate the embryos under hypoxia at a temperature of 37 °C, which is believed to be the deep-body temperature [2]. Particularly important here is that in embryo culture, any environmental change is considered a stressor, resulting in accumulating embryo damage. Therefore, minimizing the number of times the incubator door is opened and closed and rapidly performing ART procedures outside the incubator is paramount. This is because incubator-based in vitro culture systems are fundamentally designed to minimize temperature fluctuations, with the actual fluctuation range typically maintained within ±0.1 °C. However, opening the door for 10 s results in a temperature drop of approximately 5 °C in air-jacketed systems and 0.7 °C in water-jacketed systems, with recovery times of 3 min and 30 min, respectively [5]. In contrast, the natural environment for embryonic development in the fallopian tube is subject to fluctuations, which is an essential distinction from in vitro culture and is typically considered a phenomenon to be avoided, even in the most optimized culture methods. Nevertheless, it is remarkable that the dynamic physiology of the fallopian tube creates an optimal and potentially stress-free environment for embryos.
It is widely recognized that a temperature gradient is present within the fallopian tubes [6,7]. Additionally, the core body temperature (CBT) fluctuates over time [8,9,10]. Therefore, it has been postulated that temperature fluctuations during transport through the fallopian tubes promote oocyte development [6,7,11,12]. Neelke et al. conducted experiments with human embryos in which the culture temperature was varied in 24 h cycles to mimic the circadian rhythm and concluded that this approach did not improve embryo quality [12]. Moriyama et al. examined how culture temperature fluctuations (37/35.5 °C cycled over 24 h at 12 h intervals in the low-temperature group and 38.5/37 °C in the high-temperature group) influenced mouse embryo development [11]. The authors concluded that mouse embryo development in the lower-temperature group was consistently negatively affected, but not in the higher-temperature group. The results of these studies seem to indicate that a constant 37 °C static culture environment is optimal. However, a closer examination of the data revealed that the percentage of blastocysts rated morphologically good in the control group was 14.5%, whereas the percentage was lower in the low-temperature variation (1.9%) but highest in the high-temperature variation (26.4%). In the context of human ART, the percentage of embryos classified as good is of greater importance than the overall change in the percentage of embryos classified as fair or poor. This is because elective single embryo transfer, a key strategy for reducing the risk of multiple pregnancies, is designed to transfer only one embryo that has been evaluated to be of the highest quality. Otherwise stated, the results indicated that rather than keeping the temperature constant, replicating the physiological temperature fluctuations observed within the fallopian tube during incubation may potentially promote the development of relatively high-quality embryos. Indeed, several studies have demonstrated that mimicking the mechanical stress within the fallopian tube utilizing microfluidics technology, i.e., applying a dynamic stimulus rather than avoiding it, improves embryo quality across various species, thereby indirectly supporting this hypothesis [3,13,14,15,16,17].
However, these studies have not considered the actual fluctuations in maternal temperature that occur during early embryonic development, specifically during the first 5 days after fertilization. To date, far too little attention has been paid to the measurement and analysis of high-temporal-resolution CBT data, particularly regarding the varying fluctuations following successful mating and the subsequent pregnancy. Several studies have reported that pregnancy in mice is associated with significant changes in CBT, including an increase in mean temperature and a reduction in the circadian rhythm amplitude [9,18,19]. Smarr et al. demonstrated that these changes can be detected within 14 h of initial pairing [9]. Nevertheless, the characteristic features of the changes in the frequency component and the irregular variability of CBT due to pregnancy remain poorly understood.
In the present study, the high temporal CBT of female mice was measured to analyze the distinctive patterns during early embryonic development, specifically the first five days after fertilization. The extracted characteristic features, including trends, periodicity, irregular variation, and complexity, were compared for the pre- and post-mating periods. By uncovering the characteristic features of CBT fluctuation, this study aims to provide a reference for temperature fluctuations in in vitro culture.
2. Materials and Methods
Four-week-old SPF Jcl:ICR mice were purchased from CLEA Japan, Inc. (Shizuoka, Japan). All animal procedures were approved by the Animal Care and Use Committee at the College of Engineering, Nihon University (approval number AP20CEB001-1). The mice were maintained on a 12 h light/dark cycle, with the lights turning on at 6:00 am. The sampling times were defined relative to this start time. The mice were allowed to acclimate to the laboratory for two weeks before the temperature logger was implanted. After recovering from surgery for one week, the stage of the estrous cycle was monitored via daily cytological examination of vaginal smears for 3 weeks. Consequently, ten-week-old pro-estrous animals were left overnight with ten-week-old males. Three days prior to the onset of mating behavior, the male mice were housed individually, with one mouse per cage (W182 mm × D260 mm × H128 mm), while the females were maintained in a social group setting with five mice per cage (W218 mm × D320 mm × H151.5 mm). For both groups, aspen chips (CL-4169, CLEA Japan Inc., Tokyo, Japan) were used for bedding. Mating was confirmed by the presence of a vaginal plug the following morning, designated as one day post-mating (i.e., the first day of pregnancy). The pregnant mice were kept together in one cage (less than five mice in a cage) with plenty of chips for bedding and nesting. The mice were kept under controlled air conditions (ambient temperature, 23 ± 0.2 °C; humidity, 50 ± 2%) using an incubator (V-2100G, Atom Medical Corporation, Tokyo, Japan). Food (CLEA Rodent Diet CE-2, Clea Japan Inc., Tokyo, Japan) and water were available ad libitum.
2.1. Core Body Temperature Data Collection
Data were collected from 12 female mice, of which eight were pregnant (designated as the pregnant group). Four exhibited visible vaginal plugs but did not become pregnant (designated as the non-pregnant group).
Following hair removal and disinfection, an 8 mm median incision was made, through which an ultra-small temperature logger (6 mm × 17 mm, weighing 1 g, DST Nano-T, Star-Oddi Ltd, Gardabaer, Iceland) was implanted into the peritoneal cavity and subsequently sutured under medetomidine–midazolam–butorphanol anesthesia. Throughout the surgery, the animals were placed on a heating pad set to 35 °C. Five to ten minutes after atipamezole administration for anesthetic reversal, all the mice resumed normal locomotion without exhibiting wound licking or self-injury. The mice underwent one week of post-surgery recovery before smearing for the estrous cycle stage. Data recording using the temperature loggers was initiated 5 days prior to pairing with the males. At this stage, it was confirmed that the baseline body temperature was not abnormally elevated. The temperature loggers recorded CBT every minute with an accuracy of 0.1 °C and were retrieved 10 days after mating. This procedure was conducted in parallel with the retrieval of the fetus to confirm pregnancy. The number of fetuses ranged from 8 to 13. Data were downloaded from each logger using the Mercury software package provided by the manufacturer (version 5.90, Star-Oddi). The final datasets comprised 11 days in total, with 5 days allocated to the pre-mating period, 1 day to the mating window, and the remaining 5 days to the post-mating period for both the pregnant and non-pregnant mice (Figure 1). The temperature loggers were provided with calibration certificates. Additionally, we verified the temperature calibration using a temperature calibration bath and a high-precision temperature sensor (APT-100, Anritsu Meter Co., Ltd., Tokyo, Japan).
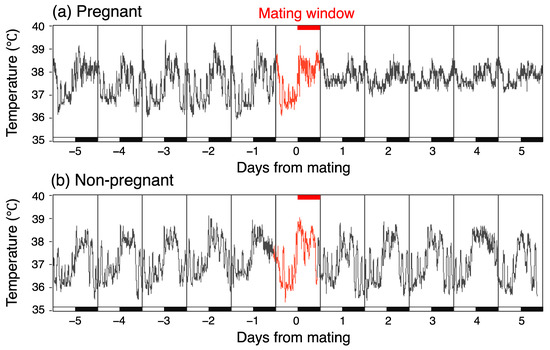
Figure 1.
Altered temperature fluctuations in pregnant mice after mating, but unchanged in non-pregnant mice. Light/dark bars indicate the light cycle.
2.2. Data Analysis
2.2.1. Trend Analysis
The data trends were analyzed by averaging the CBT over the pre- and post-mating periods, each spanning five days. Additionally, considering that the mice exhibited nocturnal rhythms, with rest occurring during the light phase and activity during the dark phase, the data were analyzed separately for the light and dark phases.
2.2.2. Frequency Analysis
We performed a frequency analysis of mating-related changes by decomposing the original CBT time series into the fundamental frequency components of a 24 h period and its harmonics. Using the partial sum of the basic Fourier series, as detailed in standard textbooks, we derived 10th-order approximation curves (Figure 2, red line) and plotted the Fourier amplitude spectra based on the values of each coefficient.
2.2.3. Irregular Variation Analysis
We investigated the changes in the irregular variation of CBT associated with mating. The magnitude of the irregular variation was calculated as the standard deviation of the irregular time series, which was extracted by subtracting the Fourier approximation from the original data (Figure 2, bottom graph).
2.2.4. Complexity Analysis
The complexity of the CBT time series was measured using multiscale entropy (MSE) analysis [20]. MSE analysis measures the complexity of systems across multiple time scales, which is particularly useful for physiological data [21,22]. It improves upon traditional single-scale entropy measures by incorporating correlations over multiple spatiotemporal scales, providing a more comprehensive assessment of signal complexity. MSE has been applied to various physiological signals, including heart rate variability, demonstrating its ability to distinguish between healthy subjects and those with congestive heart failure [21,22]. Complexity analysis has also been employed to examine CBT time series. In critically ill patients, this analysis has become a valuable prognostic tool. Studies have demonstrated that reduced complexity in temperature curves is associated with poorer clinical outcomes and increased mortality in patients with multiple organ failure [23,24,25].

Figure 2.
Fourier approximation and subtraction of irregular variation in CBT.
Figure 2.
Fourier approximation and subtraction of irregular variation in CBT.

MSE is calculated through two distinct steps: (1) a coarse-graining procedure to derive a set of time series representing the system dynamics on different time scales, and (2) computation of the sample entropy for each coarse-grained time series.
Given an N-point time series , consecutive coarse-grained time series were constructed by averaging successively increasing numbers of data points in non-overlapping windows following Equation (1):
where is the scale factor and . For scale , the coarse-grained time series is simply the original time series. Sample entropy was then calculated for each coarse-grained time series and plotted as a function of the scale factor, . Changes in MSE for the five days pre- and post-mating were compared between the pregnant and non-pregnant groups.
2.2.5. Statistics
Assuming a SD of 0.5 °C and a mean difference of 0.5 °C between pre- and post-mating, seven mice were required with 80% power and a one-sided of 0.05. Anticipating at least a 50% pregnancy rate, a total of 14 mice were planned for this study. In alignment with Russell and Burch’s 3Rs, the experiment was concluded once the number of pregnant mice exceeded seven. For statistical comparisons of populations, significant differences were determined using the paired Student’s t-test. All analyses were performed using LabVIEW 2023 Q3 (National Instruments, Inc., Austin, TX, USA) and Python 3.10.
3. Results
3.1. Core Body Temperature (CBT) Trends
In the pregnant group, the mean CBT was 37.23 °C (SD = 0.68) during the five days before mating, representing the normal mean CBT, and 37.56 °C (SD = 0.42) for the first five days after mating. In contrast, in the non-pregnant group, the mean CBT remained constant at 37.28 °C throughout both periods, with slightly different SD values of 0.70 °C before mating and 0.74 °C after mating. Consequently, there was a temperature increase of 0.33 °C in the pregnant group. To investigate the increase in CBT rigorously, we conducted separate comparisons for the light and dark phases. Figure 3 illustrates the mean CBT value variation over the day, separated into light and dark phases. In the pregnant group, the CBT exhibited a notable increase during the light phase following mating. Specifically, the temperature increased from 36.84 °C on the day prior to mating to 37.41 °C on the day following mating. This apparent increase in temperature was not observed during the dark phase; instead, a transient increase was noted on the day of mating. In the non-pregnant group, no discernible temperature trend was observed between the pre- and post-mating periods in either phase. Instead, a transient decrease in temperature was demonstrated one day after mating during the dark phase, followed by a similar decrease during the light phase.
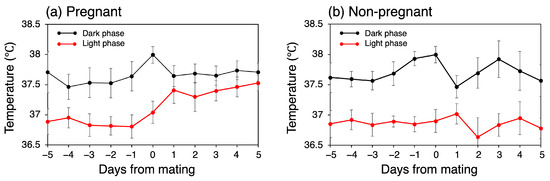
Figure 3.
Trends in daily mean CBT during dark and light phases.
The mean CBTs for each mouse over the five-day pre- and post-mating periods are presented in Figure 4. During the light phase, the mean CBT for all the mice in the pregnant group was 36.84 °C (SD = 0.15) before mating and 37.42 °C (SD = 0.15) after mating, representing a 0.58 °C increase (p < 0.001). In contrast, the mean CBT for all the mice in the non-pregnant group was 36.87 °C (SD = 0.11) before mating and 36.84 °C (SD = 0.17) after mating, representing no significant change or a slight decrease. No consistent trend in CBT variation was observed in either group during the dark phase (p = 0.07 for the pregnant group).
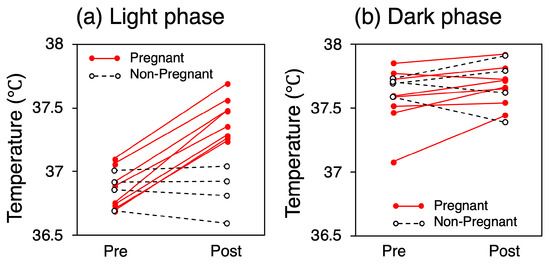
Figure 4.
Mean CBT for each mouse over the five-day pre- and post-mating periods.
3.2. Fourier Analysis
The rise in light phase CBT, along with the decrease in diurnal variation after successful mating, was also evident in the Fourier amplitude spectra (Figure 5). The 10th-order Fourier approximation demonstrated an excellent ability to reproduce the original temperature waveform (Figure 2). Nevertheless, the transient increase observed during the light phase could not be approximated and could not be reproduced, even with n = 100. The Fourier amplitude spectra of both pre- and post-mating periods spanning 5 days are shown in Figure 5. The amplitude of the frequency components was found to be high for a range of frequencies between f to 4f, where the frequency f represents the fundamental frequency of the 24 h periodic component. Following successful mating, the components from f to 3f exhibited a notable decline, with the most pronounced reduction observed in the fundamental 24 h cycle component, which significantly decreased by 57% to 0.24 °C (SD = 0.05) (p < 0.01, Figure 5a). After mating, the amplitudes of 2f and 3f were 0.15 °C (SD = 0.06) and 0.11 °C (SD = 0.07), respectively, whereas the amplitude of 4f remained unaltered at 0.17 °C (SD = 0.08), which closely approximates that of f. In the non-pregnant group, no change in the Fourier amplitude spectra was observed between the pre- and post-mating periods (Figure 5b).
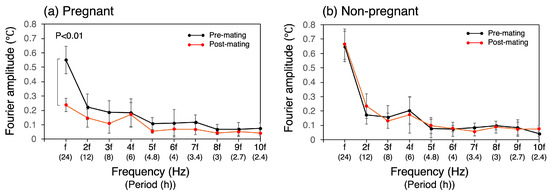
Figure 5.
Fourier amplitude spectrum of CBT. Fundamental frequency, f, corresponds to the frequency of the 24 h cycle. The bracketed notation on the horizontal axis denotes the corresponding period.
3.3. Irregular Variation
A comparison of the standard deviation of the irregular variations is shown in Figure 6. In the pregnant group, all showed a decrease in the standard deviation, averaging a reduction of 0.13 °C. The average standard deviation was 0.41 °C (SD = 0.05) before mating and 0.28 °C (SD = 0.07) after mating (p < 0.001). In the non-pregnant group, however, no consistent trend in variance change was observed.
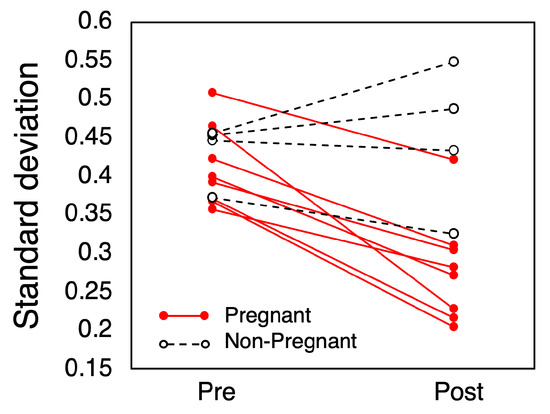
Figure 6.
Standard deviation of irregular variations in CBT.
3.4. Multiscale Entropy (MSE) Analysis
Figure 7 presents the changes in MSE of the CBT time series pre- and post-mating for both the pregnant and non-pregnant groups. In all groups, the sample entropy increased with the scale factor. In the pregnant group, the sample entropy increased across all scale factors and was statistically significant from scale factors 1 to 11. The sample entropy increased by 122%, with the most significant increase observed at a scale factor of 3. In contrast, the non-pregnant group showed no change in the MSE.
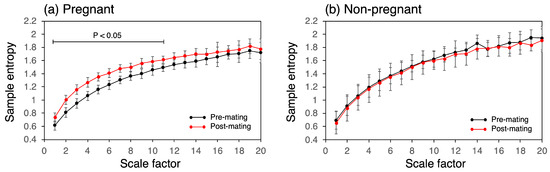
Figure 7.
MSE analysis of CBT time series showing increases in sample entropy between the pre- and post-mating periods in the pregnant group at different scale factors.
4. Discussion
This study aimed to characterize the fluctuations in CBT of mice in early pregnancy, considered a close proxy for the fallopian tube, which is recognized as an optimal environment for early embryogenesis. Specifically, our study investigated temperature patterns in the initial five days post-fertilization to identify distinct profiles that could serve as benchmarks for regulating incubator temperatures. The main findings of this study are as follows:
- The mean CBT for the five days before mating was 37.23 °C in the pregnant group and 37.28 °C in the non-pregnant group, aligning with the standard CBT typically reported in mice. Furthermore, no abnormal behaviors were observed, and none of the mice showed signs of illness, suggesting that implanting the temperature loggers did not negatively impact their well-being.
- The mean CBT of the pregnant mice exhibited a significant increase from 37.23 °C to 37.56 °C, indicating a rise of 0.33 °C. This change was observed over a 10-day period, encompassing the five days prior to mating and the five days following mating.
- Examining the circadian rhythm of CBT, no changes were observed during the dark phase. However, during the light phase, all pregnant mice exhibited an increase in CBT, with a statistically significant average rise of 0.58 °C.
- Consequently, the amplitude of the CBT circadian rhythm decreased from 0.75 °C to 0.27 °C, with mean temperatures of 37.42 °C during the light phase and 37.69 °C during the dark phase.
- The Fourier amplitude spectra analysis revealed that the CBT rhythm had the largest 24 h component, followed by significant 12, 8, and 6 h components. In the pregnant mice, the 24 h component showed the most substantial and statistically significant amplitude decrease of 57%, reducing the amplitude to 0.24 °C. The amplitudes of the 12 and 8 h components were 0.15 °C and 0.11 °C, respectively, while the 6 h component remained unaltered at 0.17 °C.
- All the pregnant mice showed a statistically significant decrease in the variability of the irregular fluctuation component, resulting in a standard deviation of 0.28 °C. However, no such reduced-variability trend was observed in the non-pregnant group.
- In the pregnant mice, the sample entropy increased across all the scales (statistically significant from scale factors 1 to 11), whereas in the non-pregnant mice, no changes in the complexity of CBT variability were observed.
4.1. Temperature Increase Post-Mating
The mean CBT showed a significant increase from 37.23 °C pre-mating to 37.56 °C post-mating, indicating a 0.33 °C elevation. This finding is consistent with Gamo et al., who reported a 0.36 °C rise in the daily mean CBT during the first five days after mating [18]. Similarly, Wharfe et al. observed an increase of approximately 0.6 °C in the MESOR using the cosinor analysis [19]. A slightly larger temperature increase may have manifested were it not for the intermittent arousal and subsequent CBT rise observed during the light phase in Figure 1. In mice, the corpus luteum does not fully develop during the normal estrous cycle; full development occurs only when the female is either bred or becomes pseudopregnant as a result of cervical stimulation [26]. Similarly, it is well established that in humans, progesterone produced by the corpus luteum after ovulation leads to a slight increase in basal body temperature by approximately 0.3–0.6 degrees Celsius. The observed rise in mean CBT may be attributed to the formation of a functional corpus luteum following mating. Consequently, the results of this study suggest that an average temperature of approximately 37.5 °C during early embryogenesis within five days post-fertilization is optimal. This is supported by the literature, which often selects 37.5 °C for mouse embryo culture. However, Walters et al. found that the highest blastocyst developmental rate occurred at 37.0 °C when the culture temperature varied between 35.0 °C and 37.5 °C at 0.5 °C intervals [27]. In humans, 37.0 °C is generally considered to be the optimal temperature for early embryogenesis, as evidenced by its use in maintaining the culture environment. Despite these considerations, Hong et al. propose that temperatures of 36.0 °C and 37.0 °C are equally effective for human embryos [28], indicating that there is still no consensus on an optimal temperature.
4.2. Circadian Rhythms and Embryo Development
Fluctuations in circadian rhythms may exert a significant influence on embryo development. The pregnant mice exhibited a reduction in daily CBT variations following mating, with temperatures averaging 37.42 °C during the light phase and 37.69 °C during the dark phase, narrowing the daily difference by 63% to 0.27 °C. This reduction was primarily attributable to the increased temperatures observed during the light phase. These results agree with the findings of other studies, in which the increase in CBT during the light phase was reported to be 0.49 °C in pregnant mice by Smarr et al. and approximately 0.7 °C by Gamo et al. The results indicate that pregnancy elevates CBT by 0.5 °C to 0.7 °C during the light phase. Moriyama et al. studied the development of mouse embryos by alternating incubation temperatures between 37.0 °C and 38.5 °C every 12 h, presenting data suggesting that temperature fluctuations during incubation may enhance the development of higher-quality embryos. Notably, their study considered the premise of the circadian cycle of mammalian species in their normal CBT. In contrast, mice in early pregnancy exhibit a reduced diurnal rhythm distinct from that of non-pregnant mice. It is therefore postulated that reducing the temperature difference to approximately 0.3 °C, which is closer to in vivo temperature fluctuations than a 1.5 °C difference, may further enhance embryo quality.
4.3. Fourier Analysis of Temperature Fluctuations
As shown in Figure 5, the circadian rhythm comprises a 24 h cycle and its harmonic components. Notably, in pregnant mice, the six-hour cycle component contributes significantly. Smarr et al. observed a broad increase in power across frequencies, with a large peak at a three-hour periodicity in successful pregnancies [9]. However, this pattern was not replicated in the present study. These harmonic components, known as ultradian rhythms [29,30], suggest that future research should explore the relationship between ultradian rhythms in body temperature, their combined temperature patterns, and embryo quality.
4.4. Variability and Complexity
In general, sample entropy, an indicator of complexity, decreases as the magnitude of noise decreases for a periodic time series [31,32]. Conversely, in all the pregnant mice, the variability of irregular fluctuations decreased (Figure 6) while the MSE increased (Figure 7) following successful mating. Although the physiological mechanism behind this phenomenon is unknown, this is the first study to suggest that changes in irregular fluctuation components may potentially indicate pregnancy. It remains unclear whether irregular fluctuations have the potential to promote embryonic development. Therefore, future research should investigate the impact of CBT irregularities on embryo quality and explore how to replicate these irregular fluctuations based on the variability and complexity demonstrated in this study.
4.5. Limitations and Future Studies
This study successfully extracted characteristic CBT features in pregnant mice over the five days following successful mating, providing reference values for temperature variations in in vitro culture. However, because body temperature varies by individual, anatomical site, and over time, it must be carefully considered whether these temperature fluctuations are optimal for all embryos. Additionally, this study had several limitations, which are discussed below.
First, transient increases in CBT, frequently observed in the light period (Figure 1), were analyzed not as random and stochastic events but as part of irregular fluctuations and complexity. These increases occurred approximately three times during the light phase and were not approximated by the Fourier analysis (Figure 2). Awakenings during sleep may cause a transient increase in CBT. While transient temperature fluctuations are considered detrimental to embryonic development, it remains unclear whether these transient temperature rises in vivo adversely affect embryonic development. Moreover, while door openings can cause a drop in culture temperature, CBT does not drop but increases inversely. Therefore, rapid decreases in CBT may negatively impact embryonic development, whereas rapid increases in CBT may not necessarily have a negative effect.
Second, this study assumes a uniform intraperitoneal temperature. However, it is known that there is a temperature gradient within the fallopian tubes and that the temperature changes during tubal transport may also impact embryonic development. The isthmus is consistently cooler than the ampulla, with the temperature difference between these regions being most pronounced during ovulation. Rabbits have evidenced a temperature difference of 1.4 °C [6], while differences of 0.2 °C to 1.6 °C have been reported in pigs [7]. Garcia–Martinez et al. conducted experiments using pig oocytes to replicate this temperature gradient within the fallopian tubes. They cultured the oocytes at 37.0 °C, simulating the ampulla for 20 h post-fertilization, then they increased the temperature to 38.5 °C—a standard for pig embryo culture—until 168 h post-fertilization. This protocol caused the blastocyst formation rate to increase 1.6-fold, although no differences were observed in morphological quality or blastocyst cell numbers [33]. These findings suggest that the temperature gradient within the fallopian tube is greater than the circadian temperature variation, indicating the need to incorporate periodic circadian rhythms and also a trend of increasing temperature into in vitro culture conditions.
Third, the sample size must be increased to enhance the mean accuracy. A larger sample size would also strengthen the statistical tests by comparing changes in mean CBT and standard deviations. However, since all the pregnant mice in this study demonstrated an increase in their mean CBT during the light phase and a decrease in standard deviation, and the number of mice tested met the minimum sample size, these trends appear to be consistent in pregnant mice. A statistical test between the pregnant and non-pregnant groups would be possible with a larger sample size.
Fourth, the precise timing of fertilization remains unknown. While mating occurred between 6 PM and 6 AM in the dark phase, the exact times of mating and subsequent fertilization were not determined, resulting in a possible 12 h discrepancy. Given that embryos undergo cell division approximately once a day, the phase difference between circadian temperature fluctuations and the stages of cell division could be significant. In future studies, it will be important to adjust the in vitro culture temperature to align with the stages of cell division.
Finally, we will discuss the potential application of the results of this study to the in vitro culture of human embryos. Coyne et al. collected CBT data from four female subjects using an ingestible temperature sensor and demonstrated that the mean CBT was 37.08 °C in the follicular phase and 37.39 °C in the luteal phase [10]. These values are higher than the normal human body temperature of 36.59 °C reported in a systematic review [34]. In the present study, the baseline core CBT of mice was found to be 37.23 °C, which falls between the follicular and luteal phases of human CBT. However, subsequent observations revealed that the mean CBT increased to 37.56 °C following successful mating. Coyne et al., also reported that circadian rhythms in humans produce temperature differences of 0.96 °C in the follicular phase and 0.66 °C in the luteal phase [10]. In mice, the circadian temperature difference is 0.73 °C under baseline conditions, which similarly falls between the follicular and luteal phase values. However, this difference decreases to 0.27 °C after successful mating. Given that luteinization in mice is induced by mating, it is reasonable to conclude that in mice, the alterations in CBT following mating are analogous to those observed in humans when the follicular phase transitions to the luteal phase. Similarly, Grant and Smarr presented an intriguing visual analysis of the similarities between human and mouse temperatures across pregnancy [8]. However, the temperature was found to be slightly higher, and the amplitude of the circadian fluctuations is smaller in mice. In experiments conducted by Neelke et al. using human embryos, from 1 AM to 6 AM, the temperature was set to 36.6 °C, and from 11 AM to 9 PM, the temperature was set to 37.5 °C, with a gradual change in between to mimic the circadian rhythm. The results showed no difference in blastocyst quality compared to the control group maintained at a constant 37.0 °C, leading to the conclusion that circadian rhythms do not improve embryo quality [12]. While the fluctuation amplitude of 0.7 °C is not significantly different from the value demonstrated in mice, the impact of these temperature changes on embryos may differ between the two species.
Our literature search yielded no studies that had examined the features of human CBT time series from fertilization to implantation. In recent years, advancements in wearable devices have enabled the continuous and unobtrusive measurement of body temperature in various parts of the female body. For instance, our previous findings demonstrate that the assessment of abdominal skin temperature in clothing during bedtime can accurately detect the increase in body temperature associated with ovulation, similar to sublingual basal body temperature measurements [35,36]. We believe that our research on the fluctuations in female body temperature has the potential to enhance the understanding of embryonic development, thereby making a significant impact on human ART technology.
5. Conclusions
Using a small logger to measure the CBTs of naturally mated female mice with a high temporal resolution provided insights into the characteristic features of temperature fluctuations in the natural environment of the oviduct. There was a variation in the circadian rhythm between 37.42 °C and 37.69 °C, with a mean range of 0.27 °C. The frequency components, in descending order of amplitude, were 24 h (0.24 °C), 6 h (0.17 °C), 12 h (0.15 °C), and 8 h (0.11 °C) cycles. Furthermore, the standard deviation of the irregular fluctuation components was 0.28 °C, and the complexity, as measured by MSE, increased. This study offers a set of standard reference values for temperature variation in in vitro culture to facilitate the study of embryo quality.
Author Contributions
Conceptualization, Y.M.; methodology, Y.M., T.A. and Z.T.; software, Y.M. and T.A.; formal analysis, Y.M., T.A. and Z.T.; investigation, Y.M. and T.A.; data curation, T.A.; writing—original draft preparation, Y.M.; writing—review and editing, Y.M. and Z.T.; visualization, Y.M., T.A. and Z.T.; supervision, Y.M., T.A. and Z.T.; project administration, Y.M.; funding acquisition, Y.M. All authors have read and agreed to the published version of the manuscript.
Funding
This work was supported in part by JSPS KAKENHI, grant numbers 21K12672 and 24K15798 to Y.M.
Institutional Review Board Statement
All animal procedures were approved by the Animal Care and Use Committee at the College of Engineering, Nihon University (approval number AP20CEB001-1, 9 December 2020).
Informed Consent Statement
Not applicable.
Data Availability Statement
The data presented in this study are available from the corresponding author upon reasonable request.
Acknowledgments
We thank H. Sato, H. Nishimiya, and K. Yanagisawa for collaborating in our early study.
Conflicts of Interest
The authors declare no conflicts of interest.
Abbreviations
The following abbreviations are used in this manuscript:
| IVF | In vitro fertilization |
| ART | Assisted reproductive technology |
| CBT | Core body temperature |
| MSE | Multiscale entropy |
References
- Kagari, Y.; Jwa, S.C.; Kuwahara, A.; Iwasa, T.; On, M.; Kato, K.; Kishi, H.; Kuwabarak, Y.; Taniguchi, F.; Harada, M.; et al. Assisted reproductive technology in Japan: A summary report for 2021 by the Ethics Committee of the Japan Society of Obstetrics and Gynecology. Reprod. Med. Biol. 2024, 23, e12552. [Google Scholar]
- Swain, J.E.; Carrell, D.; Cobo, A.; Meseguer, M.; Rubio, C.; Smith, G.D. Optimizing the culture environment and embryo manipulation to help maintain embryo developmental potential. Fertil. Steril. 2016, 105, 571–587. [Google Scholar] [CrossRef] [PubMed]
- Heo, Y.S.; Cabrera, L.M.; Bormann, C.L.; Smith, G.D.; Takayama, S. Real time culture and analysis of embryo metabolism using a microfluidic device with deformation based actuation. Lab A Chip 2012, 12, 2240–2246. [Google Scholar] [CrossRef]
- Hawkins, J.; Miao, X.; Cui, W.; Sun, Y. Biophysical optimization of preimplantation embryo culture: What mechanics can offer ART. Mol. Hum. Reprod. 2021, 27, gaaa087. [Google Scholar] [CrossRef] [PubMed]
- Liu, J.; Zhou, Y.H.; Wang, X.X.; Tong, L.X.; Li, Y.H.; Liu, L.; Xu, Z.Y.; Wang, H.H. Effects of Different Types of Incubators on Embryo Development and Clinical Outcomes. In Infertility and Assisted Reproduction; IntechOpen: London, UK, 2020. [Google Scholar]
- Bahat, A.; Eisenbach, M.; Tur-Kaspa, I. Periovulatory increase in temperature difference within the rabbit oviduct. Hum. Reprod. 2005, 20, 2118–2121. [Google Scholar] [CrossRef] [PubMed]
- Hunter, R. Temperature gradients in female reproductive tissues. Reprod. Biomed. Online 2012, 24, 377–380. [Google Scholar] [CrossRef] [PubMed]
- Grant, A.; Smarr, B. Feasibility of continuous distal body temperature for passive, early pregnancy detection. PLOS Digit. Health 2022, 1, e0000034. [Google Scholar] [CrossRef]
- Smarr, B.L.; Zucker, I.; Kriegsfeld, L.J. Detection of successful and unsuccessful pregnancies in mice within hours of pairing through frequency analysis of high temporal resolution core body temperature data. PLoS ONE 2016, 11, e0160127. [Google Scholar] [CrossRef]
- Coyne, M.D.; Kesick, C.M.; Doherty, T.J.; Kolka, M.A.; Stephenson, L.A. Circadian rhythm changes in core temperature over the menstrual cycle: Method for noninvasive monitoring. Am. J. Physiol.-Regul. Integr. Comp. Physiol. 2000, 279, R1316–R1320. [Google Scholar] [CrossRef] [PubMed]
- Moriyama, D.F.; Makri, D.; Maalouf, M.N.; Adamova, P.; de Moraes, G.F.A.; Pinheiro, M.d.O.; Bernardineli, D.L.; Massaia, I.F.D.S.; Maalouf, W.E.; Lo Turco, E.G. The effects of temperature variation treatments on embryonic development: A mouse study. Sci. Rep. 2022, 12, 2489. [Google Scholar] [CrossRef]
- Neelke, D.M.; Ronny, J.; Samuel, S.R.; Herman, T.; de Velde Hilde, V.; Greta, V. The effect of different temperature conditions on human embryosin vitro: Two sibling studies. Reprod. BioMed. Online 2019, 38, 508–515. [Google Scholar] [CrossRef]
- Hara, T.; Matsuura, K.; Kodama, T.; Sato, K.; Kikkawa, Y.; Muneto, T.; Tanaka, J.; Naruse, K. A tilting embryo culture system increases the number of high-grade human blastocysts with high implantation competence. Reprod. BioMed. Online 2013, 26, 260–268. [Google Scholar] [CrossRef] [PubMed]
- Heo, Y.; Cabrera, L.; Bormann, C.; Shah, C.; Takayama, S.; Smith, G. Dynamic microfunnel culture enhances mouse embryo development and pregnancy rates. Hum. Reprod. 2010, 25, 613–622. [Google Scholar] [CrossRef] [PubMed]
- Hickman, D.L.; Beebe, D.J.; Rodriguez-Zas, S.L.; Wheeler, M.B. Comparison of static and dynamic medium environments for culturing of pre-implantation mouse embryos. Comp. Med. 2002, 52, 122–126. [Google Scholar]
- Matsuura, K.; Hayashi, N.; Kuroda, Y.; Takiue, C.; Hirata, R.; Takenami, M.; Aoi, Y.; Yoshioka, N.; Habara, T.; Mukaida, T.; et al. Improved development of mouse and human embryos using a tilting embryo culture system. Reprod. Biomed. Online 2010, 20, 358–364. [Google Scholar] [CrossRef]
- West, E.R.; Xu, M.; Woodruff, T.K.; Shea, L.D. Physical properties of alginate hydrogels and their effects on in vitro follicle development. Biomaterials 2007, 28, 4439–4448. [Google Scholar] [CrossRef] [PubMed]
- Gamo, Y.; Bernard, A.; Mitchell, S.E.; Hambly, C.; Al Jothery, A.; Vaanholt, L.M.; Król, E.; Speakman, J.R. Limits to sustained energy intake. XVI. Body temperature and physical activity of female mice during pregnancy. J. Exp. Biol. 2013, 216, 2328–2338. [Google Scholar] [CrossRef] [PubMed]
- Wharfe, M.D.; Wyrwoll, C.S.; Waddell, B.J.; Mark, P.J. Pregnancy suppresses the daily rhythmicity of core body temperature and adipose metabolic gene expression in the mouse. Endocrinology 2016, 157, 3320–3331. [Google Scholar] [CrossRef][Green Version]
- Humeau-Heurtier, A. The multiscale entropy algorithm and its variants: A review. Entropy 2015, 17, 3110–3123. [Google Scholar] [CrossRef]
- Costa, M.; Goldberger, A.L.; Peng, C.K. Multiscale entropy analysis of complex physiologic time series. Phys. Rev. Lett. 2002, 89, 068102. [Google Scholar] [CrossRef]
- Costa, M.; Goldberger, A.L.; Peng, C.K. Multiscale entropy analysis of biological signals. Phys. Rev. E—Stat. Nonlinear Soft Matter Phys. 2005, 71, 021906. [Google Scholar] [CrossRef]
- Varela, M.; Calvo, M.; Chana, M.; Gomez-Mestre, I.; Asensio, R.; Galdos, P. Clinical implications of temperature curve complexity in critically ill patients. Crit. Care Med. 2005, 33, 2764–2771. [Google Scholar] [CrossRef] [PubMed]
- Varela, M.; Churruca, J.; Gonzalez, A.; Martin, A.; Ode, J.; Galdos, P. Temperature curve complexity predicts survival in critically ill patients. Am. J. Respir. Crit. Care Med. 2006, 174, 290–298. [Google Scholar] [CrossRef] [PubMed]
- Varela, M.; Jimenez, L.; Fariña, R. Complexity analysis of the temperature curve: New information from body temperature. Eur. J. Appl. Physiol. 2003, 89, 230–237. [Google Scholar] [CrossRef] [PubMed]
- Chaffin, C.L.; VandeVoort, C.A. Follicle growth, ovulation, and luteal formation in primates and rodents: A comparative perspective. Exp. Biol. Med. 2013, 238, 539–548. [Google Scholar] [CrossRef]
- Walters, E.A.; Brown, J.L.; Krisher, R.; Voelkel, S.; Swain, J.E. Impact of a controlled culture temperature gradient on mouse embryo development and morphokinetics. Reprod. BioMed. Online 2020, 40, 494–499. [Google Scholar] [CrossRef] [PubMed]
- Hong, K.H.; Lee, H.; Forman, E.J.; Upham, K.M.; Scott, R.T., Jr. Examining the temperature of embryo culture in in vitro fertilization: A randomized controlled trial comparing traditional core temperature (37 °C) to a more physiologic, cooler temperature (36 °C)✩. Fertil. Steril. 2014, 102, 767–773. [Google Scholar] [CrossRef] [PubMed]
- Grant, A.D.; Newman, M.; Kriegsfeld, L.J. Ultradian rhythms in heart rate variability and distal body temperature anticipate onset of the luteinizing hormone surge. Sci. Rep. 2020, 10, 20378. [Google Scholar] [CrossRef]
- Grant, A.D.; Wilsterman, K.; Smarr, B.L.; Kriegsfeld, L.J. Evidence for a coupled oscillator model of endocrine ultradian rhythms. J. Biol. Rhythm. 2018, 33, 475–496. [Google Scholar] [CrossRef]
- Rostaghi, M.; Azami, H. Dispersion entropy: A measure for time-series analysis. IEEE Signal Process. Lett. 2016, 23, 610–614. [Google Scholar] [CrossRef]
- Rhea, C.K.; Silver, T.A.; Hong, S.L.; Ryu, J.H.; Studenka, B.E.; Hughes, C.M.; Haddad, J.M. Noise and complexity in human postural control: Interpreting the different estimations of entropy. PLoS ONE 2011, 6, e17696. [Google Scholar] [CrossRef] [PubMed]
- García-Martínez, S.; Latorre, R.; Sánchez-Hurtado, M.; Sánchez-Margallo, F.; Bernabò, N.; Romar, R.; López-Albors, O.; Coy, P. Mimicking the temperature gradient between the sow’s oviduct and uterus improves in vitro embryo culture output. Mol. Hum. Reprod. 2020, 26, 748–759. [Google Scholar] [CrossRef] [PubMed]
- Geneva, I.I.; Cuzzo, B.; Fazili, T.; Javaid, W. Normal body temperature: A systematic review. Open Forum Infect. Dis. 2019, 6, ofz032. [Google Scholar] [CrossRef] [PubMed]
- Murayama, Y.; Kitazawa, M.; Sato, H.; Uemura, A. The accuracy of abdominal skin temperature in detecting ovulation compared to basal body temperature. Jpn. J. Appl. IT Healthc. 2022, 17, 6–9. [Google Scholar]
- Murayama, Y.; Uemura, A.; Kitazawa, M.; Toyotani, J.; Taniuchi, A.; Togawa, T. Determination of biphasic menstrual cycle based on the fluctuation of abdominal skin temperature during sleep. Adv. Biomed. Eng. 2023, 12, 28–36. [Google Scholar] [CrossRef]


Disclaimer/Publisher’s Note: The statements, opinions and data contained in all publications are solely those of the individual author(s) and contributor(s) and not of MDPI and/or the editor(s). MDPI and/or the editor(s) disclaim responsibility for any injury to people or property resulting from any ideas, methods, instructions or products referred to in the content. |
© 2024 by the authors. Licensee MDPI, Basel, Switzerland. This article is an open access article distributed under the terms and conditions of the Creative Commons Attribution (CC BY) license (https://creativecommons.org/licenses/by/4.0/).