Abstract
To improve the forming quality of agricultural tractor engine hood and effectively solve the problems of wrinkling and cracking during the drawing forming process, DYNAFORM 5.9 finite element software was used for numerical simulation of the part. Based on a comprehensive scoring method of orthogonal experiments and grey relational analysis, the critical process parameters affecting the “maximum thickening rate” and “maximum thinning rate” were determined. Latin hypercube sampling was used to randomly sample the key process parameters, and the sampled samples served as the data basis for the optimization stage of the neural network genetic algorithm function; an optimization model of the neural network genetic algorithm function was established, with the key process parameters, and the “maximum thickening rate” and “maximum thinning rate” as inputs and outputs respectively, to construct a nonlinear mapping relationship and optimize the process parameters. The study showed that the blank holder force and die clearance had the greatest impact on the “maximum thickening rate” and “maximum thinning rate”, identifying them as key process parameters; the optimal process parameter combination was the blank holder force of 462.71 kN, the die clearance of 1.09 mm, and corresponding “maximum thickening rate” and “maximum thinning rate” of 3.97% and 25.96%, respectively. Overall, this research provides a practical optimization strategy to solve the quality issues of the engine hood, offering a theoretical basis for its actual production and processing with significant practical application value.
1. Introduction
The engine hood, as one of the main covers for agricultural tractors, must meet mechanical performance requirements and conform to the trend of lightweight development in vehicles. The engine hood must possess high strength, corrosion resistance, excellent heat dissipation, and structural stability to ensure long-term reliable operation. Typically, engine hoods are processed using metal drawing forming methods [1]. The engine hood is a large and complex spatial curved surface model, which makes it difficult to determine the specific values of various process parameters [2]. During the drawing process, the part is prone to quality defects such as wrinkling and cracking, which prevent the part from meeting basic forming and assembly requirements [3].
Regarding the issue of metal forming quality, many domestic and international scholars have conducted extensive research. For example, Wu Amin [4] and other scholars used the orthogonal experiment method to optimize the stamping process parameters for cover plates. Although this solved the problem of tearing, it overlooked the interaction between parameters, which may lead to inaccurate data. Zheng Sanhe [5] and other scholars optimized stamping process parameters and improved the blank holder method, significantly increasing the drawing depth of double-box-shaped parts, but they did not consider the forming quality indicators of the parts. HANG T P [6] and other scholars studied the impact of changes in stainless steel properties on forming quality using a small punch test, but optimization was conducted only through physical experiments, which limited the number of trials and resulted in a low degree of optimization. Zhang Yu [7] and other scholars used a BP neural network model to predict the maximum forming height of rolled differential-thickness tubes. However, when addressing highly nonlinear problems with a single model, the weight changes in the BP neural network were minimal, which could lead to local convergence. FATHI H [8] and other scholars used a hemispherical punch test to study the impact of stamping speed on the forming of 0.5 mm thick stainless steel sheets, significantly improving their forming quality, but they only considered single factors and single quality objectives. Qin Baiying [3] and other scholars established a quadratic polynomial response surface model for maximum thinning rate, wrinkling rate, and process parameters to optimize the process parameters affecting the forming of heat shield parts, greatly improving their forming quality. However, this approach relied heavily on the assumed model, and if the assumptions were incorrect, the prediction results could deviate significantly. In summary, domestic and international scholars have primarily used common methods such as orthogonal experiments, response surface models, polynomial fitting, and radial basis functions, which have the aforementioned issues. Therefore, this study adopted a hybrid model that integrates intelligent algorithms and machine learning to optimize the forming quality of metal sheets. This approach can reasonably avoid the issues mentioned above and has been relatively less reported in research. It provides a novel, scientific, and practical method for optimizing process parameters in metal sheet stamping forming.
To address the defects of wrinkling and cracking in the engine hood, DYNAFORM 5.9 finite element software was used to simulate the drawing process. Using “maximum thickening rate” and “maximum thinning rate” as quality evaluation indices, the effects of the blank holder force, stamping speed, friction coefficient, and die clearance were studied through a comprehensive scoring method and grey relational analysis in orthogonal experiments. Based on sample data from Latin hypercube sampling, a neural network genetic algorithm function was used to optimize the key process parameters, obtain an optimized combination of process parameters, and conduct simulation verification. This study resolved the quality issues of the engine hood in drawing forming for agricultural tractors, providing a solid theoretical foundation and reliable numerical basis for the production and processing of engine hoods.
2. Simulation Analysis of Agricultural Tractor Engine Hood
2.1. Construction of the 3D Model
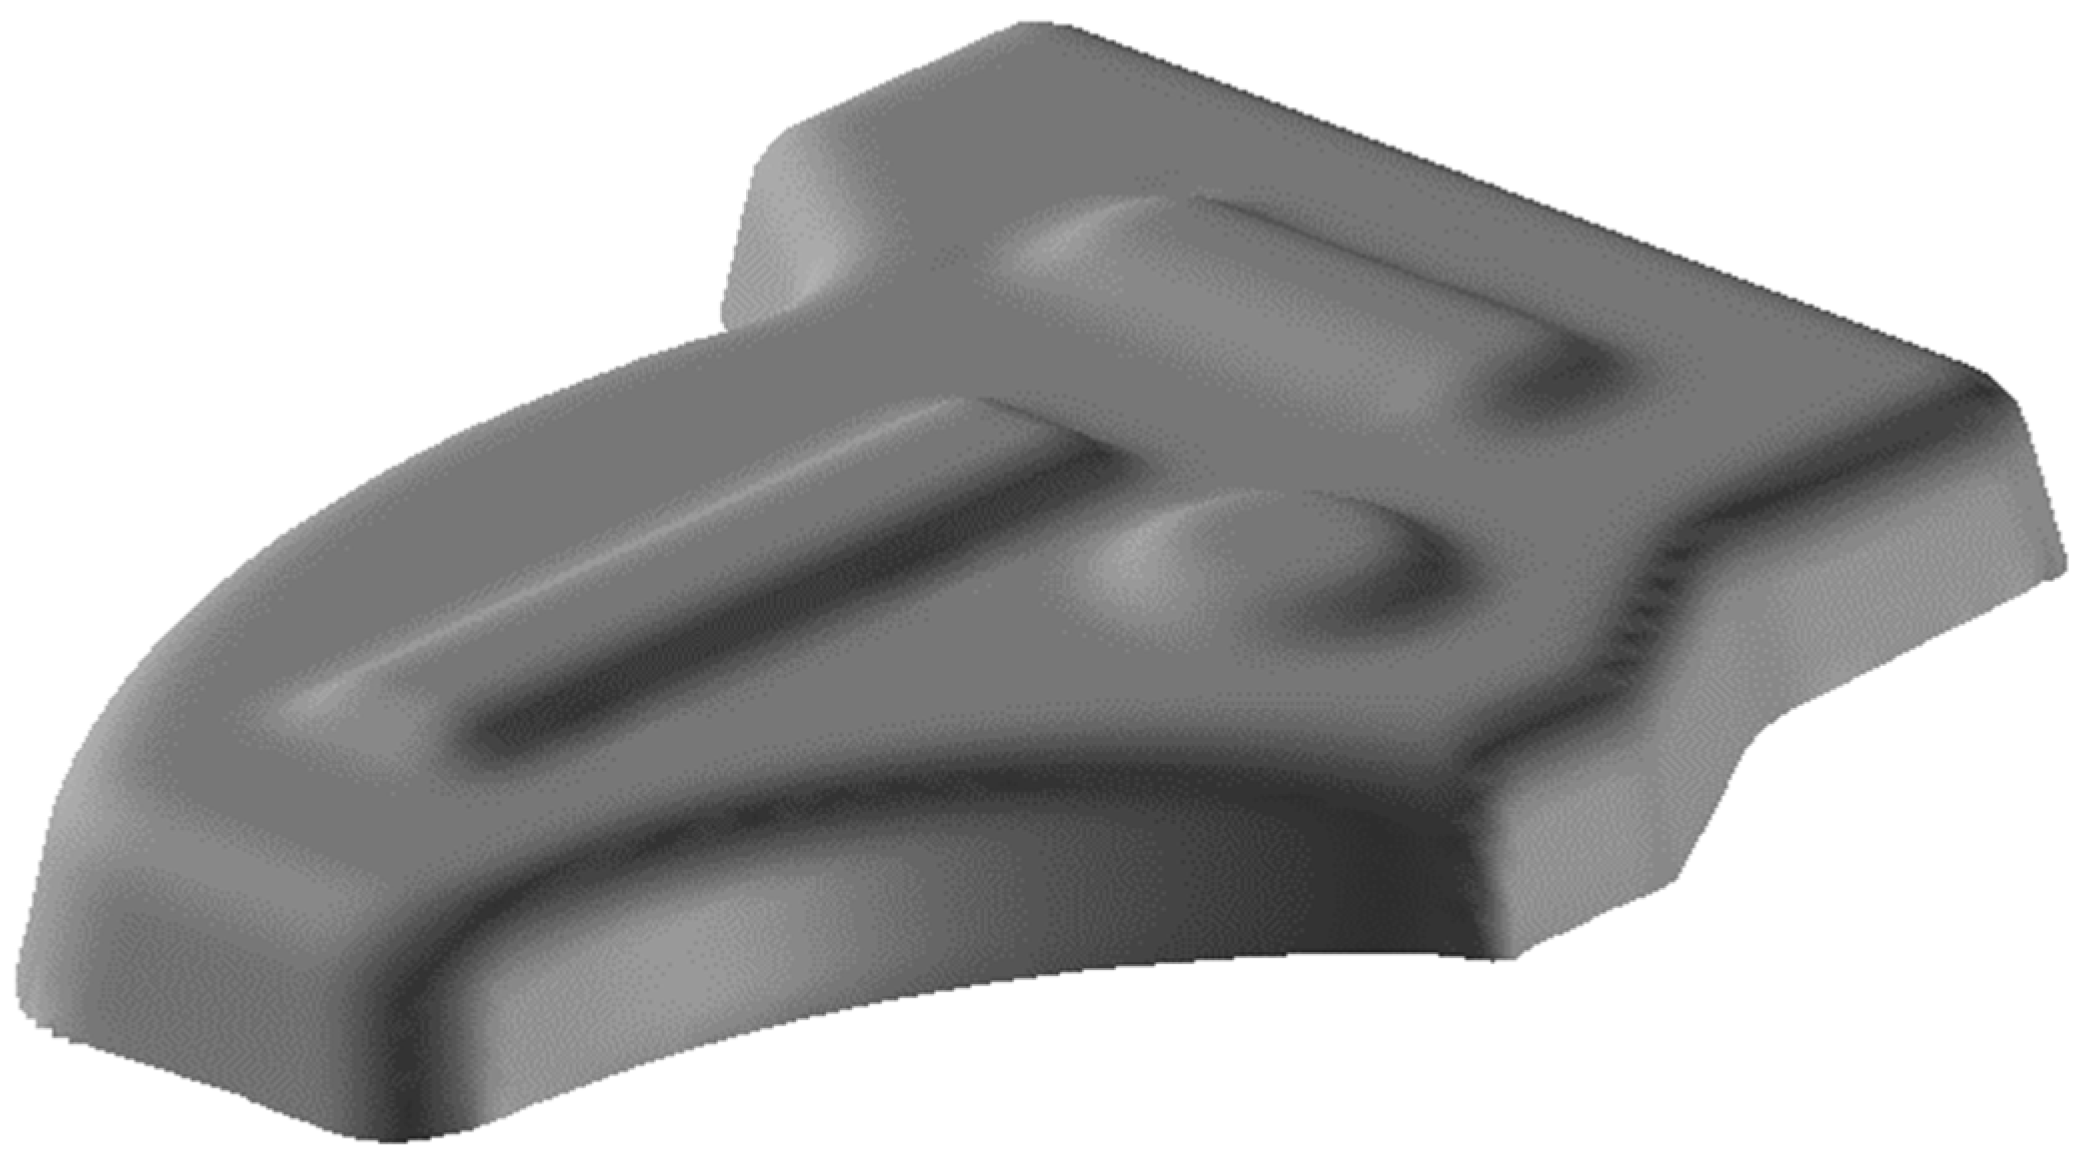
The engine hoods of agricultural tractors come in various designs and shapes, commonly including streamlined, box-type, and slanted. Streamlined hoods typically feature smooth curves that reduce air resistance and improve fuel efficiency. Box-type hoods are more rectangular, providing larger internal space for easier maintenance and repairs. Slanted hoods, on the other hand, enhance driver visibility and improve maneuverability through their inclined design. These different shapes are primarily designed to meet the needs of various farming environments, optimizing the overall performance and user experience of the tractors. In this study, the engine hood of an agricultural tractor manufactured by a certain automobile company was selected as the research subject. The three-dimensional model is shown in Figure 1.

Figure 1.
Three-dimensional model.
2.2. Selection of Material Model
The material model AA5052H32-36 from the DYNAFORM finite element software material library was selected, with a thickness of 1.0 mm. Its mechanical properties are shown in Table 1.

Table 1.
Mechanical properties of material models AA5052H32-36.
Compared with common stamping materials, such as 6061 aluminum alloy, 304 stainless steel, and cold-rolled steel sheets, the 5052 aluminum alloy has superior characteristics, such as corrosion resistance, fatigue resistance, formability, and complete recyclability. It can maintain stable performance under repeated loading conditions, making it very suitable for forming complex shapes. It is capable of achieving complex stamping formations and fully aligns with the automotive industry’s trend toward lightweight design.
2.3. Stretch Forming Analysis
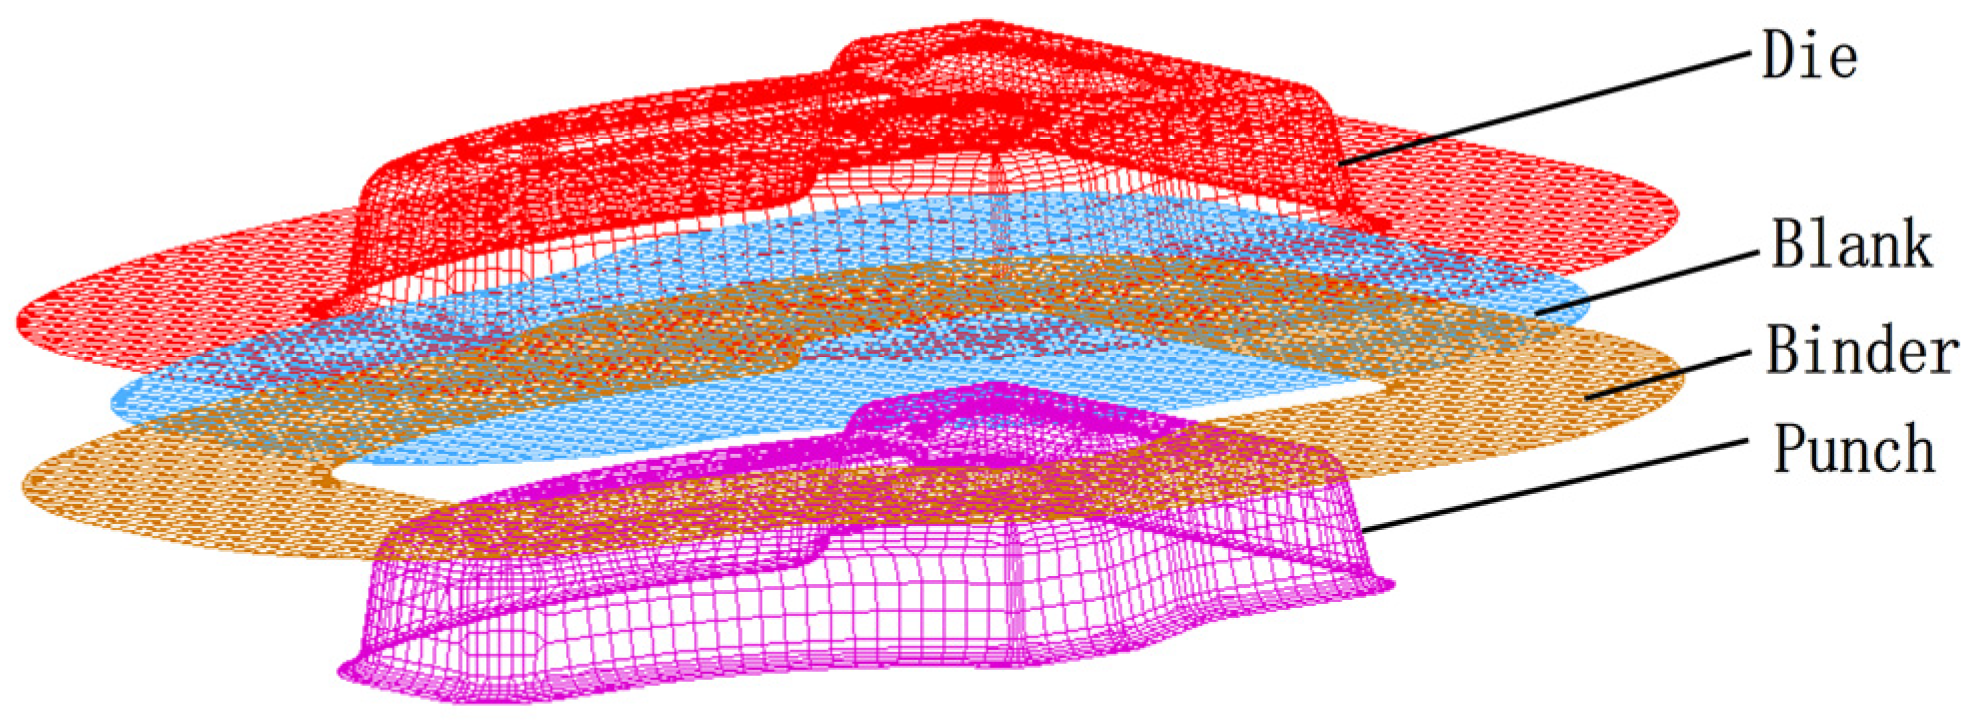
The DYNAFORM finite element software was used to perform a numerical simulation on the engine hood of an agricultural tractor. The finite element model and the stretch-forming process are shown in Figure 2 and Figure 3, respectively. During the numerical simulation, the heat exchange issue between the sheet metal and the die was ignored [9].
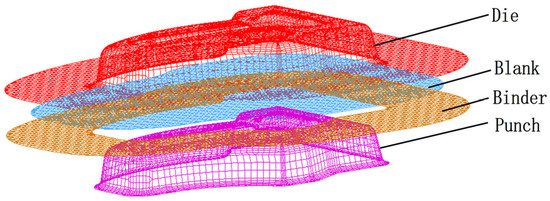
Figure 2.
Finite element model.
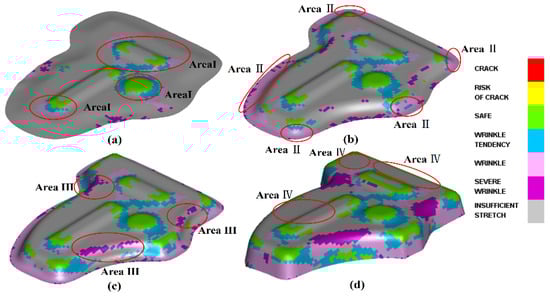
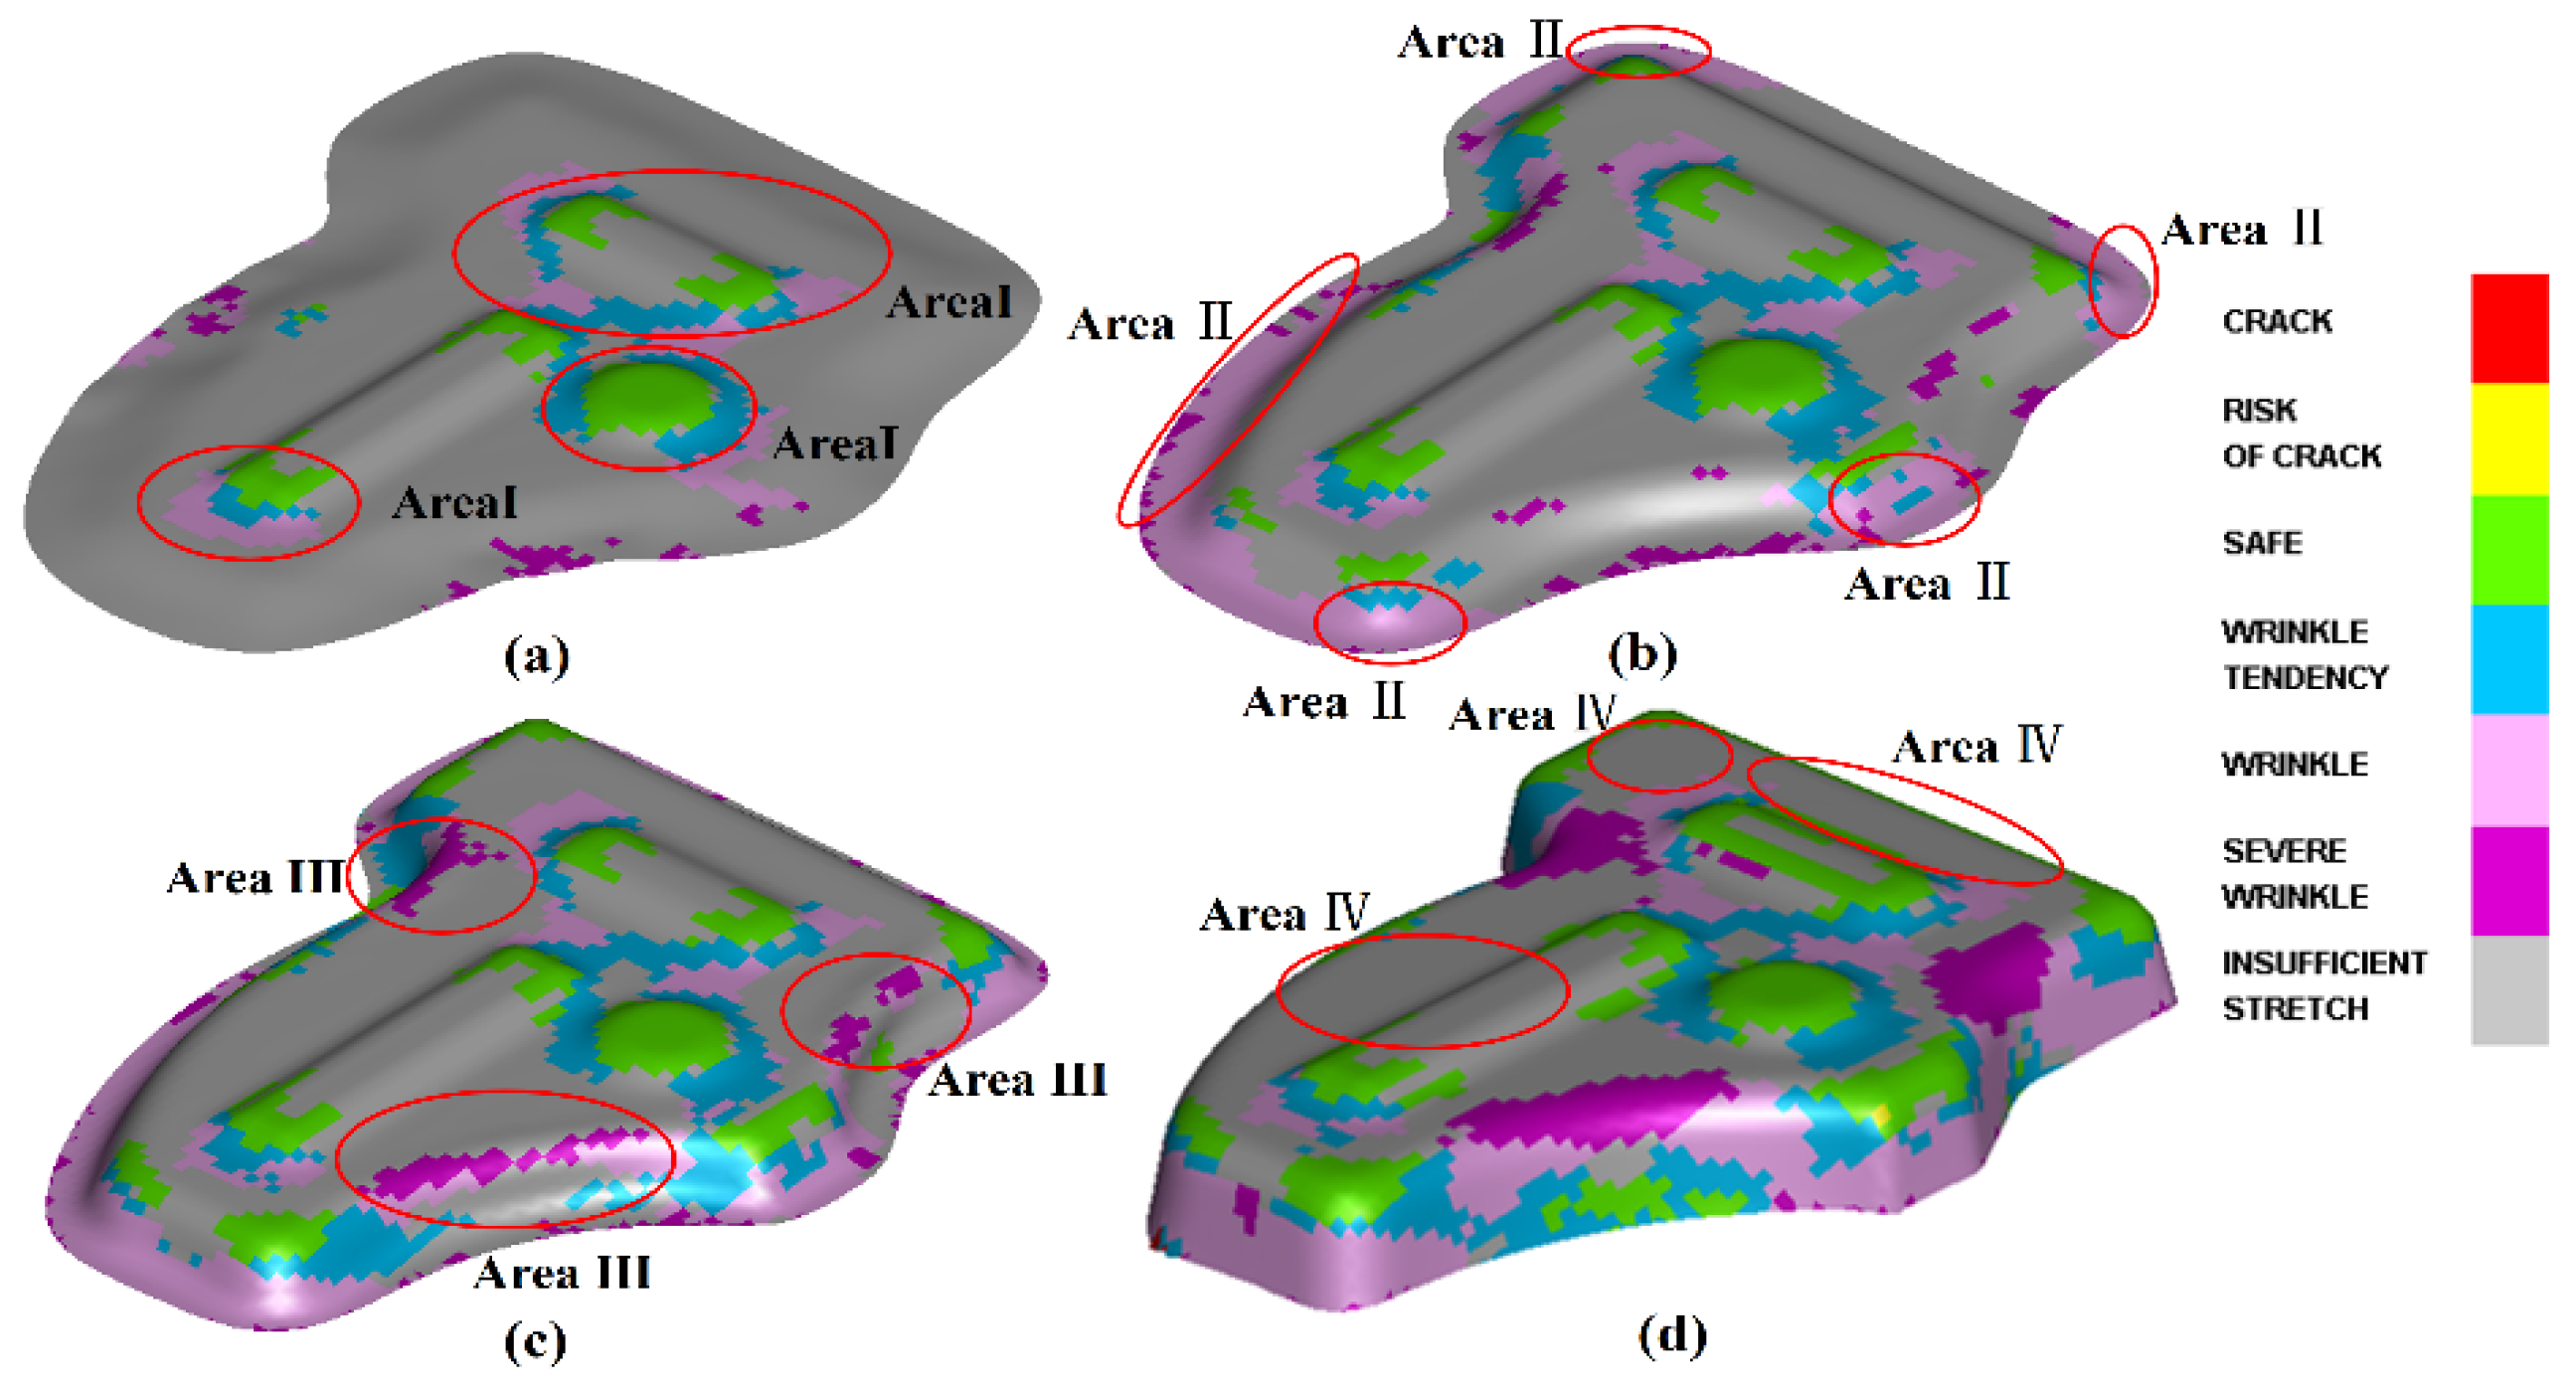
Figure 3.
Drawing and forming process: (a) pre-drawing; (b) pre-mid drawing; (c) mid-late drawing; (d) late drawing.
When the bottom surface of the punch contacts the sheet metal, pressure is applied to the sheet metal. The sheet metal is mainly influenced by the combined action of the binder ring and the punch, with the primary stress areas distributed in the middle and edges of the sheet metal (as shown in area I in Figure 3a). As the downward movement of the punch increases, the deformation area in the middle of the sheet metal expands, and significant wrinkling deformations appear around the edges (as shown in area II in Figure 3b). Due to the largest change in the radius of metal flow at the three straight-edge corners, where the extrusion force is considerable, wrinkling is likely to occur (as shown in area III in Figure 3c). As the forming progresses, the bottom arc of the part is completely formed, the depth of the sidewalls increases, and the overall deformation area expands, but there are still some parts that have not undergone deformation (as shown in area IV in Figure 3d). After the part was formed, there was a tendency for large areas to slightly wrinkle locally, but no obvious cracking occurred.
3. Orthogonal Experiments and Grey Relational Analysis
Orthogonal experimental design is an effective method for studying multi-variable and multi-level problems [9]. Grey relational analysis, as the core of grey system theory, is dedicated to revealing the uncertain relationships between variables and the main behaviors within a system [10]. In examining process parameters, a combined analysis method of orthogonal experiments and grey relational analysis is used. This method has an efficient capability to handle uncertainties and can analyze the fuzzy situations between variables and objectives.
3.1. Selection of Process Parameters
In the drawing forming of this engine cover, the main process parameters include blank holder force, stamping speed, friction coefficient, and die clearance. The purpose of optimizing these parameters is to control the resistance to material feed, ensure uniform material flow, and minimize or avoid wrinkling and cracking.
3.1.1. Blank Holder Force
If the blank holder force is too high, the part is prone to cracking; if it is too low, the part is prone to wrinkling. The empirical formula for blank holder force is shown below [11]:
where F is the blank holder force (N); q is the unit pressure applied on the blank holder area (MPa) with a range of 2 to 2.5 MPa, here taken as 2.25; and S is the blank holder area (mm2). The effective blank holder area of the engine cover is about 141,300 mm2, resulting in a blank holder force of 317,925 N, with 300 kN taken as the average value. Based on the formula calculation, the blank holder force is set at 150 kN, 300 kN, 450 kN, and 600 kN at four levels.
3.1.2. Stamping Speed
In numerical simulations of sheet metal forming, the actual drawing speed is typically increased by a factor of 100 to serve as the stamping speed (i.e., virtual stamping speed) [12]. If the stamping speed is too high, the workpiece is prone to uneven plastic deformation; conversely, if it is too low, production efficiency decreases. Based on numerous numerical simulation trials and practical production experience, the average stamping speed is set at 3000 mm·s−1. Four levels of stamping speed are considered: 1000 mm·s−1, 3000 mm·s−1, 5000 mm·s−1, and 7000 mm·s−1.
3.1.3. Friction Coefficient
In numerical simulations, the friction coefficient is used to control the lubrication effect of the drawing oil, and it is assumed to be consistent across all parts of the component [13]. If the friction coefficient is too high, the sheet material can hardly flow, leading to cracking; if too low, it can lead to wrinkling. Based on theoretical references and actual production, the friction coefficient is set at four levels: 0.050, 0.075, 0.100, and 0.125.
3.1.4. Die Clearance
In the structure of the drawing die, the smaller the die clearance, the greater the resistance to material flow and the higher the likelihood of local plastic deformation and cracking; larger die clearances can lead to local material accumulation, increasing the tendency to wrinkle. The empirical formula for die clearance is shown below [14]:
where Z is the die clearance (mm), and t is the material thickness (mm). The material thickness t of the engine cover is 1 mm; hence, the average value for die clearance is set at 1.05. Based on the formula calculation, the die clearance is set at 0.90, 1.05, 1.20, and 1.35 at four levels.
3.2. Selection of Quality Evaluation Indicators
In the metal sheet stamping process, the “maximum thinning rate” is used as a quality indicator to assess the risk of rupture. The value of this indicator reflects whether the sheet metal has a tendency to rupture or has already ruptured. At the same time, the “maximum thickening rate” is used as a quality indicator to evaluate the degree of wrinkling in the sheet metal and its development trend. A higher thickening rate indicates a more severe wrinkling problem.
The formula for calculating the “maximum thinning rate” T is the following [5]:
where t0 is the original thickness of the metal sheet, and tmin is the minimum thickness of the part after forming.
The formula for calculating the “maximum thickening rate” H is the following [5]:
where t0 is the original thickness of the metal sheet, and tmax is the maximum thickness of the part after forming.
3.3. Orthogonal Experimental Design
In this experiment, an L16(45) orthogonal array was used for research and analysis. Blank holder force, stamping speed, friction coefficient, and die clearance were selected as experimental factors, while “maximum thickening rate” and “maximum thinning rate” were used as quality evaluation indicators. In this case, there was a blank column in the orthogonal test table, and it did not work in the test. The factor level table and orthogonal experimental table are shown in Table 2 and Table 3, respectively.
Table 2.
Factor level table.
Table 3.
Orthogonal test table.
By analyzing the quality assessment indicators in Table 3, it is evident that both the “maximum thickening rate” and the “maximum thinning rate” do not meet the production requirements (with the “maximum thickening rate” being less than 5% and the “maximum thinning rate” being less than 30%). This indicates that wrinkling and cracking are the main issues affecting the quality of the engine hood. Therefore, it is necessary to conduct a comprehensive study on the “maximum thickening rate” and the “maximum thinning rate” to analyze the extent to which these parameters impact part quality.
By adopting a comprehensive scoring method, multi-objective problems can be converted into single-objective problems, which can effectively solve multi-objective optimization issues. In this study, there were two quality evaluation indicators: “maximum thickening rate” and “maximum thinning rate”. Both of these indicators were converted into their membership values, and these membership values were used to represent the scores of comprehensive scoring. The formula for calculating membership is as follows [15]:
where µi is the membership, xi is the result of the i-th experimental scheme, and min(x) and max(x) are the minimum and maximum values among all experimental results, respectively.
Since wrinkling and cracking are both major quality defects of equal importance, the weights of the “maximum thickening rate” and “maximum thinning rate” were both set at 0.5. The score for the comprehensive scoring is calculated as follows [15]:
where S is the score of the comprehensive scoring, wi is the weight of the i-th evaluation indicator, representing the importance of that evaluation indicator, and n is the total number of evaluation indicators.
Comprehensive scoring is used as an overall indicator for intuitive analysis, as shown in Table 4. According to Table 4, the lower the score of the comprehensive scoring, the smaller the values of “maximum thickening rate” and “maximum thinning rate”, indicating better forming effects.
Table 4.
Intuitive analysis table.
This study used a comprehensive score as the evaluation criterion and conducted a range analysis on the orthogonal experiment, as shown in Table 5. The range analysis indicates that the priority order of experimental factors was blank holder force, die clearance, stamping speed, and friction coefficient. The optimal parameter combination was the blank holder force of 150 kN, the stamping speed of 3000 mm·s−1, the friction coefficient of 0.125, and the die clearance of 1.05 mm. Furthermore, the DYNAFORM finite element software was used to perform a simulation analysis on the optimal parameter combination determined using range analysis; the “maximum thickening rate” and “maximum thinning rate” of the workpiece were 4.53% and 28.21%, respectively.
Table 5.
Results of range analysis.
3.4. Grey Relational Analysis
If the orthogonal experimental method is used to determine the key process parameters affecting the “maximum thickening rate” and “maximum thinning rate”, it may be difficult to effectively distinguish whether the variations in the “maximum thickening rate” and “maximum thinning rate” caused by different levels of specific process parameters are due to differences in the selected parameter levels or experimental errors. In such cases, the differences in experimental results may not accurately reflect the actual impact of the process parameter levels but may instead be influenced by errors, thereby affecting the reliability of the research conclusions. Therefore, in the research process, the influence of experimental errors must be comprehensively considered. The grey relational analysis method should be used to evaluate the degree of association of blank holder force, stamping speed, friction coefficient, and die clearance with the “maximum thickening rate” and “maximum thinning rate”.
A sequence is set as follows [16]:
Interval transformation is performed [16]:
A reference sequence x0 = {x0(k)|k = 1, 2, …, n} is selected, where k represents the time. If there exists a set of comparison sequences xi = {xi(k)|k = 1, 2,…, n}, i = 1, 2, …m, the following is said [16]:
At k time, xi is the relational degree of comparison sequence to the reference sequence x0, ρ is the resolution coefficient, is the minimum difference between two levels, and is the maximum difference between two levels.
The relational degree defined in Equation (7) describes the correlation of the comparison sequence with the reference sequence at a certain time. However, there are different relational degrees at different times; therefore, a relative degree of the comparison sequence to the reference sequence is given as follows [16]:
In the formula, n represents the total number of reference sequences; ri represents the value of relational degree. The larger the relational degree, the closer the comparison sequence is to the reference sequence, meaning a greater impact.
Based on the above, the “comprehensive scores” of the 16 sets of process parameter combinations were used as the reference array, and the level values of the 16 sets of process parameters were used as the comparison array. These values were then substituted into Equations (8) to (10) in sequence for computational analysis. The selected data normalization method was min–max normalization to maintain the relative relationships and differences of the original arrays. A discrimination coefficient of 0.5 was chosen, which is a commonly used value that ensures sensitivity to differences in data analysis. MATLAB software (https://ww2.mathworks.cn/products/matlab.html) was used to solve the correlation degree of each process parameter with respect to the “maximum thickening rate” and “maximum thinning rate”, as shown in Table 6.
Table 6.
Correlation of process parameters with respect to “maximum thickening rate” and “maximum thinning rate”.
According to Table 6, the blank holder force and die clearance have a significant impact on the “maximum thickening rate” and “maximum thinning rate” of the part, whereas the stamping speed and friction coefficient have a lesser impact on the “maximum thickening rate” and “maximum thinning rate” of the part.
4. Optimization of Parameters in a Genetic Algorithm Function Optimization Model Based on Neural Networks
4.1. Latin Hypercube Sampling
Latin Hypercube Sampling is an efficient spatial sampling method [17]. By dividing the multi-dimensional space into equal probability subintervals, it ensures uniform a distribution of samples in each dimension. This optimizes the representativeness and statistical efficiency of the samples, has convergence properties, and effectively avoids duplicate sampling [17]. It is particularly suitable for providing sample data for subsequent neural network genetic algorithm optimization models.
For bonnet parts, the friction coefficient and stamping speed have relatively minor effects on the “maximum thickening rate” and “maximum thinning rate”. Therefore, with the premise of ensuring part quality, the friction coefficient of 0.125 and the stamping speed of 3000 mm·s−1 were chosen. Meanwhile, random samples of the blank holder force and die clearance were taken within the ranges of (150, 600) and (0.90, 1.35), respectively, with 30 sets of samples drawn to ensure uniform distribution across the entire sampling space. DYNAFORM finite element software was used to simulate analysis on the 30 sets of samples, obtaining the “maximum thickening rate” and “maximum thinning rate” under different process parameter combinations. The scatter distribution of sample data is shown in Figure 4.
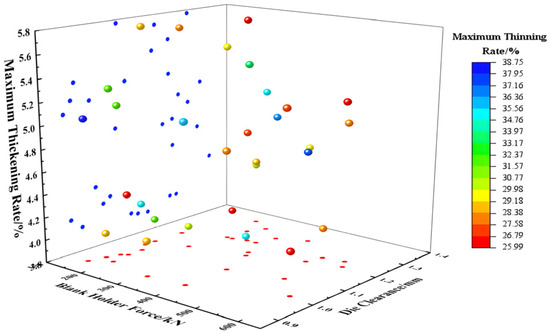
Figure 4.
Scattered distribution diagram.
4.2. Construction of the Mathematical Model for the Optimization Object
In the metal sheet forming process, the mathematical expressions for parameter design and output responses exhibit characteristics of being unknowable, highly nonlinear, and implicit. Therefore, the numerical analysis philosophy of “piecewise discrete approximation” was adopted to seek a simple mathematical model to ensure approximation within a certain error range. For two variables, the complete form of the response surface is as follows:
In the formula, x1, x2 are the two variables; β0, β1, β2, β11, β12, β22 are the fitting coefficients for the constant term, linear term, mixed term, and polynomial terms, respectively; ε is the model’s random error; and y is the approximate target function.
Based on the 30 sets of process parameter combinations obtained through the Latin hypercube sampling method and their corresponding comprehensive score, the functional relationship can be constructed between the blank holder force, die clearance, and comprehensive score. This functional relationship serves as the fitness function during the genetic algorithm optimization stage of the neural network genetic algorithm optimization model, as shown below:
In the formula, x1, x2 respectively represent the blank holder force and die clearance, while y is the comprehensive score.
4.3. Neural Network Genetic Algorithm Function Optimization
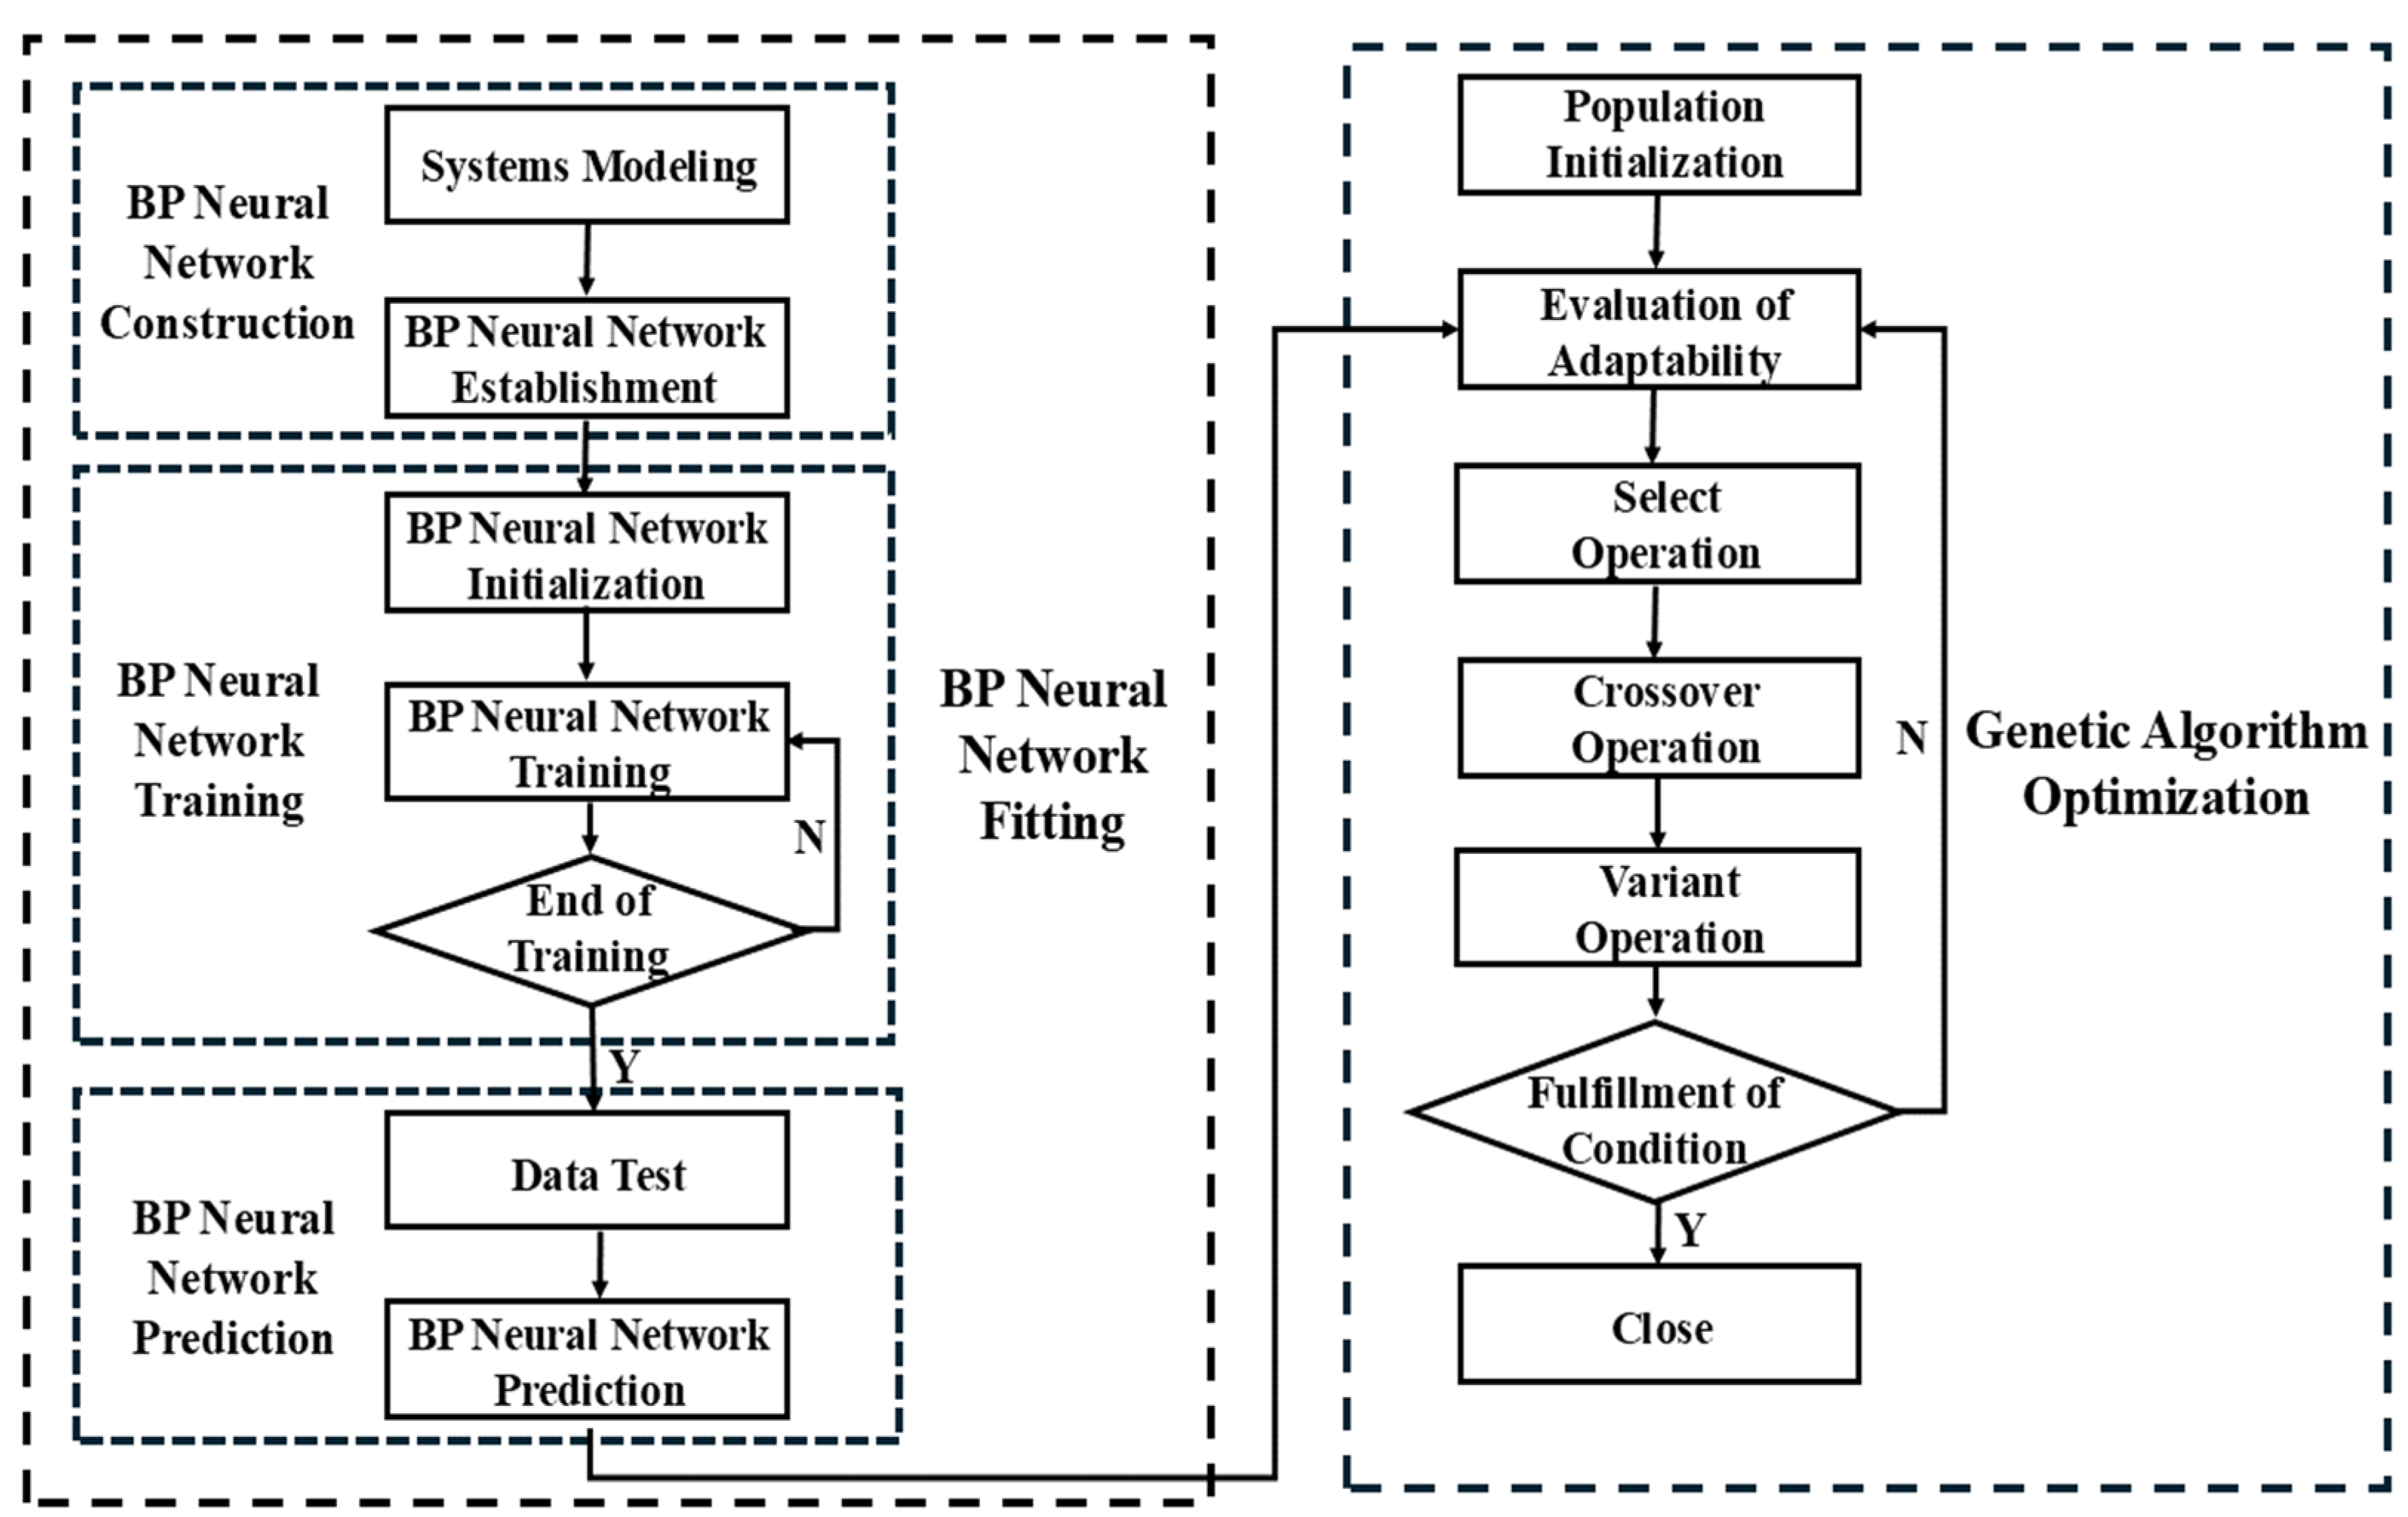
Based on the neural network genetic algorithm function optimization model, first, the “maximum thickening rate” and “maximum thinning rate” were predicted, and then they were combine with the genetic algorithm to optimize the function and deduce the optimal process parameters. The optimization workflow is illustrated in Figure 5.
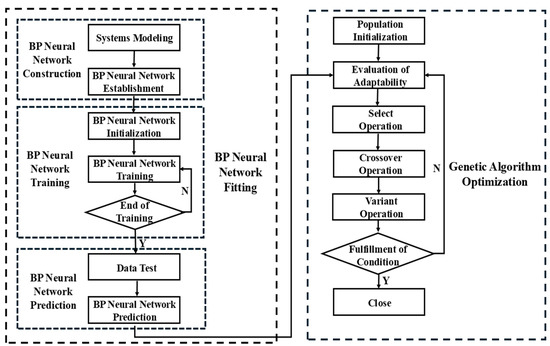
Figure 5.
Optimization flowchart.
4.3.1. BP Neural Network Construction
BP neural network is a type of multilayer feedforward neural network trained according to the error backpropagation algorithm [11]. It consists of an input layer, hidden layers, and an output layer, possessing excellent multi-dimensional function mapping capabilities without the need to construct complex mathematical models. Currently, there is no suitable mathematical model for the engine hood model discussed in this paper; hence, the choice of the BP neural network is used to construct the mapping relationship between process parameters and targets. Studies have shown that neural network models with biases, at least one S-shaped hidden layer, and one linear output layer can approximate any rational function [18]. According to the description in the literature [19], multiple hidden layers can improve the fitting effect, prediction accuracy, and generalization ability of neural networks. This is particularly effective in handling the complexity and uncertainty of data, especially when there are few data samples. Therefore, a double hidden layer network structure was adopted for function approximation.
The number of nodes in the input layer was determined using the number of input variables, and the number of nodes in the output layer was determined using the prediction target. The number of nodes in the hidden layer is determined using Equation (13). Through repeated experiments, it was found that when the number of nodes in both hidden layers is set to nine, the error rate is minimized.
In the equation, i and j represent the number of nodes in the input and output layers, respectively.
In the hidden layer, let F(x) be the mapping relationship of the activation function. The Logsig function was chosen as the activation function for the hidden layer, and the Purelin linear function was used for the output layer. The formula for the Logsig function is as follows:
The formula for the Purelin linear function is as follows:
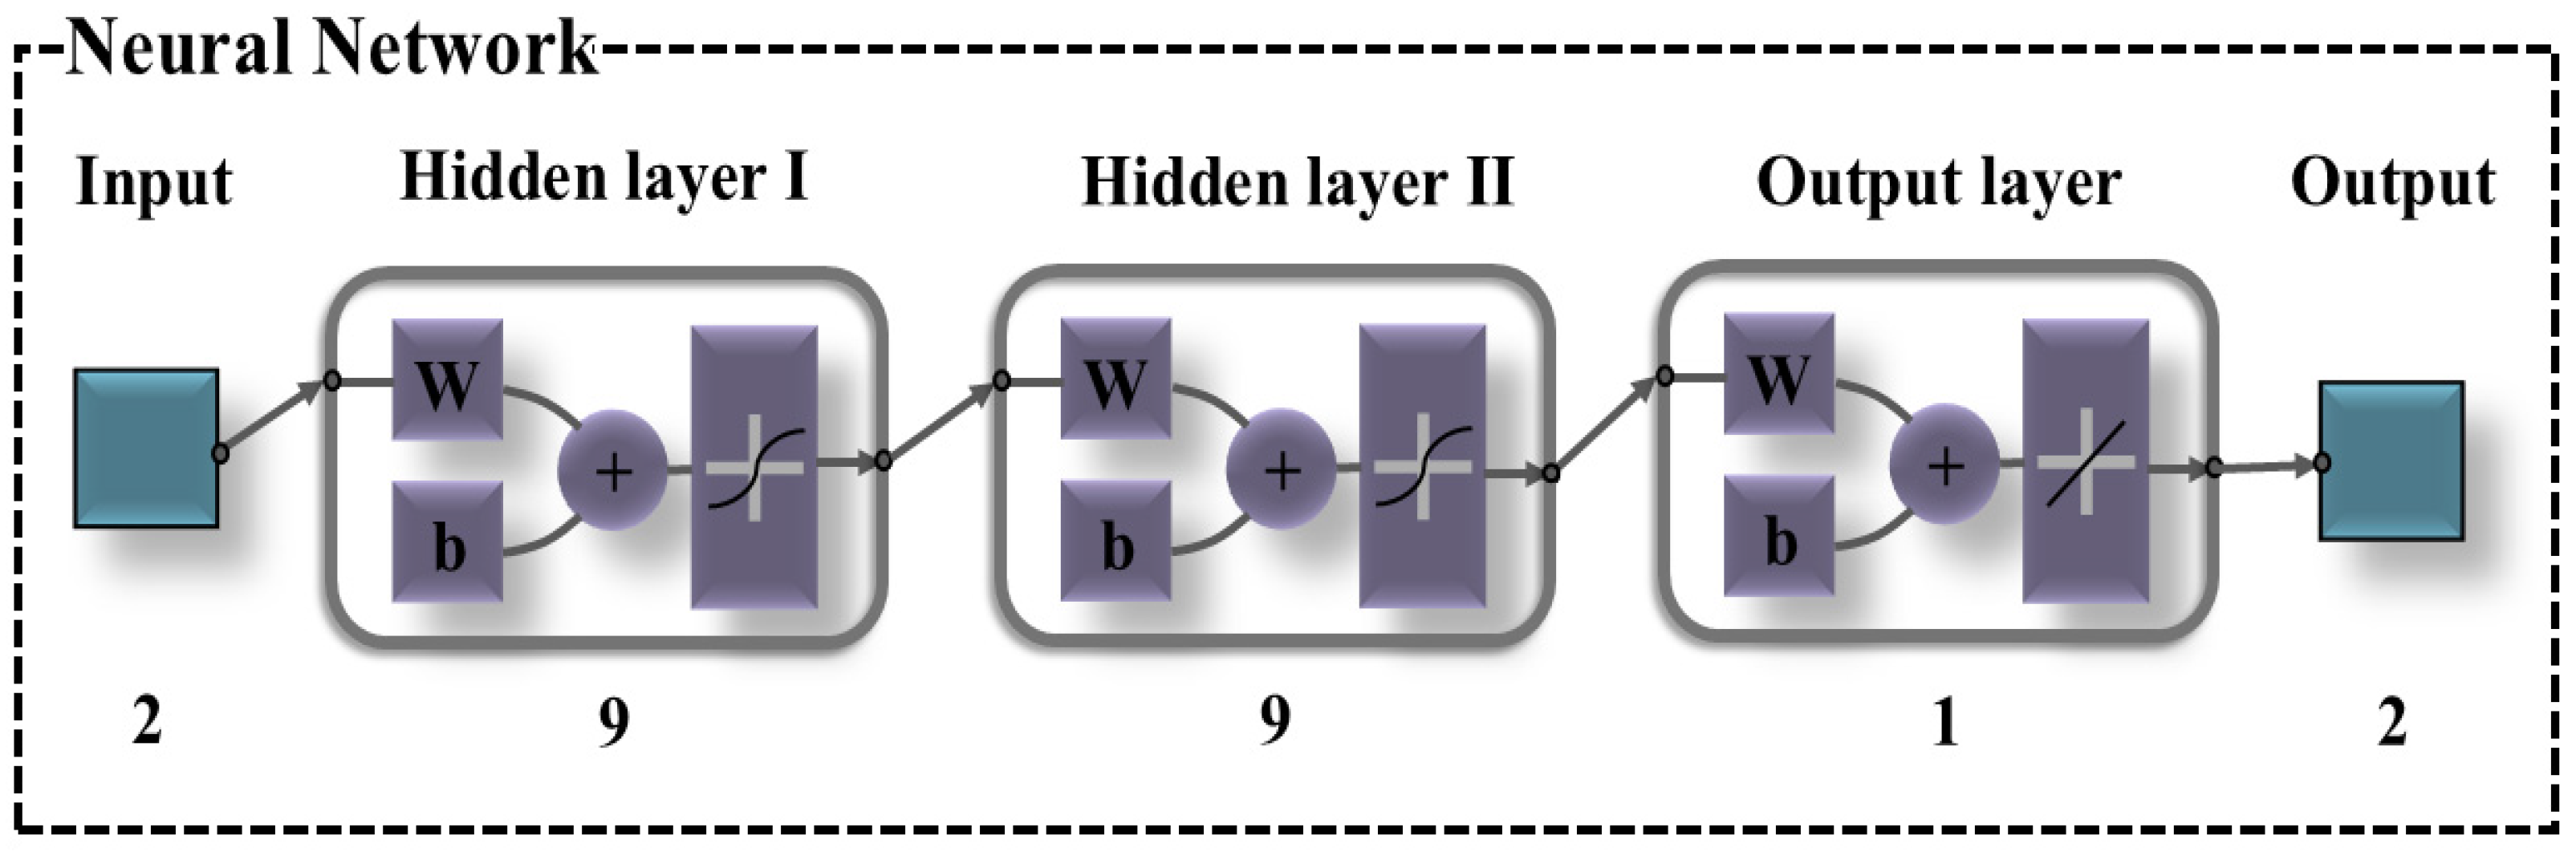
Based on repeated trials, other parameters of the BP neural network were set as follows: 100 iterations, the learning rate of 0.1, and the training target error of 0.001. In the MATLAB software environment, using the blank holder force and die clearance as input variables and “maximum thickening rate” and “maximum thinning rate” as prediction targets, a 2-9-9-1-2 neural network model was constructed, as shown in Figure 6.
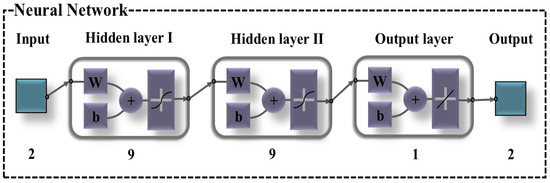
Figure 6.
BP neural network model.
In this model, 21 sets of sample data are used for training and nine sets for prediction, with the prediction results shown in Table 7.
Table 7.
Prediction error table.
During the prediction phase, the maximum average error rate of the part was 2.22%, and the minimum average error rate was only 0.67%. Based on this analysis, the average error rate during the prediction phase was well below 5%, indicating that the network model has a high predictive accuracy for such problems.
4.3.2. Genetic Algorithm Optimization
The genetic algorithm is a heuristic algorithm that is easy to implement, highly accurate, and fast-converging [20]. Therefore, this study utilized the genetic algorithm for optimization solving. In the optimization phase using the genetic algorithm, binary encoding composed of 0 and 1 is currently the most widely used encoding method. Therefore, this genetic algorithm adopts binary encoding. For the selection mechanism, the survival of the fittest was used to improve search efficiency and ensure the survival probability of excellent individuals. For the crossover method, multi-point crossover was used to increase the possibility of finding the global optimal solution. For the mutation method, random resetting was used to increase the genetic diversity of the population. Through multiple experiments, it was found that the best fitness no longer changed after about 80 iterations, so the number of iterations was set to 100. Based on the optimization objectives and data characteristics, the population size of this genetic algorithm was set to 50, with a crossover probability of 0.3, a mutation probability of 0.2, and an elite retention strategy size of 10. The mathematical model (formula (10)) was used as the fitness function, and (150, 600) and (0.90, 1.35) were used as the constraint conditions for the blank holder force and die clearance, respectively. Through 100 iterations of optimization, the minimum value of the fitness value was the minimum value of the comprehensive score, and the fitness convergence curve is shown in Figure 7.
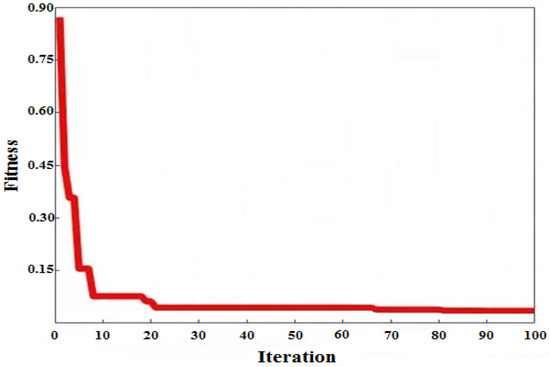
Figure 7.
Convergence curve of adaptation.
During the first 10 iterations, the fitness curve decreased rapidly, and then its rate of decline gradually reduced. Around the 20th iteration, the fitness curve quickly stabilized, showing no significant upward or downward trend, indicating that the algorithm had found a relatively optimal solution. As the iterations continued, although the changes in fitness were very minor, there were still variations around the 67th and 81st iterations. This suggests that the algorithm is gradually converging to the optimal or near-optimal solution, confirming that the algorithm has good convergence characteristics.
4.3.3. Result Analysis Verification
Based on the neural network genetic algorithm function optimization model, the results obtained are shown in Table 8. When the blank holder force reached 462.71 kN and the die clearance reached 1.09 mm, the score of the comprehensive score approached 0.03, indicating the optimal “maximum thickening rate” and “maximum thinning rate” were 3.97% and 25.96%, respectively, and the forming quality of the part was the best.
Table 8.
Optimization result.
In order to verify the accuracy of the optimization model and the reliability of the analysis results, DYNAFORM finite element software was used to perform numerical simulation on the optimal process parameter combination, and the simulation analysis results are shown in Figure 8.

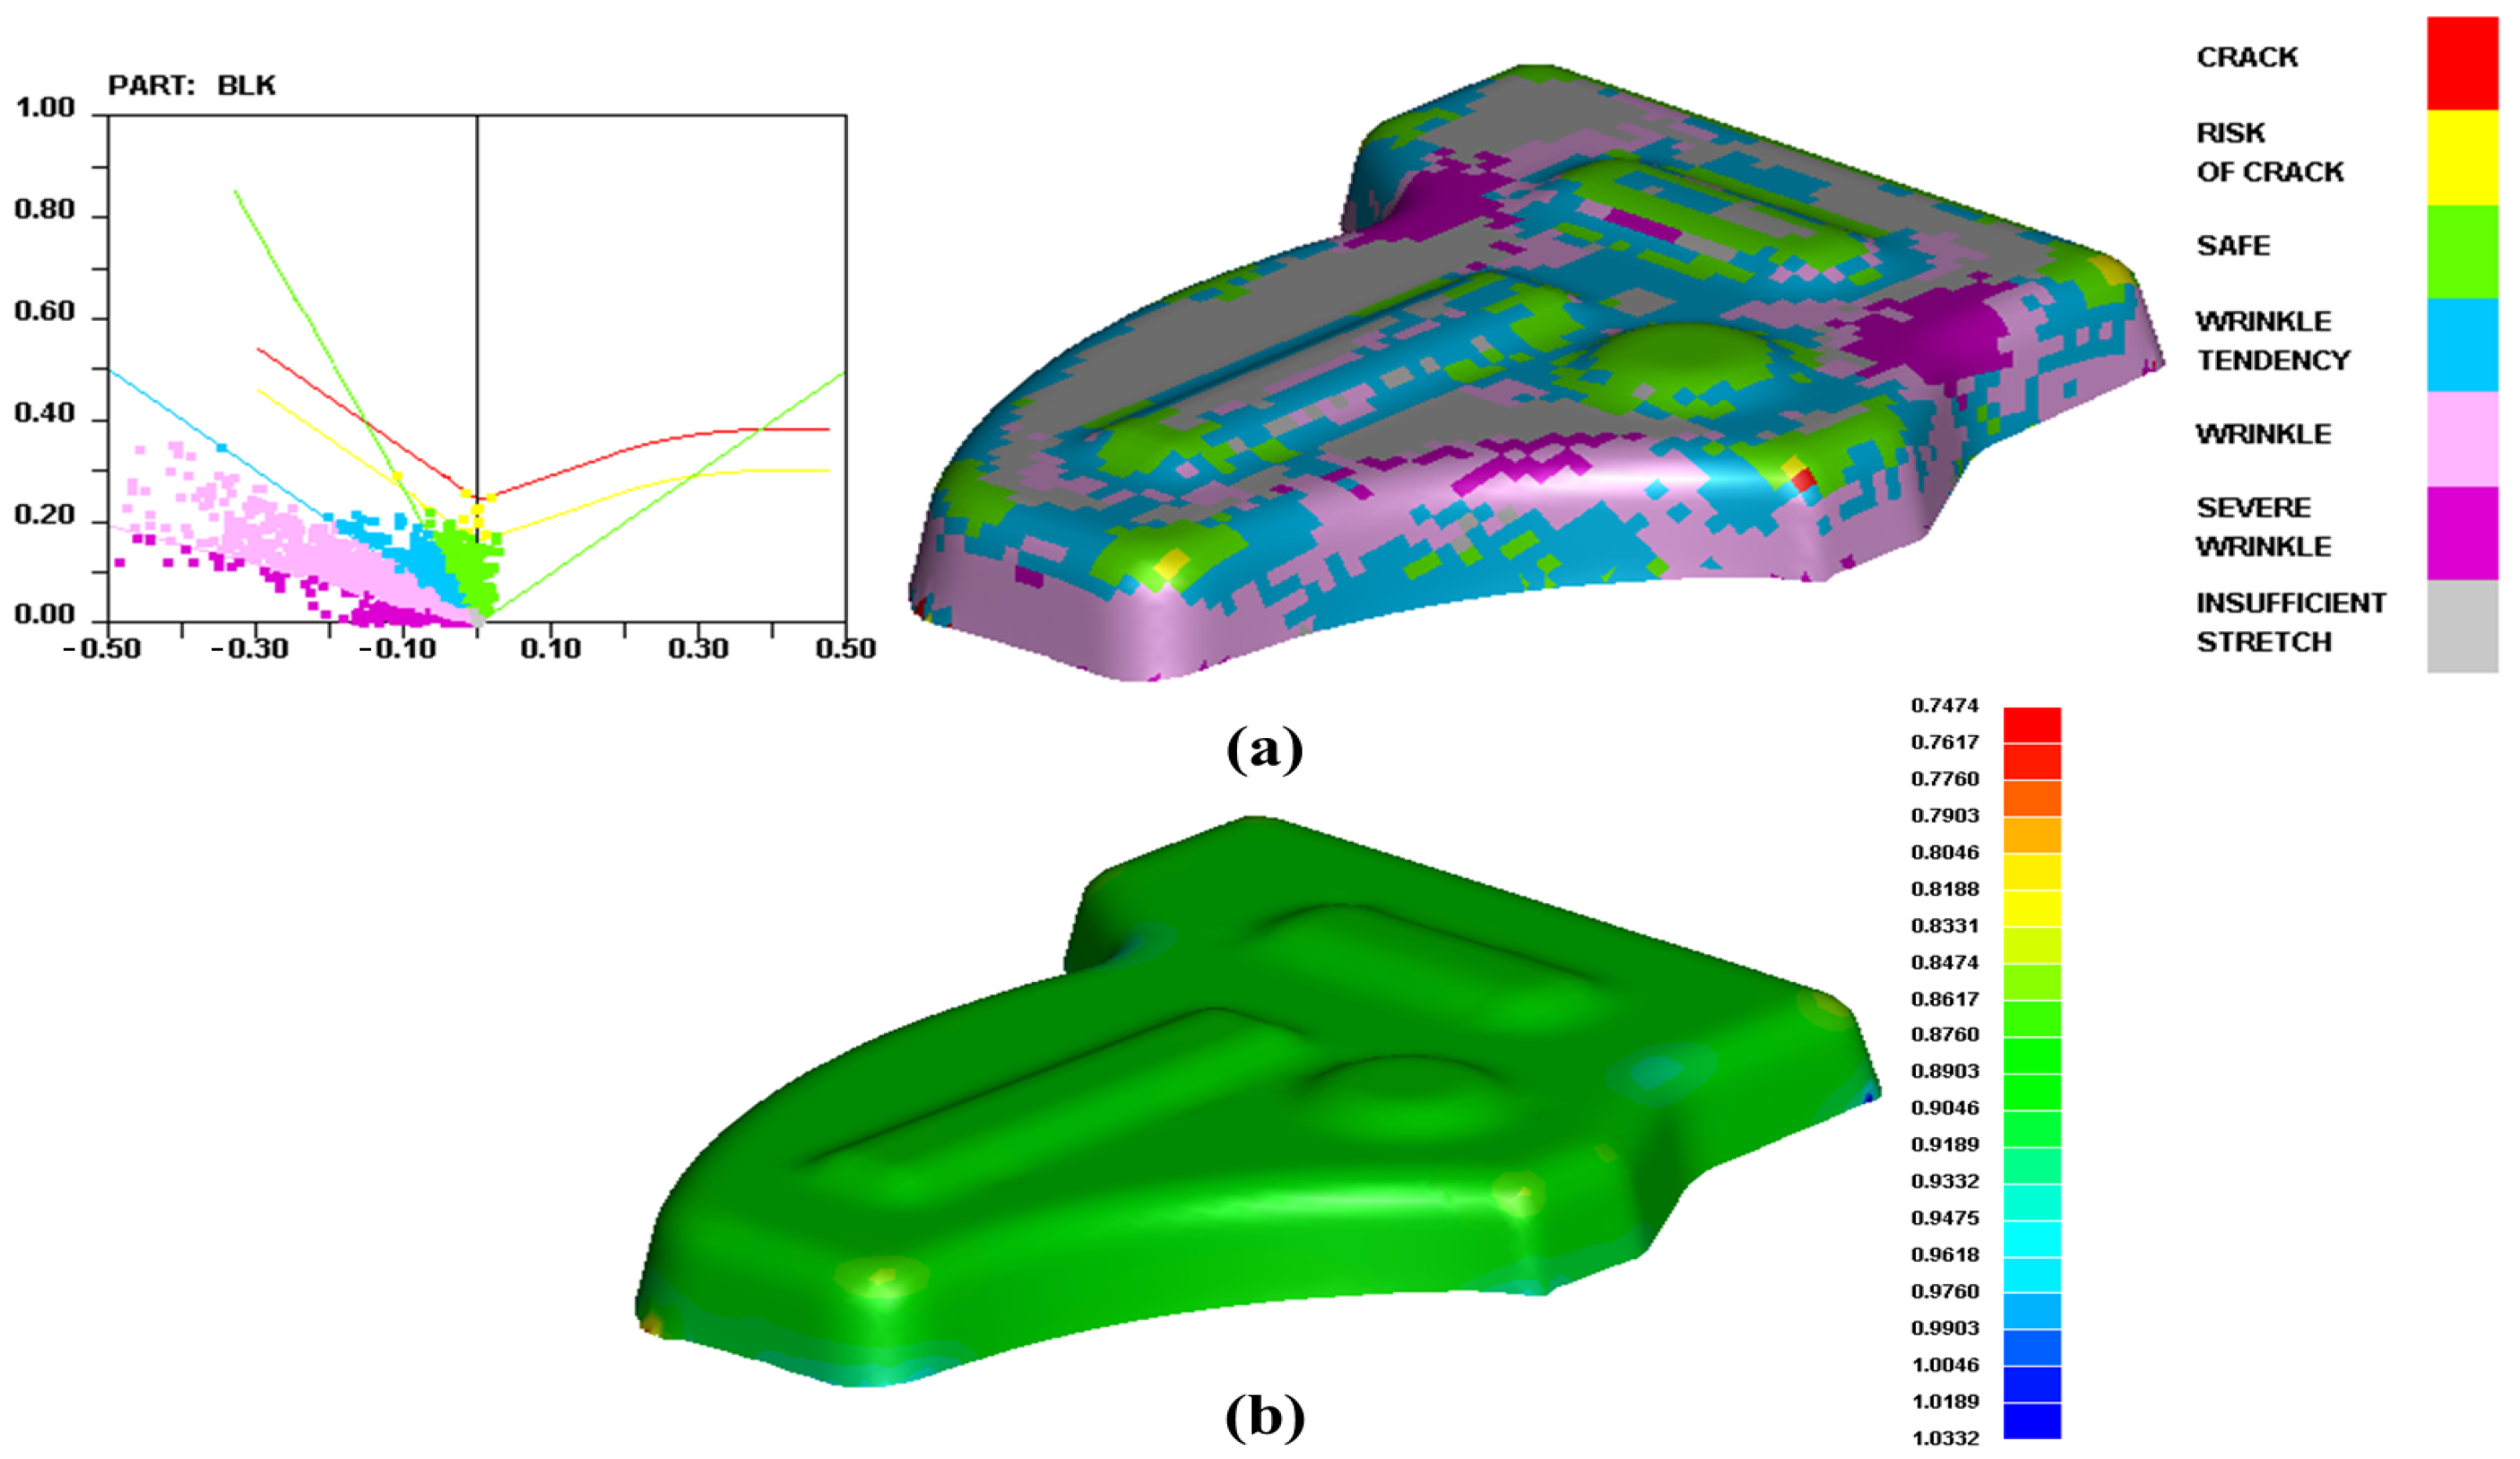
Figure 8.
Simulation analysis cloud diagram: (a) forming limit diagram; (b) thickness distribution diagram.
As shown in Figure 8, the overall forming effect of the part was good. Although there was a large area of slight wrinkling in the part, the numerical indicators met the quality requirements, and there was no cracking; the “maximum thickening rate” was 3.32%, meeting the production requirement that the “maximum thickening rate” did not exceed 5%; the “maximum thinning rate” was 25.26%, meeting the production requirement that the “maximum thinning rate” was less than 30%. Subsequently, the “maximum thinning rate” optimized was compared with the “maximum thinning rate” simulated, as shown in Table 9.
Table 9.
Optimization error table.
The difference between the optimization results and the simulation results was extremely small, with an average error value of only 0.675%, and the forming effect of the part was greatly improved. This result demonstrates the excellent predictive accuracy and optimization efficiency of the neural network genetic algorithm function optimization model.
In addition, by comparing the results of range analysis and the simulation effects of the optimization model, the performance differences between the two methods in improving the metal sheet forming process are revealed. The “maximum thickening rate” and “maximum thinning rate” obtained from range analysis were 4.53% and 28.21%, respectively, while after applying the optimization model, the “maximum thickening rate” and “maximum thinning rate” were reduced to 3.32% and 25.26%, respectively, showing reductions of 1.21% and 2.95%. Although the orthogonal experiment also had a certain effect on improving the quality of metal sheet forming, its optimization effect was relatively weaker compared with the optimization model.
5. Validation of Simulation Research
In the study of forming quality for engine hoods, there are multiple suboptimal solutions, such as the commonly used orthogonal experiment and response surface model methods. Both the orthogonal experiment method and the response surface model have significant limitations when searching for the optimal combination of process parameters. The orthogonal experiment method predicts optimal conditions based on a limited number of experimental combinations, which may overlook interactions between parameters, leading to less accurate results. Although the response surface model can account for interactions, it relies heavily on model assumptions, which, if incorrect, can result in significant prediction errors. Therefore, this study employed a neural network-genetic algorithm function optimization model to optimize the forming quality of agricultural tractor engine hoods. The results fully confirmed the applicability and superiority of the neural network-genetic algorithm function optimization model in optimizing metal forming quality, demonstrating its excellent predictive accuracy and optimization efficiency.
Due to the differences between the parts studied in this paper and those in the referenced literature, it is challenging to fully validate the conclusions of this study using precise data from a single reference. These differences may arise from factors such as variations in the geometric shapes, material properties, or simulation parameters of the parts. However, through the validation of some results from DYNAFORM simulation studies (Jstamp/NV) and the related literature (such as [11] and [12]), it is accurately demonstrated that the method adopted in this study can effectively address quality issues in the deep drawing of engine hoods. This finding is also consistent with empirical rules observed in actual production. Current research is actively addressing these validation issues and conducting physical experiments to ensure the reliability and consistency of the results.
6. Conclusions
This paper took the hood of an agricultural tractor engine as the research object, adopted numerical simulation, data analysis, and optimization algorithm as the combination method to explore its stretch forming process, and systematically analyzed the deformation law of the parts, as well as the influence degree of each process parameter, and this research showed the following:
- (1)
- The results of the quality evaluation indicated that wrinkling and cracking were the main quality problems of the part.
- (2)
- Grey relational analysis indicates that the blank holder force and die clearance have a significant impact on the “maximum thickening rate” and “maximum thinning rate”, whereas the impact of the stamping speed and friction coefficient on these rates is smaller.
- (3)
- In the pursuit of minimizing the “maximum thickening rate” and “maximum thinning rate”, the neural network genetic algorithm function optimization model was used to optimize the process parameters of the engine hood, obtaining the optimal combination of process parameters: the blank holder force of 462.71 kN, die clearance of 1.09 mm, and the corresponding “maximum thickening rate” and “maximum thinning rate” of 3.97% and 25.96%, respectively, with an average error value of 0.675% compared with the simulation result.
Author Contributions
Conceptualization, S.W.; Software, S.W.; Formal analysis, S.W.; Resources, Y.W.; Data curation, S.W.; Writing—original draft, S.W.; Writing—review & editing, S.W. and Y.W.; Supervision, S.W., Y.W., Y.M. and M.W.; Funding acquisition, Y.W. All authors have read and agreed to the published version of the manuscript.
Funding
This research was supported by the Science Research Plan of the Department of Education of Hubei Province, Grant No. D20221606.
Institutional Review Board Statement
Not applicable.
Informed Consent Statement
Not applicable.
Data Availability Statement
The original contributions presented in the study are included in the article, further inquiries can be directed to the corresponding author.
Conflicts of Interest
The authors declare no conflict of interest.
References
- Zhu, M.Y.; Fu, J.; Cui, L.C. Optimization of stamping parameters for G series forklift engine hood. Forg. Stamp. Technol. 2014, 39, 27–30. [Google Scholar]
- Wang, S.F.; Chen, S.F.; He, X.H. Numerical analysis of stamping forming for special-shaped thin-walled stainless steel heat shield. J. Plast. Eng. 2022, 29, 19–27. [Google Scholar]
- Qin, B.Y.; Qin, W.D.; Lin, X.K. Application of response surface method to optimize process parameters in engine heat shield forming. Forg. Stamp. Technol. 2016, 41, 22–28. [Google Scholar]
- Wu, A.M. Stamping simulation test and analysis on automobile stainless steel cover plate. Forg. Stamp. Technol. 2021, 46, 131–135. [Google Scholar]
- Zheng, S.H. Numerical Simulation and Process Optimization of Deep Drawing of Double Box Stainless Steel Sink. Ph.D. Thesis, Zhejiang University of Technology, Hangzhou, China, 2020. [Google Scholar]
- Hang, T.P.; Takeshi, I. An evaluation of fracture properties of type-304 austenitic stainless steel at high deformation rate using the small punch test. Int. J. Mech. Sci. 2018, 144, 249–261. [Google Scholar]
- Zhang, Y.; Gu, X.; WU, H.L. Influence and Prediction of Transition Zone Parameters on Hydraulic Bulging Properties for TRB Tube. Forg. Stamp. Technol. 2017, 42, 99–104. [Google Scholar]
- Fathi, H.; Emadoddin, E.; Mohammadian, S.H.R. Effect of punch speed on the formability behaviour of austenitic stainless steel type 304l. Met. Mater. Int. 2016, 47, 3897–3911. [Google Scholar]
- Wang, S.; Wu, Y.; Ma, Y.M. Finite Element-based Analysis and Optimization of Agricultural Tractor Fender Bending. J. Shandong Agric. Univ. (Nat. Sci. Ed.) 2023, 54, 782–791. [Google Scholar]
- He, Q.Z.; Li, H. Optimization and Prediction of Ironing Process for Cylindrical Parts Based on Grey System Theory. J. Plast. Eng. 2019, 26, 57–62. [Google Scholar]
- Xiong, W.T.; Xie, S.S.; Huang, Z.F. Optimization of drawing forming for front panel of an automobile based on neural network genetic algorithm function optimization and SCP technology. J. Plast. Eng. 2020, 27, 38–45. [Google Scholar]
- Xiong, W.T.; Liu, J.; Huang, Z.F. Optimization of Automobile Crossbeam Forming Based on Neural Network Genetic Algorithm Function Optimization and Springback Compensation. Hot Work. Technol. 2019, 48, 68–74. [Google Scholar]
- Tian, Y.; Lv, M.D.; Huang, Y.P. Parameter optimization of stamping process on auto front door reinforcing plate. Forg. Stamp. Technol. 2014, 39, 35–38. [Google Scholar]
- Xiong, W.T.; Liu, H.B.; Li, H.W. Optimization of Sheet Metal Forming Based on GS theory and Neural Network Genetic Algorithm. Mach. Des. Res. 2016, 32, 118–122. [Google Scholar]
- Li, Y.Y.; Hu, C.R. Experiment Design and Data Processing, 2nd ed.; Chemical Industry Press: Beijing, China, 2020; pp. 164–166. [Google Scholar]
- Xie, Y.M.; Wang, X.B.; Wang, Z. Parameter Inverse Problem for Drawbeads Based on the Gray Theory and GA-BP. J. Mech. Eng. 2013, 49, 44–50. [Google Scholar] [CrossRef]
- Xiong, W.T.; Liu, H.B.; Sun, Y.G. Forming optimization of automobile covering parts based on GS theory and neural network. Ord. Mater. Sci. Eng. 2017, 40, 84–89. [Google Scholar]
- Guo, Q.; Zheng, Y.P.; Zhu, W.Q. Research on high strength steel forming based on BP neural network genetic algorithms. Mater. Sci. Technol. Lond. 2020, 28, 89–96. [Google Scholar]
- Wang, X.C.; Shi, F.; Yu, L. 43 Case Studies of MATLAB Neural Networks, 2nd ed.; Beihang University Press: Beijing, China, 2011; pp. 17–18, 34–35. [Google Scholar]
- Feng, Q.Q.; Zhou, X. Automated and Robust Multi-Objective Optimal Design of Thin-Walled Product Injection Process Based on Hybrid RBF-MOGA. Int. J. Adv. Manuf. Technol. 2019, 101, 2217–2231. [Google Scholar] [CrossRef]


Disclaimer/Publisher’s Note: The statements, opinions and data contained in all publications are solely those of the individual author(s) and contributor(s) and not of MDPI and/or the editor(s). MDPI and/or the editor(s) disclaim responsibility for any injury to people or property resulting from any ideas, methods, instructions or products referred to in the content. |
© 2024 by the authors. Licensee MDPI, Basel, Switzerland. This article is an open access article distributed under the terms and conditions of the Creative Commons Attribution (CC BY) license (https://creativecommons.org/licenses/by/4.0/).