Article

Experimental Flow Performance Investigation of Francis Turbines from Model to Prototype

1
State Key Laboratory of Hydroscience and Engineering & Department of Energy and Power Engineering, Tsinghua University, Beijing 100084, China
2
S.C.I. Energy, Future Energy Research Institute, 8706 Zurich, Switzerland
*
Author to whom correspondence should be addressed.
These authors contributed equally to this work.
Appl. Sci. 2024, 14(17), 7461; https://doi.org/10.3390/app14177461 (registering DOI)
Submission received: 16 July 2024 / Revised: 16 August 2024 / Accepted: 20 August 2024 / Published: 23 August 2024

Abstract

:
Investigating the flow performance of Francis turbines from model to prototype is a complex but essential process for ensuring reliable and efficient turbine operation in hydropower plants. It ensures that Francis turbine designs operate efficiently under various operating conditions, extending from laboratory reduced-scale models to full-scale prototype installations. In this investigation, a Francis turbine model was tested under different operating conditions, and its properties were measured, including torque, hydraulic efficiency, power output, cavitation coefficient, rotational speed, flow rate, and pressure pulsations. The results of the Francis turbine model test indicate that it achieved the maximum torque with the designed discharge and designed head. The cavitation coefficient consistently remained higher than the critical cavitation coefficient. The initial cavitation bubbles were observed at 50% partial load but disappeared at full load. Pressure pulsations under different operating conditions showed the maximum peak-to-peak amplitude appearing at the turbine inlet domain and the minimum amplitude occurring at the draft tube elbow. A hill chart shows that the model’s best efficiency was 93.66%, and the estimated best efficiency of the prototype was 95.03% at the design head. The conclusions and methodology of this study can be generalized to other similar hydraulic turbines, especially prototype Francis turbines that lack experimental results.

1. Introduction

Hydropower is a major source of renewable energy that utilizes the potential energy of water (hydrostatic head) to generate electricity. There are different forms of hydropower generation, including power generation with a dammed reservoir, run-of-river system hydroelectricity, pumped storage, and in-river systems [1]. Hydropower produces fewer pollutants than fossil energy, and it is an important clean and renewable energy source that has been widely adopted worldwide, effectively reducing environmental impact and meeting sustainable energy requirements [2]. Hydropower generation demonstrates an average growth rate of around 3% in the context of achieving net zero emissions by 2050.
Francis turbines are a type of reaction turbine widely used in hydroelectric power stations to generate electricity. The runners of Francis turbines are equipped with a number of three-dimensional twisted blades arranged symmetrically around the center hub. This rotational symmetry arrangement of the Francis turbine runners ensures that the water flows uniformly through the turbine, and the forces acting on the blades are balanced, enabling the smooth rotation and efficient energy conversion of the Francis turbine units. There are some unexpected phenomena, e.g., cavitation and draft tube pressure pulsation under partial load operating conditions, which can induce strong vibrations and high mechanical stresses on the turbine runners and damage them.
Singh., S. et al. investigated the effects of material lost under different partial load conditions on turbine blades. Their study found that variations in the inlet and outlet domains of the blades can cause material loss, resulting in decreased torque in the turbine [3]. Luna–Ramírez, A. et al. conducted a failure analysis of the runner blades of a Francis hydraulic turbine, focusing on the distribution at low pressure and cavitation along the blade edges. The study aimed to assess low-pressure factors in order to better understand the causes and effects of cavitation on the turbine’s performance [4]. Dorji, U. et al. and Thapa, B.S. et al. investigated the failure modes of the Francis turbine, attributing blade failure to cyclic stress-induced pitting caused by silt erosion. They noted that this erosion leads to fatigue, emphasizing the role of material-related issues in blade failure [5,6].
Guangjie, P. et al. investigated the abrasion of Francis turbine blades, attributing wear and material loss to sediment carried in the flow. They revealed the damaging effects of blade cavitation on hydro turbines and have endeavored to develop effective solutions. However, these efforts have only achieved partial success in mitigating cavitation-induced damage [7]. Zuo, Z. et al. and Yamamoto, K. et al., investigated how blade curvature and water flow direction create adverse pressure gradients and induce flow separation leading to the formation of bubbles beneath the shear layer and the detachment of vortex cavitation between the blades [8,9]. Celebioglu, K. et al. investigated the cavitation mechanisms of Francis turbines at load conditions of 65%, 100%, and 110%. Their study found that adjusting the Francis runner guide vane angle from 17.5° to 16.5° improved the efficiency, increased the net head from 151 to 153.6 m, and increased the shaft power from 8.73 to 8.85 MW [10].
Berbecaru, A. et al. found that the primary causes of damage in hydro turbines include cavitation, sand erosion, material fatigue, and mechanical wear. Cavitation can be mitigated through improved hydraulic design, the use of corrosion-resistant materials, and the optimization of turbine operation to ensure that it remains within acceptable cavitation thresholds [11]. The experimental research conducted by Escaler, X. et al. aimed to evaluate cavitation occurrences in operational hydraulic turbines. The study employed a comprehensive approach involving the analysis of structural vibrations, acoustic emissions, and hydrodynamic pressures monitored within the turbines [12]. Bajic, B. et al. conducted a study focusing on the implementation of sound sampling, signal analysis, processing, and data interpretation within the realm of vibro-acoustic diagnostics for turbine cavitation [13]. Li, S. et al. investigated pressure fluctuations related to cavitation in hydraulic systems, impacting system design and safety during operation [14]. Hart, D. and Whale, D. et al. investigated an advanced weld-surfacing alloy specifically designed and evaluated for its resistance to cavitation–erosion in hydro turbines [15]. Caron, J.-F. et al. conducted a comprehensive investigation to assess the influence of flow unsteadiness on leading-edge cavitation [16].
Jacob, T. et al. investigated a prototype of the Francis turbine through empirical examination, employing pressure pulsation tests to assess draft tube surge and enhance turbine stability and efficiency [17]. Wang, F. et al. conducted a comprehensive study integrating experimental and numerical analyses to examine pressure pulsation characteristics in the draft tube and bracket vibrations, aiming to enhance the hydraulic stability of the Francis turbine [18]. Nicolet, C. et al. employed a high-speed camera to measure pressure pulsation characteristics, investigating initial cavitation formation and the draft tube vortex rope on a Francis turbine model [19]. Favrel, A. et al. employed the particle image velocimetry (PIV) method to investigate pressure pulsation characteristics and the formation of vortex ropes in a reduced-scale model of a Francis turbine [20]. Trivedi, C. et al. conducted experimental research on the Francis model, focusing on pressure pulsations under high-head conditions in the vaneless space, runner, and draft tube. Their study revealed significant low-pressure pulsation fluctuations across different working conditions [21]. Litvinov, I. et al. conducted an experiment focusing on the draft tube of the Francis turbine model. They employed the laser Doppler anemometer (LDA) technique to investigate pressure pulsations across various flow regimes [22]. Iliev, I. et al. conducted an experimental study of prototypes of Francis turbines operating at low rotational speeds. The study aimed to evaluate their efficiency, pressure pulsations, and hydraulic stability [23]. Wang, W. et al. measured draft tube pressure pulsations using information entropy and ensemble empirical mode decomposition to analyze hydraulic efficiency [24]. Wang, Z. and Trivedi, C. found that pressure loading is not coherent, as observed for different operating conditions. The pressure amplitudes vary rapidly during load change [25,26].
This study aims to estimate the performance characteristics of a prototype Francis turbine and validate its design through experimental model testing under partial load conditions and full load. Understanding the turbine’s operational efficiency across different operating points is crucial. The results of the study show that modeling tests can effectively evaluate the performance parameters of Francis turbines and validate their design under different load conditions, which is essential for developing prototype turbines and ensuring the stable operation of hydropower plants.

2. Methodology and Experimental Measurements Techniques

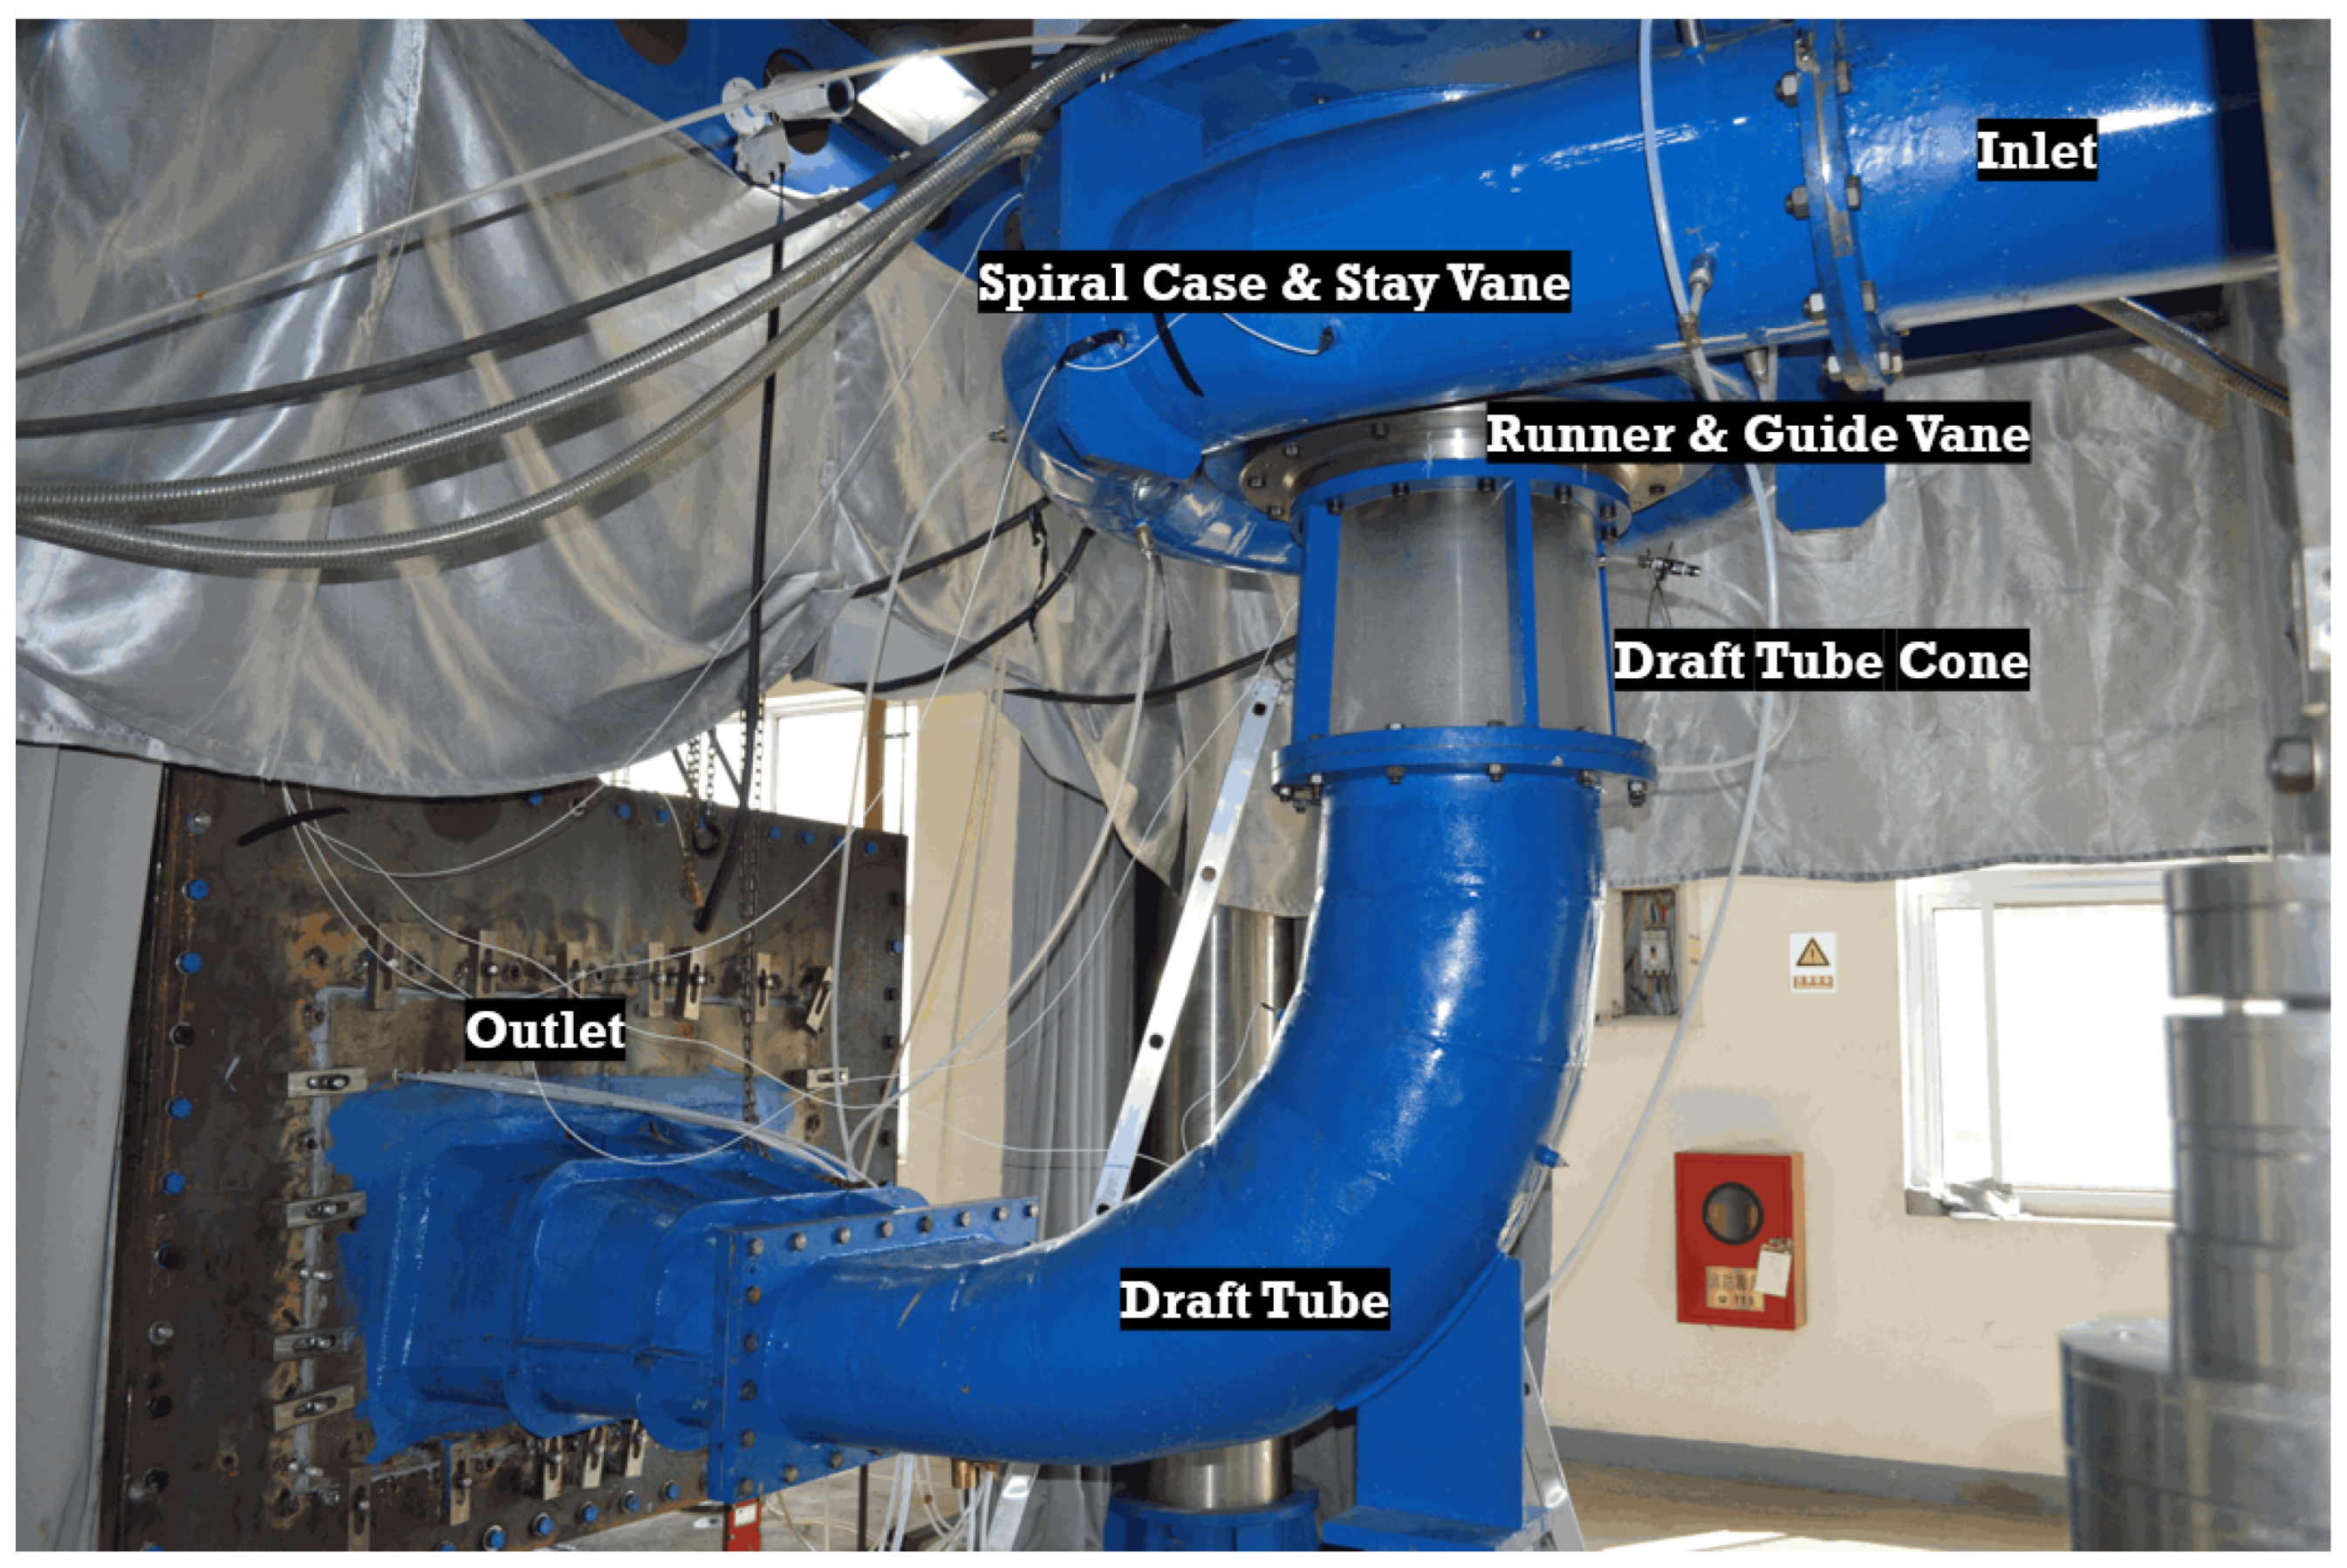
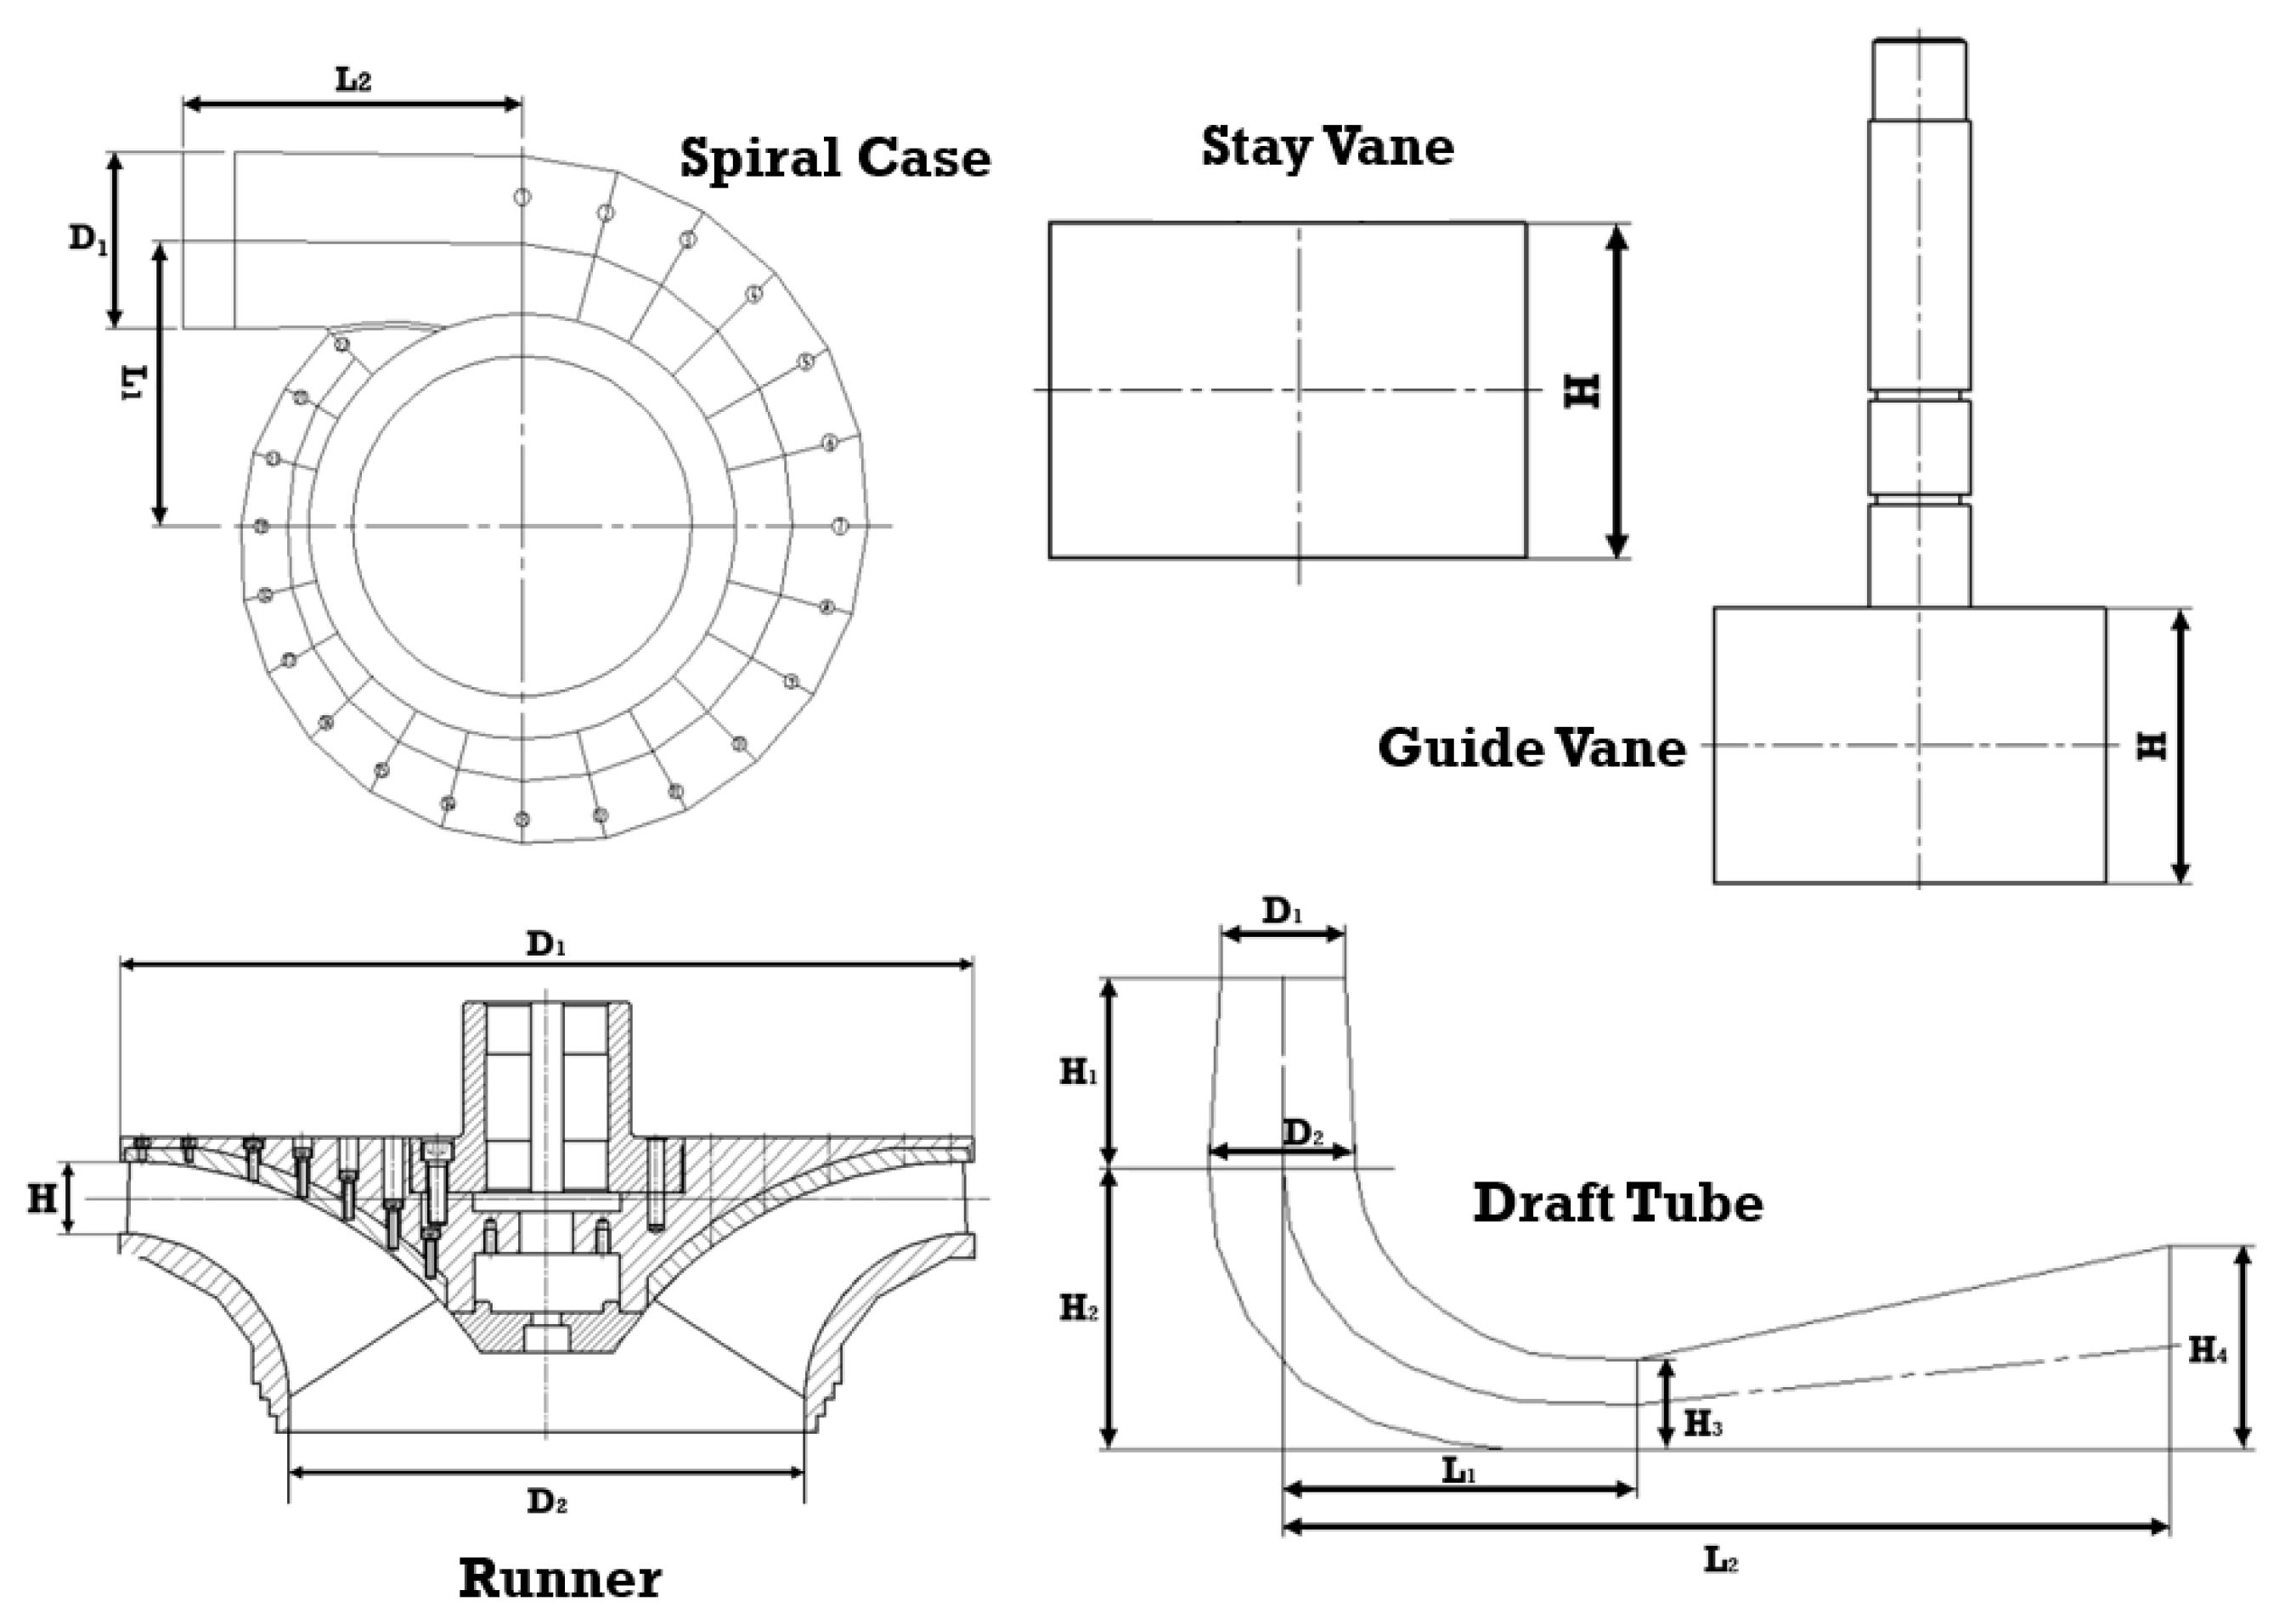
2.1. Experimental Test Rig

The turbine model used in the hydroelectric power station was tested at the Hydro Power Fluid Machinery Development and Testing Center in Tianjin, China. The test apparatus, shown in Figure 1, included a unit generator with a power range of 540 kW and a speed range of 0–2600 rpm. The power consumed by the two double-suction pumps was 724 kW. The flow measurement tank had a capacity of 180 m3, and the storage tank had a volume of 3000 m3. The unit’s maximum head was 150 m, with flow rates ranging from 0 to 2.2 m3/s, and the model runner testing range was between 250 and 500 mm. The following parameters were measured with the installed equipment: discharge, rotational speed, pressure, generator torque, frequency amplitude, spiral case inlet pressure, and draft tube outlet pressure, shown in Table 1.
The discharge was measured by an electromagnetic flow meter, which employed the pulsed DC (direct current) magnetic field technique. The flow meter equipment was installed in the inlet pipeline before the spiral case, measuring unit discharge under various load conditions. The total model torque, T m , is the sum of the motor-generator torque, T 1 , and the friction torque, T 2 . The torque transducer was mounted on the shaft that connected the runner to the motor generator. The performance equations with unit parameters of the model turbine were:
Unit speed ( rpm ) : n 11 = n m D m H m
Unit discharge ( m 3 / s ) : Q 11 = Q m D m 2 H m
Unit power ( W ) : P 11 = P m D m 2 H m 3 / 2
where n m , D m , Q m , H m , and P m are the rotational speed, runner diameter, flow rates, prototype head, and power output for the model turbine, respectively.
Pressure transducers, which are electromagnetic devices, were utilized for pressure measurements in various locations of the model Francis turbine. Figure 2 shows the locations of four selected measurement points: P 1 at the spiral inlet, P 2 at the head cover, P 3 in the draft cone, and P 4 at the draft tube elbow. According to IEC-60193 standard [27], the amplitude of a signal is defined as the extent of variation that encompasses a specific percentage of the sample. This definition was used in conjunction with the probability density function to determine the peak-to-peak values of the pressure signals. The magnitude of pressure pulsations in the draft tube was analyzed by obtaining peak-to-peak measurements with a 97% confidence interval.

2.2. Similarity Theory between the Francis Turbine Model and Prototype

The model turbine used for experimental measurements was scaled to 1/17.2 of the prototype size. The model turbine for the present investigation included the following components: a spiral case, 16 stay vanes, 24 guide vanes, a model runner with 15 long blades and 15 splitter blades, and a draft tube. The model runner had an inlet diameter of 0.5318 m and an outlet diameter of 0.35143 m. The flow rate and the rotational speed for the model turbine were 352 liters per second and 740 rpm, respectively. Figure 3 illustrates the dimensions of the Francis turbine model. Figure 3 presents a comprehensive visualization of the major components of the Francis turbine, highlighting their importance in converting hydraulic energy to mechanical energy and optimizing turbine performance. The spiral case evenly distributes water flow to the runner blades by gradually reducing the cross-sectional area using dimensions L 1 , L 2 , and D 1 to maintain a constant water velocity, crucial for maximizing energy conversion efficiency. The primary function of the stay vanes and guide vanes is to direct water flow onto the runner with minimal energy loss. The high H is indicative of their structural role in maintaining the shape and stability of the spiral case and water flow directions. The diagram depicts the runner’s cross-sectional view, with dimensions D 1 , D 2 , and H 1 representing the inlet diameter, outlet diameter, and height, respectively. These dimensions are critical for optimizing turbine efficiency and power output. The draft tube is a conduit that gradually expands to recover the kinetic energy of water and convert it into pressure energy. Dimensions D 1 , D 2 , H 1 , H 2 , H 3 , H 4 , L 1 , and L 2 represent critical factors for minimizing energy loss and vortex formation.
The experiment was conducted in accordance with international standards (IEC 60193) to ensure the stability and accuracy of measurements related to output, hydraulic efficiency, cavitation effects, and pressure pulsation behavior. The concepts of geometric and kinematic similarity, along with the fundamental dimensions and conversion parameters, are expressed in the following equations:
Rotation speed ( rpm ) : n p D p H p = n m D m H m
Flow rate ( m 3 / s ) : Q p D p 2 H p = Q m D m 2 H m
Power ( W ) : P p D p 3 H p 3 = P m D m 3 H m 3
where n p , D p , Q p , H p , and P p are the rotational speed, runner diameter, flow rates, prototype head, and power output for the prototype turbine, respectively.
The model’s Thoma cavitation factor ( σ m ) and specific speed are expressed as below:
σ m = H a H v H s H n
N s = H P m H m 5 / 4
where H a is the atmospheric head, H v is the vapor pressure head, H s is the suction head, and H n is the net head of the turbine.
The model hydraulic efficiency is driven by
η m = T m ω m ρ g Q m H m
where H a is the atmospheric head, H v is the vapor pressure head, H s is the suction head, and H n is the net head of the turbine.
The hydraulic efficiency was determined by the IEC(60193)-recommended Equation (10), also known as the Hutton equation, which estimated the best efficiency from model testing to prototype Francis turbine:
( Δ η h ) m * P = δ r e f [ ( Re r e f Re m ) 0.16 ( Re r e f Re p ) 0.16 ]
where ( Δ η h ) m * P is the estimated prototype efficiency, δ ref is relative scalable losses at point reference R e r e f , R e m * is the constant model Reynolds number, and R e p is the constant prototype Reynolds number.
All of the above-mentioned performance characteristic parameters were measured to validate performance and design under operating conditions ranging from 50% to 100%. The frequency sample rate was 2 kHz, and data were recorded for 500 s. The testing focused exclusively on unsteady-state operating conditions at a design-rated head of 40 m for the model turbine. The test apparatus utilized a semi-closed loop configuration with the upstream tank closed and the downstream tank open to the atmosphere.

3. Experimental Results and Discussions

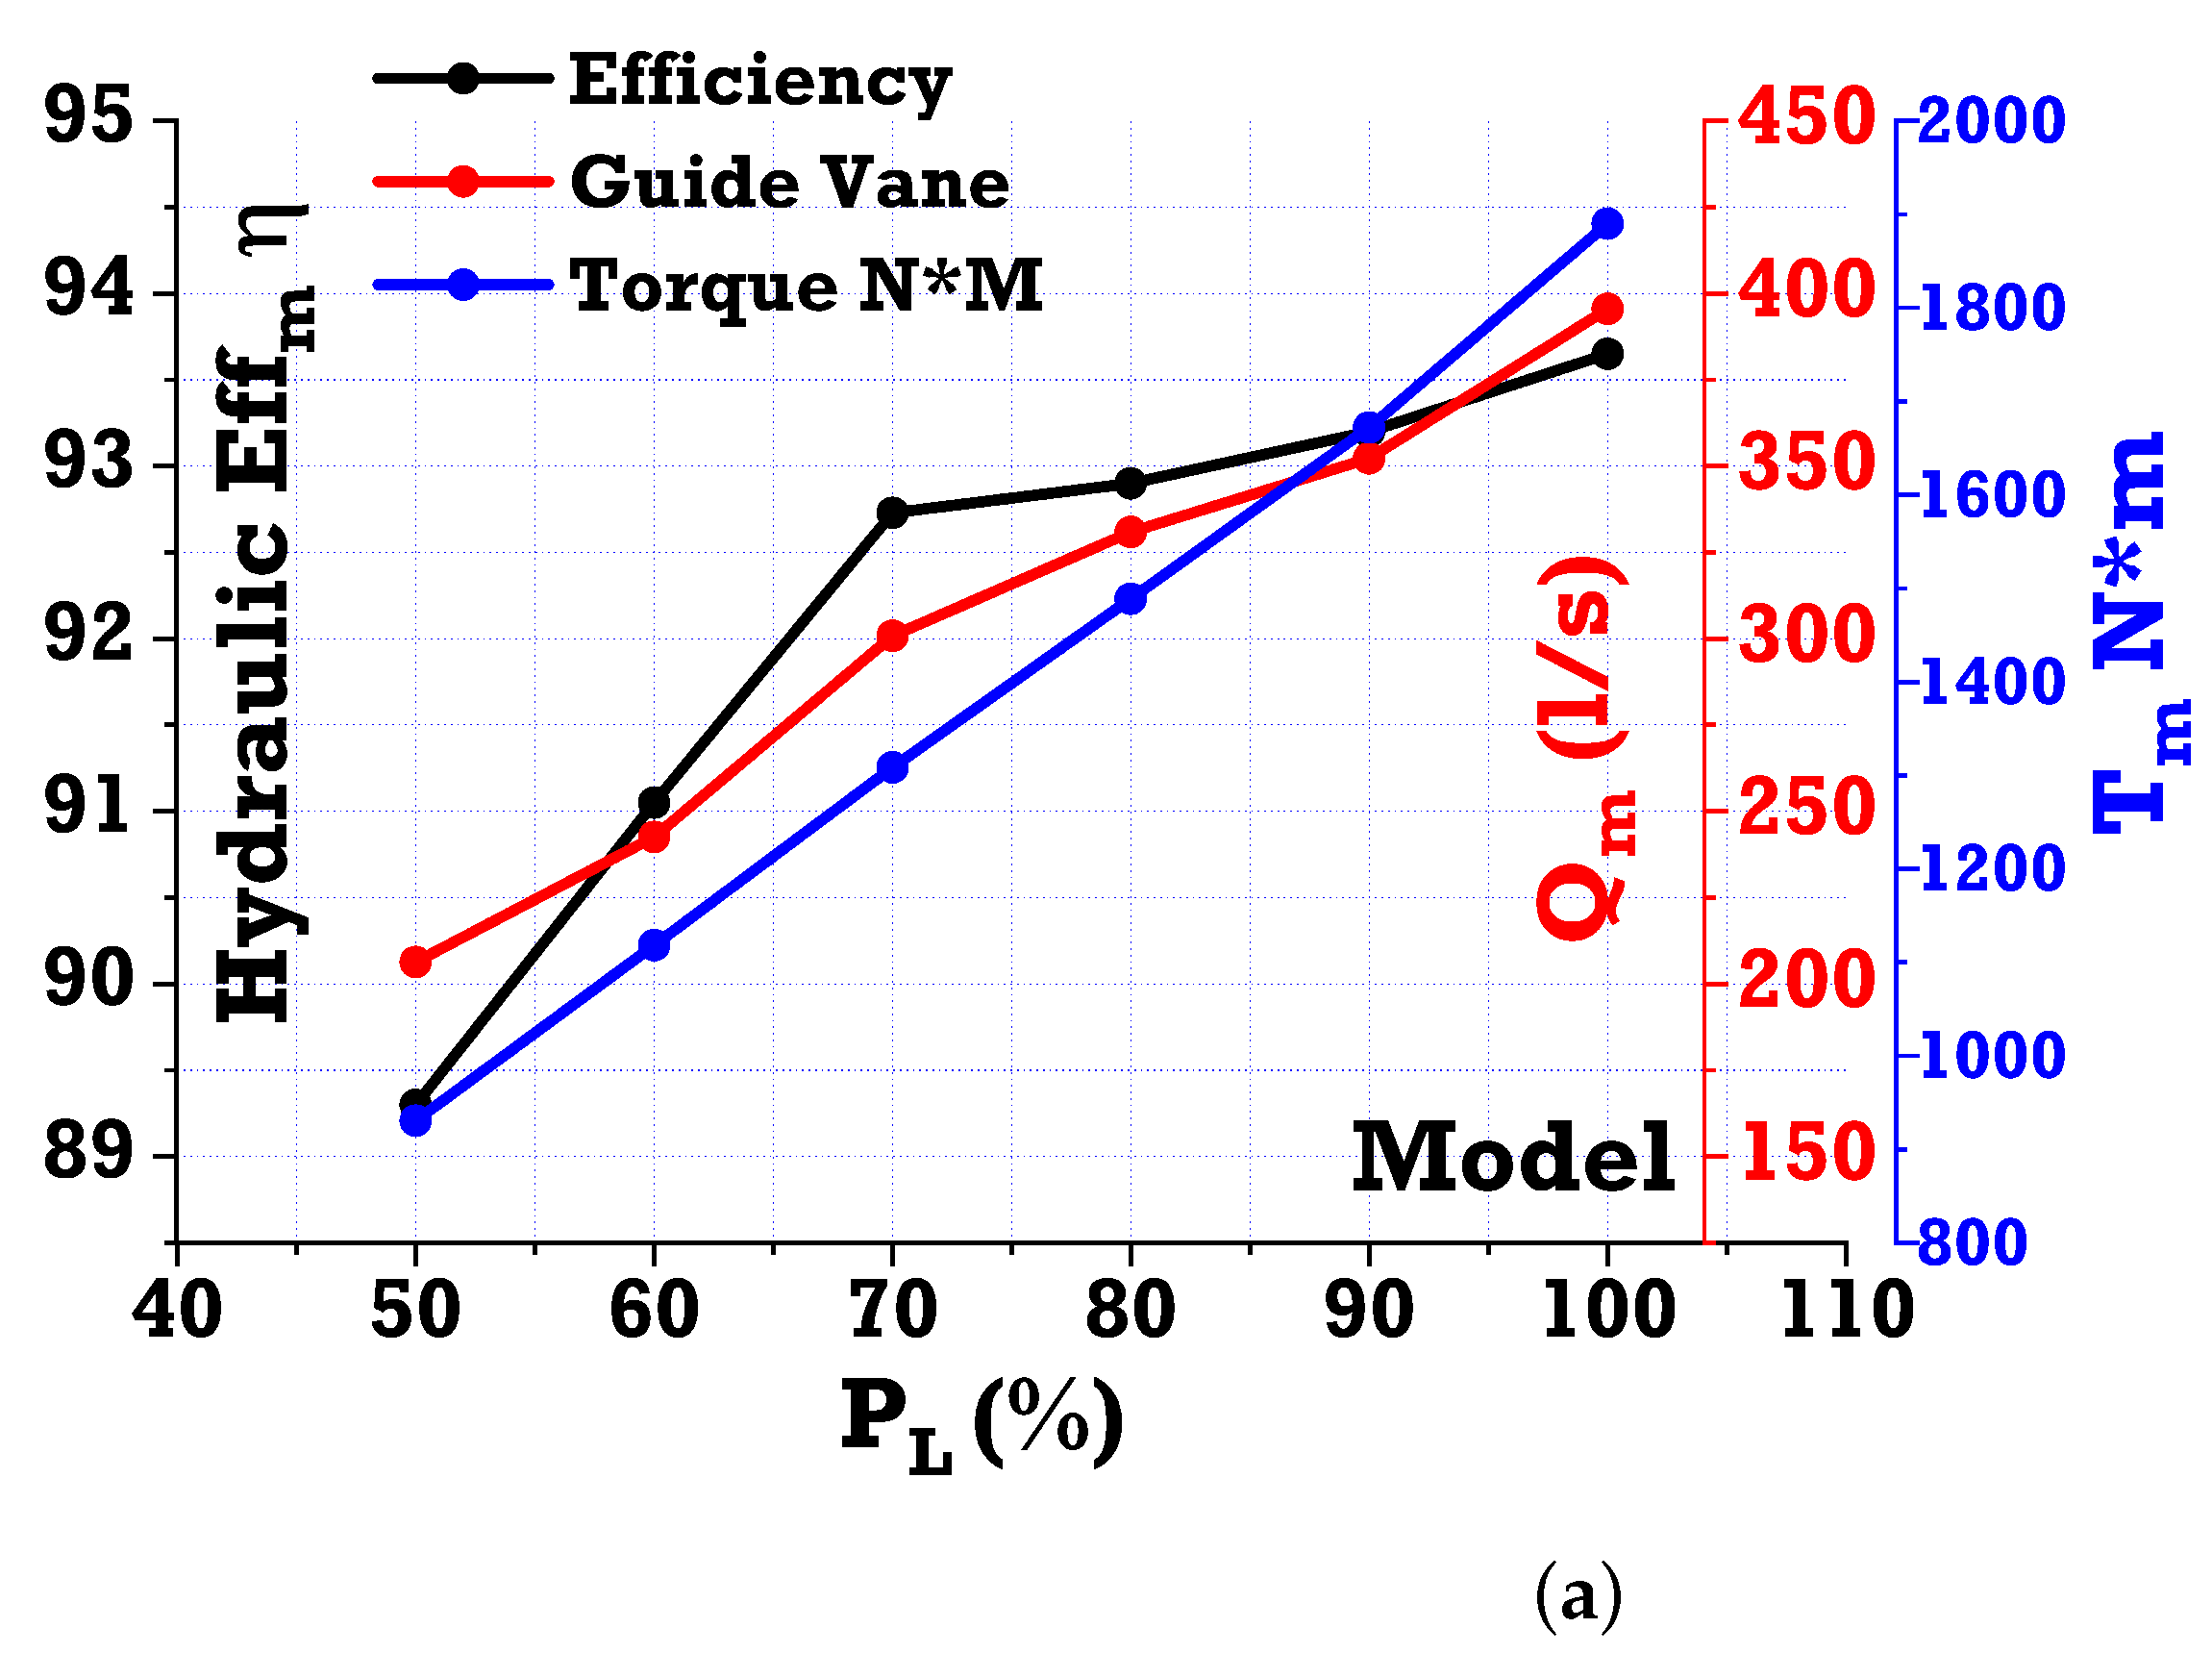
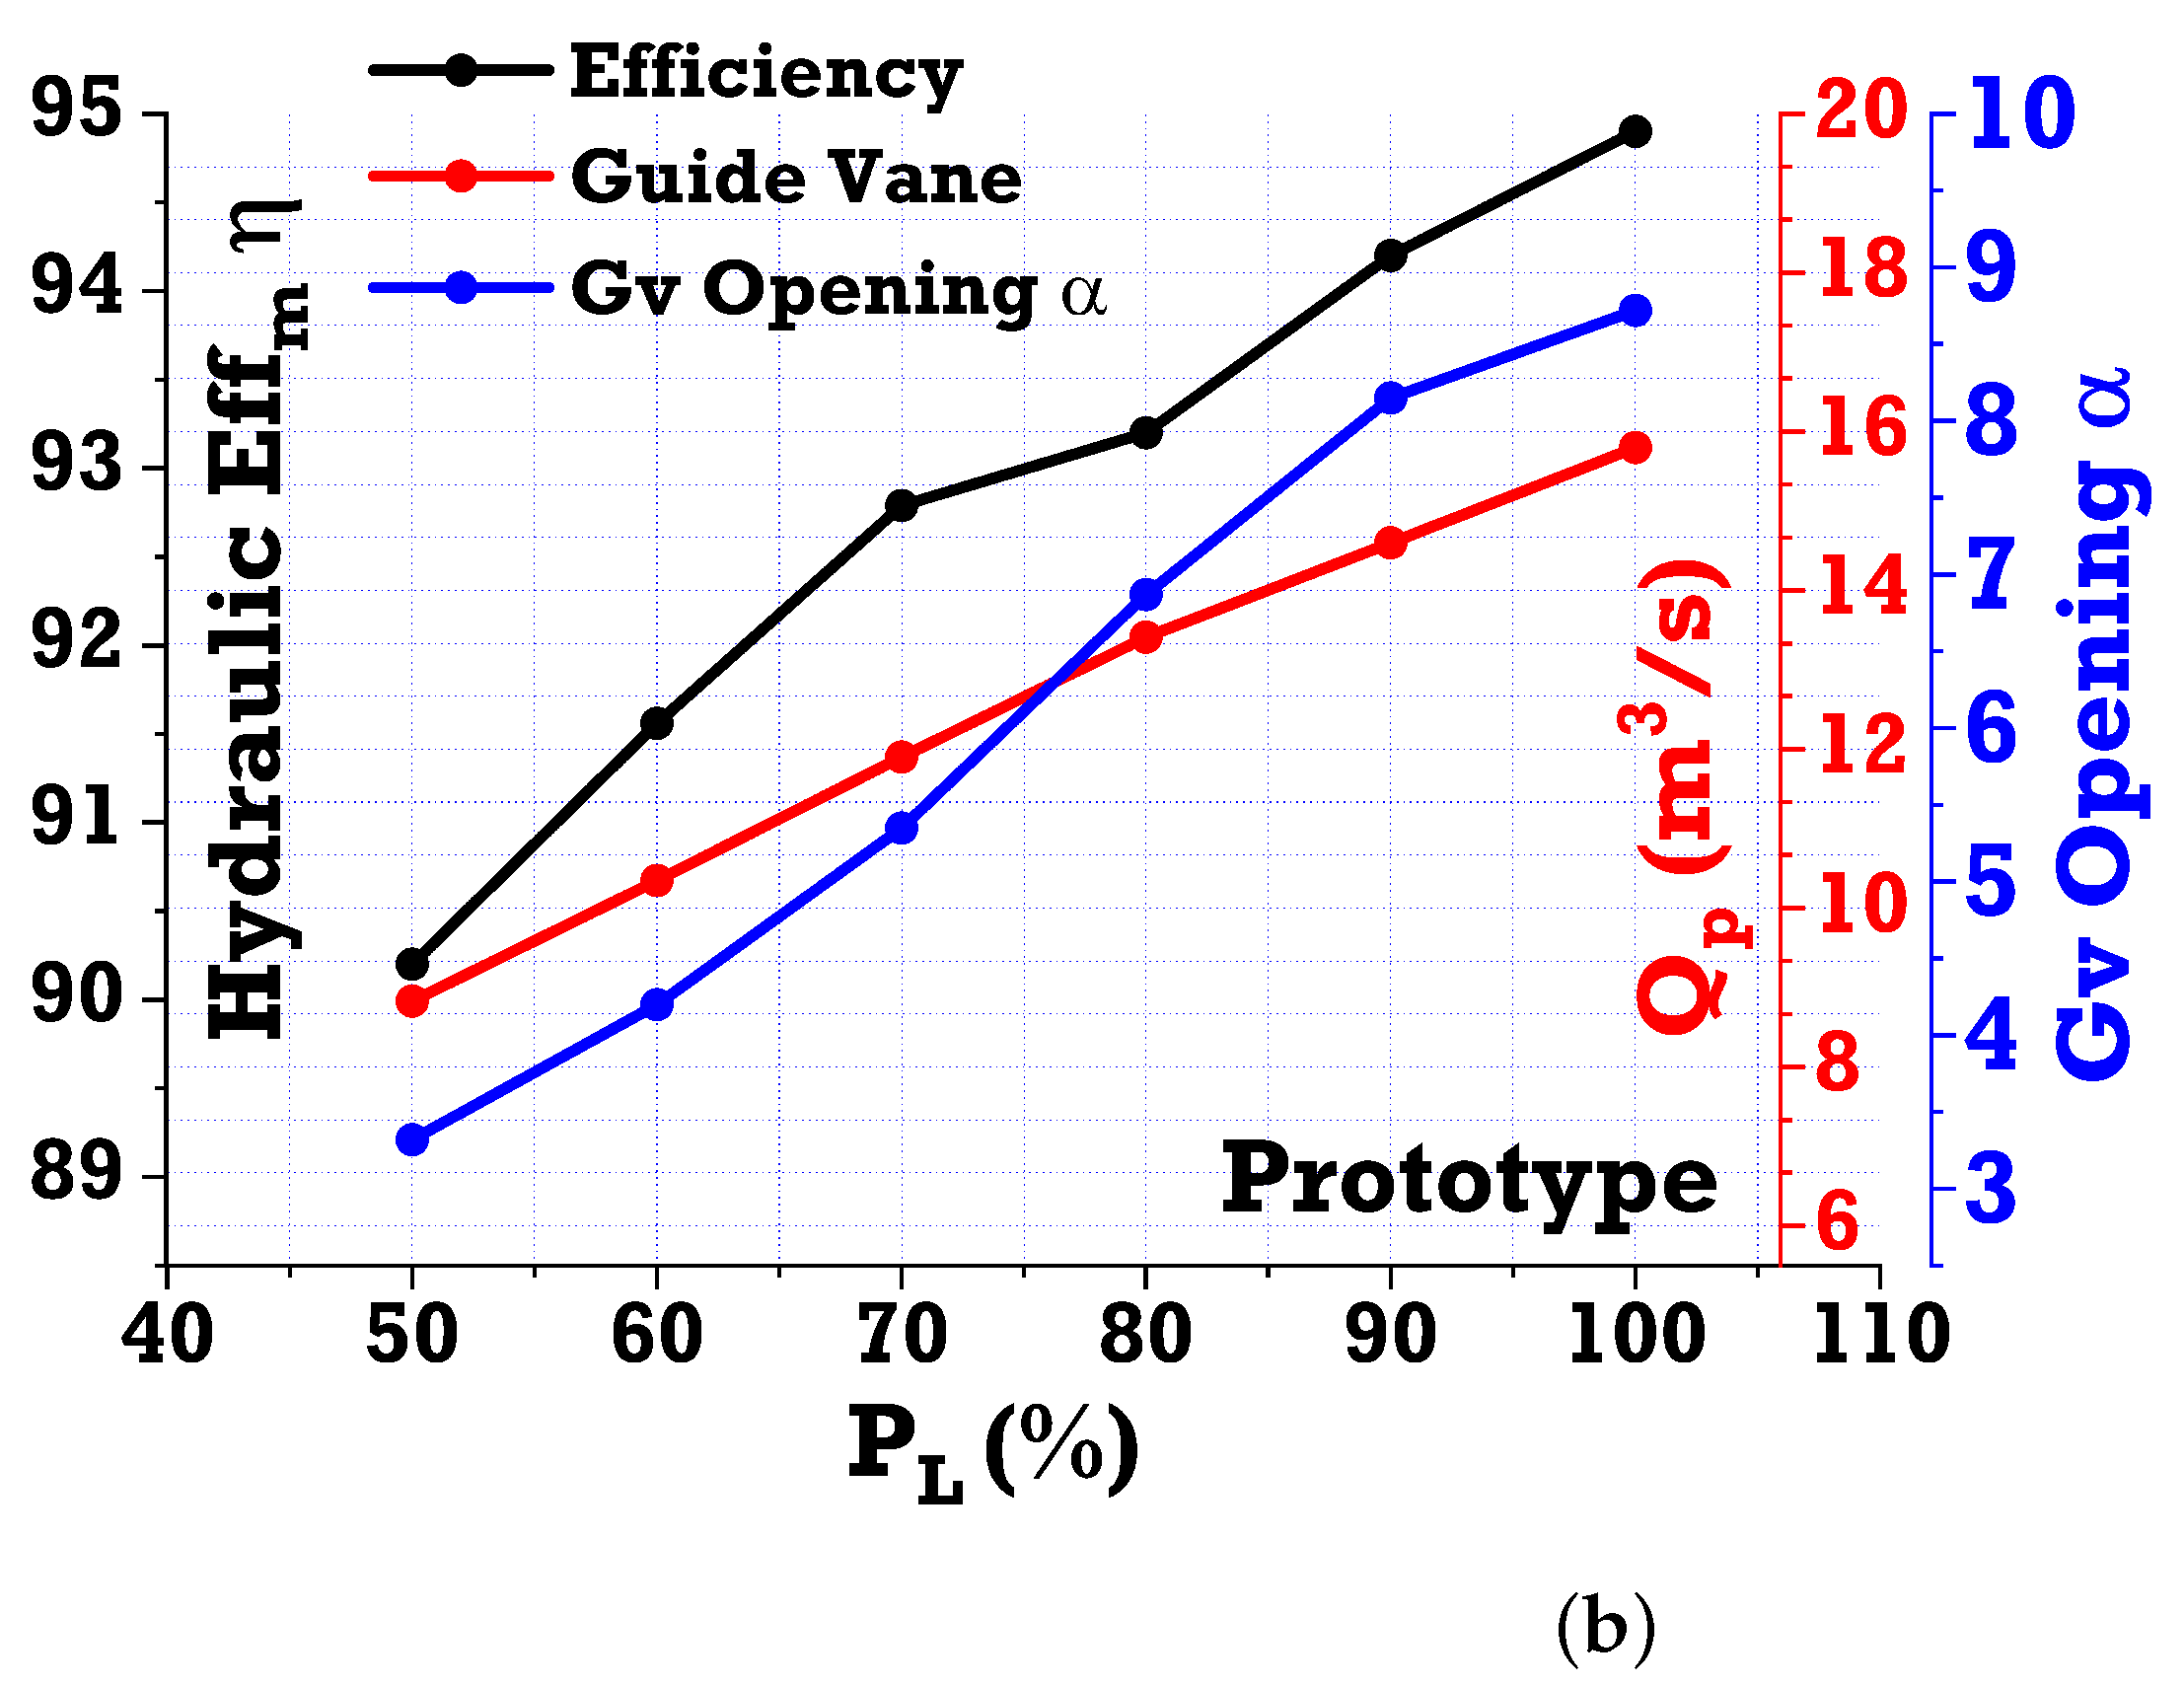
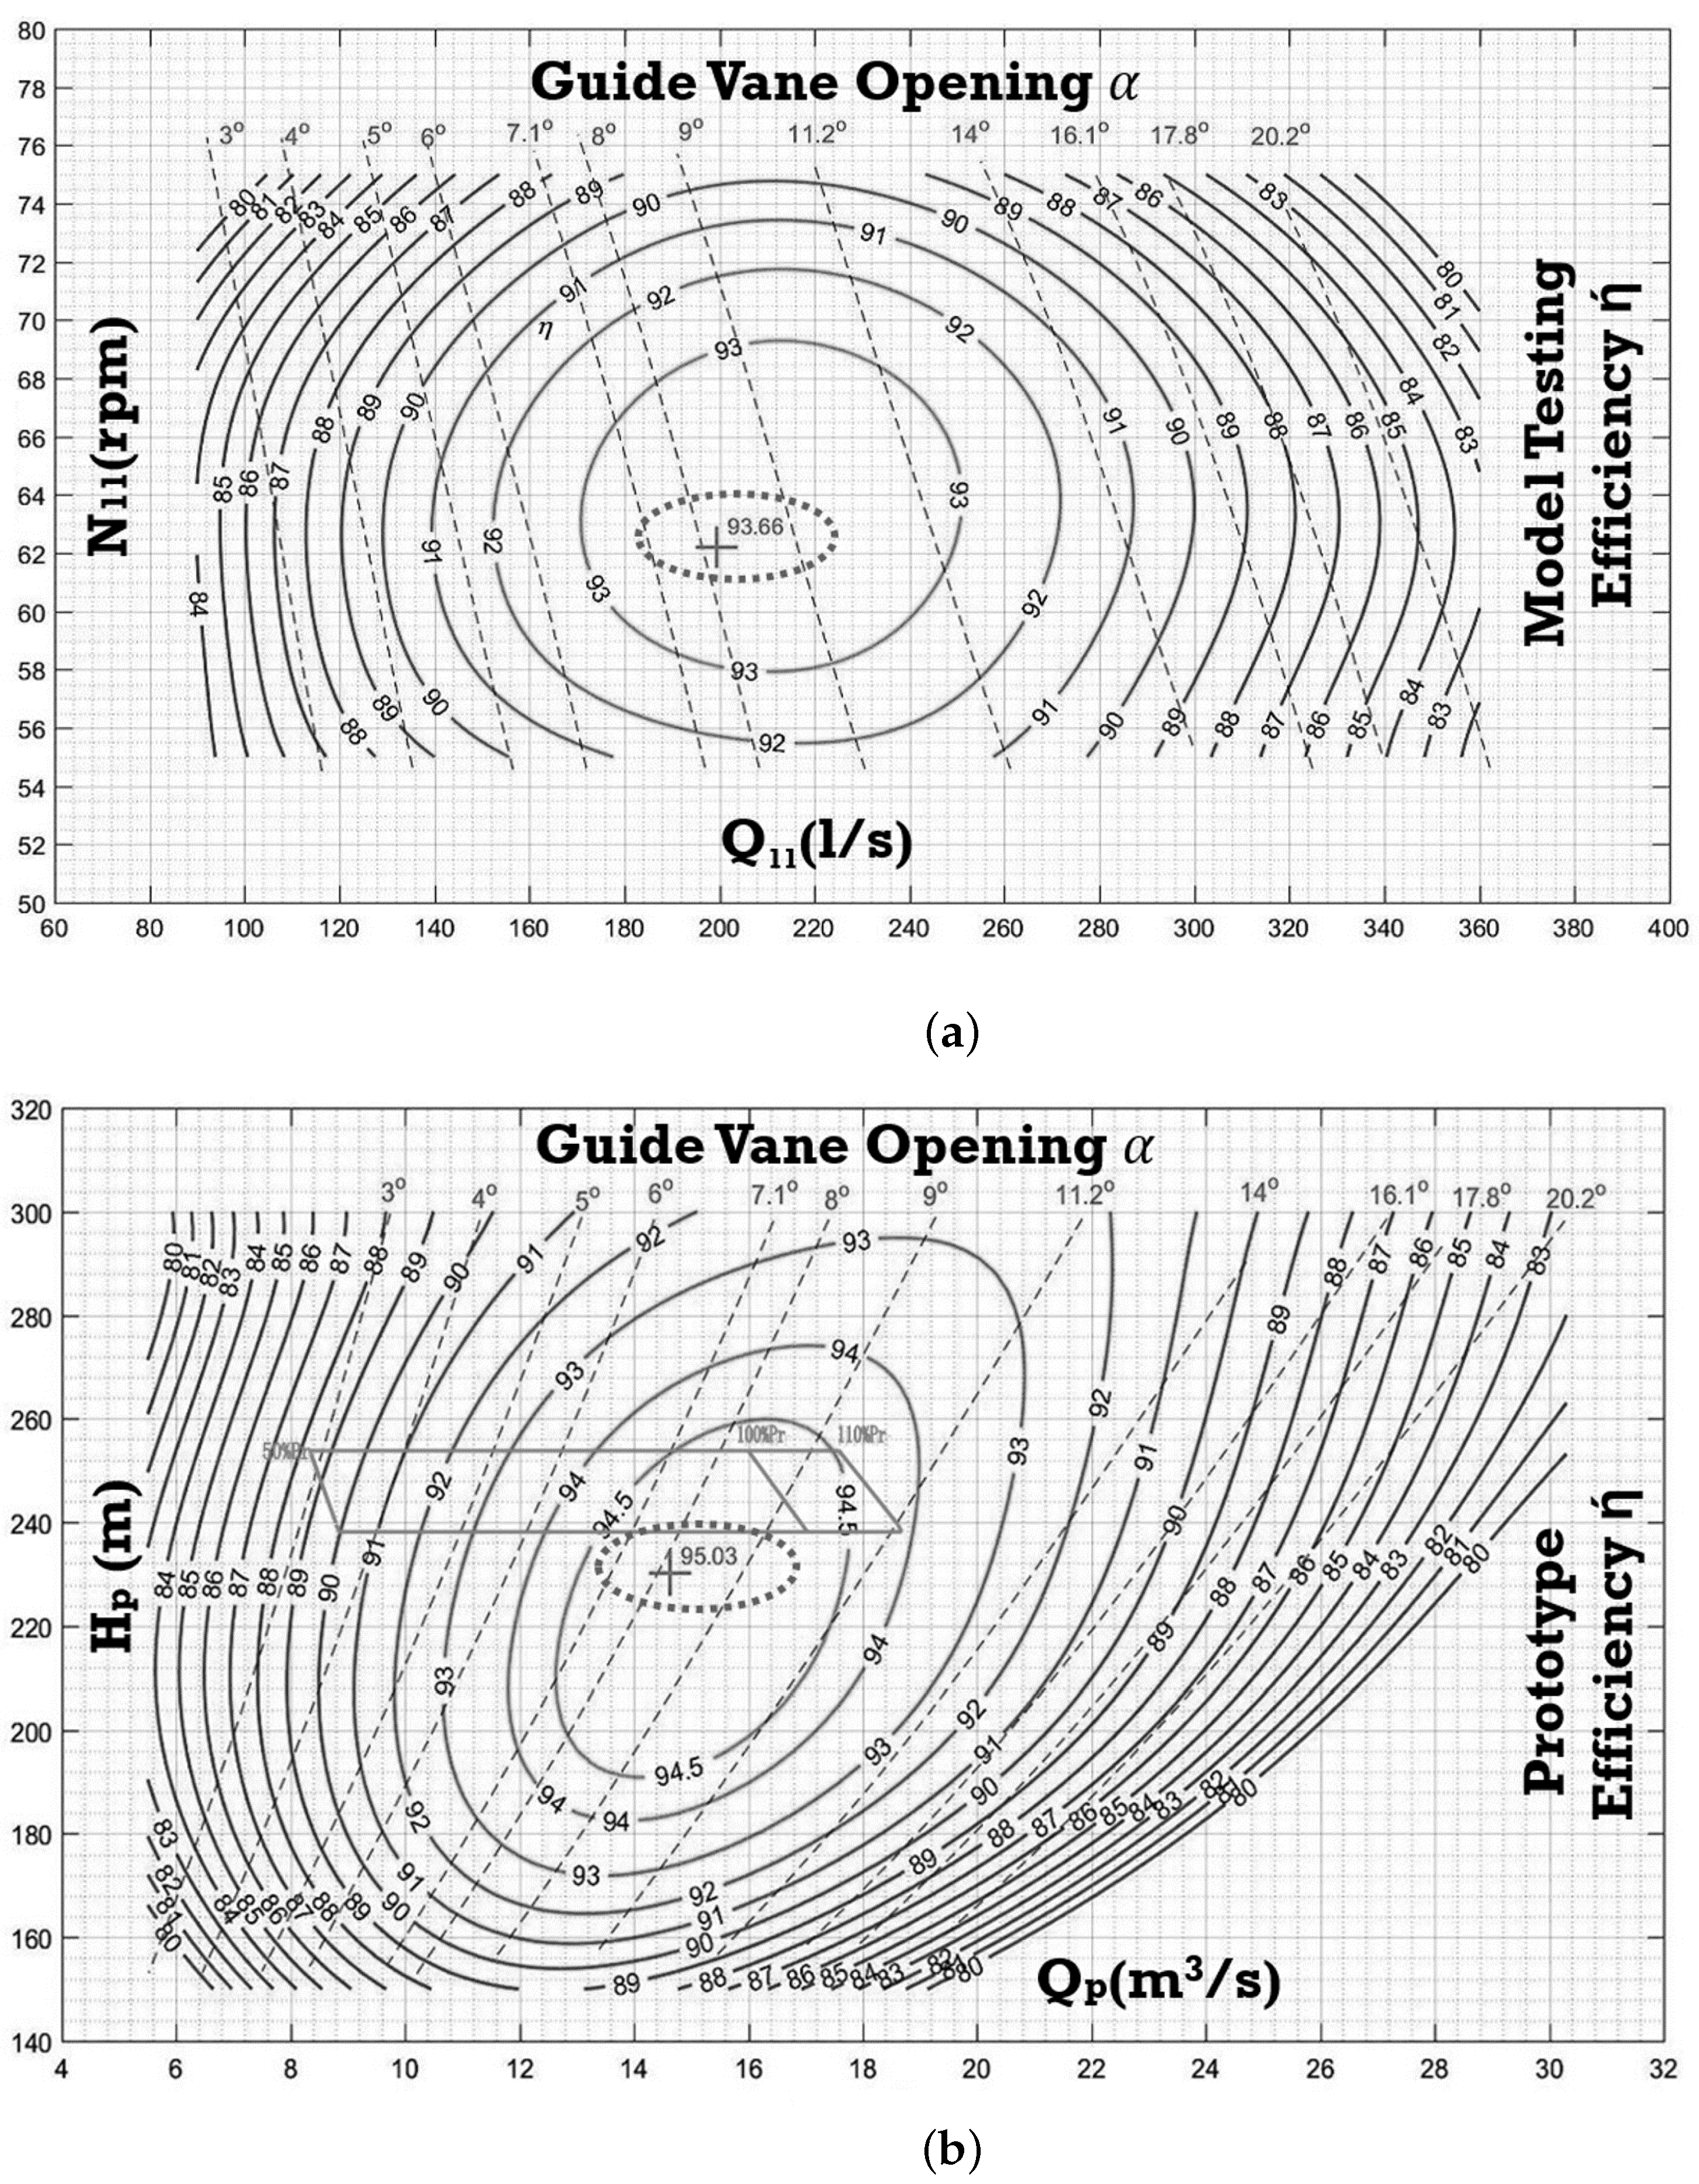
3.1. Performance Observation through Hill Chart and Torque

The torque output of a Francis turbine is influenced by various factors, including the flow rate Q (m3/s), head h (m), blade geometry (inlet angle β 1 and outlet angle β 2 ), rotational speed ω , tangential velocities ( V t 1 and V t 2 ), blade inlet radius r 1 , blade outlet radius r 2 , and absolute velocity Δ V . Blade design plays a crucial role in optimizing turbine performance and efficient torque generation. Figure 4 illustrates the velocity triangles at the inlet and outlet of the blades and the angles required to calculate the torque for the model Francis turbine [28]. Equation (11) is used to determine the torque for different load conditions.
T ( N × m ) = Δ V . r 2 . tan ( β 2 ) r 1 . tan ( β 1 ) cos ( β 2 ) cos ( β 1 )
Figure 5a illustrates the hydraulic efficiency and output torque across various operating loads, with different guide vane opening angles at the design head. At a guide vane opening angle of 3 . 06 and 50% load, the Francis model exhibited the minimum torque, with a unit speed ( n 11 ) of 54.51 rpm and a unit discharge ( Q 11 ) of 140.38 L/s. As the load increased and the guide vane angle changed, the torque also increased, reaching the optimal condition. At partial load conditions from 70% to 80%, the efficiency improved slightly from 92% to 93.10% as the torque increased. These variations were attributed to enhanced flow direction through the guide vanes and the absolute velocity at the inlet angle of the blades. The model Francis turbine operated at 100% load with a maximum guide vane opening of 8 . 72 and a flow rate of 392.48 L/s, achieving a unit speed ( n 11 ) of 64.26 rpm. Under 100% load, the turbine attained maximum torque and the best efficiency of 93.66%. The ability of the turbine to operate effectively under varying load conditions was demonstrated by the increasing load, changing flow rates, and guide vane openings.
Figure 5b illustrates the estimated performance of the prototype Francis turbine and validates its design through model testing. The maximum efficiency, calculated at 95.03%, was achieved at 100% full load with a guide vane opening of 8 . 72 and a flow rate of 15.4 m3/s and 50% load; the efficiency was calculated to be 91.2% with a minimum guide vane opening of 3 . 06 . Table 2 provides detailed information on other partial load conditions and the efficiency estimation from the model to the prototype Francis turbine.
Figure 6 presents a hill chart demonstrating the design and performance validation of the model and prototype performance along with the determination of the best efficiency point (BEP) during model testing under various operating conditions of the turbine. The hill chart provides detailed insights into the variation of the turbine as the load increased from 50% to 60%. In this load range, both unit discharge ( Q 11 ) and unit speed ( n 11 ) exhibited rapid increases and guide vane opening from 3 . 32 to 4 . 25 , showcasing that the turbine’s performance also rapidly increased. Within the 70% to 90% load range, there was a notable escalation in the flow rates factor ( Q 11 ) and the opening angle of the guide vanes ( α ) as they approached their maximum opening angle, resulting in an efficiency of 92.5%. The various load conditions are commonly encountered within the turbine’s operational range, making it crucial to analyze the correlation between guide vane opening, flow rates, speed, and head to achieve the BEP. At 100% load, the hill chart demonstrates that the model and prototype achieved their respective best efficiencies of 93.66% and 95.03%.
The study conducted by Trivedi et al. [29] investigated the efficiency of the Francis model turbine. It was found that the turbine exhibited its lowest efficiency of 87.5% when the guide vanes were set at an angle of 3.2 degrees. Performance was measured through specific operational parameters, including a specific speed ratio n E D of 0.18 and a specific discharge q E D of 0.15. These tests were conducted within a closed-loop water circuit operating under a head of 30 m. In the current investigation, the performance of the Francis model turbine was analyzed, revealing a minimum efficiency of 89.3%. These assessments were carried out within a closed-loop water system with a head of 40 m.

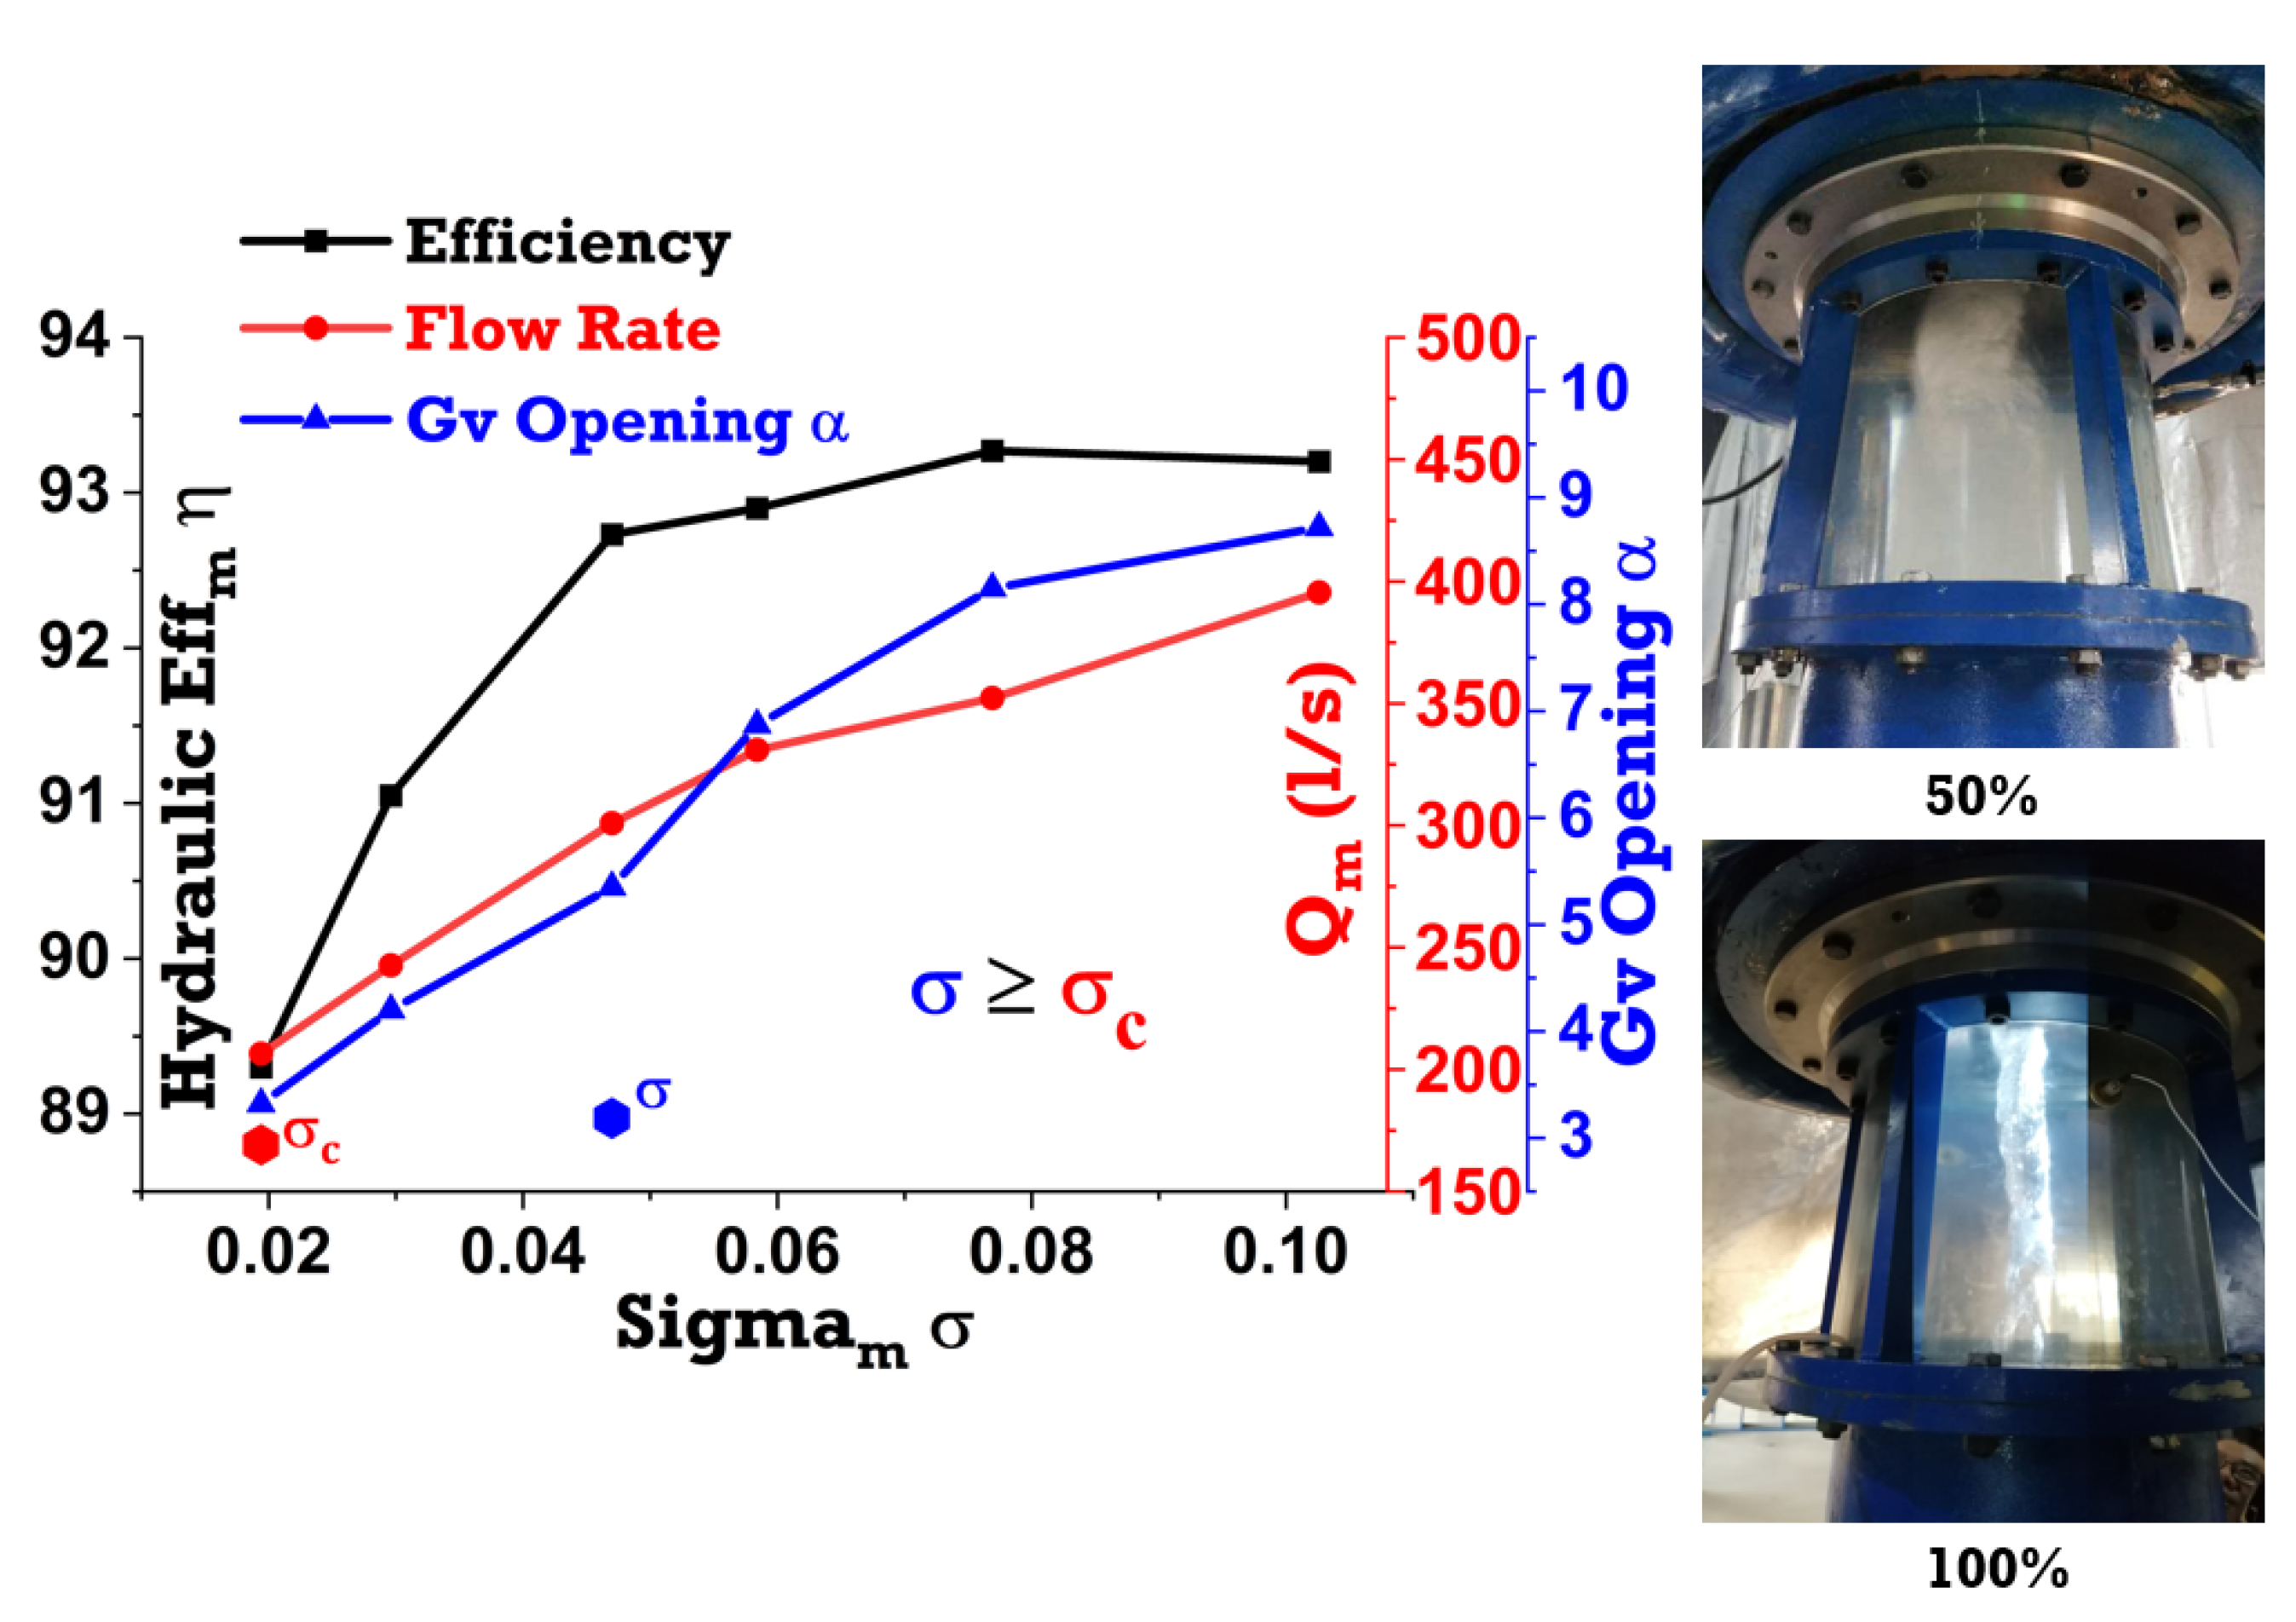
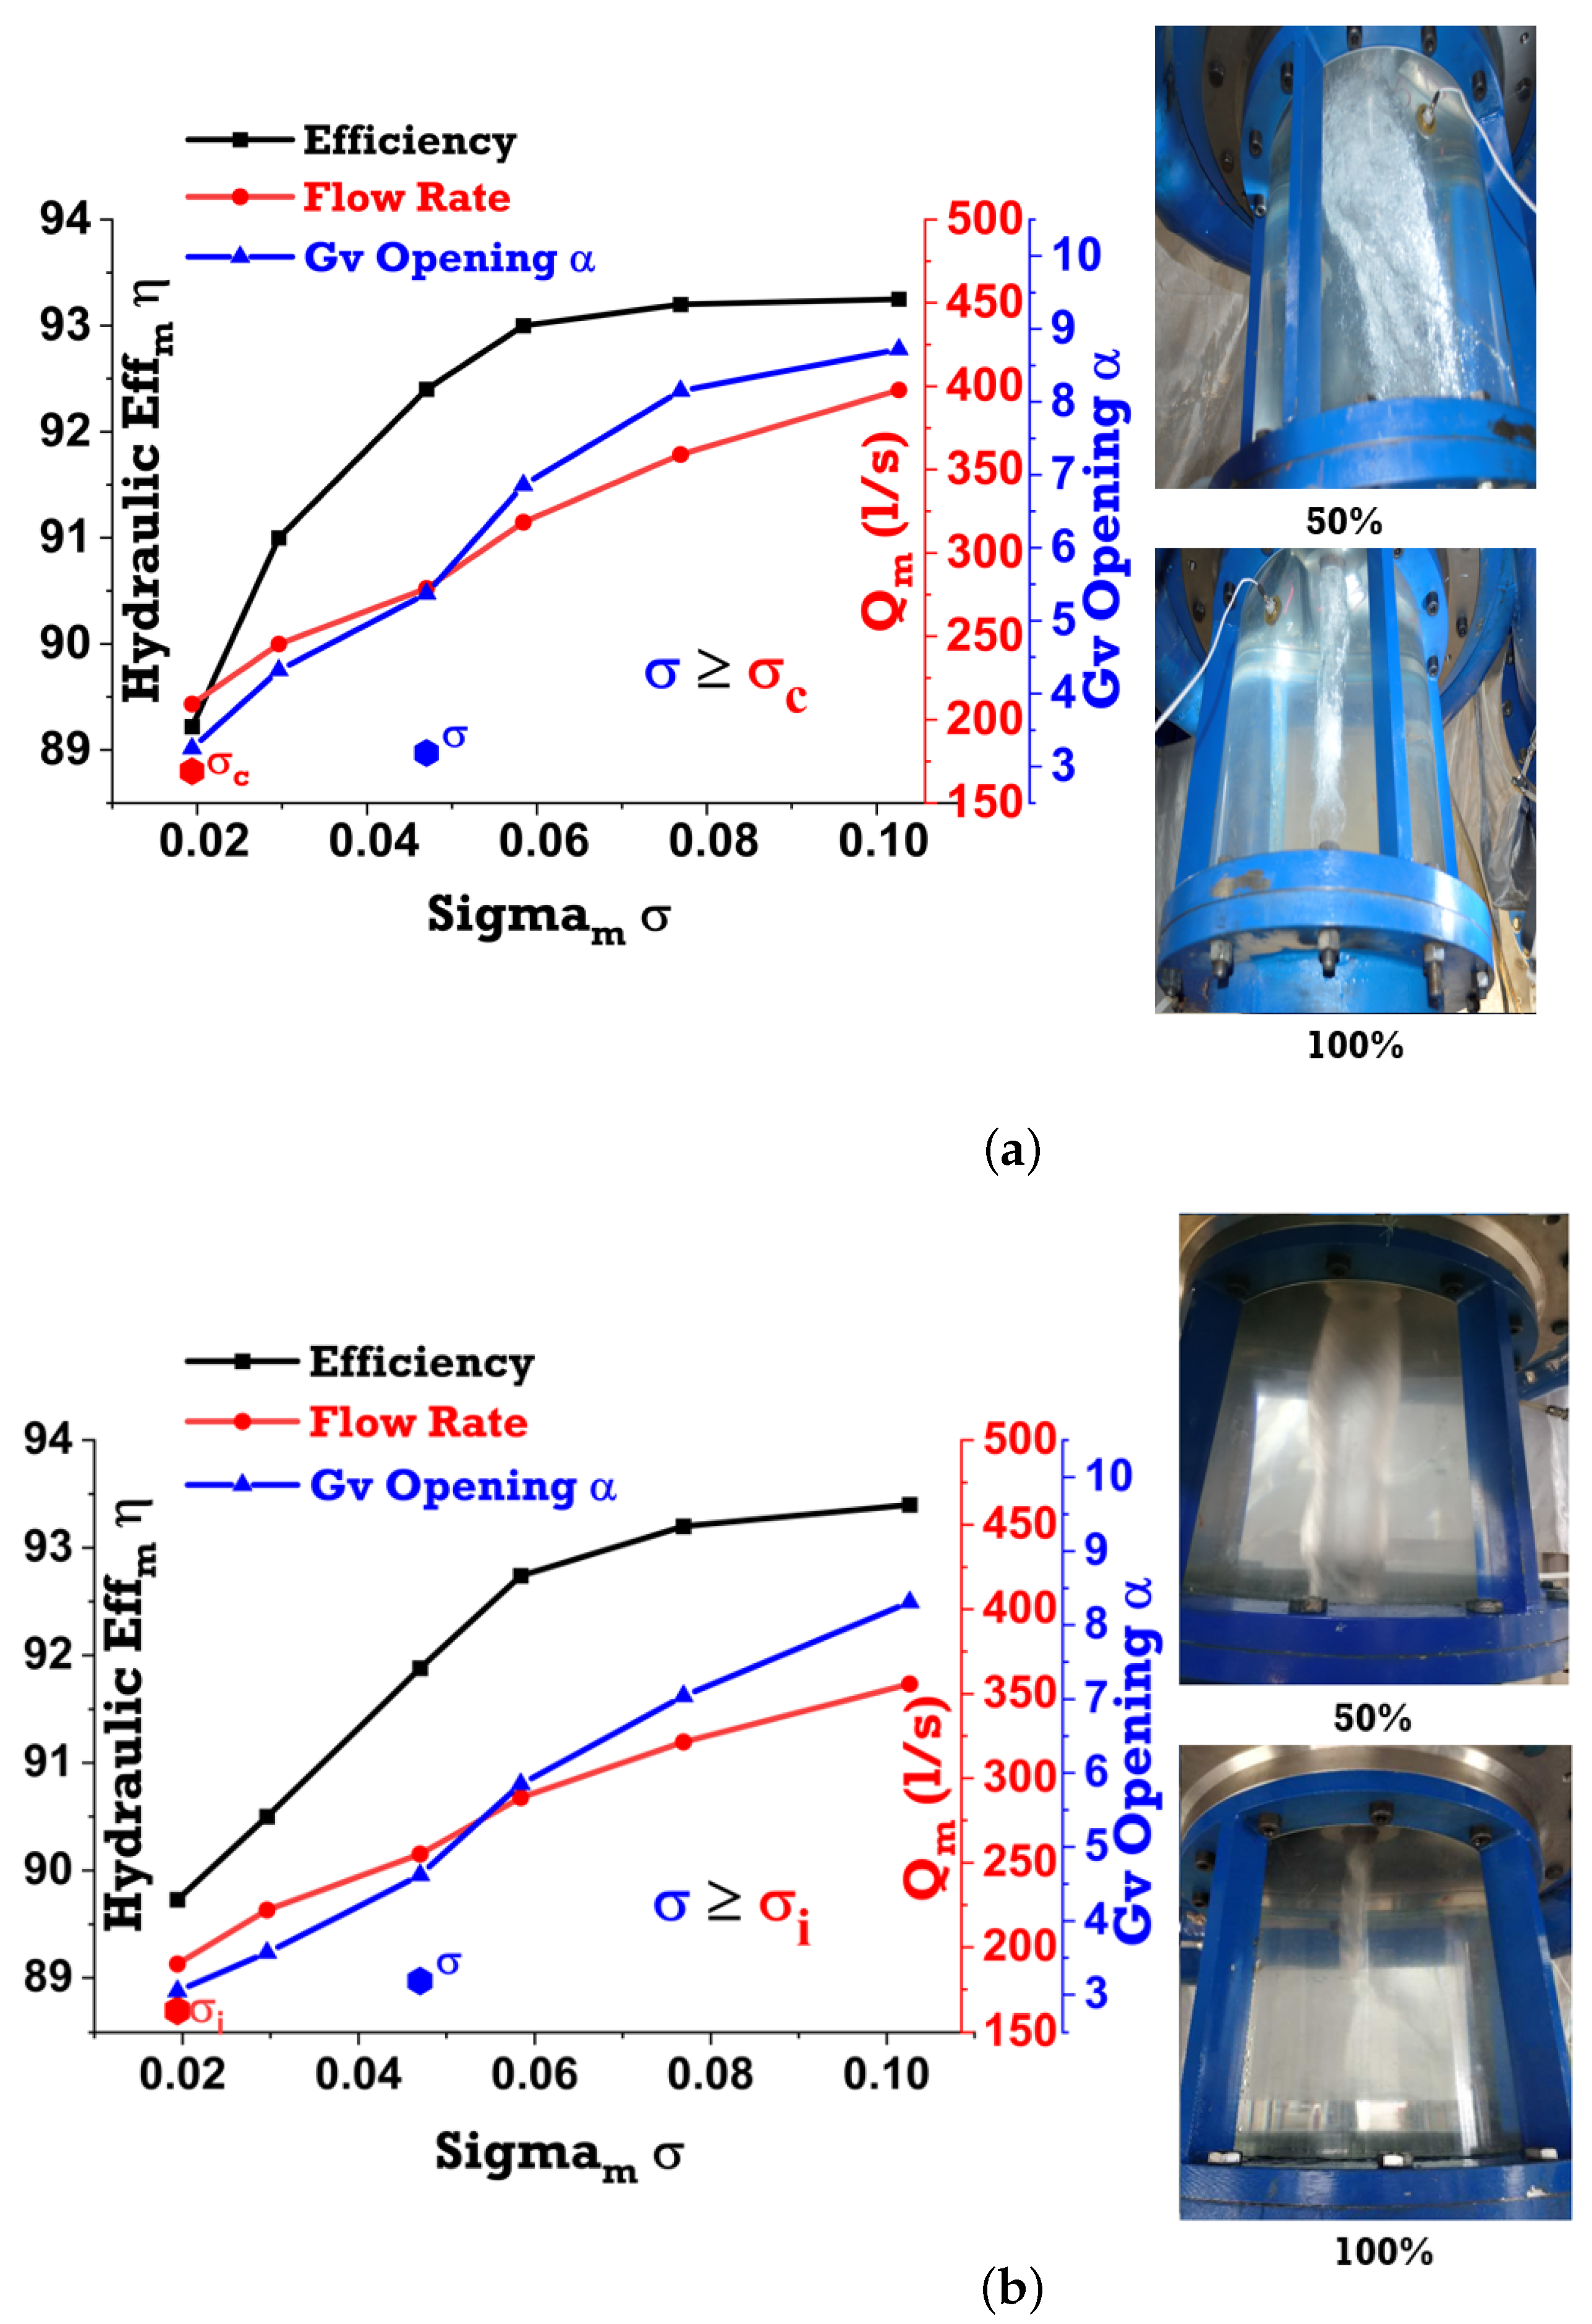
3.2. Cavitation Development and Effects on Hydraulic Performance

This study aims to predict performance and the impact of cavitation characteristics on the entire turbine domain, focusing on their impact on efficiency. Dietrich Thomas [26] suggests the use of the cavitation number or sigma ( σ ) to determine the occurrence of cavitation in a turbine. A decreasing sigma ( σ ) significantly impacts component wear and material loss, resulting in reduced efficiency. The critical cavitation factor, or sigma ( σ c ), varies depending on the turbine’s specific speed.
Figure 7 illustrates the cavitation formation and vortex rope of the model runner with a head of 38.50 m. At 50% partial load, the critical cavitation coefficient ( σ c ) was measured, and initial cavitation began at the blade outlet due to low-pressure phenomena forming a vortex rope at the runner outlet that could be seen at the draft tube cone. When the turbine model load was changed from 70% to 80% and the guide vane opening was changed from 5 . 56 to 7 . 10 , it can be seen that the efficiency fluctuated slightly, but there was no low-pressure phenomenon; the vortex rope still extended smoothly to the draft tube elbow, and the cavitation number ( σ ) was still larger than the critical cavitation number ( σ c ). However, these cavitation bubbles rapidly disappeared when the working conditions changed. No cavitation or bubble formation was observed at the blade outlet when the turbine operated at 100% load. When the turbine model reached 100% load, with all other parameters including flow rates, speed, head, and guide vane opening angle at their maximum values, the turbine efficiency achieved 93.66%. Additionally, the observed cavitation number ( σ ) remained the same or higher than the critical cavitation number ( σ c ). However, no cavitation or bubble formation was observed at the blade outlet and draft tube cone when the turbine operated at 100% load.
Figure 8a,b illustrates the turbine operating conditions at both minimum (38.10 m) and maximum (37.10 m) head levels. When the model turbine operated at a minimum head of 38.10 m under 50% load and the minimum speed of the runner, it was observed that the vortex rope at the draft tube cone collapsed, with initial bubble formation being more visible than under design head-level operating conditions. This phenomenon was attributed to the low pressure, the low runner speed, and the guide vane opening angle. When the turbine model operated at 100% load, the vortex rope ran smoothly from the runner outlet towards the draft tube elbow. It was observed that the critical cavitation factor ( σ c ) was lower than the cavitation coefficient ( σ ) or the plant’s cavitation number. Initial bubble formation was noted at the hub and blade outlet, but these bubbles rapidly disappeared as working conditions changed. The vortex rope rotations indicated that initial cavitation bubble formation occurred at the draft tube cone and elbow.
Whe the Francis turbine model was operating at 50% load with the maximum head (37.50 m), it can be seen that the efficiency was slightly higher than the minimum and design head-level working conditions, but when the turbine model operated at 100% load, maximum efficiency was slightly lower than the minimum head-level operating conditions. However, the cavitation factor ( σ ) remained the same, that is, bigger than the critical cavitation factor ( σ c ). As the turbine model operated under all load conditions, vortex rope rotation was smooth, and the initial bubble formation rapidly disappeared at 100% load. The model Francis turbine achieved a maximum efficiency of 93.66%, and the cavitation factor ( σ ) was measured at 0.0429. Trivedi et al. [21] investigated cavitation phenomena in a Francis turbine, varying the runner’s rotation speed from 413.5 rpm to 649.7 rpm. During this experiment, a small cavity was observed at the trailing edge, near the hub and shroud interface, particularly during the initial stages of speed fluctuation.

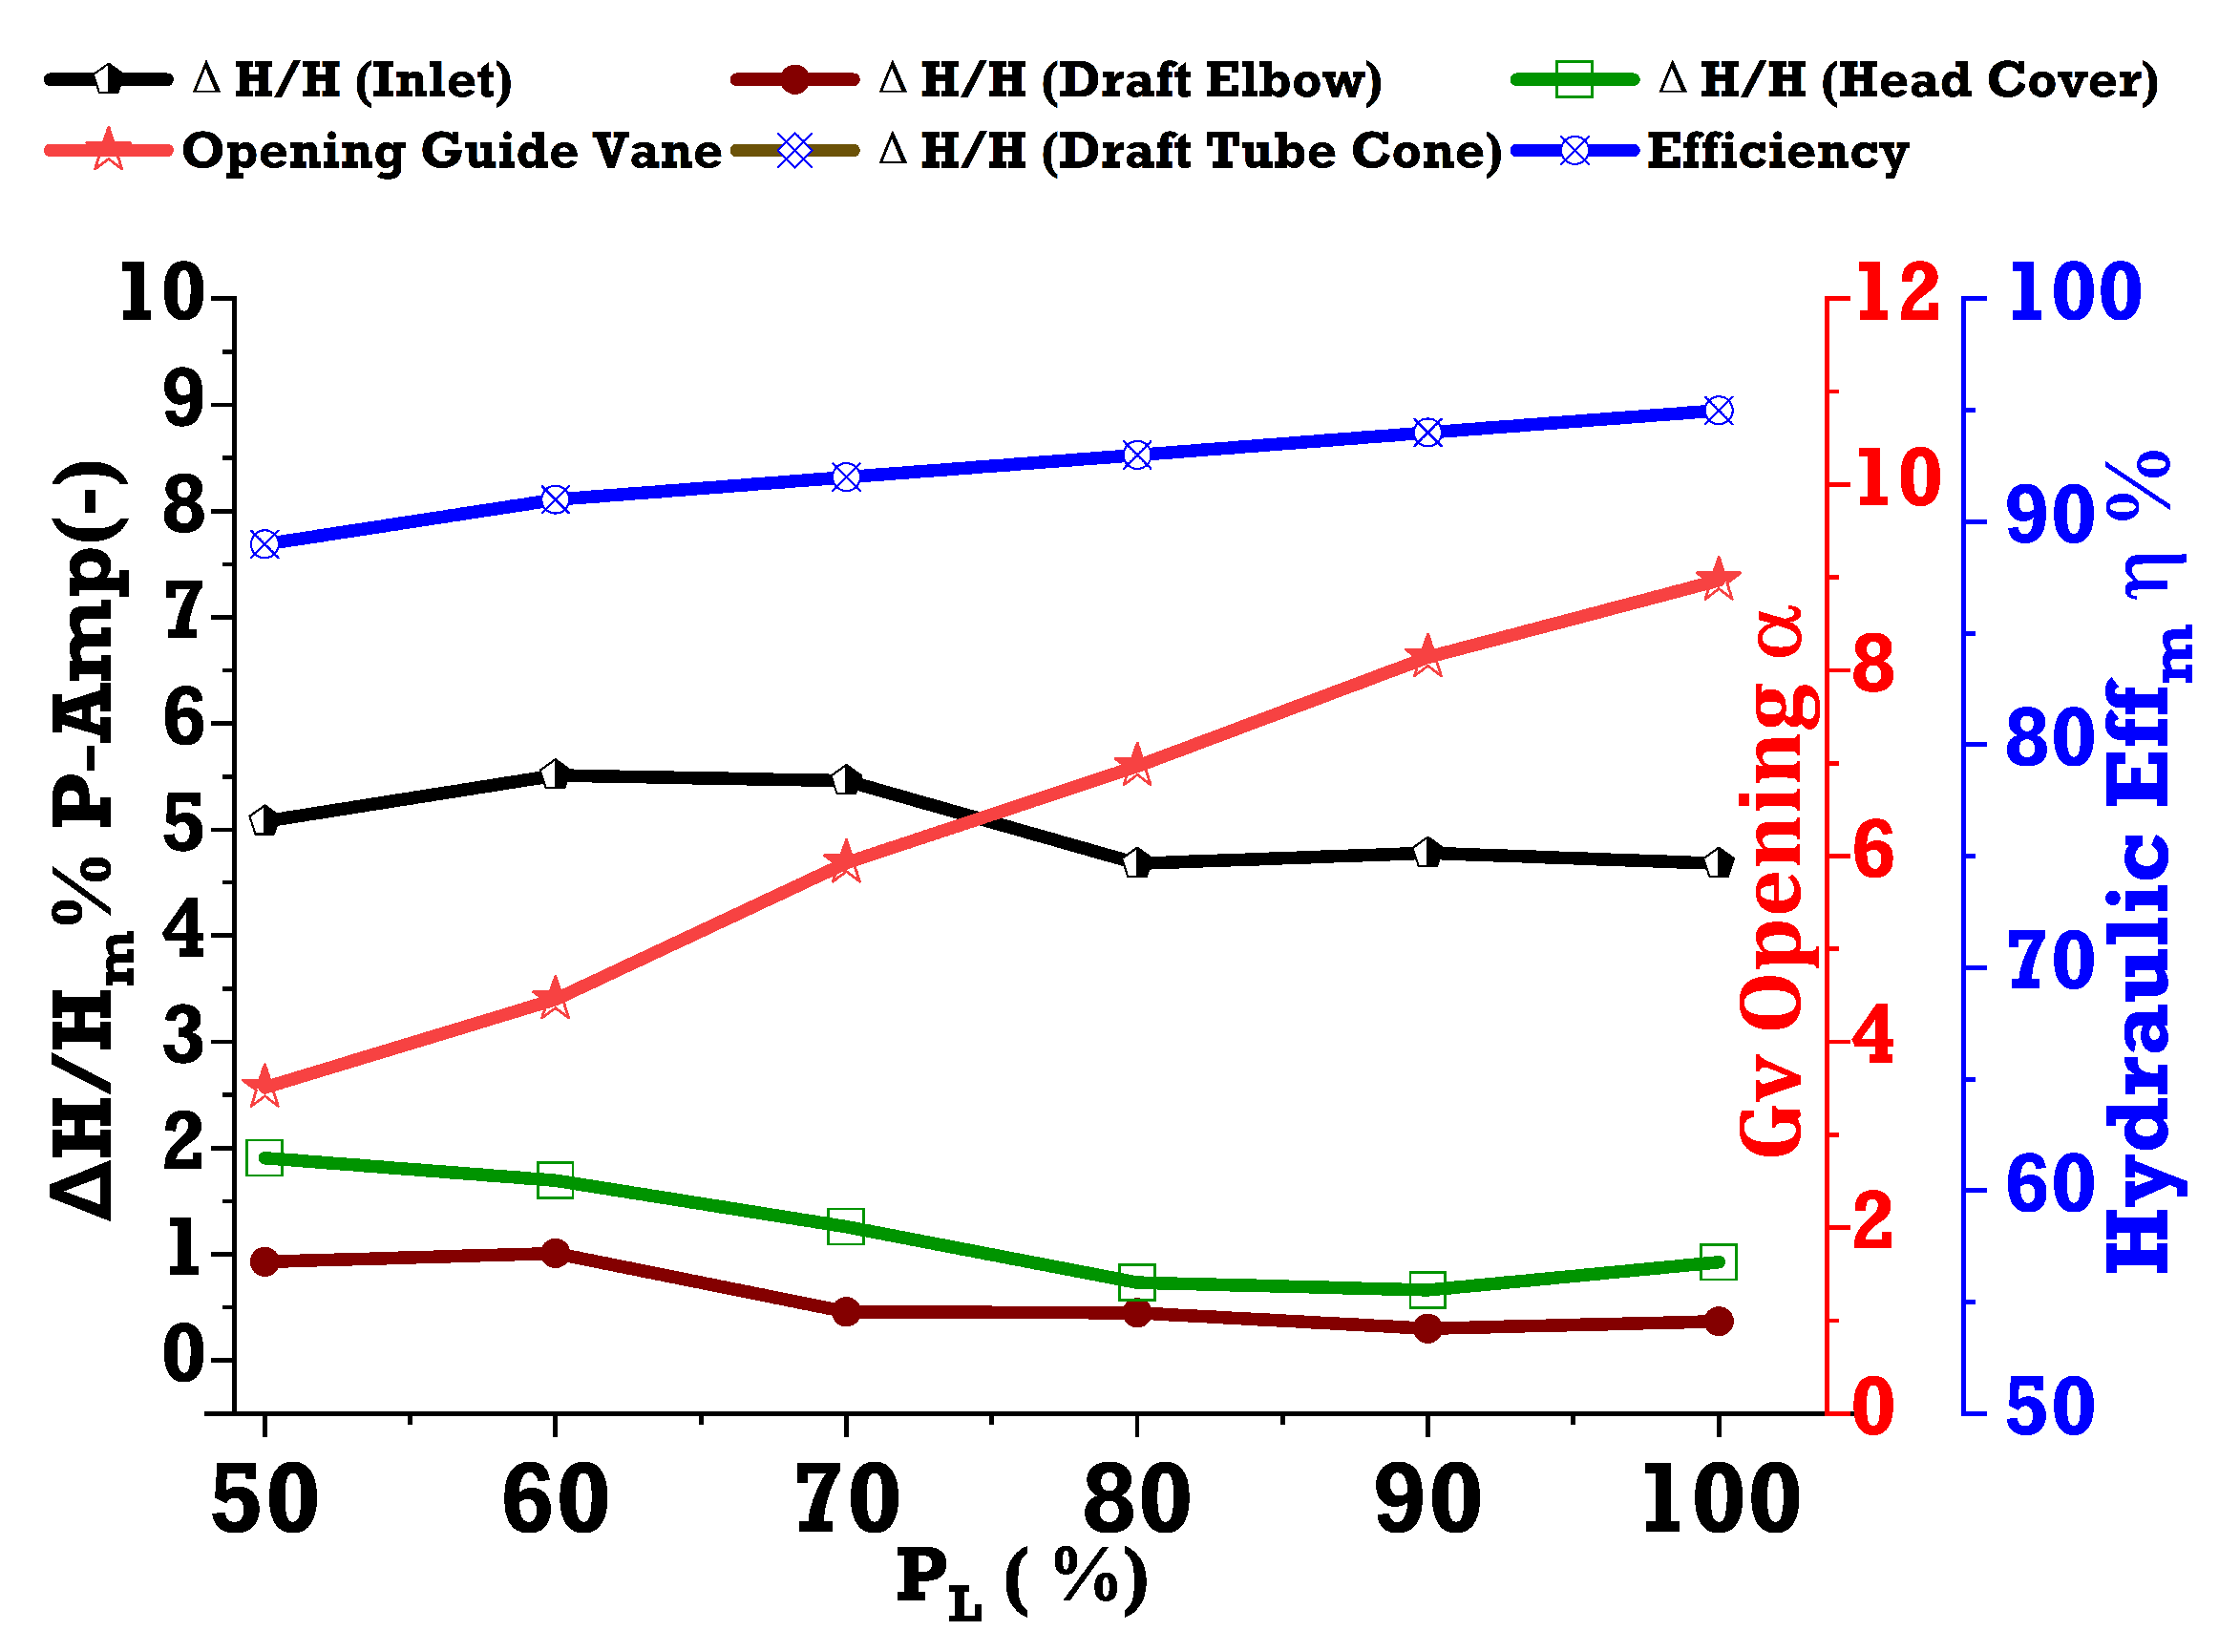
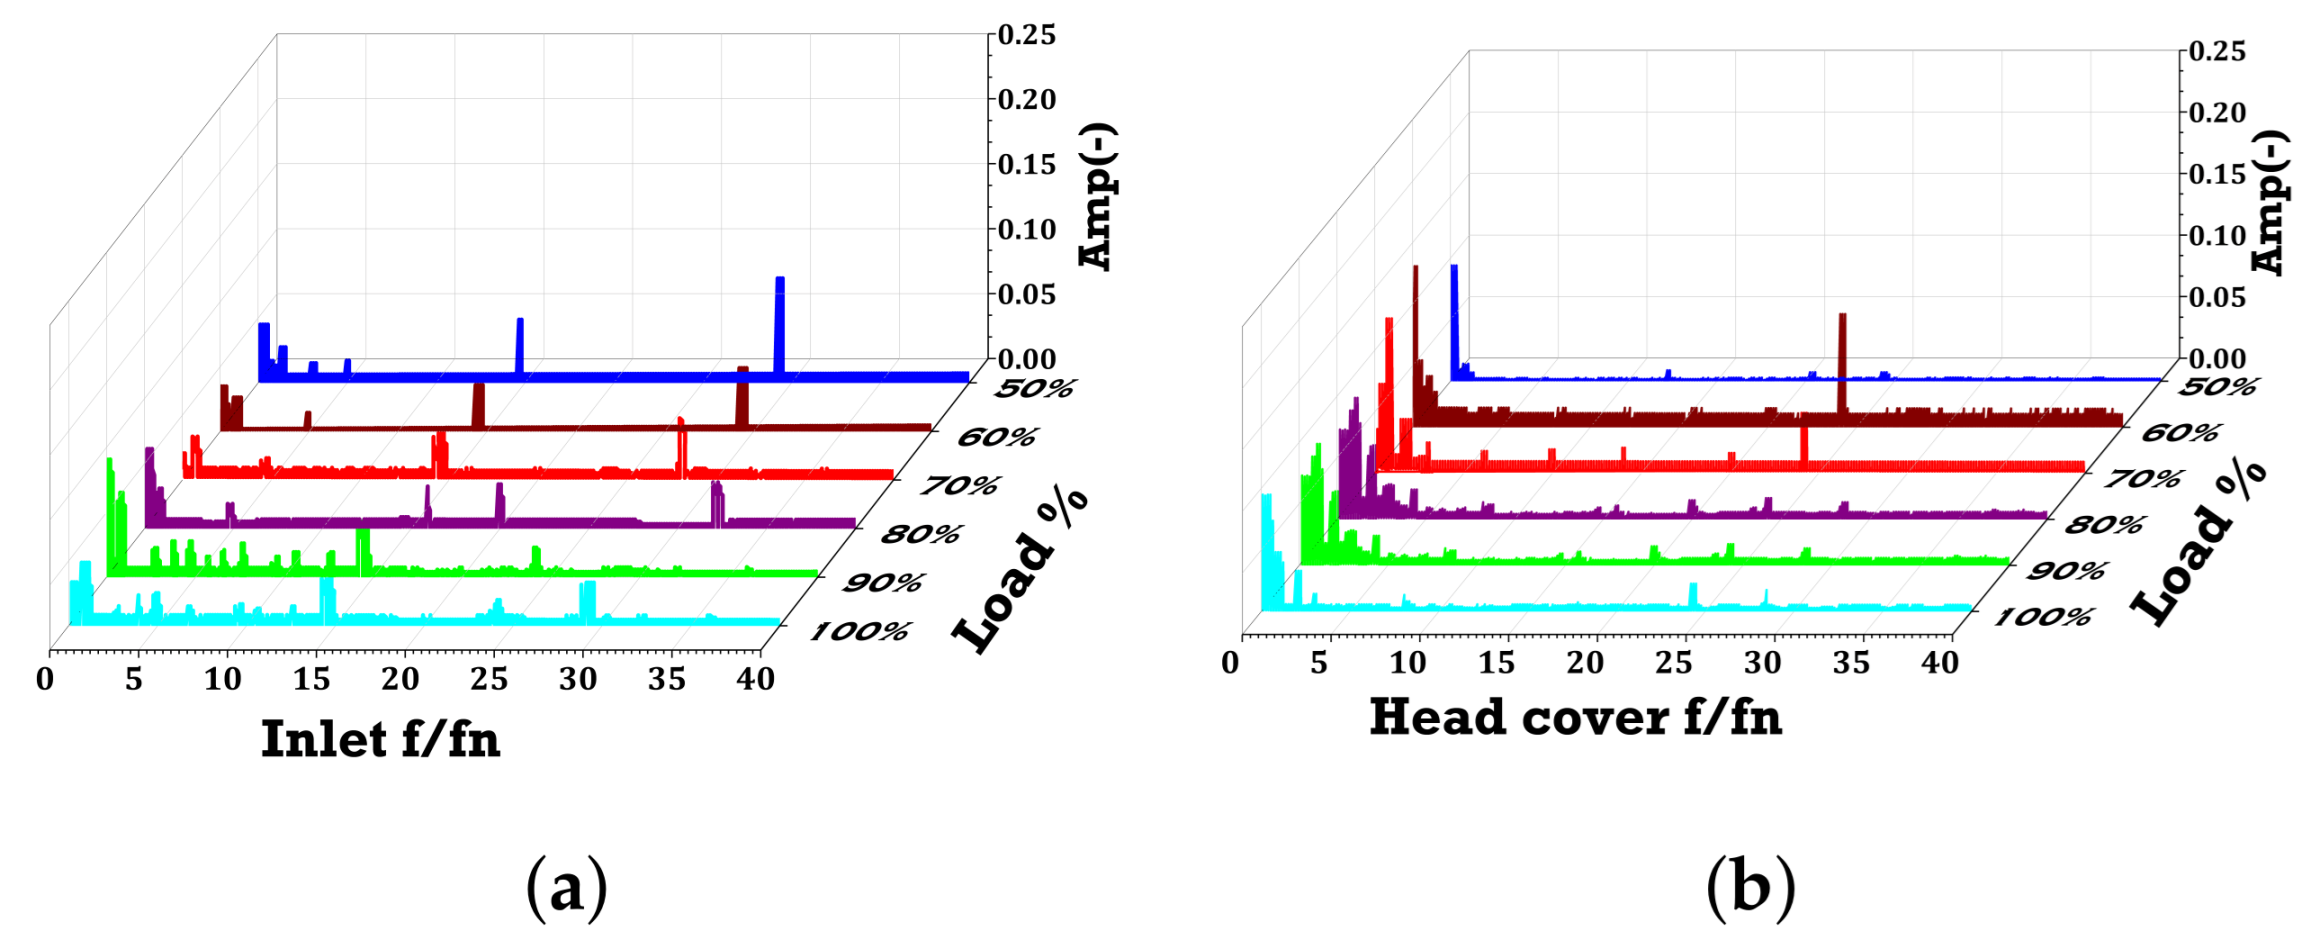
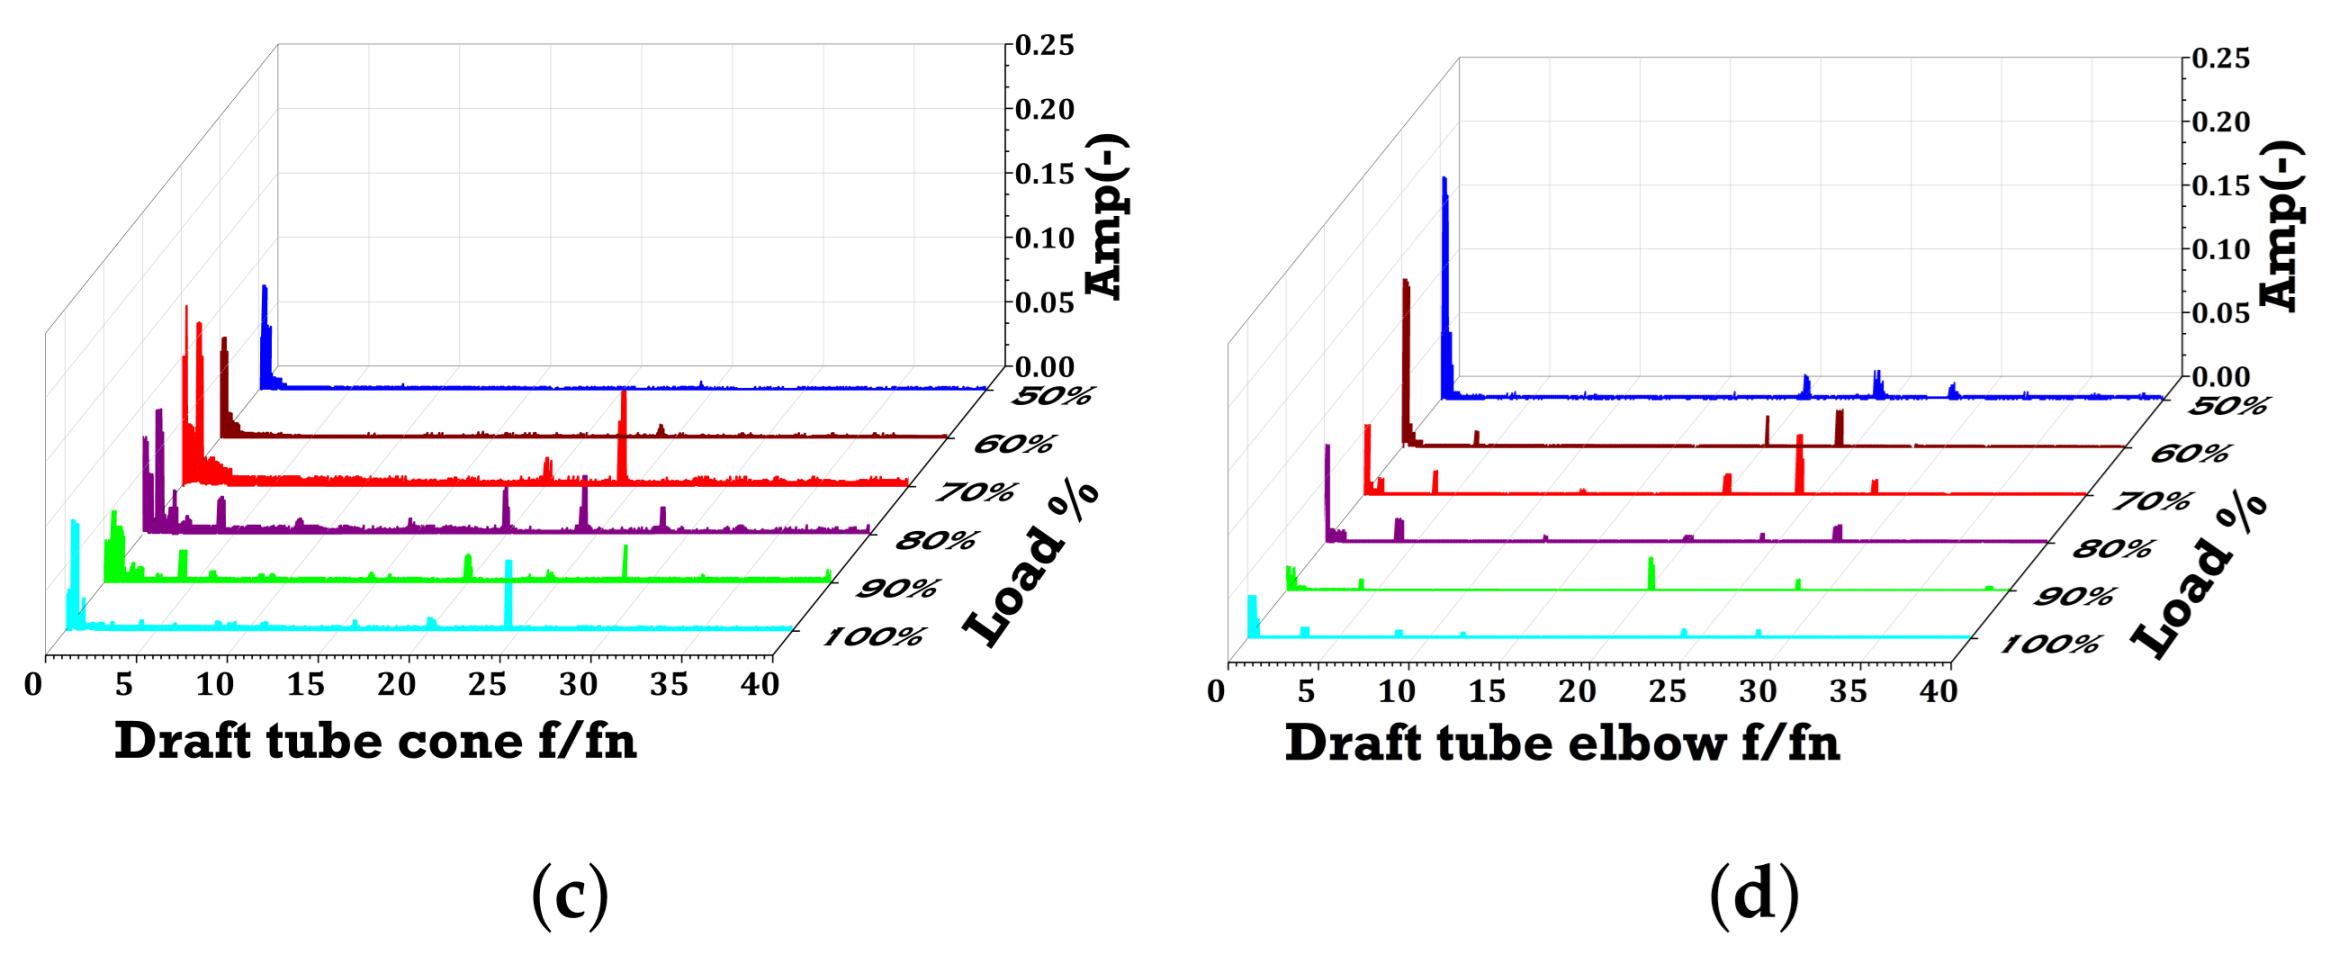
3.3. Pressure Pulsation Impacts on Hydraulics Performance

The analysis of pressure pulsations is crucial for validating prototype turbine designs, optimizing performance, and establishing a foundation for hydraulic stability, vibration, noise, and cavitation in Francis turbines. These pressure pulsations initiate from various sources, such as rotor–stator interactions, guide vane opening, and turbulent flows, which induce pressure fluctuations throughout the entire turbine domain. Parameters affected by pressure pulsations include discharge, head, and power output, all of which are critical to the turbine’s overall efficiency. Figure 9 illustrates the peak-to-peak values and frequency spectra under design head with various working conditions from 50% to 100% load, and four points ( P 1 spiral inlet, P 2 head cover, P 3 draft tube cone, and P 4 draft tube elbow) were selected to measure the magnitude of pressure changes across the entire turbine domain.
Table 3 presents the maximum peak-to-peak amplitude values and frequency amplitude spectra under conditions with and without air compensation in the draft tube. Without air injection, the highest amplitudes were consistently observed at the 50% load. At four points ( P 1 spiral inlet, P 2 head cover, P 3 draft tube cone, and P 4 draft tube elbow) significant change in peak-to-peak amplitudes was noted as the working conditions changed from 50% to 100% load. Pressure pulsation amplitude data at 100% load indicated no low-pressure phenomena related to cavitation, vibration, or noise, and turbine performance reached its best efficiency. When the air was injected, only a slight changing amplitude was detected at sensor P 1 , causing a minor shift towards higher frequencies. The effect of air injection on damping was relatively minimal, with hydraulic performance remaining consistent under partial load conditions.
The results, presented in Figure 10, Figure 11 and Figure 12, were obtained through an experimental investigation of the flow field and opening guide vane angle. These Figures include time and frequency domain curves measured at four monitoring points: P 1 spiral inlet, P 2 head cover, P 3 draft tube cone, P 4 draft tube elbow. When the Francis turbine model operated at the minimum head of 38.10 m under 50% to 100% load, pressure fluctuation amplitudes at P 1 (spiral inlet) were observed to be higher than those at the design head of 38.50 m and the maximum head of 37.50 m. The pressure pulse amplitude of P 2 (head cover) was measured to be higher at the design head (38.50 m) compared to both the minimum head (38.10 m) and the maximum head (37.50 m). It was also observed that there were no vibrations or sounds when the guide vane opening angle was adjusted under various working conditions. At the design head of 38.50 m and 50–100% load working conditions, the pressure at the P 3 (draft tube cone) was higher than the minimum and maximum head working conditions, though the pressure fluctuation amplitudes at the draft tube cone and the flow exit to the draft elbow showed only minor differences. A vortex rope was observed at the draft tube cone, exhibiting smooth behavior from the runner outlet to the draft tube cone. The presence of the rotating vortex rope was evident with low amplitude values, and it did not collapse within the draft tube cone. No amplitude dampening was observed in the rotating vortex rope (RVR), and no vibration or cavitation affected hydraulic efficiency. At the monitoring points near the exit of the draft tube elbow, P 4 , minor differences in pressure fluctuation amplitudes under various working conditions were observed. The pattern of pressure pulsation was essentially the same across these points, with similar main frequencies and amplitudes of pressure pulsation.
The frequency amplitudes of pressure pulsations at the monitoring points were found to be 0–0.20 ( f / f n ), as shown in Figure 10, Figure 11 and Figure 12, which is consistent with the calculated and measured values. At 100% load, the pattern of pressure pulsation amplitude fluctuation at the minimum (38.10 m), design (38.50 m), and maximum (37.50 m) head levels showed minor differences at the draft tube cone and draft tube elbow, with frequencies measured at 0–0.1 ( f / f n ). However, the spiral inlet and head cover showed high pressure fluctuations due to the water flow direction and varying guide vane opening angles, with pressure frequency amplitudes measured at 0–0.3 ( f / f n ). These pressure fluctuations did not affect hydraulic performance, and the Francis turbine model demonstrated stability with no vibration or sound. This indicates that the experimental method used in this paper can accurately predict the hydraulic performance and design validity of the turbine.

4. Conclusions

The experimental findings in this study demonstrate a correlation between the efficiency and power output of the Francis turbine, and this relationship is attributed to fluctuations in flow rates and rotational speeds from 50% to 100% load. The model turbine consistently maintains acceptable efficiency levels across different operational conditions, showcasing its adaptability and stability in varying loads.
The hill chart demonstrated that the parameters of the model Francis turbine including flow rates, speed, guide vane openings, and design head achieve maximum torque and power output. This validates the design and performance of the prototype Francis turbine under various load conditions. The model tests have shown that rapid changes in fluctuating pressure in the flow below vapor pressure can lead to the formation and collapse of bubbles in the fluid in various areas of the turbine flow passages. This study also revealed that at various loads from 50% to 100%, cavitation tendencies show a sigma cavitation factor ( σ ) greater than the critical cavitation factor ( σ c ).
The measured pressure pulsations and frequency amplitudes at four monitoring points at the spiral case inlet, head cover, draft tube cone, and draft tube elbow, as well as the vortex rope, were consistent with the performance of the model runner under different operating conditions. Furthermore, no turbulence, vibration, or acoustic noise anomalies were detected at different loads, while the model turbine reached peak efficiency at full load. This experimental study provides important insights for engineers and researchers aiming to optimize Francis turbine designs, improve operational strategies, and promote sustainable hydropower utilization. The conclusions and model test approach of this investigation can be extended to other prototype Francis turbine prototypes where experimental results are lacking.

Author Contributions

Conceptualization, B.M.U. and X.H.; methodology, B.M.U. and X.H.; software, B.M.U.; validation, B.M.U.; investigation, B.M.U.; writing—original draft preparation, B.M.U.; writing—review and editing, X.H.; supervision, Z.W. All authors have read and agreed to the published version of the manuscript.

Funding

This work was supported by the Research and Developmet Foundation of China (No. 014120208001).

Institutional Review Board Statement

Not applicable.

Informed Consent Statement

Not applicable.

Data Availability Statement

The original contributions presented in the study are included in the article, further inquiries can be directed to the corresponding author.

Conflicts of Interest

The authors declare no conflicts of interest.

Nomenclature and Abbreviations

SymbolUnitDefinition
α 0 °Guide vane opening
σ m -Cavitation coefficient
σ c -Critical cavitation coefficient
ω rad/sAngular velocity
β 1 -Inlet blade angle
β 2 -Outlet blade angle
D m mModel diameter
fHzFrequency
f n HzRotational frequency
F A NAxial hydraulic thrust
gm/s2Gravitational acceleration
h m mModel head
h a mAtmospheric pressure
HmHead
LmLength
nr/minSpeed
n 11 r/minUnit speed
PPaPressure
P a m b PaAbsolute pressure
P v a PaVaporizing pressure
PkWTurbine output
P 11 kWUnit output
Q m m3/sModel flow rate
Q 11 L/sUnit discharge
r 1 -Inlet blade radius
r 2 -Outlet blade radius
T m NmModel torque
T 1 NmMotor-generator torque
T 2 NmFriction torque
T w °CWater temperature
V t 1 -Inlet tangential velocity
V t 2 -Outlet tangential velocity
z mElevation, difference of elevation
z 0 -Guide vane number
B E P -Best efficiency point
R V R -Rotating vortex rope
P I V -Particle image velocimetry
L D A -Laser Doppler anemometry

References

  1. Ullah, A.; Topcu, B.A.; Dogan, M.; Imran, M. Exploring the nexus among hydroelectric power generation, financial development, and economic growth: Evidence from the largest 10 hydroelectric power-generating countries. Energy Strategy Rev. 2024, 52, 101339. [Google Scholar] [CrossRef]
  2. Gupta, A.; Kumar, A.; Khatod, D. Optimized scheduling of Hydropower with increase in solar and wind installations. Energy 2019, 183, 716–732. [Google Scholar] [CrossRef]
  3. Singh, S.; Kharub, M.; Singh, J.; Singh, J.; Jangid, V. Brief survey on mechanical failure and preventive mechanism of turbine blades. Mater. Today Proc. 2020, 38, 2515–2524. [Google Scholar] [CrossRef]
  4. Luna-Ramírez, A.; Campos-Amezcua, A.; Dorantes-Gómez, O.; Mazur-Czerwiec, Z.; Muñoz-Quezada, R. Failure analysis of runner blades in a Francis hydraulic turbine—Case study. Eng. Fail. Anal. 2016, 59, 314–325. [Google Scholar] [CrossRef]
  5. Dorji, U.; Ghomashchi, R. Hydro turbine failure mechanisms: An overview. Eng. Fail. Anal. 2014, 44, 136–147. [Google Scholar] [CrossRef]
  6. Thapa, B.S.; Dahlhaug, O.G.; Thapa, B. Sediment erosion in hydro turbines and its effect on the flow around guide vanes of Francis turbine. Renew. Sustain. Energy Rev. 2015, 49, 1100–1113. [Google Scholar] [CrossRef]
  7. Guangjie, P.; Zhengwei, W.; Yexiang, X.; Yongyao, L. Abrasion predictions for Francis turbines based on liquid–solid two-phase fluid simulations. Eng. Fail. Anal. 2013, 33, 327–335. [Google Scholar] [CrossRef]
  8. Zuo, Z.; Liu, S.; Liu, D.; Qin, D.; Wu, Y. Numerical Predictions of the Incipient and Developed Interblade Vortex Lines of a Model Francis Turbine by Cavitation Calculations. Adv. Mech. Eng. 2013, 5, 397583. [Google Scholar] [CrossRef]
  9. Yamamoto, K.; Müller, A.; Favrel, A.; Avellan, F. Experimental evidence of inter-blade cavitation vortex development in Francis turbines at deep part load condition. Exp. Fluids 2017, 58, 1–14. [Google Scholar] [CrossRef]
  10. Celebioglu, K.; Altintas, B.; Aradag, S.; Tascioglu, Y. Numerical research of cavitation on Francis turbine runners. Int. J. Hydrogen Energy 2017, 42, 17771–17781. [Google Scholar] [CrossRef]
  11. Berbecaru, A.C.; Coman, G.; Gradinaru, C.S.; Sohaciu, M.G.; Predescu, C.; Dumitrescu, R.E.; Ciuca, S.; Gherghescu, I.A. Microstructural Characterization of Some Turbine Blade Martensitic Stainless Steels. Rev. Chim. 2019, 70, 1132–1139. [Google Scholar] [CrossRef]
  12. Escaler, X.; Egusquiza, E.; Farhat, M.; Avellan, F.; Coussirat, M. Detection of cavitation in hydraulic turbines. Mech. Syst. Signal Process. 2006, 20, 983–1007. [Google Scholar] [CrossRef]
  13. Bajic, B. Methods for vibro-acoustic diagnostics of turbine cavitation. J. Hydraul. Res. 2003, 41, 87–96. [Google Scholar] [CrossRef]
  14. Li, S.C.; Zuo, Z.G.; Liu, S.H.; Wu, Y.L.; Li, S. Cavitation Resonance. J. Fluids Eng. 2008, 130, 031302. [Google Scholar] [CrossRef]
  15. Hart, D.; Whale, D. A Review of Cavitation-Erosion Resistant Weld Surfacing Alloys for Hydroturbines; Eutectic Australia Pty. Ltd.: Sydney, Australia, 2007; Volume 8, pp. 180–187. [Google Scholar]
  16. Caron, J.-F.; Farhat, M.; Avellan, F. Physical investigation of the cavitation phenomenon. In Proceedings of the Sixth International Symposium on Fluid Control, Measurement and Visualization (Flucome 2000), Sherbrooke, QC, Canada, 13–17 August 2000. [Google Scholar]
  17. Jacob, T.; Prénat, J.-E. Francis turbine surge: Discussion and data base. In Proceedings of the Hydraulic Machinery and Cavitation: The XVIII IAHR Symposium on Hydraulic Machinery and Cavitation, Valencia, Spain, 16–19 September 1996; Springer: Dordrecht, The Netherlands, 1996. [Google Scholar]
  18. Wang, F.J.; Li, X.Q.; Yang, M.; Zhu, Y.L. Experimental investigation of characteristic frequency in unsteady hydraulic behaviour of a large hydraulic turbine. J. Hydrodyn. Ser. B 2009, 21, 12–19. [Google Scholar] [CrossRef]
  19. Nicolet, C.; Zobeiri, A.; Maruzewski, P.; Avellan, F. Experimental Investigations on Upper Part Load Vortex Rope Pressure Fluctuations in Francis Turbine Draft Tube. Int. J. Fluid Mach. Syst. 2011, 4, 179–190. [Google Scholar] [CrossRef]
  20. Favrel, A.; Müller, A.; Landry, C.; Yamamoto, K.; Avellan, F. Study of the vortex-induced pressure excitation source in a Francis turbine draft tube by particle image velocimetry. Exp. Fluids 2015, 56, 1–15. [Google Scholar] [CrossRef]
  21. Trivedi, C.; Agnalt, E.; Dahlhaug, O.G. Experimental study of a Francis turbine under variable-speed and discharge conditions. Renew. Energy 2018, 119, 447–458. [Google Scholar] [CrossRef]
  22. Litvinov, I.; Shtork, S.; Gorelikov, E.; Mitryakov, A.; Hanjalic, K. Unsteady regimes and pressure pulsations in draft tube of a model hydro turbine in a range of off-design conditions. Exp. Therm. Fluid Sci. 2018, 91, 410–422. [Google Scholar] [CrossRef]
  23. Iliev, I.; Trivedi, C.; Agnalt, E.; Dahlhaug, O.G. Variable-speed operation and pressure pulsations in a Francis turbine and a pump-turbine. In IOP Conference Series: Earth and Environmental Science; IOP Publishing: Bristol, UK, 2019. [Google Scholar]
  24. Wang, W.; Chen, Q.; Yan, D.; Geng, D. A novel comprehensive evaluation method of the draft tube pressure pulsation of Francis turbine based on EEMD and information entropy. Mech. Syst. Signal Process. 2019, 116, 772–786. [Google Scholar] [CrossRef]
  25. Zeng, W.; Yang, J.; Hu, J.; Yang, J. Guide-vane closing schemes for pump-turbines based on transient characteristics in S-shaped region. J. Fluids Eng. 2016, 138, 051302. [Google Scholar] [CrossRef]
  26. Trivedi, C.; Cervantes, M.J.; Gandhi, B.K.; Ole, D.G. Experimental investigations of transient pressure variations in a high head model Francis turbine during start-up and shutdown. J. Hydrodyn. 2014, 26, 277–290. [Google Scholar] [CrossRef]
  27. Andolfatto, L.; Avellan, F. Model testing beyond the scope of International Standards: An outlook. Hydro 2018. 2018. Available online: https://infoscience.epfl.ch/bitstreams/26b3d312-065a-4ec0-94cf-0bb48cdf65f8/download (accessed on 19 August 2024).
  28. Mahawar, R.; Dwivedi, P.; Agrawal, R.; Karn, A. Computational tool for teaching learning velocity triangle of hydraulic turbines. Preprints 2020. [Google Scholar] [CrossRef]
  29. Trivedi, C.; Cervantes, M.J.; Dahlhaug, O.G. Experimental and Numerical Studies of a High-Head Francis Turbine: A Review of the Francis-99 Test Case. Energies 2016, 9, 74. [Google Scholar] [CrossRef]
Figure 1. Experimental test rig of the Francis turbine model.
Applsci 14 07461 g001
Figure 2. Pressure sensor installation in the Francis turbine model.
Applsci 14 07461 g002
Figure 3. Dimensions and design of the Francis turbine model.
Applsci 14 07461 g003
Figure 4. Velocity triangle of a Francis turbine.
Applsci 14 07461 g004
Figure 5. (a) Model turbine performance. (b) Estimated prototype turbine performance.
Applsci 14 07461 g005aApplsci 14 07461 g005b
Figure 6. Performance hill chart. (a) Model turbine. (b) Prototype turbine.
Applsci 14 07461 g006
Figure 7. Cavitation formation and vortex rope of the model runner with a head of 38.50 m.
Applsci 14 07461 g007
Figure 8. Cavitation formation and vortex rope of the model runner at (a) 38.10 m and (b) 37.50 m.
Applsci 14 07461 g008
Figure 9. Peak-to-peak values (ΔH/Hm) within the inlet, head cover, draft tube cone, and elbow at different partial loads 50–100% at 38.50 m.
Applsci 14 07461 g009
Figure 10. Frequency spectrum at the (a) spiral case inlet, (b) head cover, (c) draft tube cone, and (d) draft tub elbow for the model runner with the head of 38.10 m.
Applsci 14 07461 g010
Figure 11. Frequency spectrum at the (a) spiral case inlet, (b) head cover, (c) draft tube cone, and (d) draft tub elbow for the model runner with the head of 38.50 m.
Applsci 14 07461 g011aApplsci 14 07461 g011b
Figure 12. Frequency spectrum at the (a) spiral case inlet, (b) head cover, (c) draft tube cone, and (d) draft tub elbow for the model runner with the head of 37.50 m.
Applsci 14 07461 g012
Table 1. Descriptions of the instruments used in the experiments.
InstrumentsPurposeRangeUncertainty
BOI Measurement and TestingFrequency0–10 MHz±0.08
Pressure CalibrationPressure0.1~6 Mpa±0.005
Emerson InstrumentTemperature sensor0–100 °C±0.04
Emerson InstrumentBarometer0–600 KPa±0.5%
Load cellGenerator torque0–1600 N·m±0.05
Load cellFriction torque0–22 N·m±0.0025
China Electronics CKCW36Inlet pressure0–400 KPa±0.0019
China Electronics CKCW36Outlet pressure0–400 KPa±0.001
Table 2. Prototype efficiency estimation with different working conditions.
HeadTurbineWorking Conditions Loads
mType100%90%80%70%60%50%
38.10Model ( η )93.2593.1593.0692.4091.0289.22
238.6Prototype ( η )94.3094.1093.4292.8791.2689.50
38.50Model ( η )93.3393.2593.0392.6191.0689.30
240Prototype ( η )95.0394.9394.5493.8692.2791.10
37.50Model ( η )93.4593.2092.8892.1090.5089.73
254Prototype ( η )94.6093.9293.1892.5391.0589.20
Table 3. Peak-to-peak ΔH/H(%) values with and without air injection.
Model
Head
Suction
Head
Air Compensation Coefficient
ϕ = 0 (%) (without Air)
Air Compensation Coefficient
ϕ = 0 (%) (with Air)
mmΔH/H(%) and f/ f n ΔH/H(%) and f/ f n
38.10−2.631.12 and 0.072.14 and 0.172
38.50−2.581.01 and 0.2840.58 and 0.03
37.50−2.551.02 and 0.0580.86 and 0.105
Disclaimer/Publisher’s Note: The statements, opinions and data contained in all publications are solely those of the individual author(s) and contributor(s) and not of MDPI and/or the editor(s). MDPI and/or the editor(s) disclaim responsibility for any injury to people or property resulting from any ideas, methods, instructions or products referred to in the content.

