Article

A Study of the Corrosion Resistance of 316L Stainless Steel Manufactured by Powder Bed Laser Additive Manufacturing

by
Juan Ignacio Ahuir-Torres
1,*,
Andrew Burgess
1,
Martin Charles Sharp
1,
Tahsin Tecelli Öpöz
1,
Sean P. Malkeson
2,
Peter L. Falkingham
3,
Robert I. Darlington
2 and
Samuel Tammas-Williams
4
1
General Engineering Research Institute, Faculty of Engineering and Technology, Liverpool John Moores University, Byrom Street, Liverpool L3 3AF, UK
2
School of Engineering, Faculty of Engineering and Technology, Liverpool John Moores University, Byrom Street, Liverpool L3 3AF, UK
3
School of Biological and Environmental Sciences, Faculty of Science, Liverpool John Moores University, Byrom Street, Liverpool L3 3AF, UK
4
School of Engineering, College of Science and Engineering, University of Edinburgh, Robert Stevenson Road, Edinburgh EH9 3FB, UK
*
Author to whom correspondence should be addressed.
Appl. Sci. 2024, 14(17), 7471; https://doi.org/10.3390/app14177471
Submission received: 20 June 2024 / Revised: 29 July 2024 / Accepted: 16 August 2024 / Published: 23 August 2024

Abstract

:
Commercially available 316L (1.4404) stainless steel is commonly used for industrial filtration due to its combination of good material properties, particularly its corrosion resistance, which is a critical factor for filters in corrosive (e.g., saltwater) environments. Recently, laser powder bed fusion (LPBF) has enabled new more complex and efficient filtration pieces to be manufactured from this material. However, it is critical to know how the corrosion resistance is affected by this manufacturing strategy. Here, the corrosion resistance of LPBF manufactured 316L stainless steel is compared with wrought 316L sheet. The corrosion of the samples in saltwater was assessed with asymmetric electrochemical noise, potentiodynamic polarisation curve, and electrochemical impedance spectroscopy. The samples before and after corrosion were examined with scanning electron microscopy and energy-dispersive spectroscopy. The LPBF samples had higher corrosion resistance than the sheet samples and were more noble. The corrosion resistance of the LPBF sample increased with time, while the wrought sample corrosion resistance reduced over time. The corrosion mechanism of both samples was stable with time, formed of a passive film process and a bared material process. This paper presents the first study about the temporal evolution of the LPBF 316L stainless steel corrosion mechanism.

1. Introduction

Commercially available 316L stainless steel (316L SS) is employed in various industries including aeronautic, chemical, maritime, automotive, and biomedical. This is due to its good mechanical properties, moderate corrosion resistance, and acceptable chemical inertness [1,2]. One area of application is filtration components for industrial installations, such as desalination plants. The filtration components often require complex shapes to match the industrial necessities such as size, efficiency, and maintenance requirements.
Laser additive manufacturing technology allows the generation of unique products with complex morphologies in metallic material with high energy efficiency, low cost, and low environment impact. This process can be carried out with different methods such as laser powder bed fusion (LPBF) and powder or wire-fed directed energy deposition [3]. LPBF is commonly used in industry owing to the high resolution and excellent control of the size and internal passages [4,5]. Some features induced by LPBF (e.g., porosity, cracks and dissimilar chemical composition in the samples) can, however, reduce the corrosion resistance that is a key property of the filter [6].
In 2016, Trelewicz et al. [6] compared the corrosion resistance in hydrochloric acid of the wrought 316L SS and other steels generated with laser additive manufacturing using potentiodynamic polarisation curves. The corrosion resistance of the LPBF samples was reported to be 83% lower than that of the wrought samples. This is due to the heterogeneous microstructure and the segregation of the molybdenum. Although the Trelewicz study provides information about the importance of the laser parameters on the corrosion, the corrosion resistance study was only focused on the potentiodynamic polarisation curve. Nie at al. [7] also evaluated the corrosion resistance of LPBF 316L SS in a saltwater environment. The Nie assessments were carried out with open-circuit potential, potentiodynamic polarisation curves, and electrochemical impedance spectroscopy. The Nie work showed that the passive film of the LPBF samples was more stable than that of the wrought samples due to the sub-grain size. The Nie study gave important information about LPBF 316L SS corrosion, but the evolution of the corrosion mechanism over time was absent. In 2021, Sprouter et al. [8] also investigated the influence of the laser parameters on the corrosion resistance of the LPBF 316L SS in saltwater. The cycle voltammetry was utilised to assess the corrosion. Sprouter et al. observed that LPBF samples produced at high speed were more susceptible to the pitting corrosion due to the large numbers of dislocations, carbide formations, and intermetallic formations. Sprouter et al., however, indicated the necessity of carrying out more experiments. In the same year, Karimi et al. [1] also investigated the corrosion resistance of the LPBF 316L SS but in alkaline saltwater. Open-circuit potential, cyclic voltammetry, potentiodynamic polarisation curve, and the Mott–Schottky method were used to analyse the corrosion process. LPBF samples had the capacity of generating a passive film with high stability due to the formation of γ-iron and the reduction in detrimental inclusions. The passive film had a lower electron donor capacity than that of the wrought samples. The Karimi study about the passive film was exhaustive, but the evolution of the corrosion mechanism with time was not reported. One year later, Maicas-Esteve et al. [2] analysed the influence of the energy density on the corrosion resistance of the LPBF 316L SS in deaerated saltwater. The potentiodynamic polarisation curve determined that the LPBF samples produced at medium energy had the best corrosion resistance because of the low porosity. Although Maicas-Esteve et al. defined the sample with the best corrosion resistance, an exhaustive study of the corrosion (e.g., corrosion mechanism evolution) was absent.
As LPBF becomes more widely adopted by industry, it becomes more important to understand the corrosion behaviour of the material being produced. Although the literature about the corrosion resistance of the LPBF 316L SS is widespread, the evolution of the corrosion mechanism over time is absent. Furthermore, the temporal evaluation of the corrosion mechanism, to the best of the corrosion process knowledge, has not been considered in detail in the literature. The present paper, thus, considers the corrosion resistance of commercially available LPBF 316L SS in saltwater with various electrochemical techniques (i.e., asymmetric electrochemical noise, potentiodynamic polarisation curve, and electrochemical impedance spectroscopy) and compares it to wrought material. The electrochemical impedance spectroscopy was conducted at several immersion times. The surfaces before and after potentiodynamic polarisation curve were characterised with scanning electron microscopy and energy dispersive spectroscopy to assess the corrosion effects on the samples. This study allowed us to define the benefits of the LPBF on 316L SS corrosion resistance and to increase the knowledge of the time effect on the corrosion behaviour of the LPBF 316L SS.

2. Material and Methods

2.1. Materials

Two different materials were employed in this work, both being commercially available 316L grade stainless steel. All samples were the same size: 10 mm × 10 mm × 1 mm. The first sample was produced by LPBF by Croft Additive Manufacturing Ltd., Warrington, UK, who is an industry supplier of LPBF components for filtration applications. Pre-alloyed 316L powder was used, alongside standard manufacturing settings. The relative density of the LPBF samples was measured as 98% (equivalent to 7.85 g/cc) from optical micrographs of the polished surface. Images were automatically segmented into solid and void using the Otsu method prior to quantification. The other sample was wrought 316L stainless steel sheet supplied by Merseyside Metal Services Ltd., Birkenhead, UK to EN10088 2:2005 1.4404 with surface finish grade 2B. The intention is thus to compare the corrosion performance of industry standard stainless steel. All samples were polished to mirror finish with the following polishing process: First, the samples were ground with silicon carbide abrasive papers of P400 and P1200 grades. Then, they were polished with polycrystalline diamond pastes of 3 µm and 1 µm sizes. The polished plane of the LPBF samples was XY. The smooth polishing was carried out with colloidal silica gel dissolution at 50% in volume in distilled water. After each stage, the samples were firstly cleaned with commercial detergent and soaked with fresh water. Distilled water was employed in the next step to rinse the samples. The isopropanol spray and dryer were used in the last cleaning step. All grinding and polishing consumables were provided by Struer Ltd., Glasgow, UK, and the chemical agent was provided by RS Components Ltd., Corby, UK. The polishing process was carried out to avoid the influence of roughness on the corrosion resistance of the samples.

2.2. Electrochemical Analyses

The corrosive dissolution consisted of 50 mL of 0.6 M NaCl, the salt being supplied by Merck-Sigma-Aldrich. The exposed areas were approximately 0.8 cm2, being defined with a punch made on electrical isolation tape and shielded with epoxy resin to avoid any crevices. All items were provided by RS Components Ltd. All electrochemical analysis techniques were conducted using a potentio/galvanostat (Interface1010E, Gamry Instruments Inc.) and three-electrode cell. The reference electrode was Ag/AgCl 3 M KCl (EDT Direct Ion Ltd., Dover, UK) while the counter electrode was a platinum wire of 0.7 mm diameter (Cooksongold (Heimerle + Meule Group)). The samples formed the working electrode. The potentio/galvanostat was handled with Gamry Framework version 7.8.4 software and the data were evaluated using Gamry Echem Analyst version 7.8.4 software.
Three electrochemical analysis techniques were utilised to evaluate the corrosion resistance of the samples, these being asymmetrical electrochemical noise (AEN), potentiodynamic polarisation curve (PPC), and electrochemical impedance spectroscopy (EIS). AEN was carried out with two passive techniques, these being open-circuit potential (OCP) and zero ammeter resistance (ZRA). Both techniques were conducted at the same time with 0.5 s acquisition time for 2 h. PPC was set with 0.167 mV/s potential rate, −0.3 V vs. potential at open circuit as initial potential, 2 V vs. Ag/AgCl 3 M KCl as final potential, and 10 mA/cm2 limit current density. The potential at open circuit was measured for 2 h immersion. EIS setups were conducted using a frequency range from 10−2 Hz to 105 Hz, 10 mV (root mean square), and 10 points per frequency decade. EIS analyses were conducted at 2 h, 24 h, 48 h, 72 h, and 96 h of immersion. The potential was defined in the same way as the PPC case. All testing was repeated at least three times for each sample to confirm the validity of the results.

2.3. Sample Characterisation

The microstructure of the samples was revealed with an etching dissolution of 50% in vol. water, 33% in vol. hydrochloric acid, and 17% in vol. nitric acid for 30 s. These chemical agents were supplied by Merck-Sigma-Aldrich. The sample microstructure and surfaces after PPC were characterised with scanning electron microscopy (SEM) and energy-dispersive spectroscopy (EDS). Both techniques were conducted with the electron microscope (TM4000plus, Hitachi High-Tech, Maidenhead, UK). SEM was conducted using backscattered electrons, 15 KV acceleration potential, 71 µA tension current, and 2 µm spot size. EDS was carried out with similar conditions, but the spot size was 3 µm.

3. Results and Discussion

3.1. Microstructural and Chemical Composition Assessment

Both steels showed similar austenitic microstructures (Figure 1), but the grain size was larger for LPBF samples (Figure 1a,b) than for the wrought sheet sample (Figure 1c,d). The final LPBF microstructure was dominated by grains that grow by epitaxial regrowth through multiple layers [9]. The microstructure is a function of both the geometry of the manufactured part and the laser settings, which determine the cooling rate and opportunities for new grains to nucleate. Relatively large grains are often found in bulk sections such as those analysed here [9]. Curved boundaries and voids were seen in the LPBF samples induced by the manufacturing process (Figure 1c). The front of the laser beam generates curved boundaries due to the thermal diffusion of the laser energy into the heat affect zone [10]. Voids are generally generated by a lack of fusion between laser tracks or the formation of keyhole porosity due to laser energy excess [11].
EDS mapping (Figure 2) did not reveal any discontinuities in the distribution of the alloy elements in either the sheet or LPBF 316L stainless steel. The results indicate the good chemical homogeneity of both materials.

3.2. Electrochemical Assessment

3.2.1. AEN Assessments

Although the wrought sheet and LPBF samples showed differences in AEN assessments (Figure 3), both samples presented fluctuations in OCP (Figure 3a) and ZRA (Figure 3b). The metastable pitting generates activation/passivation cycles, causing the fluctuation on both signals [12]. The wrought sheet samples had high peaks in current density (Figure 3b), indicating the presence of large pitting. The size of the pitting is proportional to the current density peak size [13]. The absence of these peaks on LPBF samples also indicates a high corrosion resistance. The voltage was increased over the time while the current density was reduced, meaning the corrosion resistance was increasing with the time for both samples. The growth of the passive film with time on the samples decreases the chemical activity, as the corrosion resistance is proportional to the passive film thickness [7]. The potential of the LPBF samples was higher than that for the wrought sheet 316L SS, whilst the current density showed the opposite behaviour. This also means that the LPBF samples possessed higher corrosion resistance.
The corrosion features from AEN analyses can be seen in Table 1. The noise resistance (Rn) of the LPBF samples was higher than the wrought sheet sample Rn, indicating the higher corrosion resistance of the LPBF 316L SS. The corrosion rate is inversely proportional to Rn. The larger grain size of the LPBF sample increases the corrosion resistance due to the diminishing of the grain boundary area fraction. The grain is the anodic area, and the boundary is the cathodic area. The corrosion resistance is proportional to the anode/cathode area ratio [14]. Rn was calculated with the Equation (1) [15].
R n = σ E σ I
where σE and σI are the standard deviations of the potential and current density, respectively. The current density root mean square (IR.M.S) presented opposite behaviour to that of Rn because this feature is inversely proportional to noise resistance.
The localised index (L.I) of both samples was between 0.1 and 1.0, indicating the corrosion type was mixed (localised and uniform) for both samples. The L.I value indicates the type of the corrosion, with <0.1 indicating uniform, from 0.1 to 1.0 indicating mixed, and >1.0 indicating localised [15]. L.I. was determined using Equation (2) [15].
L . I . = σ I I R . M . S

3.2.2. PPC Evaluation

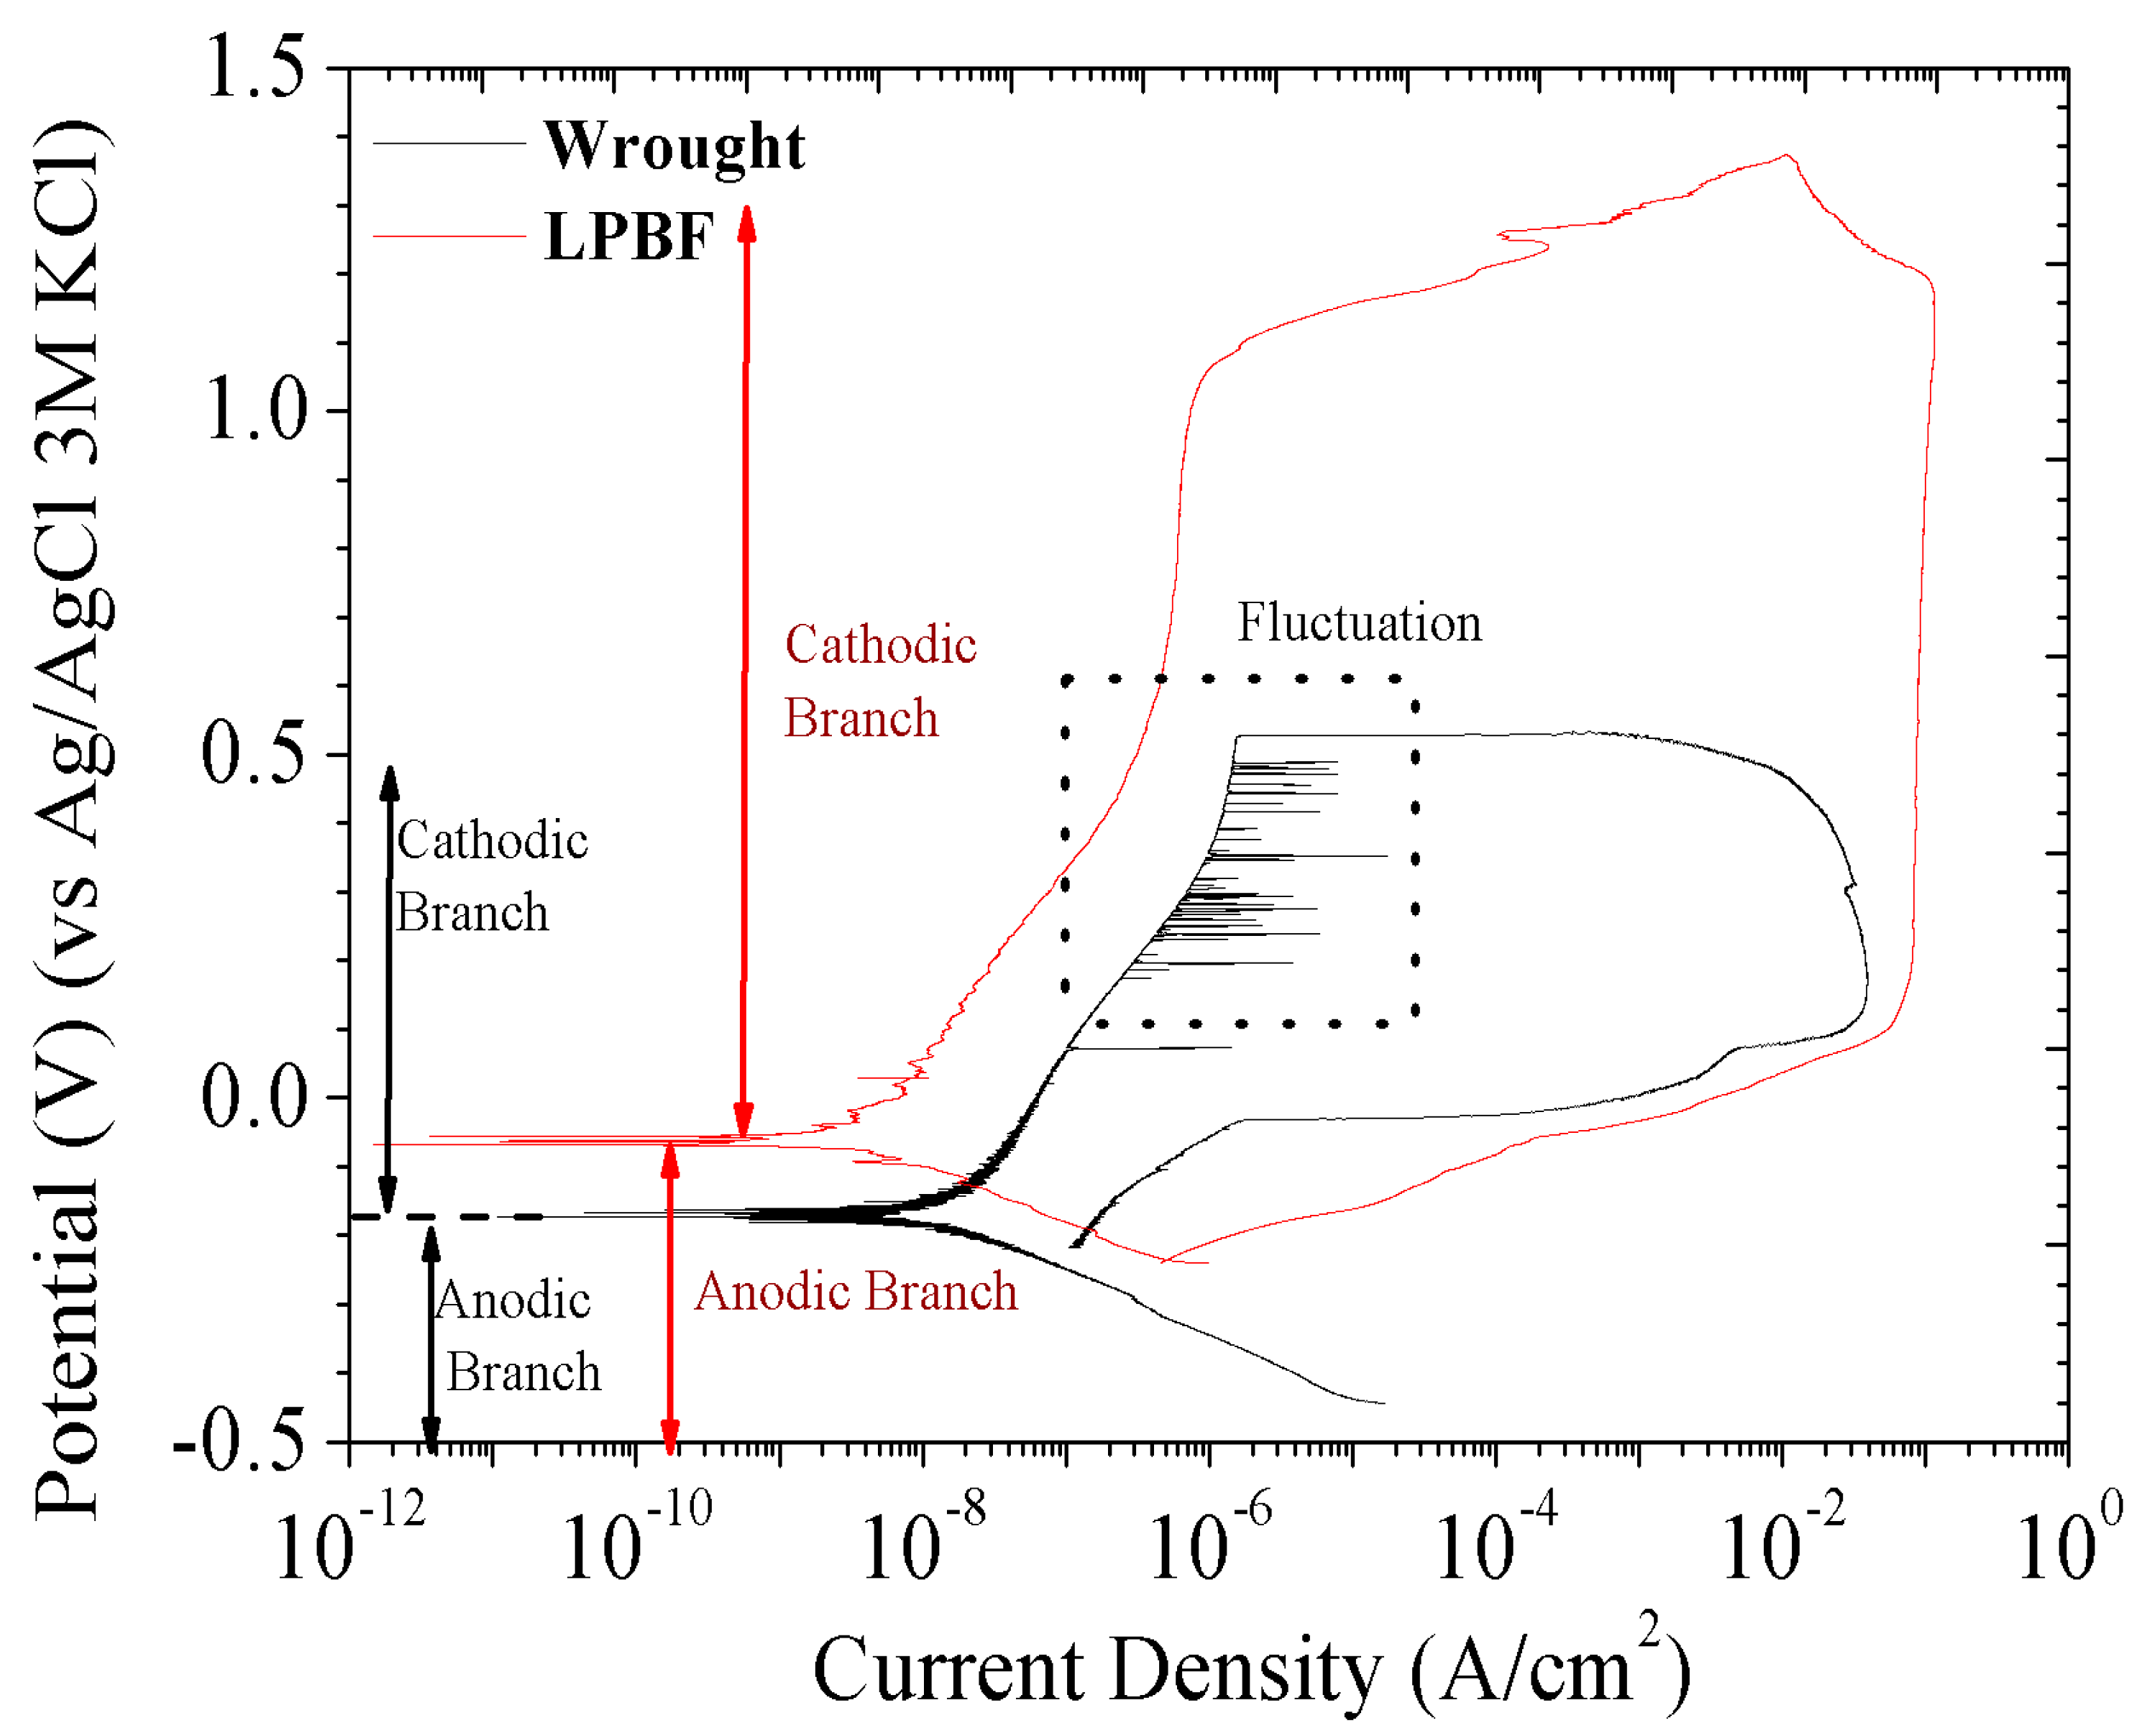
Both samples presented a similar PPC curve shape (Figure 4). The curve was tilted in the cathodic branch, meaning an activation control [16]. The curve in the anodic branch showed different shapes according to the potential. The curve was vertical at low voltage, indicating a passive control. The 316L SS possesses a passive film that results in chemical inactivity of the sample [16]. The breaking passive film potential was higher for the LPBF samples (1.023 V vs. Ag/AgCl 3 M KCl) than that for the wrought sheet samples (0.582 V vs. Ag/AgCl 3 M KCl). The higher thermodynamic stability of the LPBF sample’s passive film is due to the larger size of its grains [7]. This decreases the cathodic effect of the grain boundary on the grain. The molybdenum accumulates at the grain boundary. The molybdenum, being nobler than iron, contributes to the cathodic effect of the grain boundary on the grain [1,2,17,18]. Another difference in the PPC of the samples was the presence of fluctuations in the anodic branch of the wrought sheet sample. Metastable pitting is responsible for these fluctuations [7]. The reduction of the grain boundary cathodic effect mitigates the metastable pitting formations [13]. The corrosion potential of the wrought sheet sample (−0.174 V vs. Ag/AgCl 3 M KCl) was lower than that of the LPBF samples (−0.063 V vs. Ag/AgCl 3 M KCl). Note that the polarisation curve transitions from the cathodic branch to the anodic branch at the corrosion potential. In the other words, the corrosion potential is defined by the potential at which the cathodic and anodic branches intersect. The grain size is also responsible for the more noble LPBF samples. The spontaneous repassivation of the samples was not possible for both types of 316L SS, as indicated by the absence of an inflexion point in the return curve. It is noted that these results coincided with AEN data, validating the electrochemical results.
Table 2 lists the corrosion features of the samples obtained with PPC. The passive film corrosion rate (C.R.pass) was slower for the LPBF samples than that for the wrought samples. The polarisation resistance (Rp) of the wrought sheet sample was lower than the LPBF sample Rp. This factor (Rp) is proportional to the corrosion resistance. These results showed that the corrosion resistance of the LPBF sample was higher than that of the wrought sheet samples. C.R.pass and Rp were calculated with Equation (3) [19] and (4) [20], correlatively.
C . R . p a s s = I p a s s × M F × n × ρ
R p = β c × β a 2.303 × I c o r r × β c + β a
Here, Ipass is the passive film current density, M is the molar mass of the iron (55.88 g/mol), F is Faraday’s constant (96,500 C/mol), n is the electron transferred (3 e), ρ is the density of the iron (7.875 g/cm3), Icorr is the corrosion current density, and βc and βa are the cathodic and anodic slopes. Ipass was measured in the vertical curve of the anodic branch. Icorr was calculated with Tafel’s lines intersection method [21,22]. The corrosion rate in the equilibrium (C.R.corr) was higher for the LPBF samples than for the wrought sheet samples. However, this parameter is not of much importance in the corrosion kinetics of the passive film owing to this being defined by C.R.pass. The degradation rate of the material in the corrosive process is defined by this parameter for passive material [23]. C.R.corr was estimated using Equation (5) [19].
C . R . c o r r = I c o r r × M F × n × ρ

3.2.3. EIS Analyses

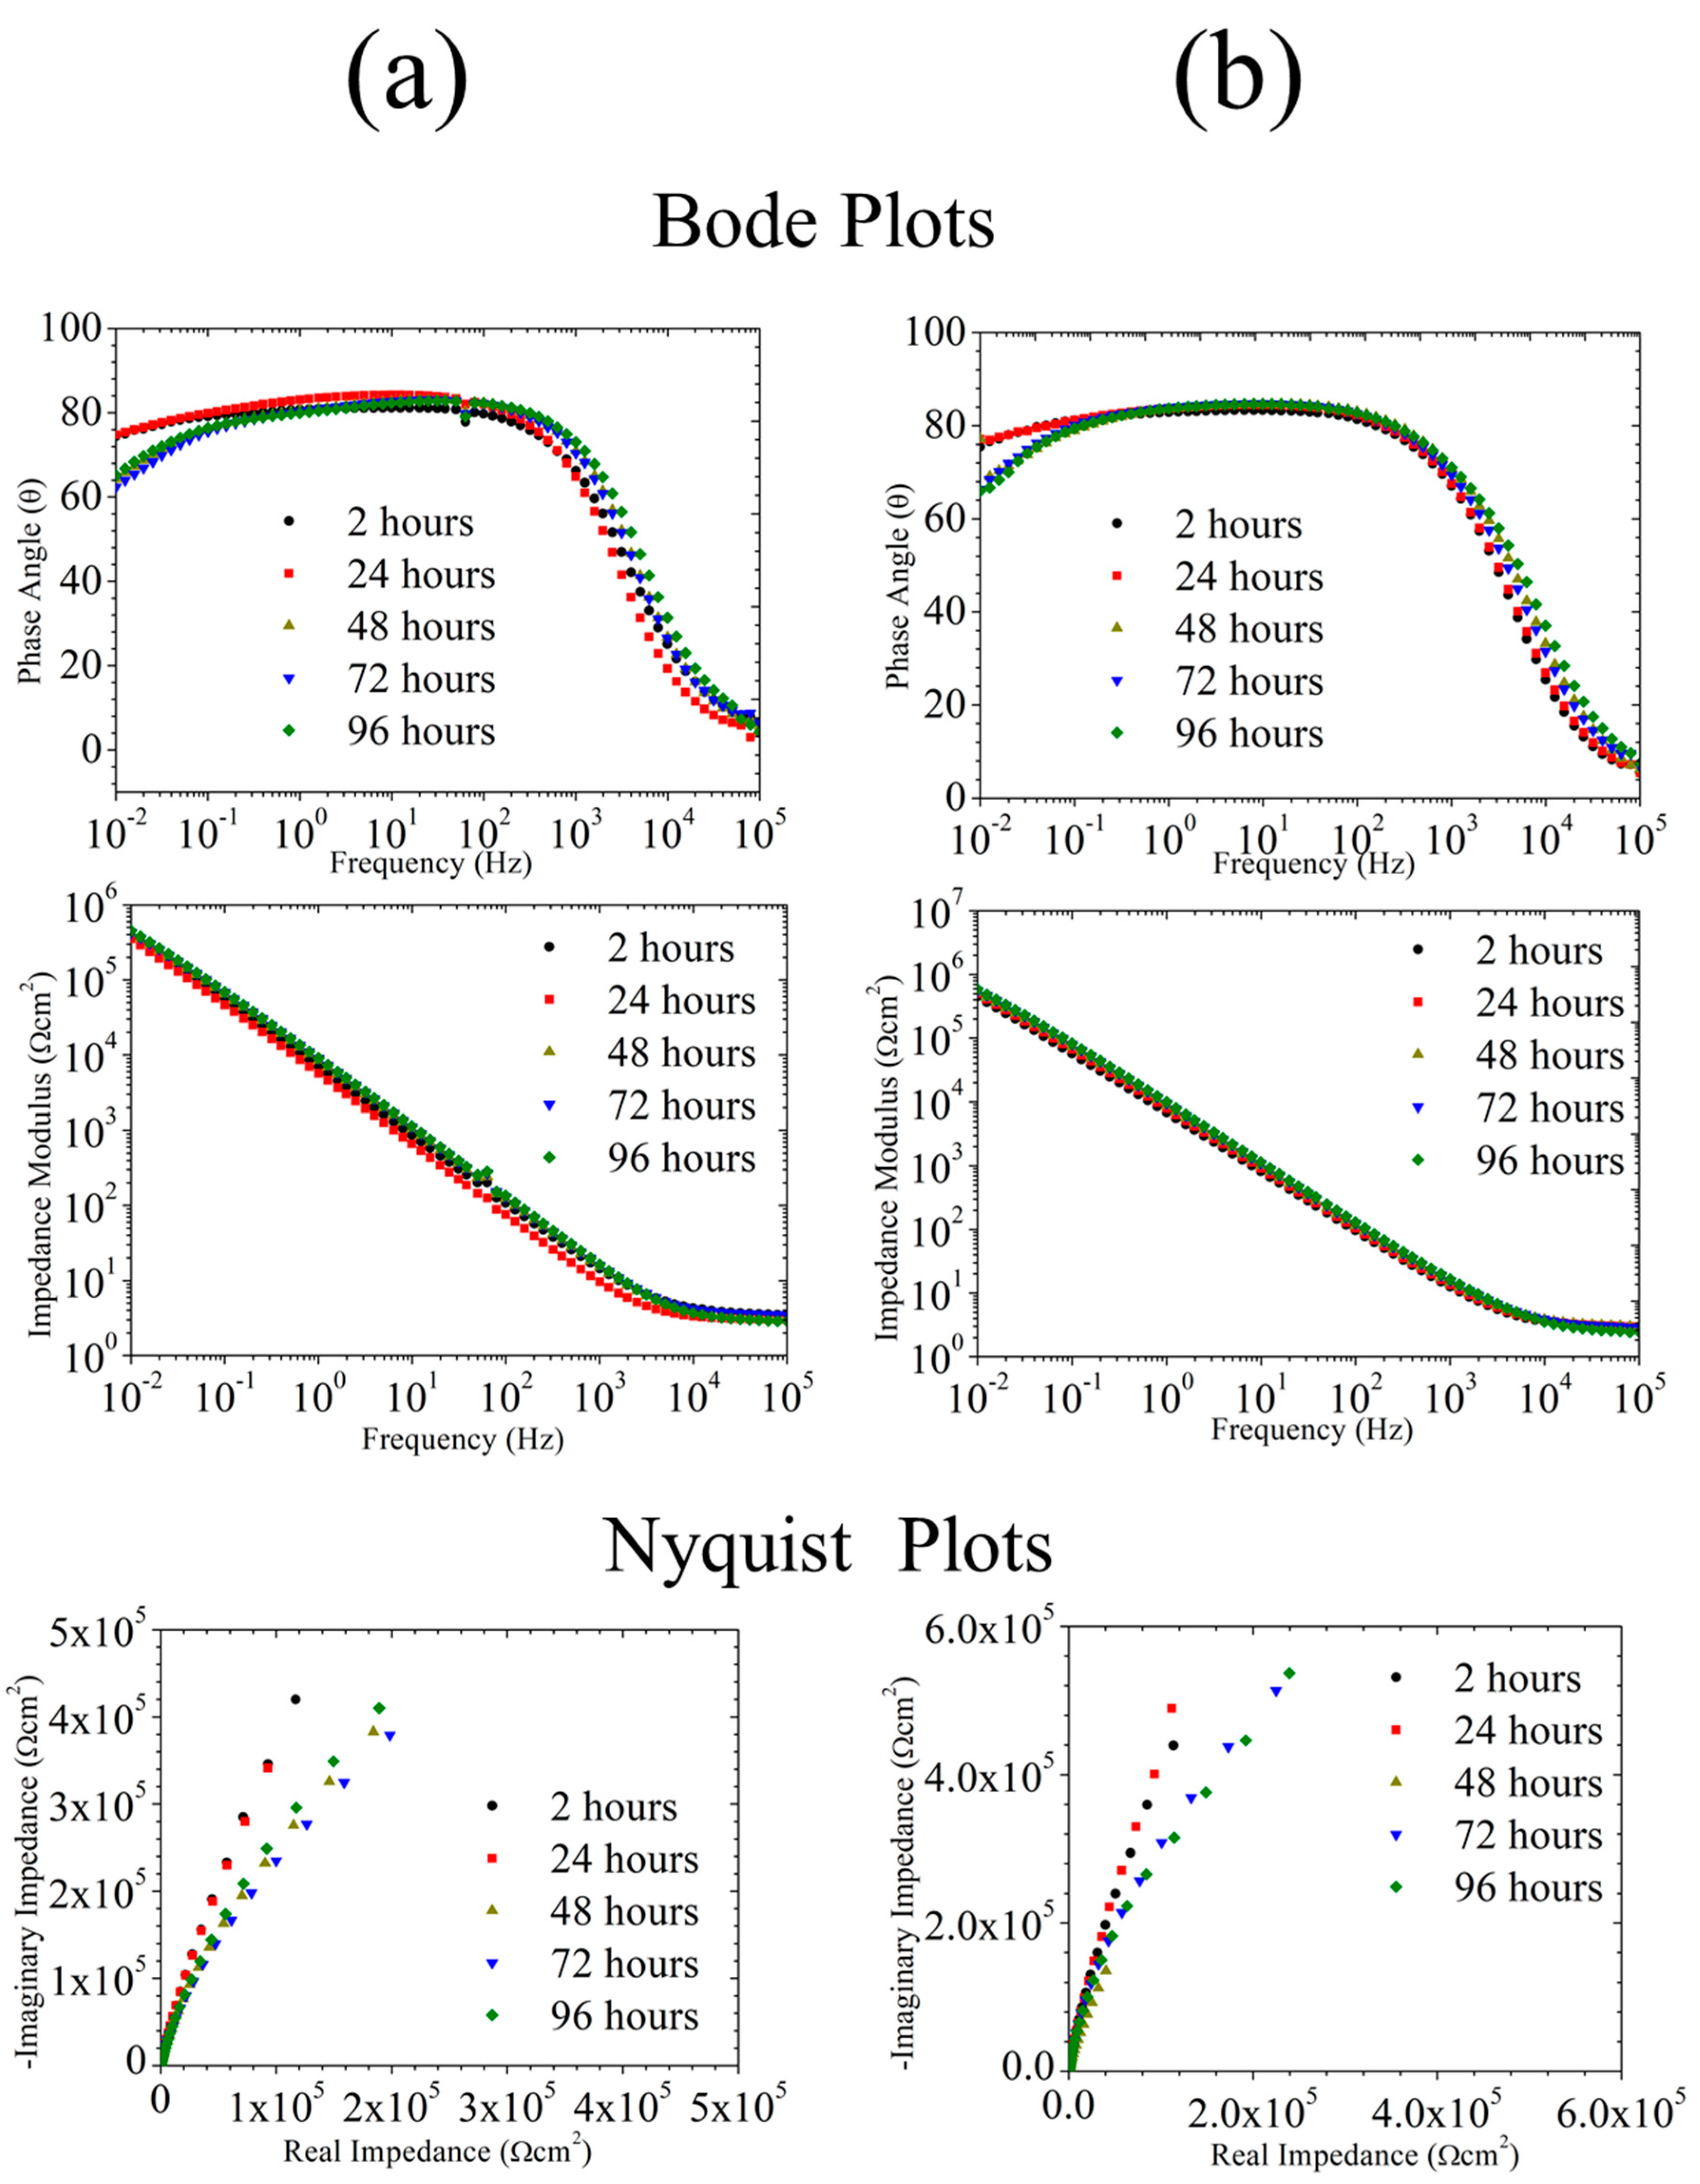
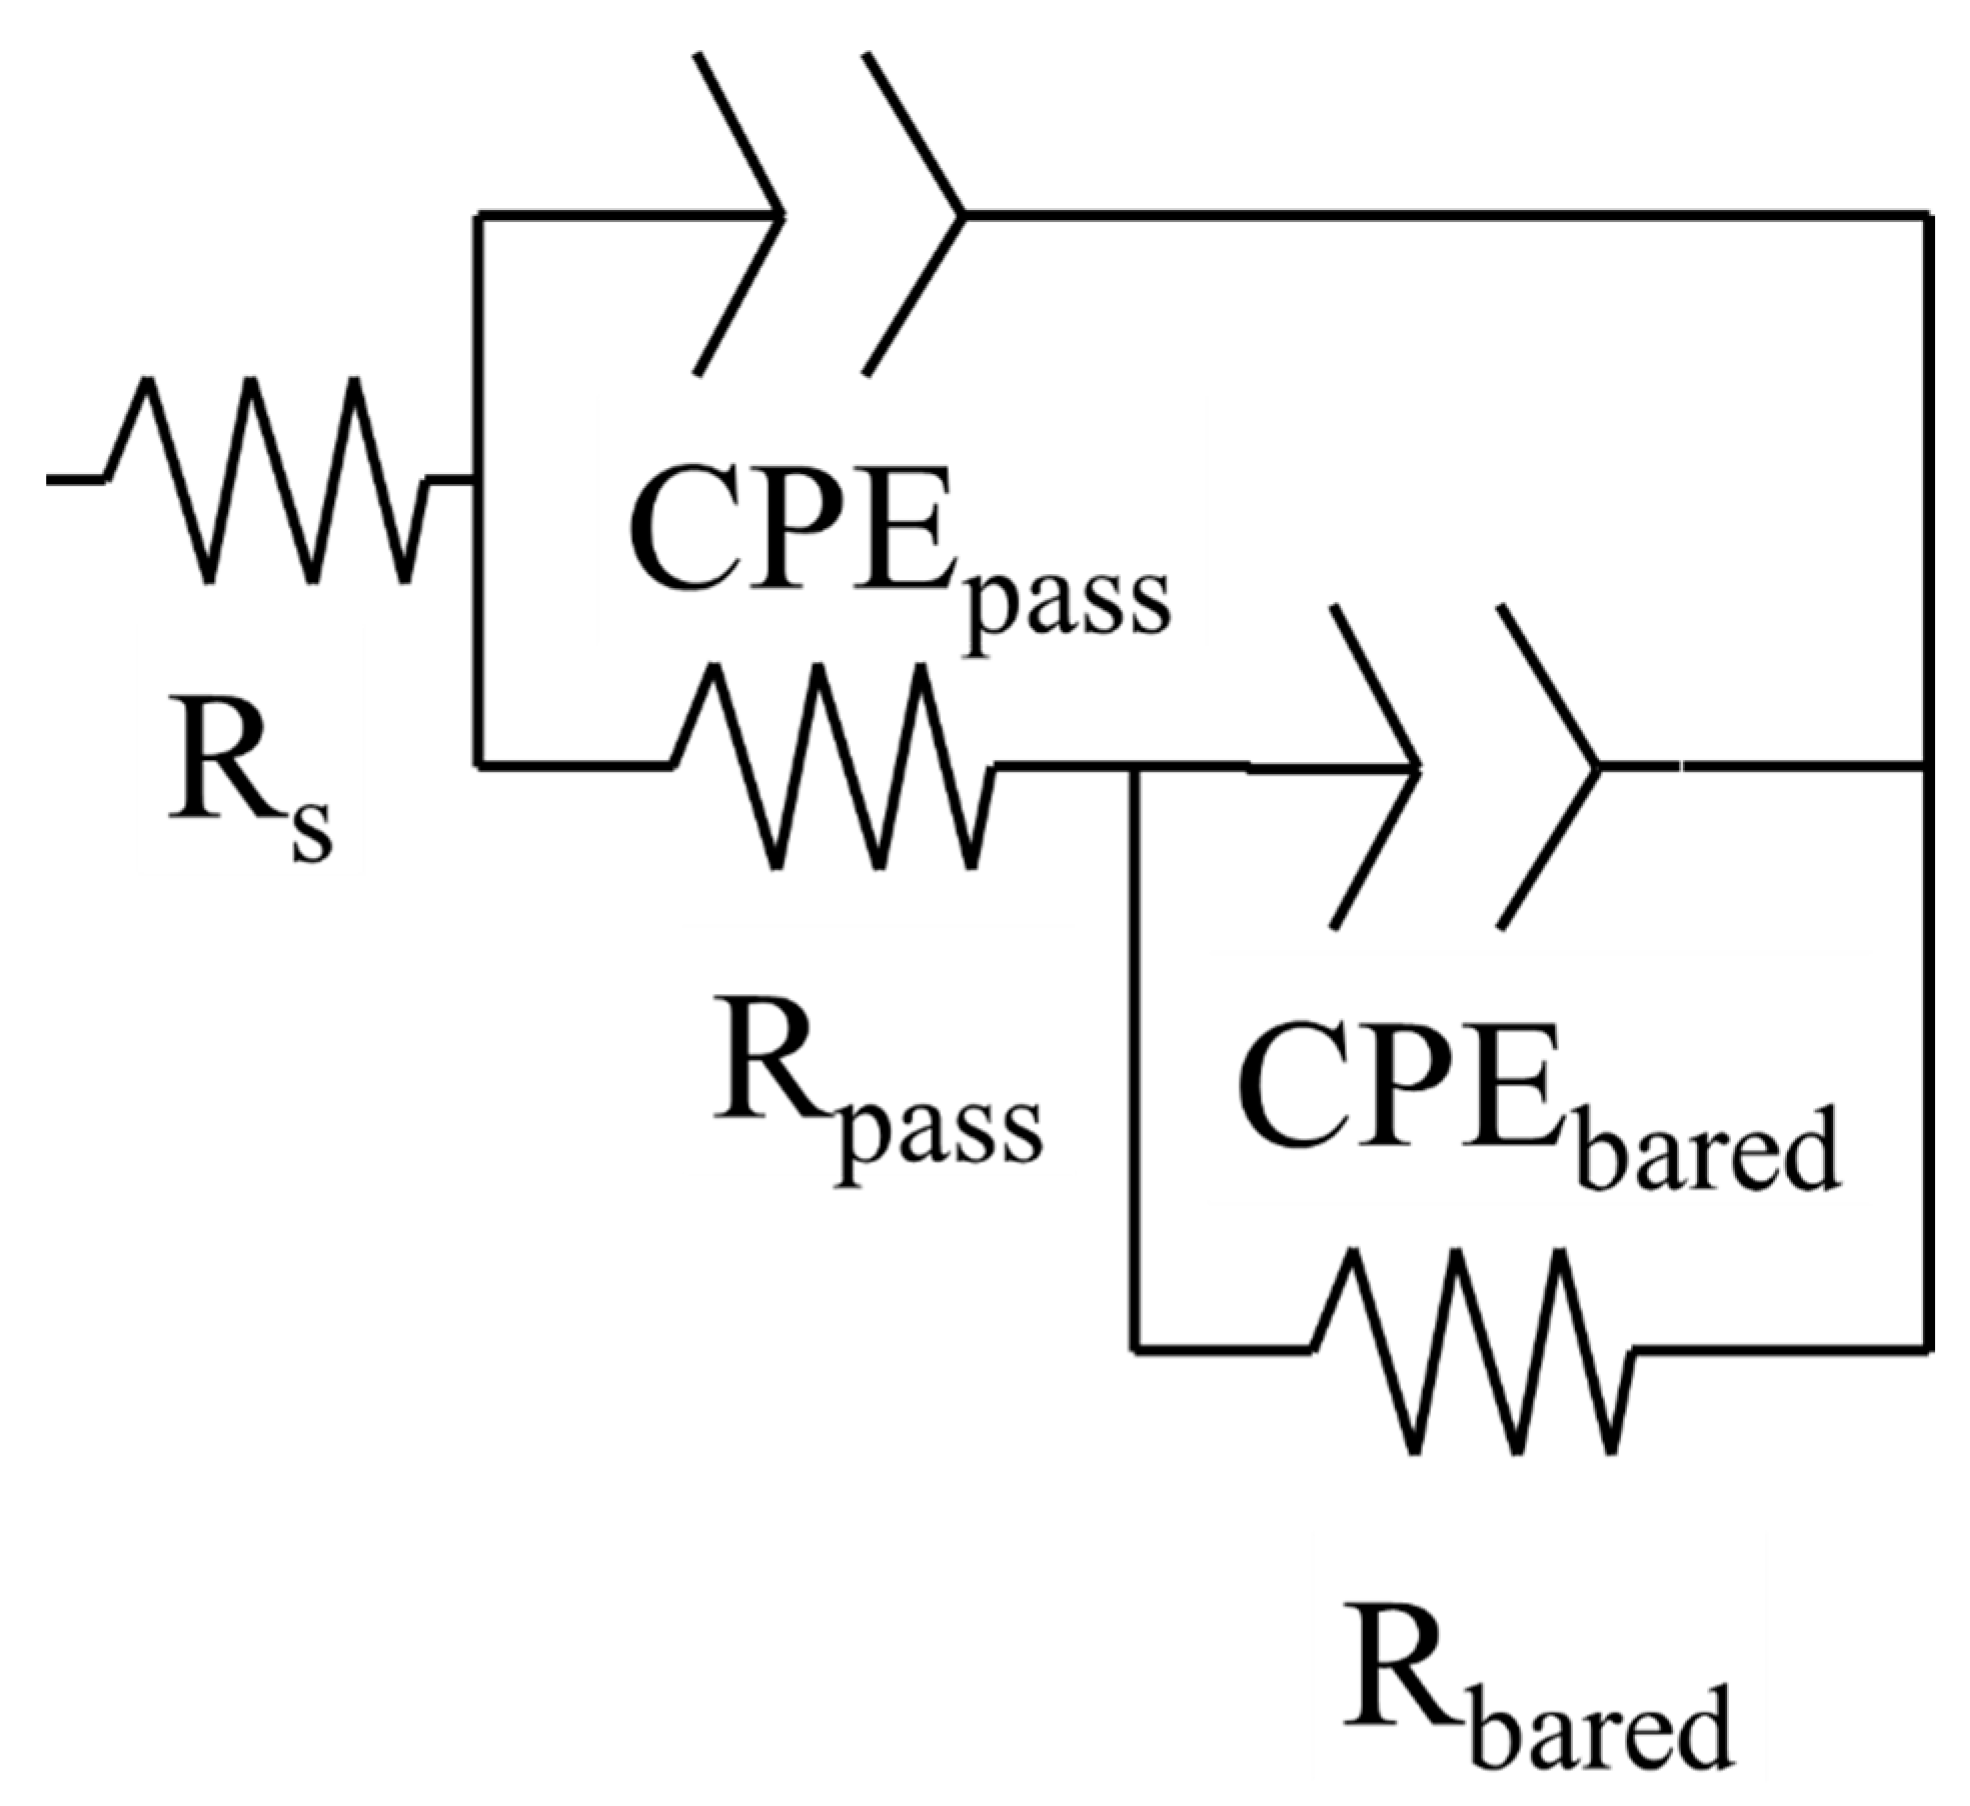
EIS assessments (Figure 5) showed the corrosion mechanism evolution of the samples. Both samples presented a similar corrosion mechanism evolution over time, indicating its high stability. The equivalent circuit method was utilised to analyse the corrosion mechanism. The horizontal curve at the high frequency range (from 104 Hz to 105 Hz) in Bode plots of the impedance modulus (Zm) in function to frequency (υ) indicated the presence of a resistance in the equivalent circuit. The resistance was similar for all immersion times and samples, meaning that this element corresponds to the solution resistance (Rs) [24]. The double peak in Bode plots of phase angle vs. υ, the tilted curve with two slopes in Zm against the υ plot, and the two loops in the Nyquist plots indicate two overlapped constant times. The double peak was difficult to be distinguished due to the significant overlapping between peaks, resulting in a flattened aspect. These time constants are formed of a constant phase element (CPE) and a resistance in parallel with each other. Note that CPE has a power element (η) due to this not being an ideal capacitor [24]. The resistance of the time constant at a medium frequency range (from 104 Hz to 1 Hz) is in serial to the CPE of the time constant at a low frequency range (from 10−1 Hz to 10−2 Hz). Both time constants were in series with Rs. The resistances represent the resistance to the charge transference of the samples, while CPEs represent the double layer generated by the alignment of the material and dissolution charges [7,25]. The time constant at a medium frequency range corresponds to the passive film (Rpass, CPEpass, and ηpass), whilst the bared material is rendered by the constant time at a low frequency range (Rbared, CPEbared, and ηbared). The equivalent circuit was thus composed of three time constants, as can be seen in Figure 6. This is a common equivalent circuit used for 316L stainless steel [7,25].
Table 3 lists the values of the equivalent circuit elements according to the samples and immersion time. Rs was similar for the various immersion times and samples. The solution’s electrochemical features usually remained constant because the corrosion process mainly occurs on the metallic material [25]. CPEpass was similar for all immersion times and sample kinds, meaning the sample passive film thickness was constant over the times and similar for both samples. The thickness of the passive film (d) and coating are proportional to CPEpass, as shown in Equation (6) [7,12,20].
d = E p × E o C P E p a s s
where Ep is the diiron trioxide dielectric constant (17.85) and Eo is the vacuum permeability (8.854 10−14 Fcm−1 [7]). d was around 1 nm for both samples, being similar to the passive film thickness observed in other works [7]. ηpass was around 0.9 for all conditions, meaning a smooth passive film. n can be inversely proportional to the surface roughness of the element [26]. Rpass had dissimilar evolution over the time according to the type of sample. For the wrought sheet sample, Rpass decreased over time whilst Rpass increased with time for the LPBF sample. The larger size of the grain encourages the improvement of the passive film corrosion resistance over time [7,8]. For the bared material, CPEbared fluctuated over time for both samples. ηbared diminished with time for both samples to values close to 0.5. The dielectric relaxation processes are indicated by this value [27]. Rbared of the wrought sheet sample increased over time. The internal oxidation of the bared material can increase the corrosion resistance of the bared material, meaning an internal corrosion. The LPBF sample Rbared fluctuated with the time. Note that resistance values were similar to Rp from PPC (Table 2).

3.3. Evaluation of the Corroded Surface

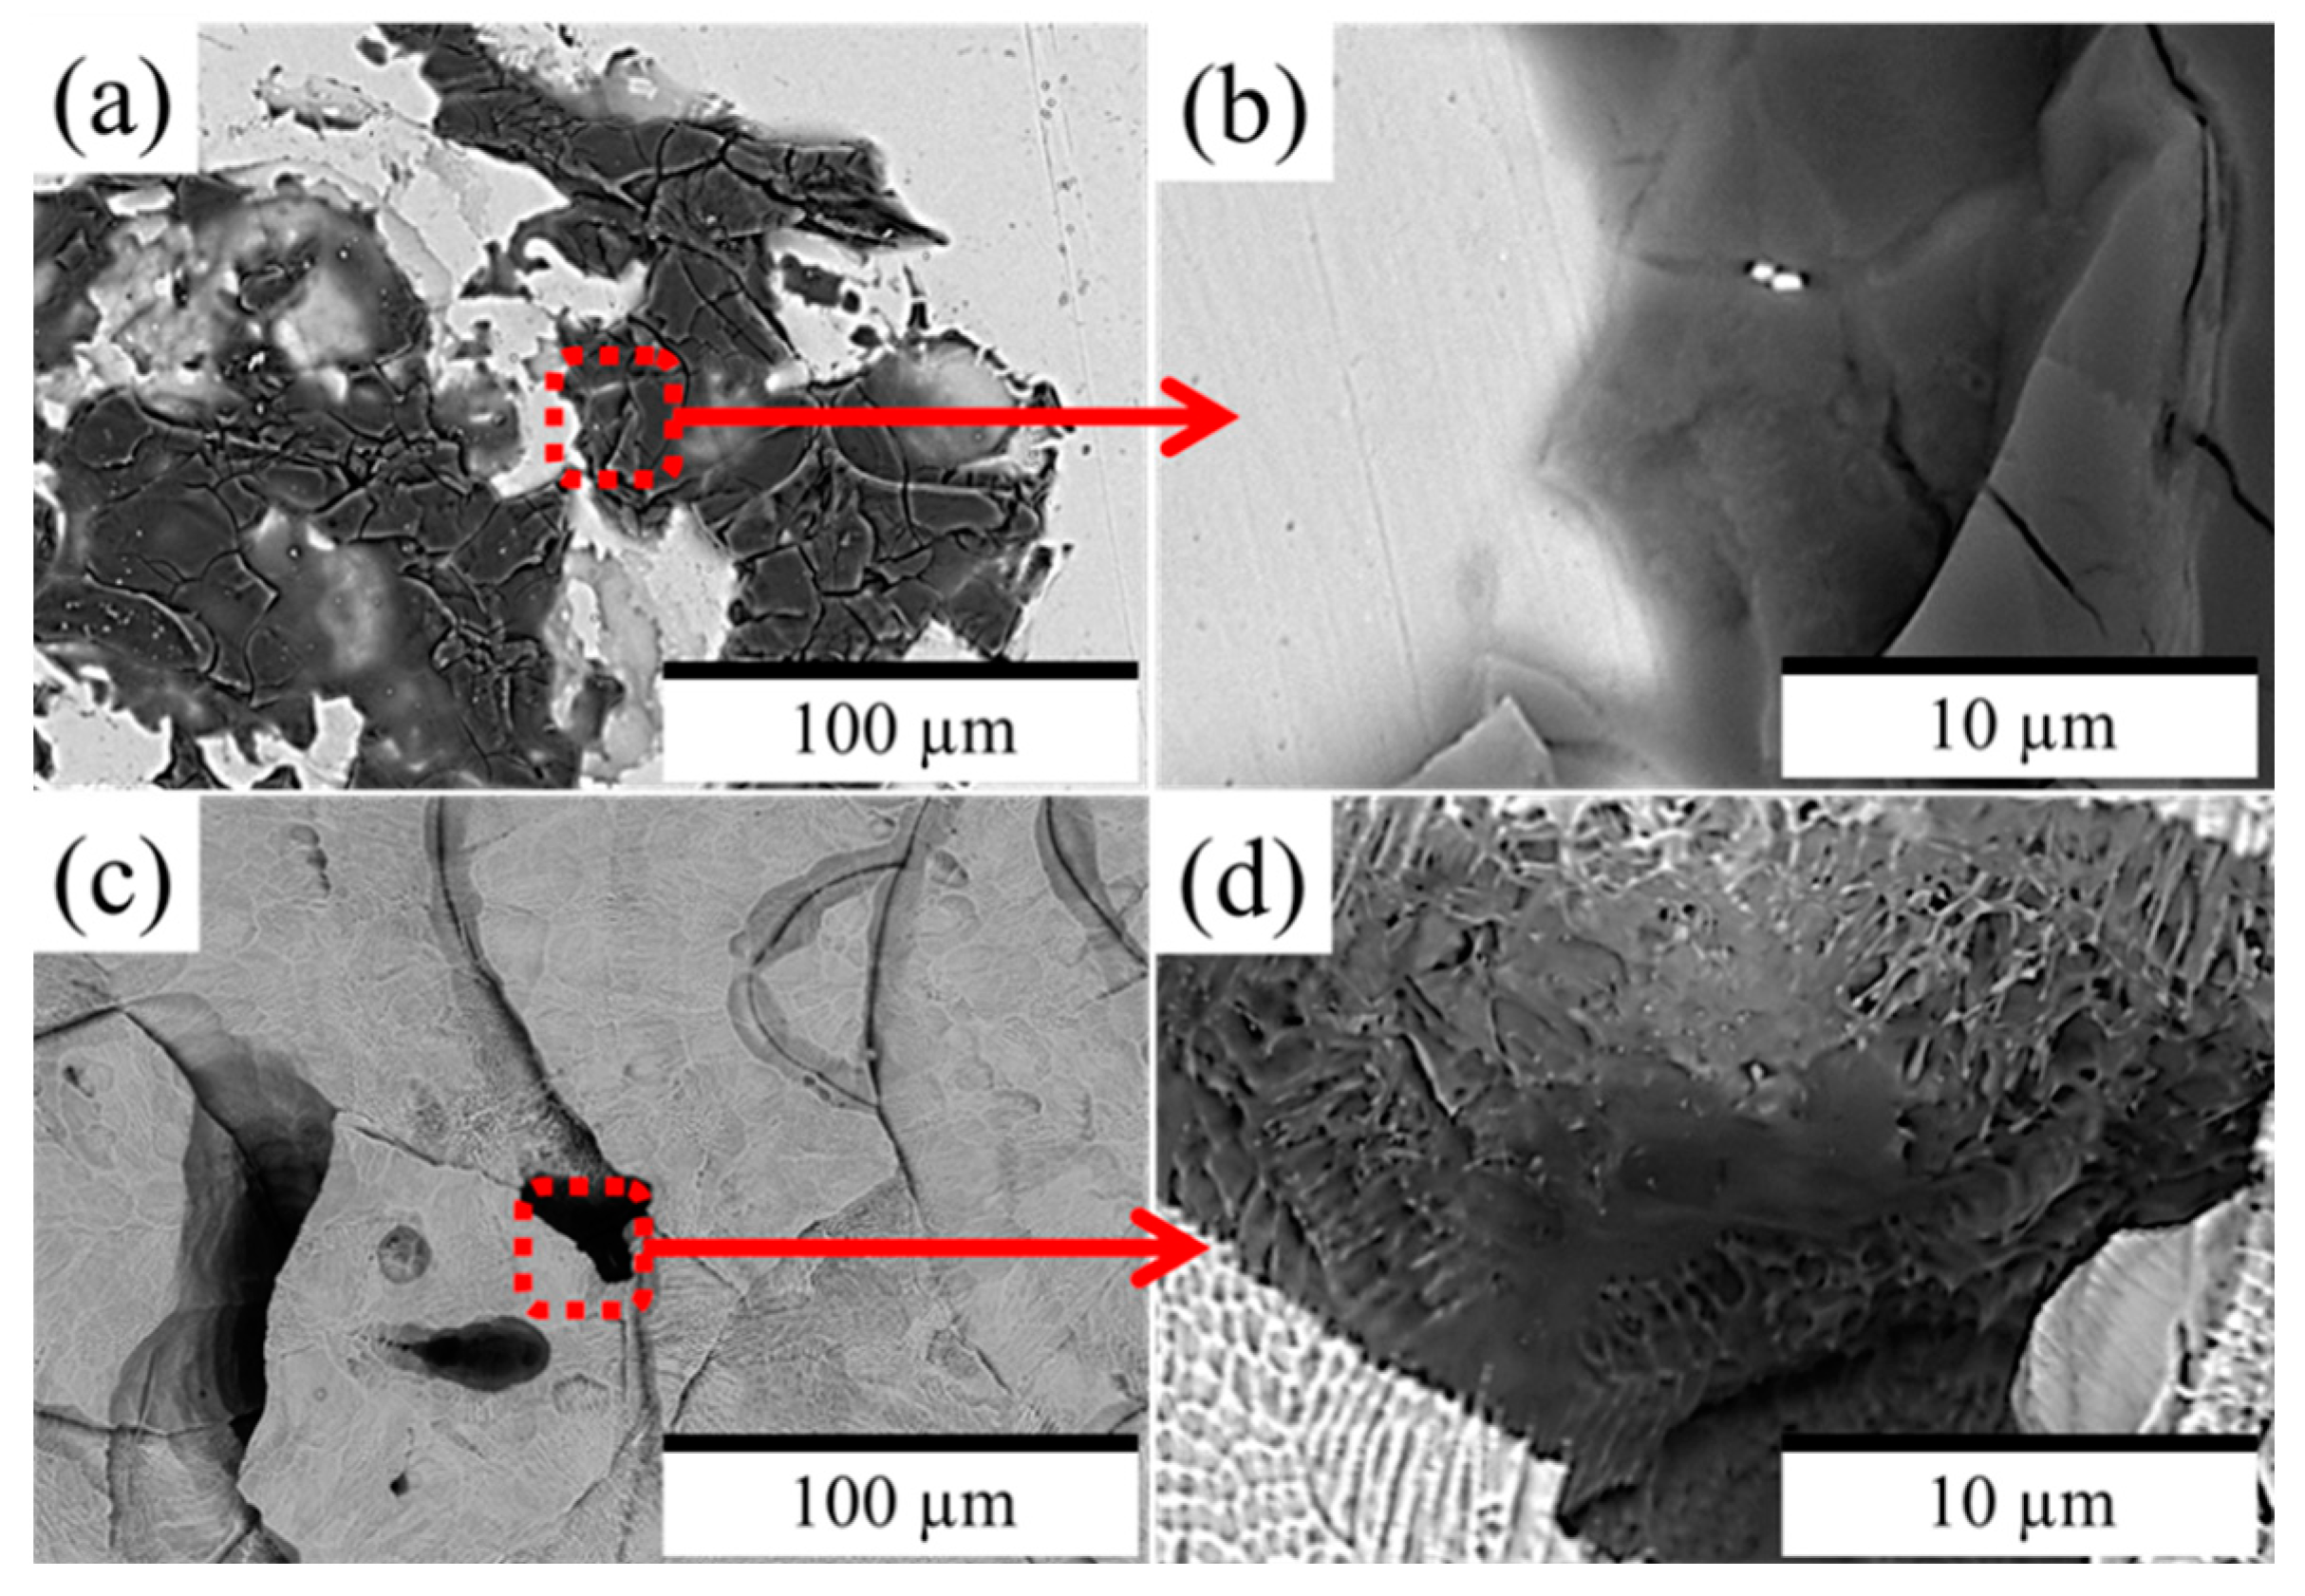
The shape of the corroded area of the two different sample types was not the same (Figure 7). The corroded area was heterogeneous with cracks on the wrought sheet area (Figure 7a,b). The heterogeneity of the corroded surface validates the localised corrosion indicated in AEN analyses. This is the typical corrosion for 316L stainless steel. The chloride ions can cause local dissolution of the passive film, producing cracks [25]. Corroded LPBF samples (Figure 7c,d) showed pitting localised in the voids and molten front. The passive film is weaker in the voids, encouraging the formation of pitting [25]. The corroded area of the wrought sheet samples was two times larger than that for the LPBF samples, further indicating the LPBF material’s higher corrosion resistance.
The distribution of the chemical elements in the corroded area was different according to the sample (Figure 8). The corroded area on the wrought sheet samples (Figure 8a) showed a higher concentration of the carbon and oxygen while iron, chromium, and nickel had lower concentrations on the area. This indicates localised damages of the passive film. For the LPBF samples, the concentration of the elements was found to be homogeneous, meaning that the passive film was less damaged. The good resistance of the LPBF sample’s passive film is due to the large grain size that mitigates the cathodic effect of the grain boundary. The cathodic effect of the grain boundary encourages the corrosion of the 316L stainless steel. The high concentration of the molybdenum contributes to the cathodic effect at the grain boundary [1,2,17,18].

4. Conclusions

This study compares the corrosion resistance of LPBF-generated 316L samples with wrought sheet 316L samples. The evolution of the corrosion mechanism over time is defined in this paper, being considered for the first time. This contribution is fundamental to understanding the impact of time on the corrosion resistance of the LPFB and wrought 316L SS. Based on the findings of the current paper, the following conclusions can be delivered:
LPBF samples show a larger grain size than wrought sheet 316L stainless steel. The metallic alloy elements have a homogeneous distribution, while the carbon and silicon are localised in the molten front and voids. Despite these imperfections, the LPBF 316L samples are found to have a high kinetic and thermodynamic corrosion resistance. The large size of the grain increases the corrosion resistance of the LPBF samples due to the mitigation of the grain boundary cathodic effect. As a result, the LPBF 316L SS presents better corrosion resistance than wrought 316L SS, contrary to some results found in the literature [6]. According to a study in the literature, an LPBF sample passive film current density was 135 µA/cm2 [6]. In contrast, the passive film current density was 0.953 µA/cm2 in this study. The breaking passive film potential was cited as 0 V vs. Ag/AgCl 3 M KCl [6] in the literature, whereas in this study, this potential was 1 V. Note that the difference in these values is attributed to the varying aggressive environment used in these studies: 0.1 M HCl [6] for the literature and 0.6 M NaCl for this study. Both samples show similar types of corrosion (mixed) and controls of the anodic and cathodic branch.
The evolution of the corrosion mechanisms over time in saltwater is similar for both types of 316L SS with the presence of the passive film. The corrosion mechanism is stable over time. The corrosion resistance increased with time for the LPBF samples, while the wrought sheet 316L stainless steel decreased for immersion times equal or shorter than 96 h.
Laser powder bed fusion manufacturing technology allows for the design of structures with complex shapes and high corrosion resistance that can be employed in several applications. This technology is used in the industrial field, as demonstrated by the origin of the LPBF samples, which were supplied by Croft Additive Manufacturing Ltd., a division of Croft Filters, Warrington, UK.

Author Contributions

Conceptualization, J.I.A.-T., A.B., M.C.S., T.T.Ö., S.P.M., P.L.F., R.I.D. and S.T.-W.; methodology, J.I.A.-T.; validation, J.I.A.-T.; formal analysis, J.I.A.-T.; investigation, J.I.A.-T.; resources, A.B.; data curation, J.I.A.-T.; writing—original draft preparation, J.I.A.-T.; writing—review and editing, J.I.A.-T., A.B., M.C.S., T.T.Ö., S.P.M., P.L.F., R.I.D. and S.T.-W. All authors have read and agreed to the published version of the manuscript.

Funding

This research received no external funding.

Institutional Review Board Statement

Not applicable.

Informed Consent Statement

Not applicable.

Data Availability Statement

The datasets generated during and/or analysed during the current study are available in the manuscript.

Acknowledgments

Croft Additive Manufacturing Ltd. supported this paper by supplying the LPBF sample.

Conflicts of Interest

The authors declare no conflict of interest.

References

  1. Karimi, M.S.; Yeganeh, M.; Zaree, S.A.; Eskandari, M. Corrosion behavior of 316L stainless steel manufactured by laser powder bed fusion (L-PBF) in an alkaline solution. Opt. Laser Technol. 2021, 138, 106918. [Google Scholar] [CrossRef]
  2. Maicas-Esteve, H.; Taji, I.; Wilms, M.; Gonzalez-Garcia, Y.; Johnsen, R. Corrosion and microstructural investigation on additively manufactured 316L stainless steel: Experimental and statistical approach. Materials 2022, 15, 1605. [Google Scholar] [CrossRef]
  3. Yin, Y.; Tan, Q.; Bermingham, M.; Mo, N.; Zhang, J.; Zhang, M.X. Laser additive manufacturing of steels. Int. Mater. Rev. 2022, 67, 487–573. [Google Scholar] [CrossRef]
  4. Frazier, W.E. Metal additive manufacturing: A review. J. Mater. Eng. Perform. 2014, 23, 1917–1928. [Google Scholar] [CrossRef]
  5. Voisin, T.; Shi, R.; Zhu, Y.; Qi, Z.; Wu, M.; Sen-Britain, S.; Zhang, Y.; Qiu, S.R.; Wang, Y.M.; Thomas, S.; et al. Pitting corrosion in 316L stainless steel fabricated by laser powder bed fusion additive manufacturing: A review and perspective. JOM 2022, 74, 1668–1689. [Google Scholar] [CrossRef]
  6. Trelewicz, J.R.; Halada, G.P.; Donaldson, O.K.; Manogharan, G. Microstructure and corrosion resistance of laser additively manufactured 316L stainless steel. JOM 2016, 68, 850–859. [Google Scholar] [CrossRef]
  7. Nie, J.; Wei, L.; Jiang, Y.; Li, Q.; Luo, H. Corrosion mechanism of additively manufactured 316 L stainless steel in 3.5 wt.% NaCl solution. Mater. Today Commun. 2021, 26, 101648. [Google Scholar] [CrossRef]
  8. Sprouster, D.J.; Cunningham, W.S.; Halada, G.P.; Yan, H.; Pattammattel, A.; Huang, X.; Olds, D.; Tilton, M.; Chu, Y.S.; Dooryhee, E.; et al. Dislocation microstructure and its influence on corrosion behavior in laser additively manufactured 316L stainless steel. Addit. Manuf. 2021, 47, 102263. [Google Scholar] [CrossRef]
  9. Leicht, A.; Klement, U.; Hryha, E. Effect of build geometry on the microstructural development of 316L parts produced by additive manufacturing. Mater. Charact. 2018, 143, 137–143. [Google Scholar] [CrossRef]
  10. Kurzynowski, T.; Gruber, K.; Stopyra, W.; Kuźnicka, B.; Chlebus, E. Correlation between process parameters, microstructure and properties of 316 L stainless steel processed by selective laser melting. Mater. Sci. Eng. A 2018, 718, 64–73. [Google Scholar] [CrossRef]
  11. Gordon, J.V.; Narra, S.P.; Cunningham, R.W.; Liu, H.; Chen, H.; Suter, R.M.; Beuth, J.L.; Rollett, A.D. Defect structure process maps for laser powder bed fusion additive manufacturing. Addit. Manuf. 2020, 36, 101552. [Google Scholar] [CrossRef]
  12. Berthomé, G.; Malki, B.; Baroux, B. Pitting transients analysis of stainless steels at the open circuit potential. Corros. Sci. 2006, 48, 2432–2441. [Google Scholar] [CrossRef]
  13. Aghuy, A.A.; Zakeri, M.; Moayed, M.H.; Mazinani, M. Effect of grain size on pitting corrosion of 304L austenitic stainless steel. Corros. Sci. 2015, 94, 368–376. [Google Scholar] [CrossRef]
  14. Nazarov, A.; Thierry, D. Thierry, Rate-determining reactions of atmospheric corrosion. Electrochim. Acta 2004, 49, 2717–2724. [Google Scholar] [CrossRef]
  15. Mansfeld, F.; Sun, Z. Localization index obtained from electrochemical noise analysis. Corrosion 1999, 55, 915–918. [Google Scholar] [CrossRef]
  16. Esmailzadeh, S.; Aliofkhazraei, M.; Sarlak, H. Interpretation of cyclic potentiodynamic polarization test results for study of corrosion behavior of metals: A review. Prot. Met. Phys. Chem. Surf. 2018, 54, 976–989. [Google Scholar] [CrossRef]
  17. Wang, Z.; Wang, Y.; Wang, C. Area ratio of cathode/anode effect on the galvanic corrosion of high potential difference coupling in seawater. IOP Conf. Ser. Mater. Sci. Eng. 2018, 322, 022046. [Google Scholar] [CrossRef]
  18. Guzmán-Nogales, R.; Estupiñán-López, F.; Gaona-Tiburcio, C.; Lopez-Botello, O.E.; Ramírez-Rodríguez, J.G.; Zambrano-Robledo, P.C. Corrosion Resistance Measurement of 316L Stainless Steel Manufactured by Selective Laser Melting. Materials 2021, 14, 4509. [Google Scholar] [CrossRef] [PubMed]
  19. Kelly, R.G.; Scully, J.R.; Shoesmith, D.; Buchheit, R.G. Electrochemical Techniques in Corrosion Science and Engineering; CRC Press: Boca Raton, FL, USA, 2002. [Google Scholar]
  20. Ahuir-Torres, J.I.; Kotadia, H.R.; Öpoz, T.T.; Sharp, M.C. A study on the corrosion behaviour of laser textured pure aluminium in saltwater. Processes 2023, 11, 721. [Google Scholar] [CrossRef]
  21. Kakaei, K.; Esrafili, M.D.; Ehsani, A. Graphene and Anticorrosive Properties. In Interface Science and Technology; Elsevier: Amsterdam, The Netherlands, 2019; pp. 303–337. [Google Scholar]
  22. Zhang, X.L.; Jiang, Z.H.; Yao, Z.P.; Song, Y.; Wu, Z.D. Effects of scan rate on the potentiodynamic polarization curve obtained to determine the Tafel slopes and corrosion current density. Corros. Sci. 2009, 51, 581–587. [Google Scholar] [CrossRef]
  23. Ahuir-Torres, J.I.; Gibbons, G.J.; West, G.; Das, A.; Kotadia, H.R. Understanding the corrosion behaviour of Al-Mg alloy fabricated using a Laser Powder Bed Fusion (L-PBF) Additive Manufacturing (AM) process. J. Alloys Compd. 2023, 969, 172300. [Google Scholar] [CrossRef]
  24. Lazanas, A.C.; Prodromidis, M.I. Electrochemical impedance spectroscopy—A tutorial. ACS Meas. Sci. Au 2023, 3, 162–193. [Google Scholar] [CrossRef] [PubMed]
  25. Ni, X.; Kong, D.; Wu, W.; Zhang, L.; Dong, C.; He, B.; Lu, L.; Wu, K.; Zhu, D. Corrosion behavior of 316L stainless steel fabricated by selective laser melting under different scanning speeds. J. Mater. Eng. Perform. 2018, 27, 3667–3677. [Google Scholar] [CrossRef]
  26. Li, Y.; Cai, J.M.; Guan, L.; Wang, G. pH-dependent electrochemical behaviour of Al3Mg2 in NaCl solution. Appl. Surf. Sci. 2019, 467, 619–633. [Google Scholar] [CrossRef]
  27. Jimenez-Morales, A.; Galvan, J.C.; Rodriguez, R.; De Damborenea, J.J. Electrochemical study of the corrosion behaviour of copper surfaces modified by nitrogen ion implantation. J. Appl. Electrochem. 1997, 27, 550–557. [Google Scholar] [CrossRef]
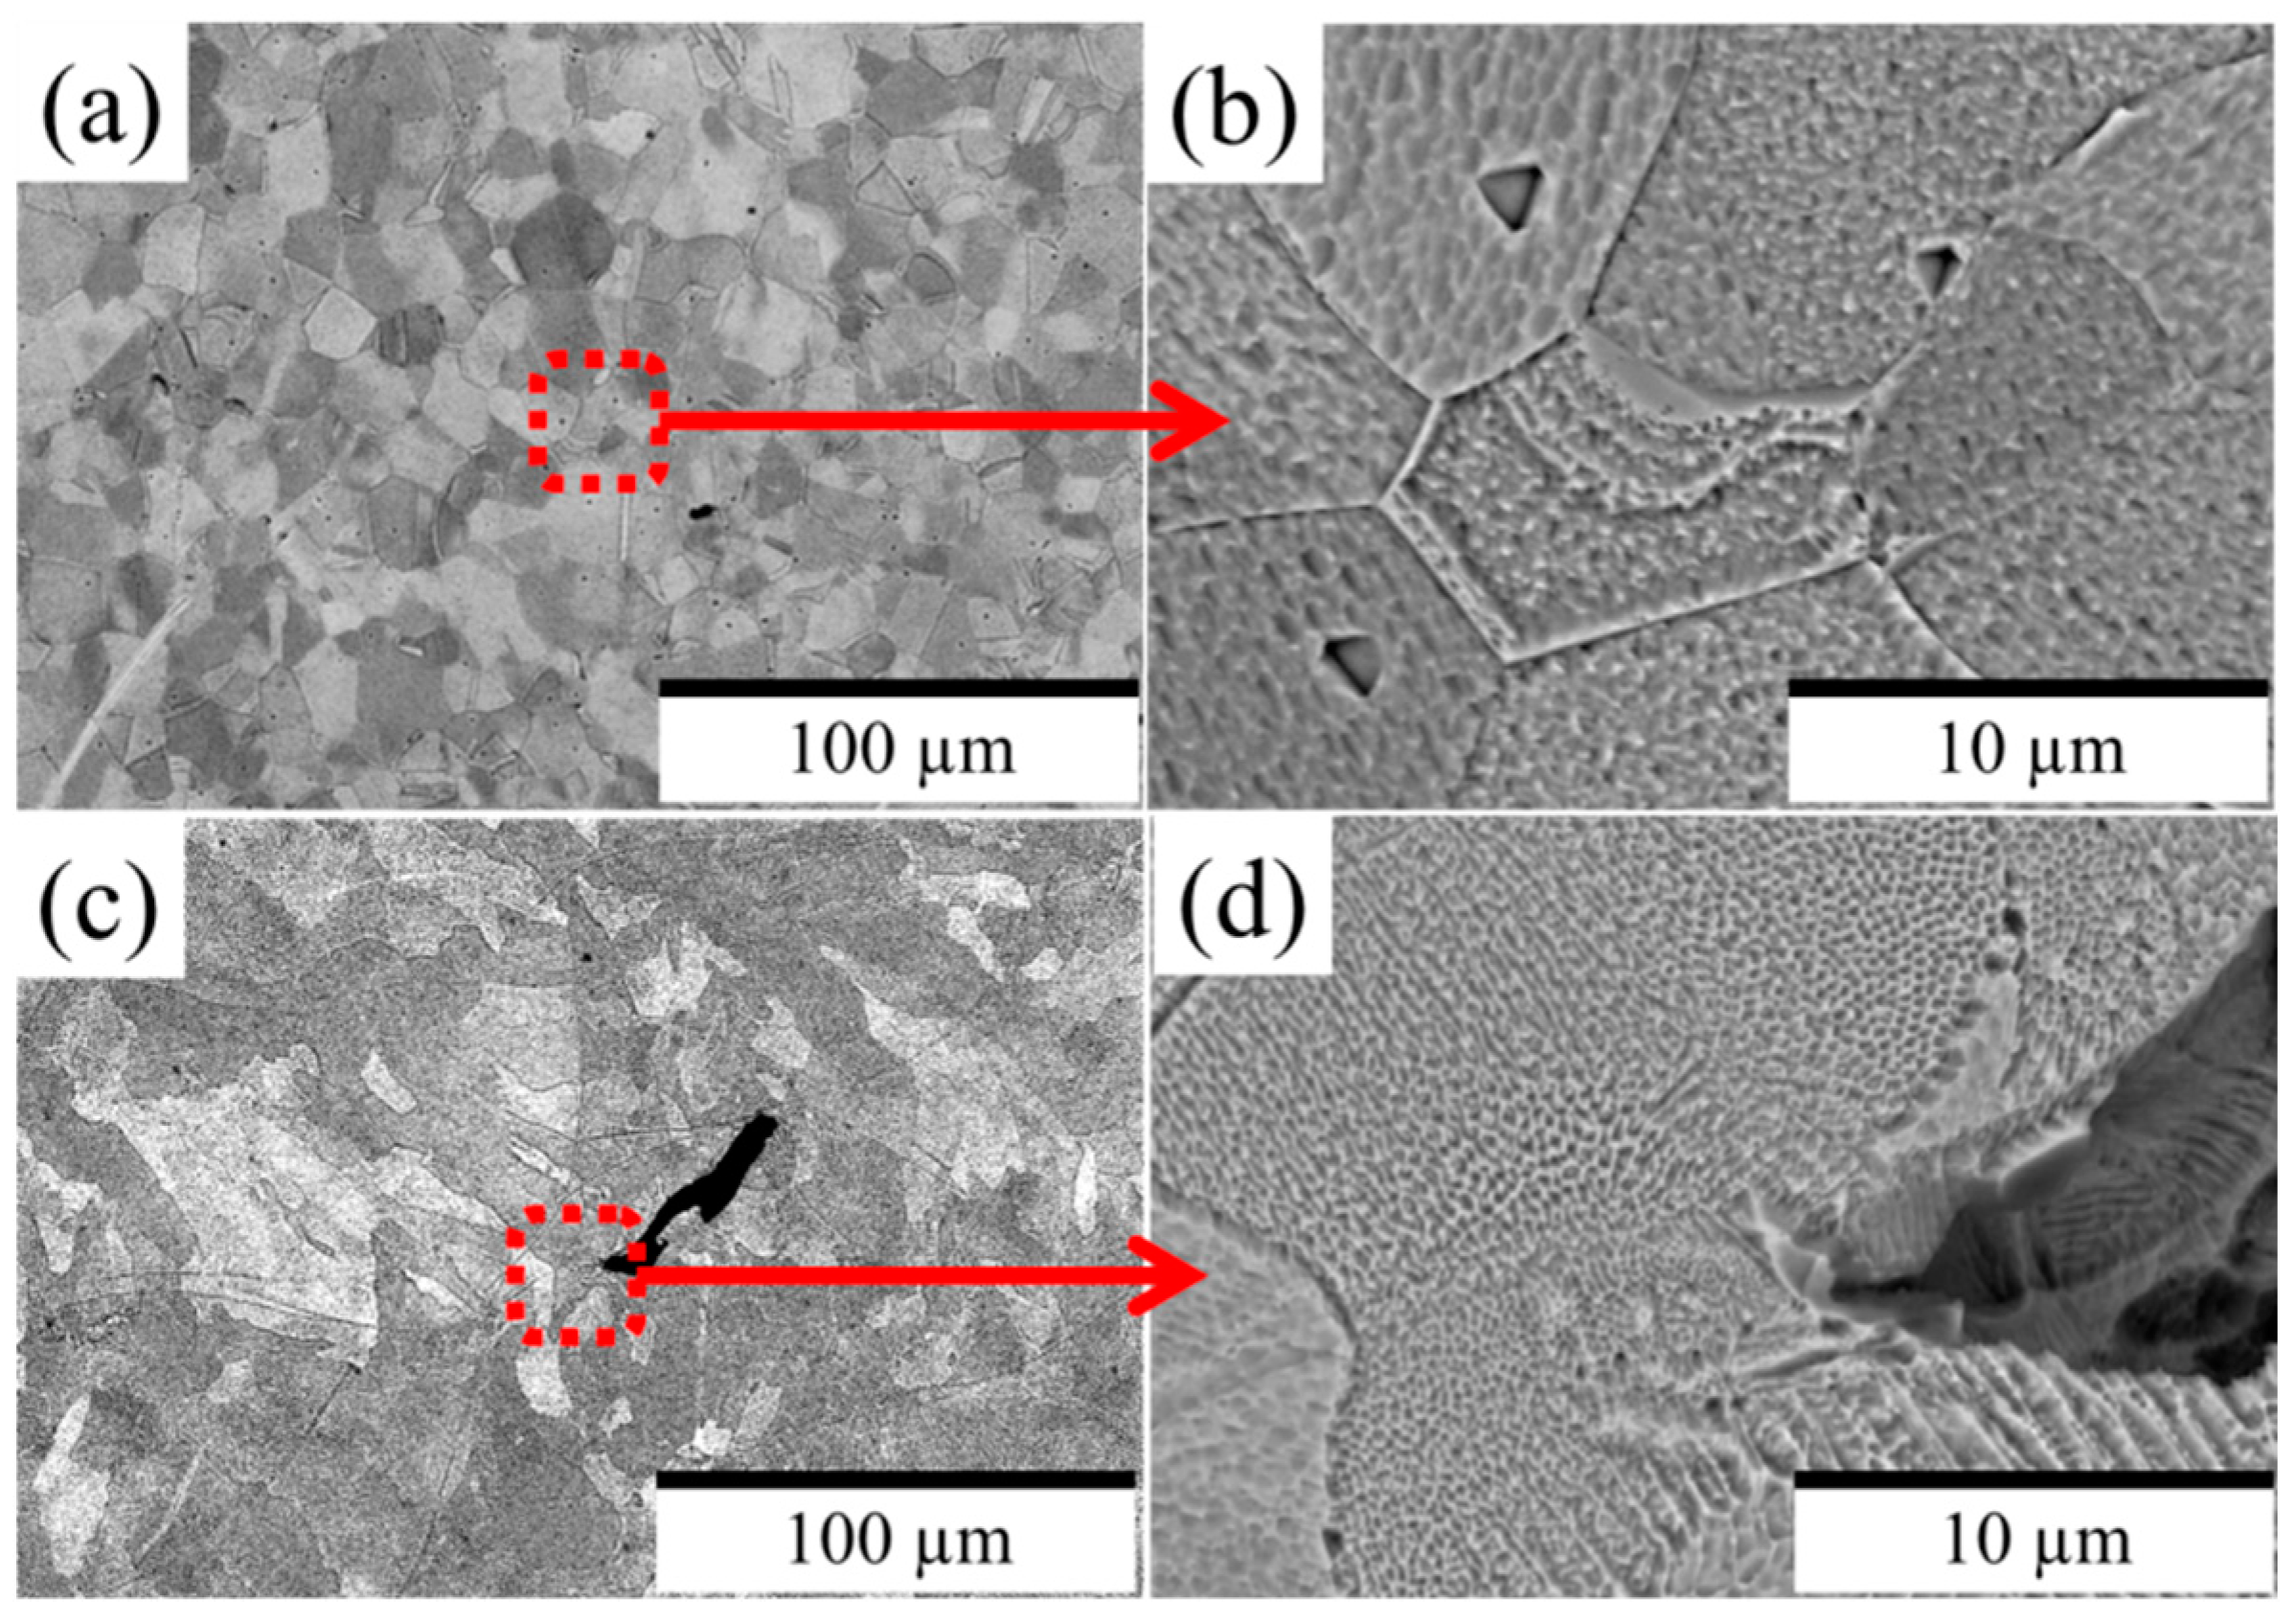
Figure 1. SEM images of the wrought sheet (a) and (b), and LPBF (c,d) 316L SS microstructure.
Applsci 14 07471 g001
Figure 2. EDS mapping of the wrought sheet (a) and LPBF (b) samples before the corrosion.
Applsci 14 07471 g002
Figure 3. AEN analyses of the wrought sheet and LPBF samples for 2 h of immersion in 0.6 M NaCl. OCP (a) and ZRA (b).
Applsci 14 07471 g003
Figure 4. PPC of the samples in 0.6 M NaCl.
Applsci 14 07471 g004
Figure 5. EIS analyses of the wrought sheet (a) and LPBF (b) 316L stainless steel samples in 0.6 M NaCl.
Applsci 14 07471 g005
Figure 6. Equivalent circuit for representing the corrosion mechanism evolution over time for the samples in 0.6 M NaCl.
Applsci 14 07471 g006
Figure 7. Corroded areas of the wrought sheet (a,b) and LPBF sample (c,d).
Applsci 14 07471 g007
Figure 8. EDS mapping of the corroded wrought (a) and LPBF (b) samples.
Applsci 14 07471 g008
Table 1. Corrosion features of the LPBF and commercial samples obtained with AEN.
Samples σ I  (nA/cm2) σ E  (mV) R n  (kΩ/cm2) I R . M . S  (nA/cm2) L . I .
Wrought664621300.55
LPBF40397640.97
Table 2. Sample corrosion characteristics of the PPC.
Sample I c o r r (nA/cm2) C . R . c o r r (µm/Year) I p a s s (µA/cm2) C . R . p a s s (µm/Year) β c (mV/A Decade) β a (mV/A Decade) R p (MΩ/cm2)
Wrought9.26070.6461.86019.403−0.0280.6931.253
LPBF10.90090.2300.7435.671−0.0290.0652.325
Table 3. Corrosion mechanism evolution features of the samples in 0.6 M from EIS.
SampleTime (h)Rs
(Ωcm−2)
CPEpass (µSsncm−2)ηpassRpass (Ωcm−2)CPEbared (µSsncm−2)ηbaredRbared (Ωcm−2)d (nm)χ2
(10−4)
Wrought22.01046.6800.920.225 × 1069.5100.903531 × 1030.3396.080
243.22022.0000.920.147 × 1064.4200.661750 × 1030.7184.310
483.07020.5000.930.065 × 1063.8740.582370 × 1030.7712.740
723.49019.7000.930.077 × 1063.6900.513030 × 1030.8024.190
962.88019.2000.920.064 × 1062.5000.612500 × 1030.8232.760
LPBF23.89021.4530.920.052 × 1062.7780.9332 × 1030.7373.528
242.652314.2500.570.867 × 10618.2500.95879 × 1030.0502.879
483.55415.5080.964.483 × 10687.6970.8737 × 1031.0205.829
723.61617.1850.974.980 × 106464.9000.708 × 1030.9208.608
963.09818.0500.944.997 × 106300.7930.76235 × 1030.8764.829
Disclaimer/Publisher’s Note: The statements, opinions and data contained in all publications are solely those of the individual author(s) and contributor(s) and not of MDPI and/or the editor(s). MDPI and/or the editor(s) disclaim responsibility for any injury to people or property resulting from any ideas, methods, instructions or products referred to in the content.