Article

Recovery of Saponins, Phenolic Compounds and Antioxidant Capacity from Curculigo orchioides Gaertn Rhizomes by Different Extraction Methods

1
Faculty of Chemical and Food Technology, Nong Lam University, Ho Chi Minh City 700000, Vietnam
2
Faculty of Chemical and Food Technology, Ho Chi Minh City University of Technology and Education, Ho Chi Minh City 700000, Vietnam
*
Author to whom correspondence should be addressed.
Appl. Sci. 2024, 14(17), 7535; https://doi.org/10.3390/app14177535
Submission received: 28 July 2024 / Revised: 12 August 2024 / Accepted: 21 August 2024 / Published: 26 August 2024

Abstract

:
This study aimed to investigate the effects of the solvent type, extraction time, extraction temperature and solvent-to-material ratio on the recovery of the total saponin content (TSC), the total phenolic content (TPC) and the antioxidant activity from the rhizomes of Curculigo orchioides Gaertn. The extraction efficiency of the bioactive compounds by ultrasound-assisted extraction (UAE) was also evaluated. Extraction with 80% ethanol achieved the highest extraction yields, and the optimal conditions for the extraction of TSC were 60 min, 57 °C and an 80 mL/g solvent-to-material ratio. The optimal conditions for the recovery of TPC were 178 min, 45 °C and a solvent-to-material ratio of 68 mL/g. The highest antioxidant activity of the extracts from Curculigo orchioides Gaertn rhizomes was obtained with the optimal conditions of 180 min, 40 °C and an 80 mL/g solvent-to-material ratio. The actual extraction yields obtained from the optimal conditions were 11.33 mg aescin equivalents (AE)/g dry weight (DW) for TSC, 23.58 mg gallic acid equivalents (GAE)/g DW for TPC and DPPH antioxidant activity of 133.45 µM Trolox equivalents (TE)/g DW. UAE using the same type and amount of solvent for only 10 min could result in comparable extraction yields of TSC, TPC and DPPH antioxidant activity to the 180 min conventional extraction process. These promising results suggest the potential for the development of effective extraction processes to recover bioactive compounds from Curculigo orchioides Gaertn rhizomes in practical production.

1. Introduction

Curculigo orchioides Gaertn is primarily distributed in Asian tropical and subtropical regions, including Southern China, Cambodia, Laos, the Philippines and Vietnam. This medicinal herb is called “Xian Mao” in China, “Tien Mao” in Vietnam and “Kali Musli” in India and has been utilized to promote physical strength and treat various ailments, such as back pain, enuresis and impotence [1,2,3]. The rhizomes of Curculigo orchioides Gaertn (COG) are renowned for their medicinal properties, attributed to the presence of various bioactive compounds. In a study conducted by Wang et al., (2013) [1], three phenolic glycoside compounds were isolated and identified from the rhizomes of COG, namely orcinol glucoside, orcinol-1-O-(6′-O-acetyl)-α-D-glucopyranoside and curculigoside. Recently, many studies have been conducted on uncovering bioactive compounds in COG rhizomes, such as polysaccharides, saponins, phenolics and terpenoids, along with their associated biological activity [2,3]. For example, a qualitative analysis of the phytochemicals of COG rhizomes in India indicated that saponin compounds and polyphenols were present in all petroleum ether, chloroform and ethanol extracts [4]. A later study by Nguyet et al. (2020) [5] found that COG rhizomes collected from Quang Ngai Province, Vietnam contained a total of 78.48 mg oleanolic acid equivalents/g of TSC and 196.24 mg GAE/g of TPC. Consequently, the COG rhizome is considered a promising medicinal source due to its pharmacological properties [6].
For the recovery of bioactive compounds from plant sources, a number of studies have been conducted using a variety of methods, like Soxhlet extraction, maceration and distillation. In addition, many studies have incorporated the use of advanced techniques such as microwave-assisted extraction (MAE), ultrasound-assisted extraction (UAE), enzyme-assisted extraction (EAE) and pulsed electric field stimulation to reduce the extraction time and solvent consumption while simultaneously enhancing the recovery efficiency of the desired bioactive compounds [7]. In addition to the great variations in the extraction efficiency achieved with different extraction techniques, the use of suitable solvents and technical parameters like the extraction time, temperature and amount of solvent are important factors determining the recovery of the desired compounds and the biological activity of the plant materials [7,8].
According to the updated literature, there is limited scientific information regarding the effective recovery of beneficial compounds from COG rhizomes. Currently, the most common methods of obtaining medicinal components from COG rhizomes include long-term soaking in alcohol or decoctions for several hours, which is traditionally applied for the preparation of Chinese herbal medicines [6]. These extraction methods usually cause the significant loss of valuable compounds due to degradation resulting from the long-term exposure to high temperatures, oxygen and light. This consequently reduces the efficiency of the obtained medicinal extracts [7]. As a result, this valuable medicinal plant remains underutilized and has not been commercialized. Hence, this research aimed to determine the optimal extraction parameters for the recovery of beneficial bioactive compounds from COG rhizomes. COG rhizomes were subjected to extraction using various solvents and different extraction conditions using the maceration technique to investigate the recovery of the total phenolic content (TPC), total saponin content (TSC) and DPPH antioxidant activity. The identified optimal conditions were further applied for ultrasound-assisted extraction in order to improve the extraction efficiency.

2. Materials and Methods

2.1. Materials

The rhizomes of Curculigo orchioides Gaertn (3 years old) were purchased from Lao Cai Province, Vietnam. The taxonomic identity of the COG rhizomes was confirmed by the Research Center of Ginseng and Medicinal Materials, National Institute of Medicinal Materials, Ho Chi Minh City, Vietnam. After purchasing, the rhizomes were thoroughly cleaned, sliced and dried to moisture content of 8.0 ± 0.5%. The dried material was then finely ground, tightly packed in polypropylene bags and stored at −18 °C until used for experiments.

2.2. Chemicals

Ethanol absolute (≥99.9%), acetone (99.5%), ethyl acetate (≥99.5%), methanol (≥99.9%), sulfuric acid (98%) and vanillin (97%) were purchased from Merck PTE Ltd. (Science Park Drive, Singapore). Folin and Ciocalteu’s phenol reagent (2N), DPPH (2,2-diphenyl-1-picrylhydrazyl) (97%), Trolox ((S)-(-)-6-hydroxy-2,5,7,8 tetramethylchroman-2-carboxylic acid) (97%), aescin (≥95%) and gallic acid (≥98%) were purchased from Sigma-Aldrich Pty. Ltd. (Pasir Panjang Rd, Singapore).

2.3. Experimental Design

2.3.1. Single-Factor Investigation Experiments

Single-factor experiments were carried out to determine the most suitable solvent and optimal ranges of technological parameters, including the extraction time, extraction temperature and solvent-to-material ratio, in order to apply them for the further optimization process.
Five grams of dried COG rhizome powder were extracted using 100 mL of different solvents, including acetone, ethyl acetate, 96% ethanol, 80% ethanol and distilled water, under ambient conditions for 120 min. After extraction, the mixture was filtered through 0.45 µm filter paper and the obtained extracts were subsequently diluted to appropriate concentrations for the analysis of the TPC, TSC and antioxidant activity.
The effects of the extraction time (30–240 min), extraction temperature (30–70 °C) and solvent-to-material ratio (10–80 mL/g) on the recovery yields of the TPC, TSC and antioxidant activity were then investigated using the selected solvent and the above procedure.
According to the literature on the extraction of bioactive compounds from plant materials, the selected technological parameters are considered crucial factors significantly affecting the recovery of the compounds [7]. In addition, the investigated ranges of the extraction conditions were selected based on the suitable ranges for the extraction of TSC and TPC, as reported in previously published studies [8,9].

2.3.2. Optimization of Extraction Conditions Using Response Surface Methodology (RSM)

The Box–Behnken design using the RSM was applied for the optimization process with 15 combinations of the 3 input factors, namely the extraction time (X1), extraction temperature (X2) and solvent-to-material ratio (X3), as shown in Table 1. The ranges of the input variables (60–120 min, 40–60 °C and 40–80 mL/g for the extraction time, temperature and solvent-to-material ratio, respectively) used to optimize the design were selected based on the results of the above single-factor experiments.
The yields of TPC, TSC and DPPH antioxidant activity are expressed as functions of the investigated variables using second-order polynomials as follows:
Y i = β o + β 1 X 1 + β 2 X 2 + β 3 X 3 + β 12 X 1 X 2 + β 13 X 1 X 3 + β 23 X 2 X 3 + β 11 X 1 2 + β 22 X 2 2 + β 33 X 3 2
where Yi is the independent response; Xi is the independent variable (extraction time, temperature or solvent-to-material ratio); and βo, βi, βij and βii are the regression coefficients of the intercept, linear, interaction and quadratic terms, respectively.

2.3.3. Ultrasound-Assisted Extraction (UAE)

Dried COG rhizome powder (5 g) and 400 mL of 80% ethanol were mixed in a glass beaker, which was placed in a water bath to control the temperature at 40 °C during the extraction process. An ultrasonic probe (UP200St, Hielscher Ultrasonics, Teltow, Germany) was immersed into the mixture and the extraction was conducted with an ultrasonic frequency of 30 kHz and a power output of 200 W with different extraction periods. The obtained extraction mixture was finally filtered through 0.45 µm filter paper and diluted to analyze the TPC, TSC and DPPH antioxidant activity.

2.4. Analytical Methods

The moisture content of the samples was analyzed by drying them to a constant weight at 105 °C [10].
The total saponin content was determined using the colorimetric absorbance method [11]. The extract (0.5 mL) was transferred into a test tube with 0.5 mL of vanillin solution in methanol (8%) and 5 mL of concentrated sulfuric acid solution (72%). The mixture was heated and remained at 70 °C for 10 min before being cooled rapidly to room temperature using ice water. The absorbance of the reacted solution was measured using a UV–Vis spectrophotometer at a wavelength of 550 nm. The total saponin content in the extract was calculated based on the standard absorbance curve of aescin at various concentrations. The recovered saponin content was expressed as mg aescin equivalents per gram dry weight (DW) of material (mg AE/g DW).
The determination of the total polyphenol content was performed using the Folin–Ciocalteu method, as described by Cicco et al. (2009) [12], with some modifications. First, 0.5 mL of extract and 2.5 mL of Folin–Ciocalteu reagent (10%) were well mixed in a test tube. The mixture was then left at room temperature for 5 min and then 2 mL of 7.5% (w/v) Na2CO3 was added. The test tube was kept in the dark for 90 min at room temperature for reaction. The absorbance of the solution was measured using a UV–Vis spectrophotometer at 765 nm. The total phenolic content was calculated and expressed as milligrams of gallic acid equivalents (mg GAE/g DW) based on the absorbance curve of a standard gallic acid solution.
The assessment of the antioxidant activity in this study was conducted by determining the ability to scavenge free radicals using the DPPH (2,2-diphenyl-1-picrylhydrazyl) assay, following the method outlined by Thaipong et al. (2006) [13], with some modifications. A volume of 0.5 mL of extract and 2.5 mL of DPPH working solution were well mixed in a test tube and left for reaction in the dark for 120 min. The absorbance of the sample was measured using a UV–Vis spectrophotometer at 515 nm. The antioxidant activity of each extract was calculated based on its absorbance and the standard curve of Trolox. The recovered antioxidant activity was expressed as µM Trolox equivalents per gram dry weight of material (µM TE/g DW).

2.5. Statistical Analysis

All experiments were conducted in triplicate and the experimental results are presented as the mean value ± standard deviation. The statistical comparisons of the significant differences (p < 0.05) among the results obtained from different experimental treatments were tested using an analysis of variance and the LSD post hoc test. JMP 13.0 (SAS, Cary, NC, USA) was used to perform the experimental design of the optimization processes and the statistical analysis of the RSM models.

3. Results and Discussion

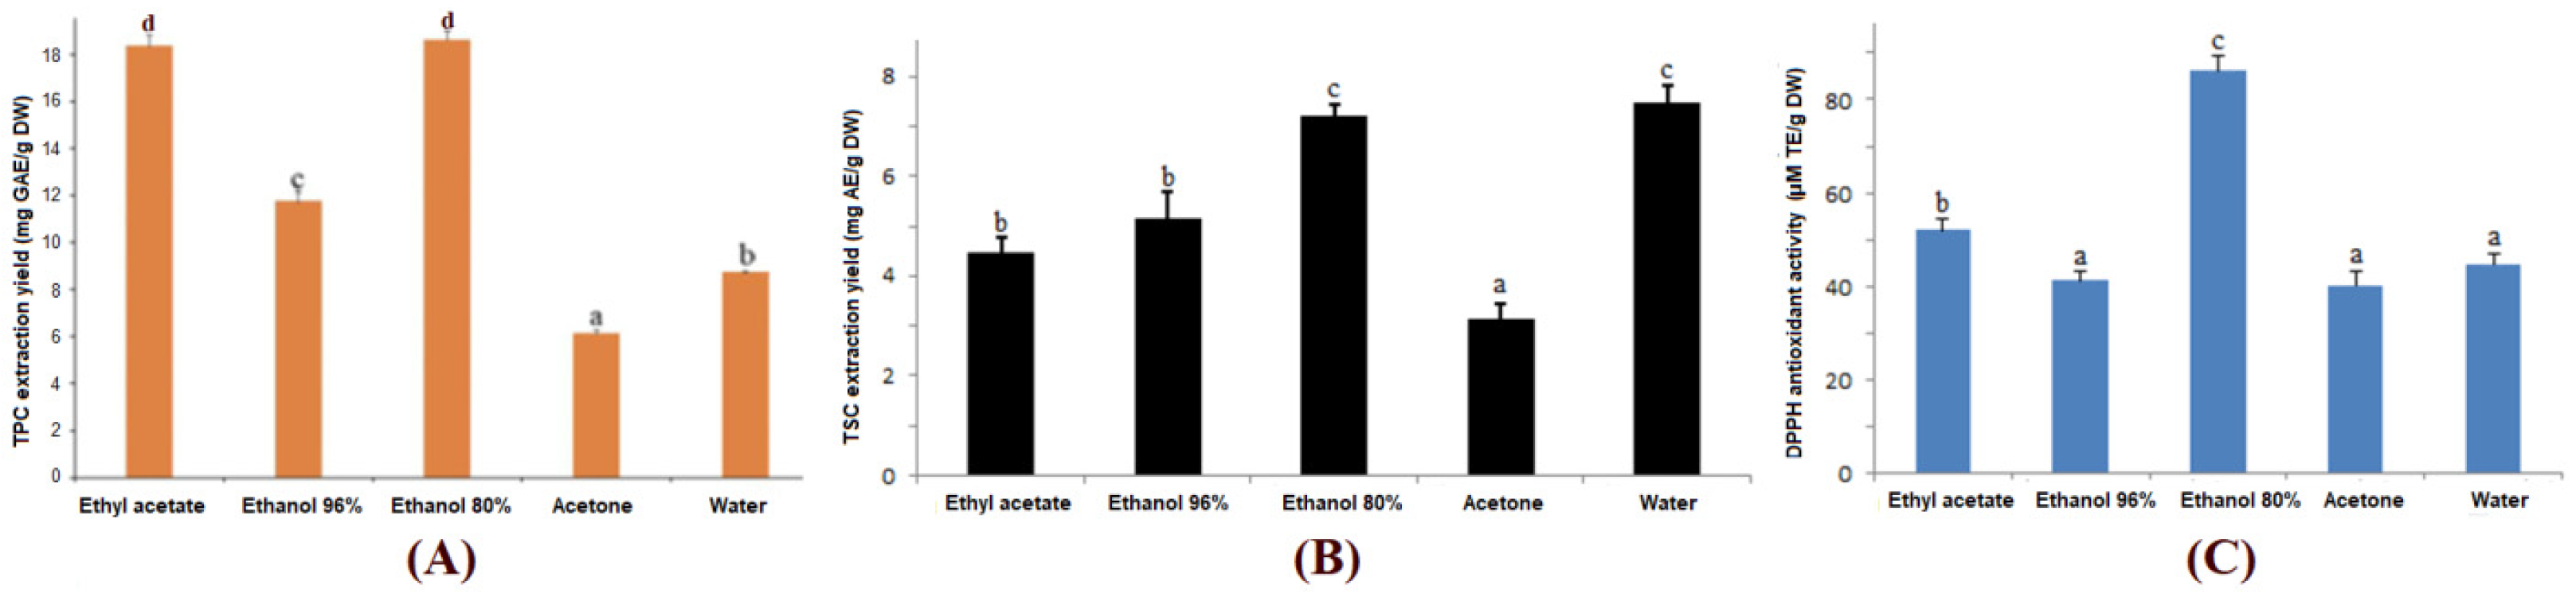
3.1. Effects of Solvents on Extraction Yield

The extraction process of the desired compounds from plant materials can be influenced by several factors, including the nature of the raw material, the properties of the desired compounds, the extraction methods, the properties of the solvents and other process conditions, such as the temperature, time and pH. Under similar temperatures and extraction times, the selection of an appropriate solvent is considered as the crucial factor affecting the recovery of the desired compounds [7]. In general, the selection of an appropriate solvent to extract a target group of compounds from a material principally depends on the solubility of these compounds relative to the solvent’s polarity [8]. However, with extraction for further applications in food or pharmaceuticals, the choice of an appropriate solvent is limited by the toxicity of the solvents [14]. Therefore, this study only focused on investigating solvents that pose minimal health risks while still ensuring diversity in solvent polarity.
Figure 1 clearly demonstrates significant differences in the recovery of the TPC, TSC and DPPH antioxidant activity among the three extracts obtained from different solvents including ethyl acetate, ethanol 96%, ethanol 80%, acetone and distilled water. While ethyl acetate and ethanol 80% resulted in the highest TPC yields, the greatest recovery of TSC was attributed to the water and 80% ethanol extracts. The extraction of chemical compounds from plant materials depends on their chemical nature, the polarity of the solvent and other factors. Solvents like water and acetone are inefficient in extracting total polyphenols from plants because polyphenols are often bound to other biopolymers, such as proteins and polysaccharides. The difference in the polyphenol recovery efficiency between 80% ethanol and 96% ethanol in the study aligns with previous findings indicating that diluted ethanol is more effective than absolute alcohol in extracting phenolic compounds due to its ability to dissolve both polar and non-polar compounds [15,16,17]. Previous studies have indicated that most saponins are polar compounds, so the use of highly polarized solvents such as ethanol and distilled water could achieve higher extraction efficiency compared to other solvents [6,9,18].
The evaluation of the antioxidant activity revealed that water, acetone and ethanol 96% were the extracts with the lowest DPPH radical scavenging activity, and the ethanol 80% extract possessed significantly higher antioxidant activity compared to the others. The strong antioxidant activity of the 80% ethanol extract can be explained by the excellent extraction capabilities of this solvent for both saponins and phenolic compounds. These groups of compounds have been proven to be the main contributors to the antioxidant capacity of plant extracts [17,19]. Several previous studies have also suggested that combining solvents or using diluted solvents leads to higher extraction efficiency and antioxidant activity because ethanol cannot extract all compounds in plants. Thus, the use of diluted ethanol can improve the extraction efficiency of water-soluble antioxidant compounds [20]. In addition, ethanol has been commonly used in the extraction of natural compounds because it is considered a low-risk solvent for human health, and its reasonable cost makes it suitable for applications in industrial production [17]. Based on the obtained results, 80% ethanol was selected as the solvent for further experiments to simultaneously extract the TPC, TSC and antioxidant activity from COG rhizomes.

3.2. Single-Factor Investigation of Extraction Conditions

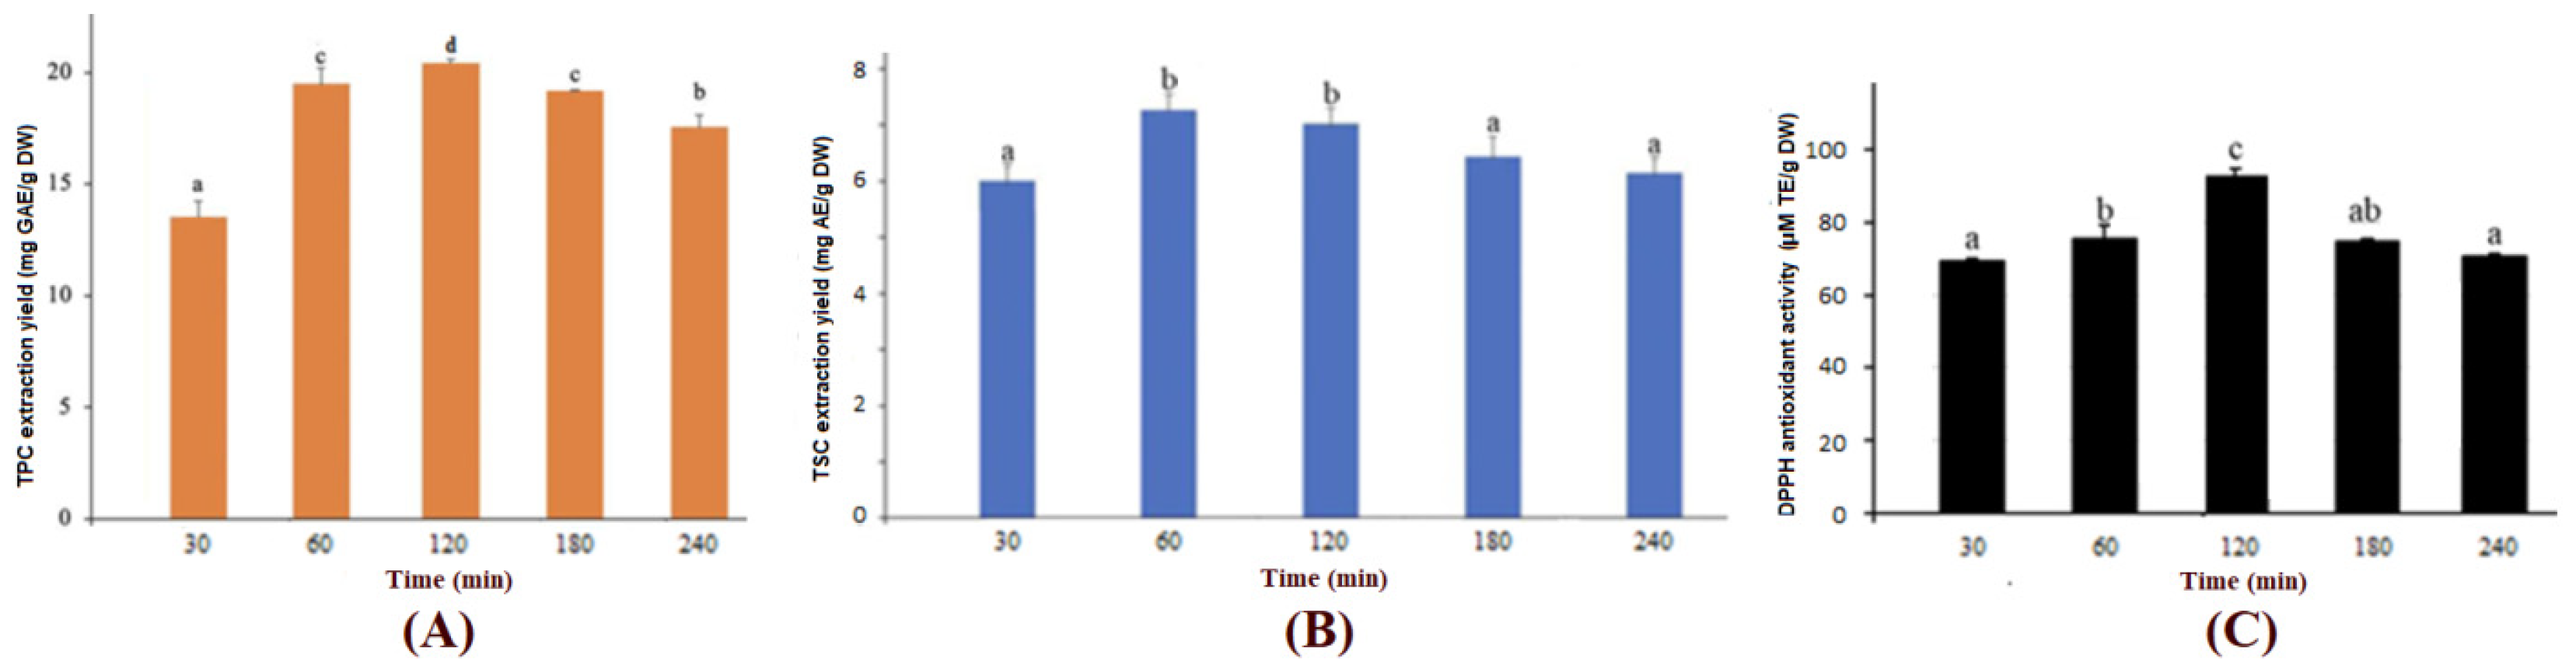
3.2.1. Effects of Extraction Time on Extraction Yield

The efficiency of TPC recovery from different COG rhizome extracts varied with the different extraction durations (Figure 2A). The highest polyphenol recovery efficiency was achieved after 120 min of extraction and tended to decrease when the process was extended. A similar trend was also observed (Figure 2B) for the extraction yield of TSC, but the peak of TSC recovery was reached earlier (60 min of extraction). This result indicates that the saponin compounds in COG rhizomes can diffuse into the solvent faster than the phenolic compounds. The extension of the extraction time to 120 min did not significantly increase the amount of extracted TSC and a longer time even led to decreases in the TSC extraction yield instead. Therefore, it is recommended that the process should not be extended beyond 180 min for the extraction of TSC from COG rhizomes.
The literature on the extraction of bioactive compounds has claimed that the appropriate extraction time to achieve the efficient recovery of phenolic compounds depends on the nature of the raw material and the solvent used [14,21]. For example, Durling et al. (2007) [22] conducted a study on the extraction of Cladina stellaris and found that shorter extraction times resulted in the better recovery of phenolic compounds. In addition, other studies have also reported that prolonging the extraction time may increase the exposure of the sample to environmental factors such as oxygen and light, which leads to lower extraction efficiency [23,24].
Figure 2C shows that the antioxidant activity of the COG rhizome extract tended to increase gradually from 30 to 120 min of extraction and decreased thereafter. Previous studies on the extraction of antioxidants from plants have also concluded that soaking the samples for 90 to 180 min typically yields the highest antioxidant activity in the extracts [17,25]. During extraction, the diffusion time of solutes from the solid phase (material) into the liquid phase (solvent) is one of the crucial factors, so a very short extraction time is often insufficient for dissolution. According to Fick’s second law of diffusion, the diffusion of substances into a solvent gradually reaches equilibrium after a certain period [26,27], so extraction beyond the optimal time can lead to the degradation of bioactive compounds due to the effects of oxygen, light and the temperature [27]. For example, a study investigating the stability of polyphenols in plant extracts under thermal and photo-oxidation treatments found that polyphenols were relatively thermal stable (degradation of 15% to 30% after 240 min of exposure to a temperature from 60 to 100 °C) [28]. However, these compounds were very sensitive to UV-C exposure, with 50% degradation of gallic acid and 83% loss of catechin after 180 min of treatment, which resulted in a significant reduction in the DPPH radical scavenging activity correspondingly. The extraction of Polyscias fruticosa roots also revealed that although higher total soluble solid content could be achieved until 120 min of extraction, the TSS recovery and DPPH antioxidant activity of the extract reached the highest values at 90 min and remained unchanged during extended extraction periods [29].
Thus, an extraction time ranging from 60 to 120 min is recommended for the recovery of all three desired outputs, namely the TPC, TSC and DPPH antioxidant activity, from COG rhizomes.

3.2.2. Effects of Extraction Temperature on Extraction Yield

In conventional extraction techniques, it is generally observed that increasing the extraction temperature within the range of 20 to 80 °C enhances the recovery efficiency of plant compounds, particularly polyphenols [8,30]. Because the boiling point of ethanol is 78.3 °C, the investigated temperature in this study was limited to 70 °C to avoid the excessive evaporation of ethanol, which may cause unexpected issues during extraction [31].
Figure 3A reveals significant variations in the TPC yield obtained at 30, 40 and 50 °C but no significant differences were found between the temperatures of 50 and 60 °C. There are two mechanisms that may be involved in the higher diffusion rate of phenolic compounds at elevated temperatures. Firstly, the bonds between lignins and various phenolic acids are cleaved, thereby releasing phenolic compounds. Secondly, lignins may undergo self-decomposition at high temperatures, leading to the liberation of a greater number of phenolic compounds [32]. The data in Figure 3B show that the TSC extracted from COG rhizomes also reached the highest level at the temperature of 50 °C but then decreased when higher extraction temperatures were applied. Theoretically, elevated temperatures can soften plant tissue and weaken the bonds between various plant components, such as phenol–protein or phenol–polysaccharide linkages, facilitating the release of phytochemicals into the liquid phase. Furthermore, the viscosity and surface tension of the solvent decrease at higher temperatures, creating favorable conditions for enhanced solvent interactions with the solid sample [18]. However, excessive heating can accelerate the oxidation and degradation of the desired bioactive compounds. Moreover, unwanted components such as proteins and polysaccharides from the raw material may penetrate into the solvent at high temperatures and form gel networks, which can hinder the extraction process of the desired compounds [33,34].
A similar changing trend in the DPPH antioxidant activity to those of the TPC and TSC was observed, as shown in Figure 3C, where the peak of the antioxidant activity belonged to the extract obtained at 50 °C. A previous study on COG rhizomes reported that polyphenol compounds play a major role in contributing to the antioxidant activity of COG rhizomes [35]. The literature shows that the temperature can affect reactions involving antioxidants or may alter their structures and properties [36], and various studies have also recommended that temperatures above 70 °C should not be used to extract bioactive compounds from plant materials like grape pomace [27], Clinacanthus nutans Lindau leaves [34] and Polyscias fruticosa roots [29] as they may lead to a reduction in the antioxidant activity of the obtained extracts.

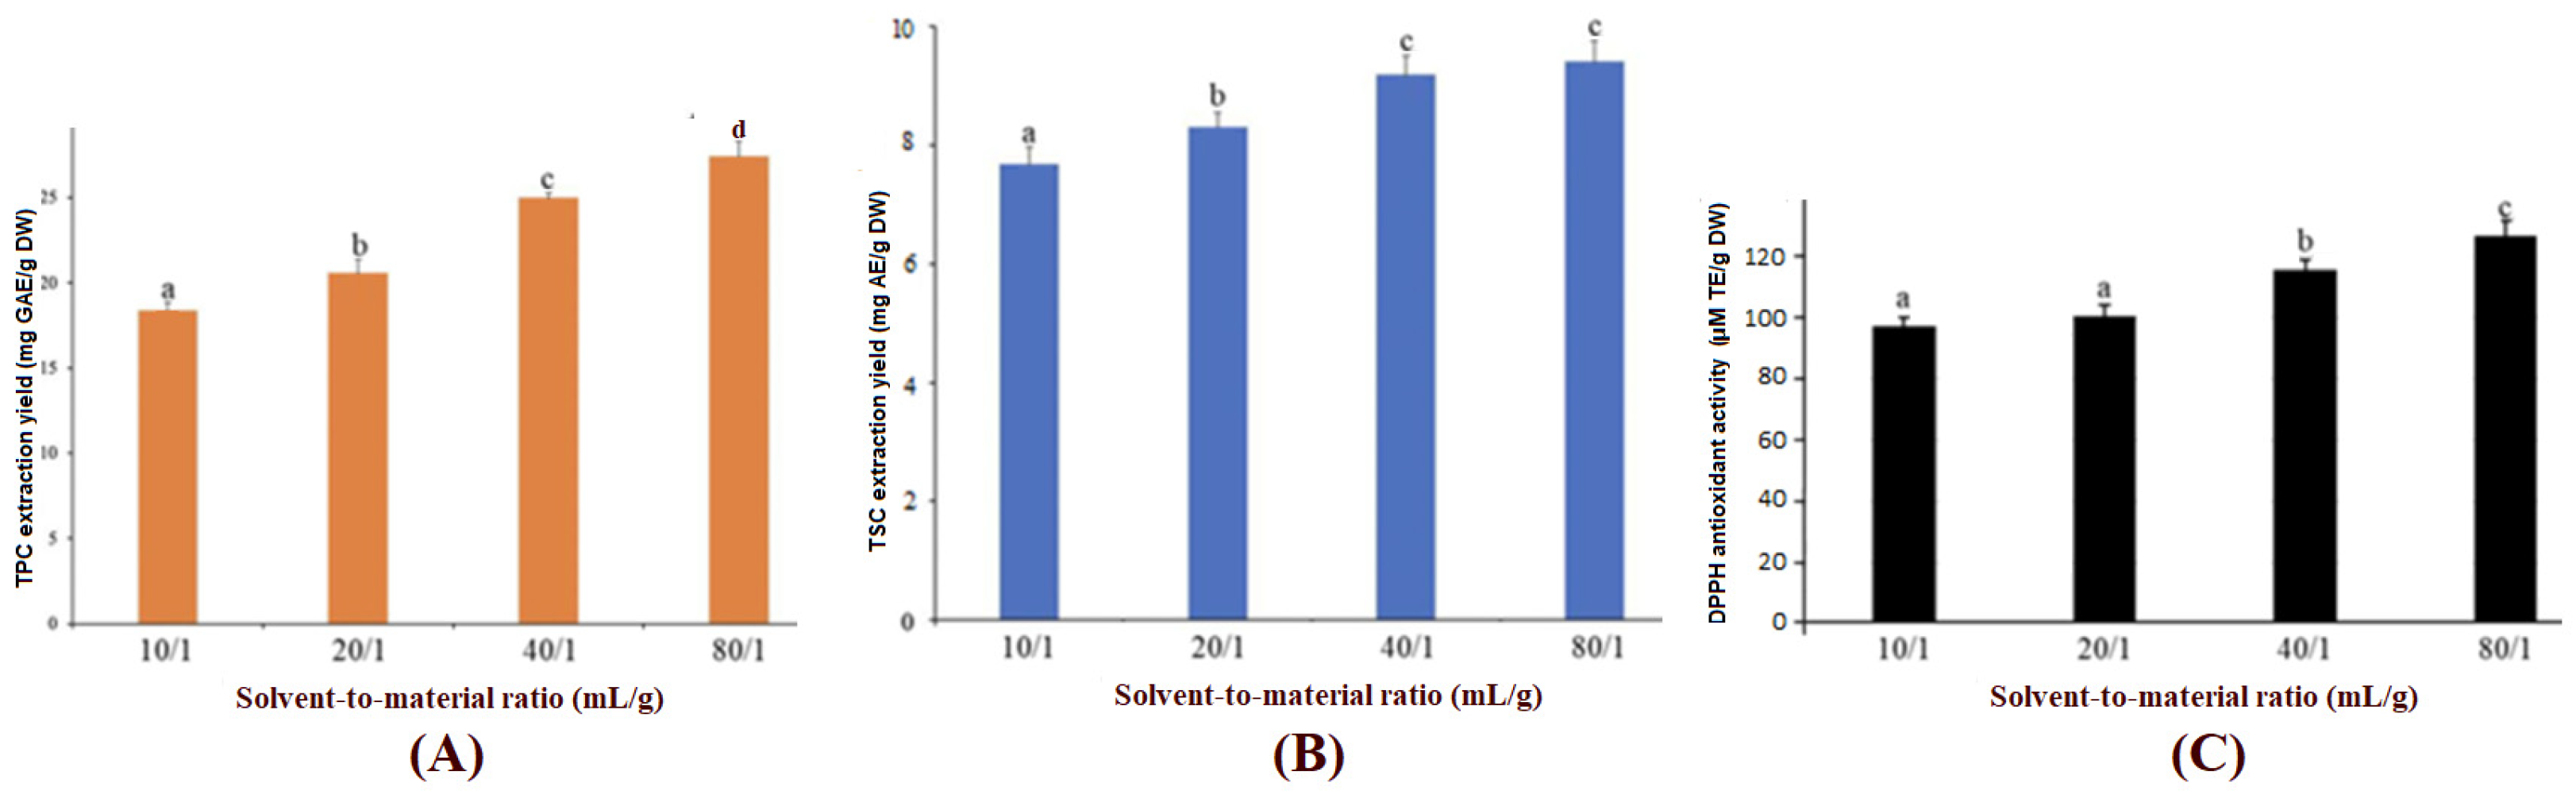
3.2.3. Influence of Solvent-to-Material Ratio on Extraction Yields of TPC, TSC and Antioxidant Activity

Figure 4A,B show an increasing trend in the TPC and TSC with an increasing solvent-to-material ratio, respectively. This trend is predictable because, according to the diffusion law, increasing the amount of solvent enhances the concentration gradient of the solutes, thereby accelerating the diffusion rate of soluble compounds from the material into the solvent. Although the TSC yield was not significantly improved (p < 0.05) from the ratios of 40/1 to 80/1 (mL/g), the yield of TPC continued to rise at the ratio of 80/1 (mL/g). This continuous increase in the TPC may have been the main factor contributing to the rise in the DPPH antioxidant activity (Figure 4C) when the solvent-to-material ratio was elevated to 80/1 (mL/g).
A recent study by Chuyen (2023) [29] concluded that a solvent-to-material ratio of 40/1 (mL/g) was the optimal ratio for the recovery of TSC from Polyscias fruticosa roots because no significant increase in recovery efficiency was observed when the solvent volume exceeded this ratio. Practically, the extraction yields of compounds cannot proportionally rise with higher solvent-to-material ratios and reach the maximum value at a certain ratio at which the concentration of solutes in the material is limited and an excessive amount of solvent may hinder the diffusion rate [8]. This result indicates that using excessive solvent to extract bioactive compounds may not yield significant recovery efficiency and instead increases the costs associated with the used solvent and the energy required to remove the solvent from the extract in the subsequent stages during the production of products from the plant extracts.

3.3. Optimization of Extraction Conditions Using Response Surface Methodology

Based on the results obtained from the single-factor experiments, the optimal ranges for the extraction time (X1) from 60 to 180 min, the extraction temperature (X2) from 40 to 60 °C and the solvent-to-material ratio (X3) from 40/1 to 80/1 (mL/g) were selected and applied for the optimization process using the response surface methodology (RSM) combined with the Box–Behnken model.

3.3.1. Fitting Models for Prediction of TPC Extraction Yield (Y1), TSC Extraction Yield (Y2) and DPPH Antioxidant Activity (Y3)

The extraction yields of the TPC (Y1), TSC (Y2) and DPPH antioxidant activity (Y3) of the experimental runs are presented in Table 2.
The results in Table 2 show a significant variation in the extraction yields of the TPC, TSC and DPPH antioxidant activity from the different experimental runs. Figure 5 illustrates the correlations between the actual values obtained from the experiments and the predicted values generated from the models. The points lying within the two boundary curves and being close to the bisector line in Figure 5 indicate strong consistency between the actual and predicted values for most of the experimental runs. The statistical analysis also shows very high correlation coefficients (R2) between the actual and predicted values of the TPC, TSC and DPPH antioxidant activity (0.95, 0.92 and 0.91, respectively). Further statistical analysis of the model’s fit indicates that the p-values for the lack of fit of all prediction models were greater than 0.05 (PLack of Fit = 0.322, 0.599 and 0.151 for the models of TPC, TSC and antioxidant activity, respectively); hence, the established models were confirmed to be suitable to predict the output responses.
The predicted extraction yields of TPC, TSC and DPPH antioxidant activity from COG rhizomes as determined by the optimization models can be calculated according to the following regression equations:
Y1 = −57.29625 + 0.1353 × X1 + 1.1562 × X2 + 1.2885 × X3 − 0.001042 × X1X2 + 0.001373 × X1X3 − 0.0038375 × X2X3
− 0.000518 × X12 − 0.007908 × X22 − 0.009996 × X32
Y2 = −14.505 + 0.0093 × X1 + 0.6742 × X2 + 0.1042 × X3 − 0.000171 × X1X2 − 0.000089 × X1X3 + 0.002612 × X2X3 +
0.000018 × X12 − 0.007629 × X22 − 0.001257 × X32
Y3 = 528.8575 − 0.0171 × X1 − 10.7325 × X2 − 6.3518 × X3 − 0.008329 × X1X2 + 0.006352 × X1X3 + 0.020352 × X2X3 +
0.000614 × X12 + 0.094392 × X22 + 0.044185 × X32
Here, Y1 is the extraction yield of the total phenolic content (TPC), Y2 is the extraction yield of the total saponin content (TSC) and Y3 is the DPPH antioxidant capacity of the obtained extracts; X1 is the extraction time (minute), X2 is the extraction temperature (°C) and X3 is the solvent-to-material ratio (mL/g).

3.3.2. Statistical Analysis of Individual and Interacting Impacts of Technological Factors on Output Responses

Table 3 shows the individual effects of the input factors and their combined impacts on the yields of the TPC, TSC and DPPH antioxidant activity based on the statistical analysis of the estimated coefficients in the second-order regression equations. The effects of a single factor or the interaction between any two input factors on the output responses are considered as proportional influences if the corresponding coefficients are positive; conversely, a negative coefficient indicates an adverse effect of the technological factors on the desired outputs. In addition, the smaller the p-value, the greater the impact of the input factor, which is considered significant when the p-value is less than 0.05.
Based on the statistical analysis in Table 3, most of the individual effects and combined effects of the input variables on the TPC recovery yield (Y1) were statistically significant (p < 0.05), with the exception of the individual effect of temperature (X2) and the two combined effects of X1X2 and X2X3. Among the investigated factors, the effect of the extraction time on the polyphenol extraction efficiency was the greatest (p = 0.0027), followed by the effect of the solvent/material ratio (p = 0.0398) and, finally, the temperature (p = 0.8302).
Regarding the statistical analysis of the estimated coefficients in the model predicting the TSC yield (Y2), the solvent-to-material ratio had the greatest impact on the TSC yield, followed by the extraction temperature and, finally, the extraction time. Only the solvent-to-material ratio (X3) showed a statistically significant impact on the TSC yield, and all interactive and quadratic effects of the factors on the TSC yield were not statistically significant (p > 0.05). In addition, the positive coefficients of the extraction temperature and solvent-to-material ratio suggest that the TSC yield tended to be increased when a higher extraction temperature and solvent-to-material ratio were applied.
Similar to the effects on the TPC and TSC yields, the solvent-to-material ratio (X3) also contributed the highest impact on the DPPH antioxidant activity (Y3) of the obtained extracts from the COG rhizomes (p = 0.0082). The extraction temperature (X2) also showed a statistically significant effect (p = 0.0259) on the DPPH antioxidant activity but that of the extraction time was not significant (p = 0.1576). The negative coefficient of X2 indicates that the obtained antioxidant activity decreases as the extraction temperature increases within the range of 40–60 °C. Conversely, the antioxidant activity increases along with a larger used amount of the ethanol solvent.
The interactive influences of the input factors on the desired responses are also visualized in the response surface plots in Figure 6. The plots in Figure 6A1,A2 show that the TPC extraction efficiency increases with a longer extraction time and higher solvent-to-material ratio but the TPC shows a downward trend with the rise in the temperature. The changing trends in the TPC yield in the response surface plots are consistent with the values of the influence coefficients and the corresponding combined effects of the technological factors analyzed in Table 3.
Figure 6B1 shows that the TSC yield reached the highest level (over 9.5 mg AE/g DW) in the temperature range of 50–58 °C combined with an extraction time of 60–110 min. However, further extending the extraction time caused a decrease in the recovery of TSC. The clearly increasing trend of the TSC yield with the increase in the solvent-to-material ratio observed in Figure 6B2 confirms the significant impact of this parameter, as analyzed in Table 3.
Similar to the plots for the TSC, it can be observed that the obtained antioxidant activity was higher as the solvent-to-material ratio increased and the temperature decreased. The upward curves, along with the increase in time and the solvent-to-material ratio, clearly demonstrate the positive relationship between the antioxidant activity and these factors, while the inverse relationship between the temperature and DPPH antioxidant activity is illustrated by the downward curves. The graphs clearly show the optimal values for the extraction conditions: an extraction time of 180 min, a temperature of 40 °C and a solvent-to-material ratio of 80 mL/g.

3.3.3. Verification of Optimal Values through Experimental Validation

Based on the established optimization models, the optimal values of the extraction conditions for extraction were determined as 178 min, 45 °C and 68 mL/g for TPC; 60 min, 57 °C and 80 mL/g for TSC; and 180 min, 40 °C and 80 mL/g for the DPPH antioxidant activity. These optimal values were validated through practical experiments and the obtained experimental results are presented in Table 4.
The validation data indicate that, after extraction under the optimal conditions for saponins (60 min, 57 °C with a ratio of 80 mL/g), the actual recovery yield of TSC was 11.33 mg AE/g DW. Under practical extraction conditions of 178 min and 45 °C with a ratio of 80 mL/g, the TPC yield was 23.58 mg GAE/g DW (the predicted value was 24.32 mg GAE/g DW), and the experimentally obtained antioxidant activity was 133.45 µM TE/g DW compared to the predicted value of 138.52 µM TE/g DW. Although there are variations between the actual experimental values and the corresponding predicted values, these differences are not statistically significant (Table 4). The consistency of the actual values and the predicted values suggests that the optimization models used to assess the impact and determine the optimal extraction conditions for the recovery of active compounds and the antioxidant activity are suitable for the prediction of the recovery yields of TPC, TSC and DPPH antioxidant activity from COG rhizomes.
The total saponin content and total phenolic content in the initial material were 22.85 mg AE/g DW and 36.59 mg GAE/g DW, respectively. Thus, the recovery efficiency for TSC was determined to be 49.5%, and that for TPC was 64.4%. A study by Barrales et al. (2018) [37] reported the TPC extraction efficiency using alcohol from orange peel to be 35%, while another study by Otero-Pareja et al. (2015) [38] using alcohol achieved efficiency of 87%. Regarding saponin extraction, a study by Khoang et al. (2022) [39] reported TSC recovery efficiency of 14.5% from Polyscias fruticosa leaves. The optimal extraction time for TPC from COG rhizomes in this study is longer than the optimal extraction duration of TPC from limau purut peel (126 min) [21] and for TPC from mashua tubers (60 min) [24]. However, the optimal time for the recovery of TSC in this study is shorter than the time for TSC extraction from Polyscias fruticosa roots [29]. The variations in both the optimal conditions and the extraction yields may depend on the properties of the different raw materials used in the studies.

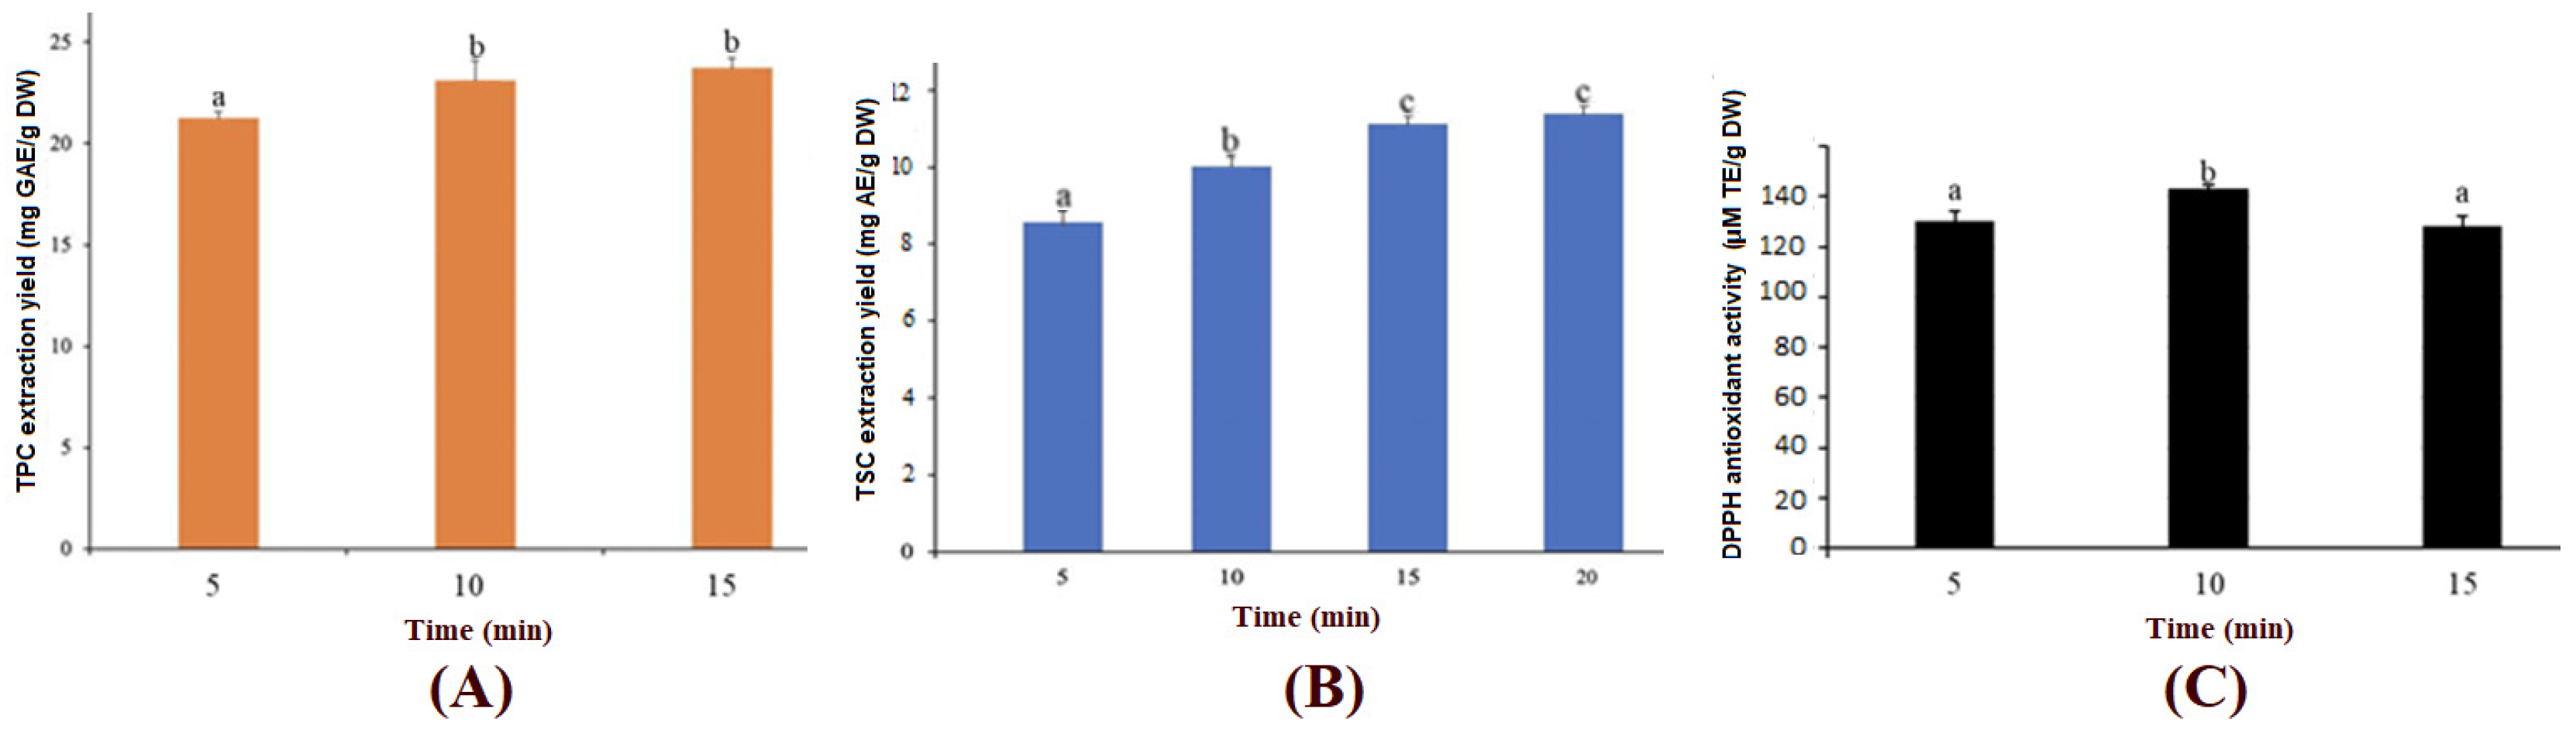
3.4. Ultrasound-Assisted Extraction of TPC, TSC and DPPH Antioxidant Activity from COG Rhizomes

Based on the validated optimal extraction conditions for maceration extraction, an ultrasound-assisted extraction technique was designed using the optimal parameters (temperature of 40 °C and solvent-to-material ratio of 80 mL/g) in order to improve the extraction efficiency of the TPC, TSC and DPPH antioxidant activity from COG rhizomes.
Figure 7A,B show that the recovery yields of both TPC and TSC from COG rhizomes using ultrasound-assisted extraction methods were very high after only 5 min of extraction and they increased significantly with each subsequent 5 min interval. The use of ultrasound to assist the extraction process can lead to high extraction efficiency in a short period, caused by the continuous creation and collapse of cavitation bubbles, which help to weaken or break down the plant cell walls, thereby increasing the mass transfer rate of solutes into the solvent [40]. However, according to the law of solute diffusion, UAE also requires a suitable extraction time to achieve the highest yields of the soluble compounds [41]. In this study, the extraction yields of TPC and TSC reached the maximum values after 15 and 10 min of extraction, respectively, and further extending the time did improve the recovery of these compounds. The data for the DPPH antioxidant capacity in Figure 7C show a similar changing trend to the two groups of TPC and TSC. The extract reached very high DPPH antioxidant activity (128.20 µM TE/g DW) after just 5 min of extraction, increasing to 141.85 µM TE/g DW after 10 min of extraction before decreasing with the extended time.
This result is consistent with previous studies on the impact of ultrasound-assisted extraction (UAE) on bioactive compounds from grapes [42], rosemary leaves [43] and white mushrooms [44]. These studies indicate that the amounts of the compounds and the antioxidant activity obtained from UAE extracts reach the highest levels after relatively short periods (usually between 10 and 20 min) and then decrease when the extraction time is extended. The decline is explained by the increased degradation of the compounds in the liquid phase, while the extraction rate decreases due to the concentration gradient of the solutes between the material and the solvent approaching equilibrium.
As shown in Table 5, there was no statistically significant difference in the yields of the TPC, TSC and DPPH antioxidant activity obtained from the two different extraction methods. However, in terms of production efficiency, the UAE extraction showed a great advantage in reducing the extraction time while maintaining the recovery efficiency of the bioactive compounds. Specifically, to recover comparable yields of TPC and TSC, UAE required only approximately one-eighteenth and one-fourth of the extraction duration compared to maceration extraction, respectively.
A previous study comparing the impact of extraction methods on the compound recovery efficiency reported that UAE improved the TPC recovery from sorghum by 22% compared to the conventional solvent extraction technique [45]. Regarding the extraction of compounds from several herbal materials by various methods, Gadjalova et al. (2019) [46] found that UAE was the most suitable method to maximize the recovery of bioactive compounds. Studies on the extraction of compounds from Gac fruit also showed that the required extraction duration was shortened by five times when using UAE, while achieving significantly higher antioxidant activity recovery compared to the conventional solvent extraction [47,48]. The results from this study indicate that UAE is a promising method for the extraction of saponins, polyphenols and antioxidant activity from COG rhizomes.

4. Conclusions

The extraction yields of the total phenolic content, total saponin content and antioxidant activity from Curculigo orchioides Gaertn rhizomes were significantly influenced by the extraction time, the temperature and especially the solvent-to-material ratio. The optimal conditions for the extraction of TSC were predicted and validated as 60 min, 57 °C and a 80 mL/g solvent-to-material ratio, while those for the recovery of TPC were 178 min, 45 °C and a 68 mL/g solvent-to-material ratio. Extraction with the optimal conditions resulted in the maximum yields of TSC and TPC of 11.33 mg AE/g DW and 23.58 mg GAE/g DW, respectively. The highest DPPH antioxidant activity of the extracts was 133.45 µM TE/g DW, which was obtained when the Curculigo orchioides Gaertn rhizome was extracted for 180 min, at 40 °C, with a solvent-to-material ratio of 80 mL/g. Verification experiments using the optimal conditions confirmed that the actual values were not significantly different from the values predicted by the optimization models. In addition, ultrasound-assisted extraction helped to reduce the extraction time by up to 18 times (10 min), while achieving equivalent extraction yields to the maceration extraction process, using the same type and amount of solvent for the TPC, TSC and antioxidant activity. The results of this study can be used as a scientific basis for the development of efficient extraction processes for Curculigo orchioides Gaertn rhizomes at larger production scales.

Author Contributions

Conceptualization, T.D.B. and V.C.H.; methodology, T.D.B. and V.C.H.; software, V.C.H.; validation, T.D.B. and V.C.H.; formal analysis, V.C.H.; investigation, T.D.B. and V.C.H.; resources, T.N.D.D. and L.T.K.D.; data curation, V.D.P. and V.C.H.; writing—original draft preparation, T.D.B.; writing—review and editing, V.C.H. and L.T.K.D.; visualization, T.N.D.D. and V.D.P.; supervision, V.C.H.; project administration, T.N.D.D. and L.T.K.D.; funding acquisition, V.C.H. All authors have read and agreed to the published version of the manuscript.

Funding

This research was funded by project number T2023-16 of Ho Chi Minh City University of Technology and Education (HCMUTE), Vietnam.

Institutional Review Board Statement

Not applicable.

Informed Consent Statement

Not applicable.

Data Availability Statement

The original contributions presented in the study are included in the article, further inquiries can be directed to the corresponding author.

Conflicts of Interest

The authors declare no conflicts of interest.

References

  1. Wang, Z.-H.; Huang, J.; Ma, X.-C.; Li, G.-Y.; Ma, Y.-P.; Li, N.; Wang, J.-H. Phenolic glycosides from Curculigo orchioides Gaertn. Fitoterapia 2013, 86, 64–69. [Google Scholar] [CrossRef] [PubMed]
  2. Zhu, C.-C.; Wang, K.-J.; Wang, Z.-Y.; Li, N. Chemical constituents from rhizomes of Curculigo breviscapa. Bull. Korean Chem. Soc. 2010, 31, 224–226. [Google Scholar] [CrossRef]
  3. Brintha, S.; Rajesh, S.; Renuka, R.; Santhanakrishnan, V.; Gnanam, R. Phytochemical analysis and bioactivity prediction of compounds in methanolic extracts of Curculigo orchioides Gaertn. J. Pharmacogn. Phytochem. 2017, 6, 192–197. [Google Scholar]
  4. Theng, K.B.; Korpenwar, A.N. Preliminary phytochemical and physicochemical analysis of Curculigo orchioides Gaertn root tubers. Int. J. Bioassays 2014, 3, 3373–3375. [Google Scholar]
  5. Nguyet, N.T.; Nhung, N.M.; Vu, H.X.A.; Man, N.Q.; Minh, T.T.; Van Thi, T.T. In vitro antioxidant activity and Content of compounds from Curculigo orchioides rhizome. Hue Univ. J. Sci. Nat. Sci. 2020, 129, 71–77. [Google Scholar]
  6. Asif, M. A Review on Phytochemical and Ethnopharmacological Activities of Curculigo orchioides. Mahidol Univ. J. Pharm. Sci. 2012, 39, 1–10. [Google Scholar]
  7. Azmir, J.; Zaidul, I.S.M.; Rahman, M.M.; Sharif, K.; Mohamed, A.; Sahena, F.; Jahurul, M.; Ghafoor, K.; Norulaini, N.; Omar, A. Techniques for extraction of bioactive compounds from plant materials: A review. J. Food Eng. 2013, 117, 426–436. [Google Scholar] [CrossRef]
  8. Oreopoulou, A.; Tsimogiannis, D.; Oreopoulou, V. Extraction of polyphenols from aromatic and medicinal plants: An overview of the methods and the effect of extraction parameters. Polyphen. Plants 2019, 243–259. [Google Scholar] [CrossRef]
  9. Wang, Y.; Ma, Y.; Tao, L.; Zhang, X.; Hao, F.; Zhao, S.; Bai, C. Recent advances in separation and analysis of saponins in natural products. Separations 2022, 9, 163. [Google Scholar] [CrossRef]
  10. AOAC. Determination of Moisture, Ash, Protein and Fat. In Official Method of Analysis of the Association of Analytical Chemists, 18th ed.; AOAC: Washington, DC, USA, 2005. [Google Scholar]
  11. Hiai, S.; Oura, H.; Nakajima, T. Color reaction of some sapogenins and saponins with vanillin and sulfuric acid. Planta Medica 1976, 29, 116–122. [Google Scholar] [CrossRef] [PubMed]
  12. Cicco, N.; Lanorte, M.T.; Paraggio, M.; Viggiano, M.; Lattanzio, V. A reproducible, rapid and inexpensive folin-ciocalteu micro-method in determining phenolics of plant methanol extracts. Microchem. J. 2009, 91, 107–110. [Google Scholar] [CrossRef]
  13. Thaipong, K.; Boonprakob, U.; Crosby, K.; Cisneros-Zevallos, L.; Byrne, D.H. Comparison of ABTS, DPPH, FRAP, and ORAC assays for estimating antioxidant activity from guava fruit extracts. J. Food Compos. Anal. 2006, 19, 669–675. [Google Scholar] [CrossRef]
  14. Cvjetko Bubalo, M.; Vidović, S.; Radojčić Redovniković, I.; Jokić, S. Green solvents for green technologies. J. Chem. Technol. Biotechnol. 2015, 90, 1631–1639. [Google Scholar] [CrossRef]
  15. Li, B.; Smith, B.; Hossain, M.M. Extraction of phenolics from citrus peels: II. Enzyme-assisted extraction method. Sep. Purif. Technol. 2006, 48, 189–196. [Google Scholar] [CrossRef]
  16. Stoica, R.; Senin, R.M.; Ion, R.-M. Ethanol concentration effect on the extraction of phenolic compounds from Ribes nigrum assessed by spectrophotometric and HPLC-DAD methods. Rev. Chim. 2013, 64, 620–624. [Google Scholar]
  17. Nguyen, N.; Nguyen, M.; Nguyen, V.; Le, V.; Trieu, L.; Le, X.; Khang, T.; Giang, N.; Thach, N.; Hung, T. The effects of different extraction conditions on the polyphenol, flavonoids components and antioxidant activity of Polyscias fruticosa roots. IOP Conf. Ser. Mater. Sci. Eng. 2020, 736, 022067. [Google Scholar] [CrossRef]
  18. Dai, J.; Mumper, R.J. Plant phenolics: Extraction, analysis and their antioxidant and anticancer properties. Molecules 2010, 15, 7313–7352. [Google Scholar] [CrossRef]
  19. Villano, C.L.; Rosenblum, A.; Magura, S.; Fong, C.; Cleland, C.; Betzler, T.F. Prevalence and correlates of posttraumatic stress disorder and chronic severe pain in psychiatric outpatients. J. Rehabil. Res. Dev. 2007, 44, 167–178. [Google Scholar] [CrossRef]
  20. Thoo, Y.Y.; Ho, S.K.; Liang, J.Y.; Ho, C.W.; Tan, C.P. Effects of binary solvent extraction system, extraction time and extraction temperature on phenolic antioxidants and antioxidant capacity from mengkudu (Morinda citrifolia). Food Chem. 2010, 120, 290–295. [Google Scholar] [CrossRef]
  21. Chan, S.; Lee, C.; Yap, C.; Wan Aida, W.; Ho, C. Optimisation of extraction conditions for phenolic compounds from limau purut (Citrus hystrix) peels. Int. Food Res. J. 2009, 16, 203–213. [Google Scholar]
  22. Durling, N.E.; Catchpole, O.J.; Grey, J.B.; Webby, R.F.; Mitchell, K.A.; Foo, L.Y.; Perry, N.B. Extraction of phenolics and essential oil from dried sage (Salvia officinalis) using ethanol–water mixtures. Food Chem. 2007, 101, 1417–1424. [Google Scholar] [CrossRef]
  23. Juntachote, T.; Berghofer, E.; Bauer, F.; Siebenhandl, S. The application of response surface methodology to the production of phenolic extracts of lemon grass, galangal, holy basil and rosemary. Int. J. Food Sci. Technol. 2006, 41, 121–133. [Google Scholar] [CrossRef]
  24. Chirinos, R.; Rogez, H.; Campos, D.; Pedreschi, R.; Larondelle, Y. Optimization of extraction conditions of antioxidant phenolic compounds from mashua (Tropaeolum tuberosum Ruíz & Pavón) tubers. Sep. Purif. Technol. 2007, 55, 217–225. [Google Scholar]
  25. Bouterfas, K.; Mehdadi, Z.; Latreche, A.; Aouad, L. Antimicrobial power of the flavonoids extracted from the leaves of Marrubium vulgare L. coming from the mount of Tessala (western Algeria). Phytothérapie 2014, 12, 6–14. [Google Scholar] [CrossRef]
  26. Bertoldo, M.; Ciardelli, F. Water extraction and degradation of a sterically hindered phenolic antioxidant in polypropylene films. Polymer 2004, 45, 8751–8759. [Google Scholar] [CrossRef]
  27. Spigno, G.; Tramelli, L.; De Faveri, D.M. Effects of extraction time, temperature and solvent on concentration and antioxidant activity of grape marc phenolics. J. Food Eng. 2007, 81, 200–208. [Google Scholar] [CrossRef]
  28. Volf, I.; Ignat, I.; Neamtu, M.; Popa, V.I. Thermal stability, antioxidant activity, and photo-oxidation of natural polyphenols. Chem. Pap. 2014, 68, 121–129. [Google Scholar] [CrossRef]
  29. Chuyen, H.V. Extraction of saponins, total soluble solids and antioxidant activity from Polyscias fruticosa roots. Food Res. 2023, 7, 42–47. [Google Scholar] [CrossRef]
  30. Antony, A.; Farid, M. Effect of temperatures on polyphenols during extraction. Appl. Sci. 2022, 12, 2107. [Google Scholar] [CrossRef]
  31. Shi, J.; Yu, J.; Pohorly, J.; Young, J.C.; Bryan, M.; Wu, Y. Optimization of the extraction of polyphenols from grape seed meal by aqueous ethanol solution. J. Food Agric. Environ. 2003, 1, 42–47. [Google Scholar]
  32. Maillard, M.-N.; Berset, C. Evolution of antioxidant activity during kilning: Role of insoluble bound phenolic acids of barley and malt. J. Agric. Food Chem. 1995, 43, 1789–1793. [Google Scholar] [CrossRef]
  33. d’Alessandro, L.G.; Kriaa, K.; Nikov, I.; Dimitrov, K. Ultrasound assisted extraction of polyphenols from black chokeberry. Sep. Purif. Technol. 2012, 93, 42–47. [Google Scholar] [CrossRef]
  34. Che Sulaiman, I.S.; Basri, M.; Fard Masoumi, H.R.; Chee, W.J.; Ashari, S.E.; Ismail, M. Effects of temperature, time, and solvent ratio on the extraction of phenolic compounds and the anti-radical activity of Clinacanthus nutans Lindau leaves by response surface methodology. Chem. Cent. J. 2017, 11, 54. [Google Scholar] [CrossRef] [PubMed]
  35. Wu, Q.; Fu, D.-X.; Hou, A.-J.; Lei, G.-Q.; Liu, Z.-J.; Chen, J.-K.; Zhou, T.-S. Antioxidative phenols and phenolic glycosides from Curculigo orchioides. Chem. Pharm. Bull. 2005, 53, 1065–1067. [Google Scholar] [CrossRef]
  36. Réblová, Z. Effect of temperature on the antioxidant activity of phenolic acids. Czech J. Food Sci. 2012, 30, 171–175. [Google Scholar] [CrossRef]
  37. Barrales, F.M.; Silveira, P.; Barbosa, P.d.P.M.; Ruviaro, A.R.; Paulino, B.N.; Pastore, G.M.; Macedo, G.A.; Martinez, J. Recovery of phenolic compounds from citrus by-products using pressurized liquids—An application to orange peel. Food Bioprod. Process. 2018, 112, 9–21. [Google Scholar] [CrossRef]
  38. Otero-Pareja, M.J.; Casas, L.; Fernández-Ponce, M.T.; Mantell, C.; Martinez de la Ossa, E.J. Green extraction of antioxidants from different varieties of red grape pomace. Molecules 2015, 20, 9686–9702. [Google Scholar] [CrossRef]
  39. Khoang, L.T.; Huyen, H.T.T.; Chung, H.V.; Duy, L.X.; Toan, T.Q.; Bich, H.T.; Minh, P.T.H.; Pham, D.T.N.; Hien, T.T. Optimization of total saponin extraction from Polyscias fruticosa roots using the ultrasonic-assisted method and response surface methodology. Processes 2022, 10, 2034. [Google Scholar] [CrossRef]
  40. Sridhar, A.; Ponnuchamy, M.; Kumar, P.S.; Kapoor, A.; Vo, D.-V.N.; Prabhakar, S. Techniques and modeling of polyphenol extraction from food: A review. Environ. Chem. Lett. 2021, 19, 3409–3443. [Google Scholar] [CrossRef]
  41. Carrera, C.; Ruiz-Rodríguez, A.; Palma, M.; Barroso, C.G. Ultrasound assisted extraction of phenolic compounds from grapes. Anal. Chim. Acta 2012, 732, 100–104. [Google Scholar] [CrossRef]
  42. Da Porto, C.; Porretto, E.; Decorti, D. Comparison of ultrasound-assisted extraction with conventional extraction methods of oil and polyphenols from grape (Vitis vinifera L.) seeds. Ultrason. Sonochem. 2013, 20, 1076–1080. [Google Scholar] [CrossRef]
  43. Albu, S.; Joyce, E.; Paniwnyk, L.; Lorimer, J.; Mason, T.J. Potential for the use of ultrasound in the extraction of antioxidants from Rosmarinus officinalis for the food and pharmaceutical industry. Ultrason. Sonochem. 2004, 11, 261–265. [Google Scholar] [CrossRef] [PubMed]
  44. Heleno, S.A.; Diz, P.; Prieto, M.; Barros, L.; Rodrigues, A.; Barreiro, M.F.; Ferreira, I.C. Optimization of ultrasound-assisted extraction to obtain mycosterols from Agaricus bisporus L. by response surface methodology and comparison with conventional Soxhlet extraction. Food Chem. 2016, 197, 1054–1063. [Google Scholar] [CrossRef] [PubMed]
  45. Luo, X.; Cui, J.; Zhang, H.; Duan, Y.; Zhang, D.; Cai, M.; Chen, G. Ultrasound assisted extraction of polyphenolic compounds from red sorghum (Sorghum bicolor L.) bran and their biological activities and polyphenolic compositions. Ind. Crops Prod. 2018, 112, 296–304. [Google Scholar] [CrossRef]
  46. Gadjalova, A.; Mihaylova, D. Ultrasound-assisted extraction of medicinal plants and evaluation of their biological activity. Food Res. 2019, 3, 530–536. [Google Scholar] [CrossRef] [PubMed]
  47. Chuyen, H.V.; Nguyen, M.H.; Roach, P.D.; Golding, J.B.; Parks, S.E. Microwave-assisted extraction and ultrasound-assisted extraction for recovering carotenoids from Gac peel and their effects on antioxidant capacity of the extracts. Food Sci. Nutr. 2018, 6, 189–196. [Google Scholar] [CrossRef]
  48. Chuyen, H.V.; Roach, P.D.; Golding, J.B.; Parks, S.E.; Nguyen, M.H. Ultrasound-assisted extraction of GAC peel: An optimization of extraction conditions for recovering carotenoids and antioxidant capacity. Processes 2019, 8, 8. [Google Scholar] [CrossRef]
Figure 1. Extraction yields of TPC (A), TSC (B) and DPPH antioxidant activity (C) obtained by different solvents (ethyl acetate, ethanol 96%, ethanol 80%, acetone and water). Different characters indicate statistically significant differences among the values (p < 0.05).
Applsci 14 07535 g001
Figure 2. Influence of extraction time on extraction efficiency of TPC (A), TSC (B) and antioxidant activity (C). Different characters indicate statistically significant differences among the values (p < 0.05).
Applsci 14 07535 g002
Figure 3. Influence of extraction temperature on the extraction efficiency of TPC (A), TSC (B) and antioxidant activity (C). Different characters indicate statistically significant differences among the values (p < 0.05).
Applsci 14 07535 g003
Figure 4. Influence of solvent-to-solid ratio on the extraction efficiency of TPC (A), TSC (B) and antioxidant activity (C). Different characters indicate statistically significant differences among the values (p < 0.05).
Applsci 14 07535 g004
Figure 5. Correlations between predicted and actual values: (A) TPC (mg GAE/g DW), (B) TSC (mg AE/g DW) and (C) DPPH antioxidant activity (µM TE/g DW). X1: time (minutes), X2: temperature (°C), X3: solvent-to-material ratio (mL/g). Y1: total phenolic extraction yield (TPC), Y2: total saponin extraction yield (TSC), Y3: DPPH antioxidant capacity.
Applsci 14 07535 g005
Figure 6. Interactive effects of input variables on the extraction yields of TPC (A1A3), TSC (B1B3) and DPPH antioxidant activity (C1C3) from COG rhizomes. X1: time (minutes), X2: temperature (°C), X3: solvent-to-material ratio (mL/g).
Applsci 14 07535 g006
Figure 7. Influence of ultrasound-assisted extraction on the extraction efficiency of TPC (A), TSC (B) and DPPH antioxidant activity (C). Different letters represent statistically significant differences among the values (p < 0.05).
Applsci 14 07535 g007
Table 1. The experimental runs of the Box–Behnken design.
NoCoded LevelsActual Variables
X1X2X3Time
(min)
Temperature
(°C)
Solvent-to-Material Ratio
(mL/g)
1−1−10604060
2−10−1605040
3−10+1605080
4−1+10606060
50−1−11204040
60−1+11204080
70001205060
80001205060
90001205060
100+1−11206040
110+1+11206080
12+1−101804060
13+10−11805040
14+10+11805080
15+1+101806060
Table 2. Experimental values of TPC, TSC and DPPH antioxidant activity of the extracts obtained from 15 combinations of the input variables.
NoX1X2X3Y1
(mg GAE/g DW)
Y2
(mg AE/g DW)
Y3
(µM TE/g DW)
1−1−1015.988.0590.14
2−10−115.267.0469.58
3−10+114.6210.8790.65
4−1+1019.079.4668.40
50−1−116.987.2095.48
60−1+120.818.40109.26
700022.358.6667.28
800022.489.6366.31
900024.079.9575.29
100+1−117.086.8576.10
110+1+117.8410.14106.12
12+1−1022.808.18104.15
13+10−116.297.3073.13
14+10+122.2410.70124.69
15+1+1023.399.1862.42
X1: time (minutes), X2: temperature (°C), X3: solvent-to-material ratio (mL/g). Y1: total phenolic extraction yield (TPC), Y2: total saponin extraction yield (TSC), Y3: DPPH antioxidant capacity.
Table 3. Statistical analysis of the estimated regression coefficients and quadratic polynomial models.
Regression CoefficientY1Y2Y3
Estimated ValueProb > |t|Estimated ValueProb > |t|Estimated ValueProb > |t|
Intercept
β o 22.967<0.0001 *9.413<0.0001 *69.627<0.0001 *
Linear
β 1 2.4740.0027 *−0.0080.97445.7030.1576
β 2 0.1010.83020.4750.0858−10.7490.0259 *
β 3 1.2380.0398 *1.4650.0012 *14.5540.0082 *
Interaction
β 12 −0.6250.3694−0.1030.7577−4.9980.3505
β 13 1.6480.0483 *−0.1080.74647.6230.1772
β 23 −0.7680.28010.5230.15754.0600.4411
Quadratic
β 11 −1.8660.0368 *0.0670.84572.2120.6799
β 22 −0.7910.2844−0.7630.06729.4390.1207
β 33 −3.9980.0018 *−0.5030.185017.6740.0173 *
* Significance at p < 0.05.
Table 4. Results of the validation experiments using the predicted optimal extraction conditions.
Output ResponsesOptimal ConditionsPredicted ValuesActual Values
TPC
(mg GAE/g DW)
178 min
45 °C
68 mL/g
24.32 ± 2.15 b23.58 ± 2.24 b
TSC
(mg AE/g DW)
60 min
57 °C
80 mL/g
10.95 ± 1.72 a11.33 ± 1.20 a
Antioxidant activity (µM TE/g DW)180 min
40 °C
80 mL/g
138.52 ± 29.49 c133.45 ± 19.95 c
Different letters show statistically significant differences between actual values and predicted values (p < 0.05).
Table 5. Comparison of extraction efficiency obtained by ultrasound-assisted extraction and maceration extraction processes.
Output ResponsesParameters MacerationUAE
TPC
(mg GAE/g DW)
Extraction time178 min10 min
Recovery yield23.73 ± 0.77 a23.58 ± 2.24 a
TSC
(mg AE/g DW)
Extraction time60 min15 min
Recovery yield11.27 ± 0.82 b11.33 ± 1.20 b
Antioxidant activity
(µM TE/g DW)
Extraction time178 min10 min
Recovery yield141.85 ± 10.12 c133.45 ± 19.95 c
Different characters indicate statistically significant differences between values in a row (p < 0.05).
Disclaimer/Publisher’s Note: The statements, opinions and data contained in all publications are solely those of the individual author(s) and contributor(s) and not of MDPI and/or the editor(s). MDPI and/or the editor(s) disclaim responsibility for any injury to people or property resulting from any ideas, methods, instructions or products referred to in the content.

