Article

Decision Tree Regression vs. Gradient Boosting Regressor Models for the Prediction of Hygroscopic Properties of Borassus Fruit Fiber

by
Assia Aboubakar Mahamat
1,2,*,
Moussa Mahamat Boukar
3,
Nordine Leklou
4,
Amandine Celino
4,
Ifeyinwa Ijeoma Obianyo
2,
Numfor Linda Bih
1,
Tido Tiwa Stanislas
1 and
Holmer Savastanos, Jr.
5
1
Department of Materials Science and Engineering, African University of Science and Technology, Federal Capital Territory, Abuja 900100, Nigeria
2
Department of Civil Engineering, Nile University of Nigeria, Federal Capital Territory, Abuja 900108, Nigeria
3
Faculty of Computing, Nile University of Nigeria, Federal Capital Territory, Abuja 900108, Nigeria
4
Nantes Université, École Centrale Nantes, CNRS, GeM, UMR 6183, F-44600 Saint-Nazaire, France
5
Department of Biosystems Engineering, University of Sao Paulo, Pirassununga 13635-900, SP, Brazil
*
Author to whom correspondence should be addressed.
Appl. Sci. 2024, 14(17), 7540; https://doi.org/10.3390/app14177540
Submission received: 18 July 2024 / Revised: 19 August 2024 / Accepted: 24 August 2024 / Published: 26 August 2024
(This article belongs to the Section Materials Science and Engineering)

Abstract

:

Featured Application

This study presents a novel approach to use ML models to estimate the hygroscopic properties of a natural fiber: Borassus fruit fibres (BNF). This knowledge is helpful to engineers designing and choosing materials for various applications in the building sector, as they can better understand how the material absorbs moisture. The ML models could potentially replace more expensive and time-consuming methods for testing these properties.

Abstract

This research focuses on the environmental-friendly production of Borassus fruit fibers (BNF), its characterization, and hygroscopic properties determination via Dynamic Vapor Sorption (DVS). The experimental results obtained from the hygroscopic behavior analysis were used to create a primary dataset to train and test Decision Tree Regression (DTR) and Gradient Boosting Regressor (GBR) models. The created primary dataset comprised 294 observations, from which 80% were used to train the models, and the remaining 20% were used for the testing of the two models. The models exhibited high accuracy, easy interpretability on the small-size dataset, and flexibility with regards to the nature of the relationship between the input and output variable. Both models successfully predicted the hygroscopic behavior with the Gradient Boosting Regressor outperforming Decision Tree Regression by indicating values of 0.012, 0.109, 0.059, and 0.999 for MSE, RMSE, MAE, and R2, respectively, during the desorption of the BNF, and values of 0.012, 0.109, 0.059, and 0.999 for MSE, RMSE, MAE, and R2, respectively, during the desorption of the BNF. This suggests that the Gradient Boosting Regressor illustrated the maximum accuracy. The outcomes can be utilized to provide an alternative for traditional methods, which can often be costly and time-consuming by improving the engineering properties of BNF. The models can be used in the construction sector to lower costs as they are able to pinpoint elements influencing the characteristics for specific applications to grasp its various properties through the prediction of its hygroscopic properties.

1. Introduction

1.1. Background

Ecological concerns about ecosystem degradation have triggered interest in producing green materials. Natural fibers represent a good alternative for green materials production in construction. In recent years, there has been a growing interest in the use of natural fibers in construction due to their environmental benefits and potential for sustainable development [1]. Natural fibers can be obtained from plants, animals, or minerals. Wool (from sheep), cashmere (from goats), and silk (from silkworms) are three of the most common animal fibers. However, mineral fibers are materials made from minerals that are typically inorganic substances like rock, slag, or glass. Mineral fibers that are often used include asbestos, fiberglass, rock wool, and ceramic fiber. Natural fibers of plant origin are known as vegetal fibers. The global interest is turned towards vegetable fibers because of their availability, biodegradability, eco-friendliness, low cost, low density, highly specific mechanical properties (better stiffness, high modulus, and strength related to density (greater than glass fibers, for example), light weight, and low energy consumption during extraction [2]. They are sourced from renewable materials that are largely abundant globally [3]. Vegetable fibers can be in the stem, the leaf, the seed, the fruit, the grass, or the bark fabrics of the plant [4]. Cotton, jute, hemp, flax (also known as linen), coconut fiber, and sisal are some examples of commonly found natural vegetal fiber. Borassus aethiopum, commonly known as the African palm wine tree, is a species of palm that is widely distributed in tropical Africa. Borassus aethiopium is commonly spread in Sub-Saharan Africa, Madagascar, the Pacific Islands, the Arabian Peninsula, South Asia, and Southeast Asia, and it is a long-lasting tree from the five Borassus species [5]. The stem of Borassus aethiopum is tall and cylindrical, reaching heights of up to 40 m and a diameter of 1 m and more (depending on various factors such as soil quality, climate, and genetic variation within the species). The main woody stem is thick, fibrous bark that is gray or brown, durable, and encircled with large fan-shaped leaves (up to 6 m) and without secondary thickening. Borassus aethiopum produces large, white flowers that are borne in clusters at the top of the stem. The flowers are bisexual and have both male and female reproductive structures. The female flowers develop into fruits after pollination. Its fruit is large with a spherical structure (varies from less or more oval to rounded) that is covered in a thick, fibrous husk [6]. The coconut-like fruit with a diameter of 10–18 cm can contain 1–3 seeds each. The soft orange–yellow mesocarp pulp of the ripe fruit is sweet and edible. Juice, jelly, and some dishes can be produced from the fruit apart from being eaten raw, roasted, or boiled in some Asian countries [7]. Meanwhile, in Sub-Saharan African countries, the fruit does not have any economic value. The parts of the tree having economic value are the stem or trunk that is used for construction of houses, bridges, canoes while the leaves are used to produce fans, bags, and mats, mostly in rural areas. Hence, this economic source is neglected and insufficiently exploited compared to other natural fibers [8]. The tree is found in a variety of habitats, including savannas, grasslands, and forests. Borassus aethiopum thrives in hot, dry, desert conditions and can survive for long drought periods (with minimal rainfall as low as 25 mm). It can grow in nutritionally poor soils, sandy, loamy, and clayey soils. It grows where the temperature is not below 10 °C but can withstand temperatures as high as 45 °C. It has a very high potential for growth, it is renewable and sustainable if the plantation is done continuously, and the quantity is produced every season. The Borassus fruit fibers have very high tensile properties (elongation up to 42%) [6]. An investigation conducted by Obi Reddy et al. [4] studied the coarse and fine Borassus fruit fibers, showing a composition comprising alpha-cellulose, hemicellulose, and lignin. They found that the tensile properties increased with the alkali treatment from 50.9 MPa to 53.5 MPa for coarse fibers, and from 65.2 MPa to 90.7 MPa for fine fibers. They changed chemically the natural fibers through alkali treatment and showed that the maximum stress and the stiffness modulus of the fine fibers were higher than those of the coarse fibers [9]. The increase in percentage elongation at the break was not very noticeable in the case of coarse fibers after alkali treatment, while for the fine fibers, it increased from 34.8% before treatment to 45.2% after alkali treatment [4]. The alkali treatment contributed to enhancing the strength of the fiber with a noticeable increase from 70.8 MPa to 100.1 MPa after treatment. The fibres expand as a result of this activity, enabling deeper penetration of the solution. Consequently, the properties of the natural fiber are improved in several ways: increased tensile strength (the fiber becomes stronger and more resilient as a result of the alkaline treatment), and the surface becomes smoother.

1.2. Challenges

Traditional methods of fiber identification involve manual inspection, which can be time-consuming and subjective [10]. The main challenges using traditional methods to determine natural fibre characteristics are the low precision level. For instance, during the determination of weights, direct weight-assignment techniques based on the expert’s comprehension of the importance of criteria are acquired. Then multi-criteria analysis models are used to figure out the weights [11]. The methods used to determine the weights can be separated into four categories: direct and indirect, holistic and decomposed, statistical and algebraic, and compensatory and non-compensatory. In direct methods, the decision-maker evaluates two criteria using a ratio scale. In indirect techniques, weights are determined based on preferences. In algebraic approaches, a basic system of equations is used to determine the n weight based on an n − 1 set of judgements, while regression analysis is used during weight selection [12]. Decomposed processes compare one pair of criteria, while holistic approaches allow for the expression of preferences and evaluate the alternatives overall by considering both the criteria and the alternatives. It is evident that the methods used to determine criteria weights are not classified uniquely and are instead done on a variety of grounds [13]. However, the ability of natural fibers to absorb materials or their hygroscopic properties is a significant feature to be considered [14]. Throughout their existence, composite materials are frequently exposed to a variety of atmospheric conditions, including unsteady hygroscopic conditions. Nonetheless, considerable hygroscopic behavior of the fibres results in high-moisture absorption in damp surroundings under humid conditions. As a result, both the fibers’ structure and the composites they are integrated into undergo changes that impact their physical and mechanical properties [15]. Therefore, to properly regulate these novel composite materials, it is important to comprehend these mechanisms of moisture absorption, as well as the manner in which water affects the ultimate properties of these fibres and their composites [16]. To more effectively encourage the use of these fiber-based composites as structural materials for various applications in the future, it is crucial to understand and anticipate their sorption behavior [17]. The dynamic vapor sorption (DVS) technique is used to determine the uptake of water as a function of relative humidity, temperature, and exposure time. It is one of the commonly used methods for the determination of hygroscopic properties of fibers [18]. However, it is difficult to pinpoint the exact moisture content at a specific relative humidity with the use of DVS. It also requires a limited number of samples that may not represent the entire fiber; achieving equilibrium at each humidity level can be time-consuming. Henceforth, the use of machine-learning (ML) techniques can provide improved efficiency and accuracy of the fiber properties from the experimental data to evaluate the complex relationship between the fibers’ features and hygroscopic behavior.

1.3. Literature Review

Machine learning has emerged as a powerful tool for optimizing natural fiber-production processes. These algorithms have been successfully implemented across various stages, from the initial characterization [19] of yarn and fabric properties to the critical tasks of fiber identification and quality assessment [20]. By leveraging spectral data and other relevant features, sophisticated machine-learning models can accurately classify fibers, enabling automated and efficient quality-control measures [21]. This technological advancement holds significant potential to revolutionize the natural fiber industry by enhancing productivity, reducing costs, and improving the overall quality of final products. Machine learning (ML) has the potential to revolutionize fiber development by significantly reducing the time [10] and cost associated with traditional laboratory testing. By analyzing vast amounts of data on fiber properties, ML models can predict fiber behavior with increasing accuracy, enabling the rapid design and optimization of fibers with tailored hygroscopic properties for specific applications [22]. This data-driven approach can accelerate the development of innovative fiber-based materials for various industries, such as textiles, composites, and filtration [23]. The capacity of machine-learning algorithms to draw conclusions and patterns from massive, intricate datasets has drawn a lot of interest in recent years [24]. For instance, a study by Wang et al. proposed a deep-learning model for cotton-fiber identification based on hyperspectral imaging, achieving an accuracy of 99.8% [25]. The commercial viability of natural fibers is significantly influenced by their quality attributes. A multitude of factors contribute to fiber quality, including but not limited to length, fineness, strength, and uniformity. To expedite and enhance quality assessment, researchers have increasingly employed machine-learning techniques. These models have demonstrated potential in predicting fiber quality based on a range of parameters, such as color, texture, and morphological characteristics [26,27,28]. A study by Alam et al. used SVMs to predict the tensile strength and stiffness of jute fibers based on their length, diameter, and orientation [29]. Gradient Boosting is widely acknowledged as one of the most efficient approaches to developing predictive models [30]. It is an ensemble machine-learning approach that is typically used to solve regression and classification problems [31]. It creates a forecasted model, usually a decision tree, from an ensemble of brittle anticipated models [32]. Decision Tree Regression (DTR) is a subset of the supervised machine-learning (ML) technique that can be used for regression and classification issues [30]. This method solves the problem by using a tree representation to create a model that can forecast the desired variable [31]. Table 1 presents the various ML algorithms used with their key findings during the utilization of various natural fibers and their composites. Metrics are indispensable for assessing the efficacy of machine-learning models. These quantitative measures provide crucial insights into a model’s performance on a particular dataset. By quantifying various aspects of model output, metrics enable rigorous comparisons between different models and inform decisions about model selection and optimization. A variety of metrics are commonly employed to assess model performance. For classification tasks, precision, recall, F1 score, and accuracy are frequently utilized to evaluate a model’s ability to correctly classify instances. Precision quantifies the proportion of positive predictions that are truly positive, while recall measures the proportion of actual positives that are correctly identified. The F1 score offers a harmonic means of precision and recall, providing a balanced assessment. Accuracy represents the overall correct predictions relative to the total number of instances. In regression problems, metrics such as the mean squared error (MSE) [18], root mean squared error (RMSE), and R2 are standard measures of model performance. MSE calculates the average squared difference between predicted and actual values, while RMSE provides the square root of MSE, offering a more interpretable error metric in the original units of the data, with R2 indicating the proportion of variance explained by the model [33,34]. These metrics are particularly valuable for evaluating the model’s ability to predict continuous numerical values [35]. Decision Tree Regression (DTR) and Gradient Boosting Regression (GBR) are ensemble methods renowned for their efficacy in regression tasks. These models often outperform traditional methods like linear regression [36] by achieving high accuracy with relatively less complex preprocessing [37,38]. Their inherent flexibility allows them to capture intricate relationships within the data, reducing the risk of overfitting. DTR and GBR are ensemble methods that are not widely used during similar predictions compared to traditional methods like linear regression. However, recent literature has increasingly highlighted the potential of DTR and GBR in diverse regression applications. Studies have demonstrated their effectiveness in handling non-linear relationships, interacting variables, and noisy data [39].

1.4. Focus of the Study and Statement of Originality

This investigation’s primary objective is to extract and analyze the Borassus fruit’s natural fibers (BNF). The evaluation of morphological and hygroscopic properties was conducted to examine the Borassus fruit fiber’s engineering qualities to turn it into an economically viable and sustainable material. The ecological benefits of using Borassus aethiopum fibers are rapid growth, renewable resources, low energy consumption during manufacturing, biodegradability, abundance, and durability.
A primary dataset was created from the experimental results. Gradient Boosting Regressor (GBR) and Decision Tree Regression (DTR) models were used to predict the hygroscopic properties of the natural fibers based on the created primary dataset. Both models (GBR and DTR) were analyzed comparatively to determine the most efficient model during the prediction.
This study offers an original approach to making use of the natural fibers in Borassus fruit. The major features of novelty are summed down as follows: (i) Eco-friendly extraction of natural Borassus fruit fiber (BNF): the fibers were extracted manually without the use of any chemical. (ii) Pioneering the hygroscopic properties evaluation of BNF: to the authors’ knowledge, previous literature studying the hygroscopic behavior of the BNF using DVS does not exist. (iii) Build a primary dataset from experimental results: most literature using ML models utilises the secondary dataset (data collected from existing literature). Meanwhile, the present dataset was obtained experimentally. (iv) Develop Decision Tree Regression (DTR) and Gradient Boosting Regressor (GBR) models to efficiently run on a small-size dataset. Then, compare the models efficiently; the outcome offers insightful information on selecting the best model for future applications. The contributions were subsequently categorized as follows:
  • Theoretical contributions:
  • The study introduces BNF as a potential engineering material, expanding the scope of natural fiber research, and it comprehensively studies its hygroscopic properties using Dynamic Vapor Sorption (DVS).
  • The creation, application, and comparison of GBR and DTR models for predicting hygroscopic properties based on primary and small-size experimental data.
  • Practical contributions:
  • Eco-friendly extraction of Borassus fruit fibres and their identification as potential sustainable materials for construction application.
  • Creation of a valuable dataset for future research and informative model comparison for selecting appropriate models in similar cases.
  • Application of practical tools for BNF characterization and product development.

2. Materials and Methods

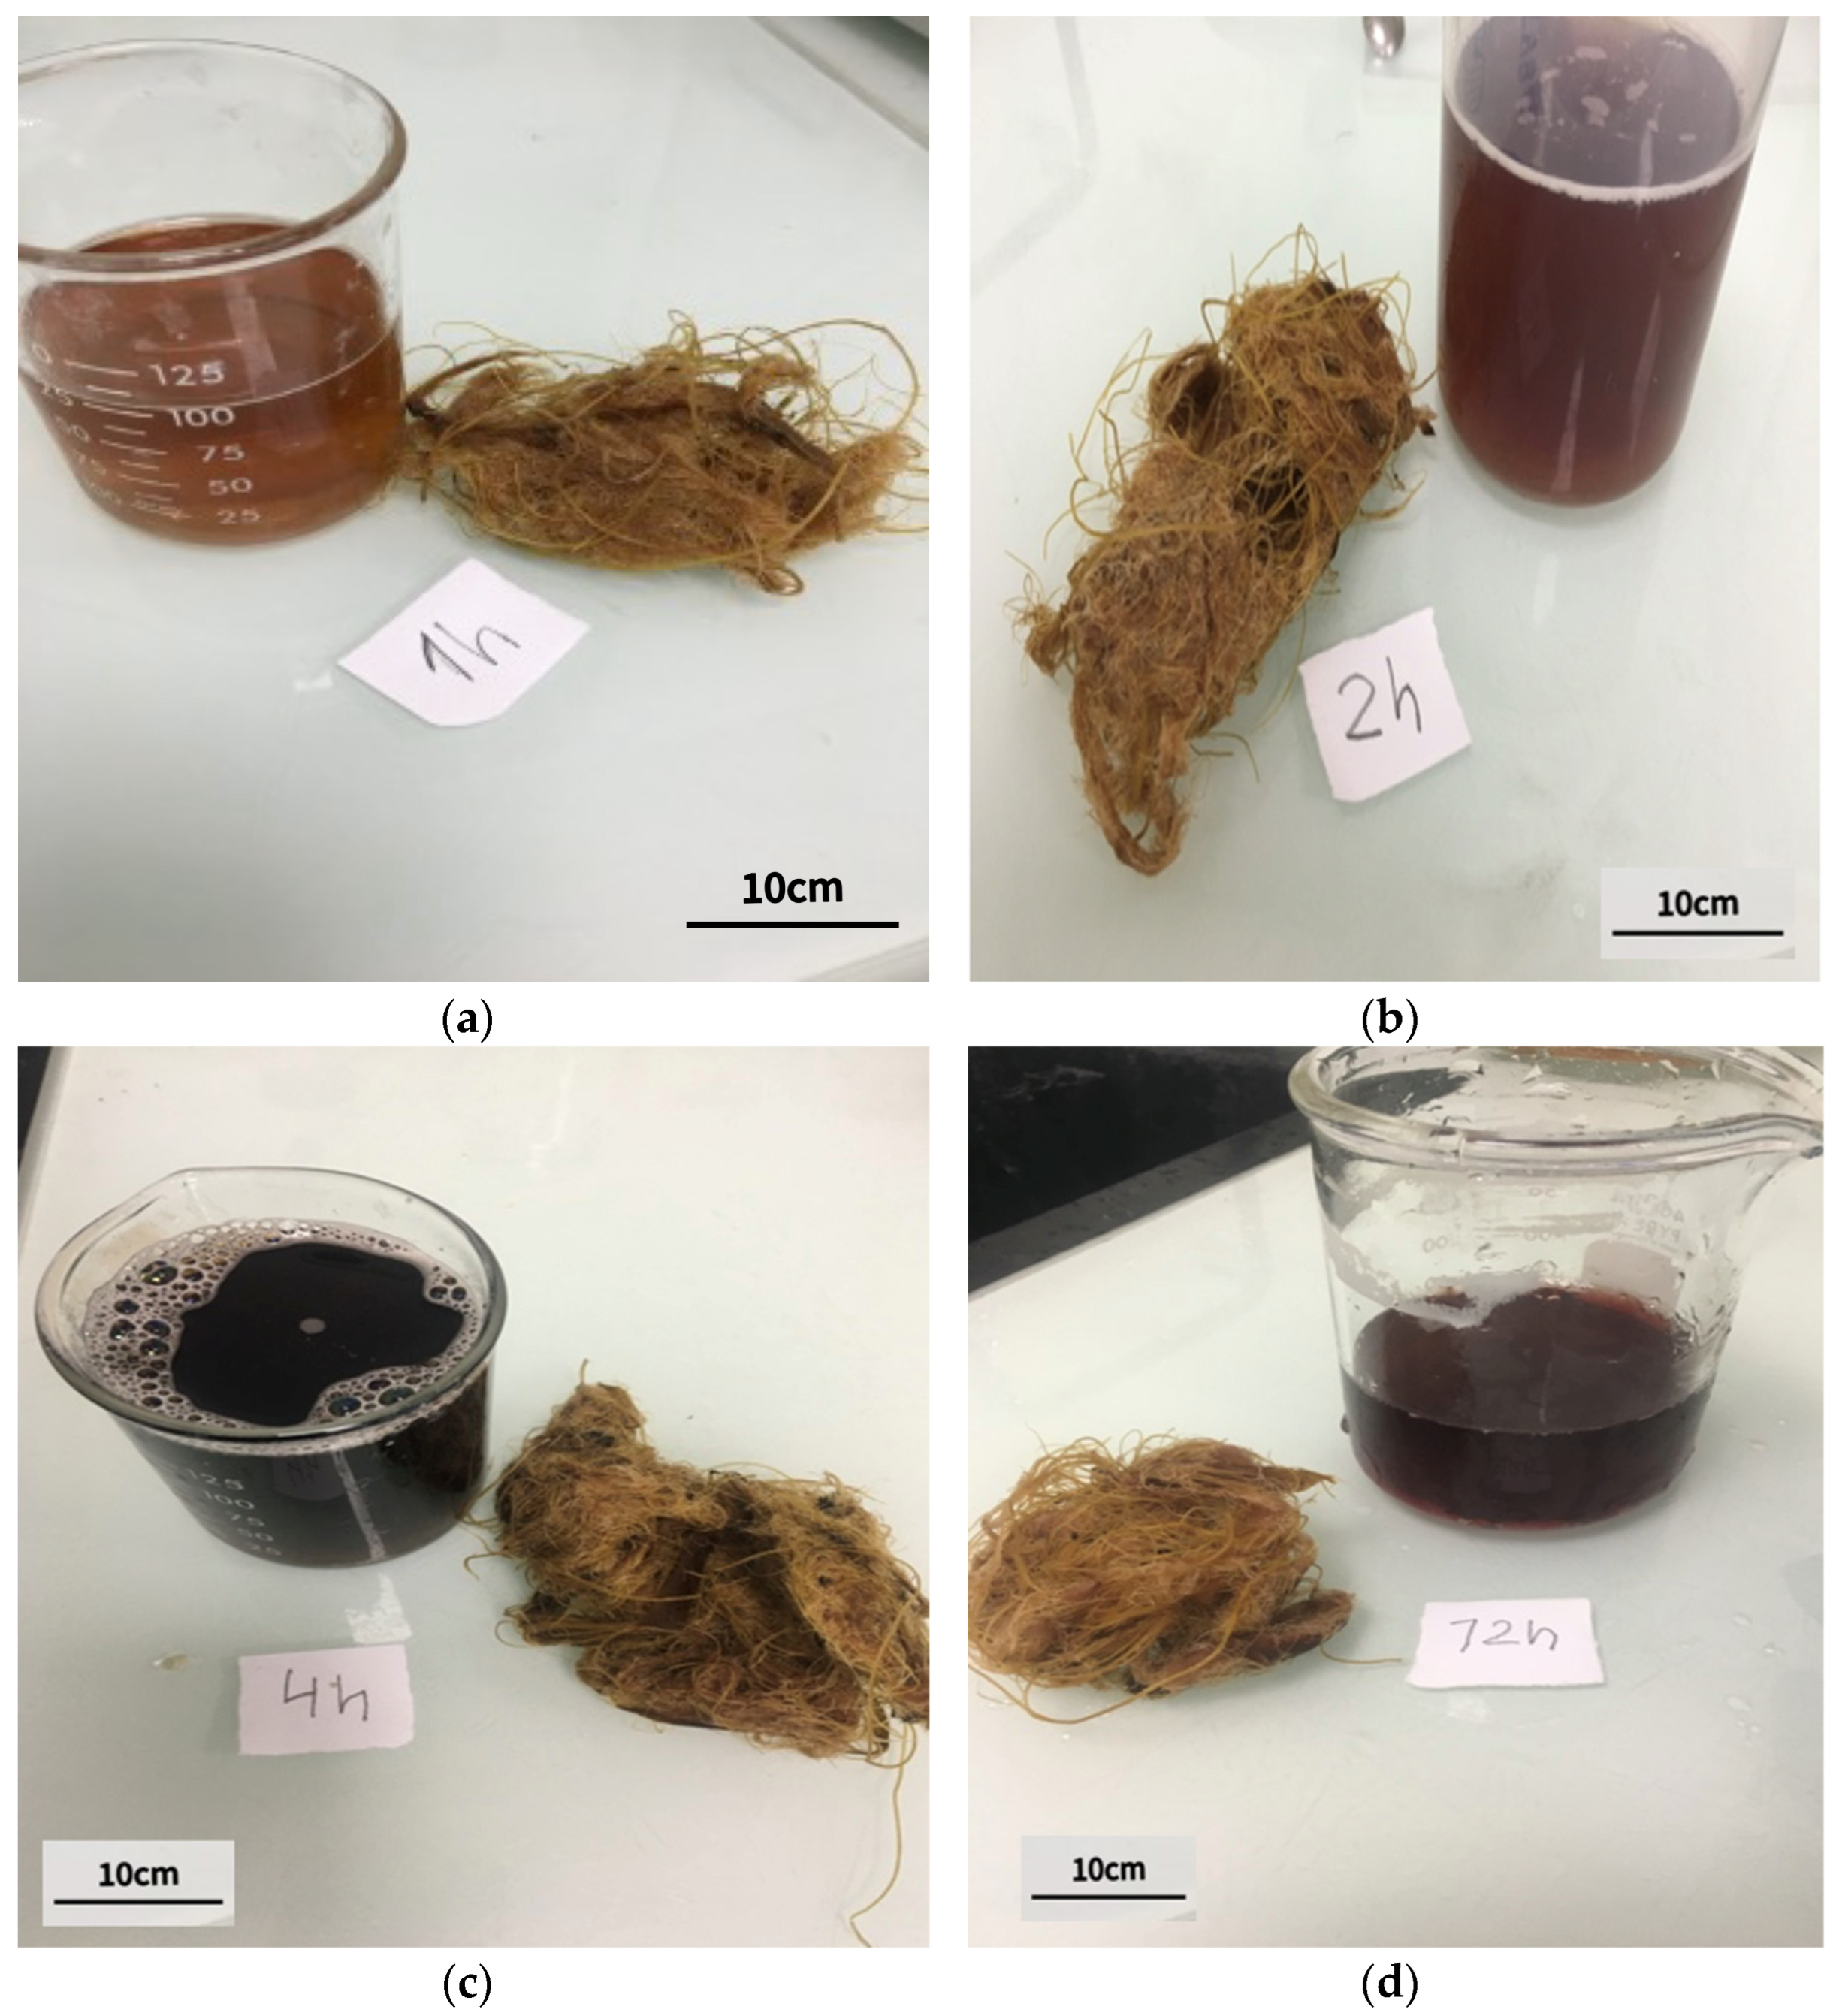
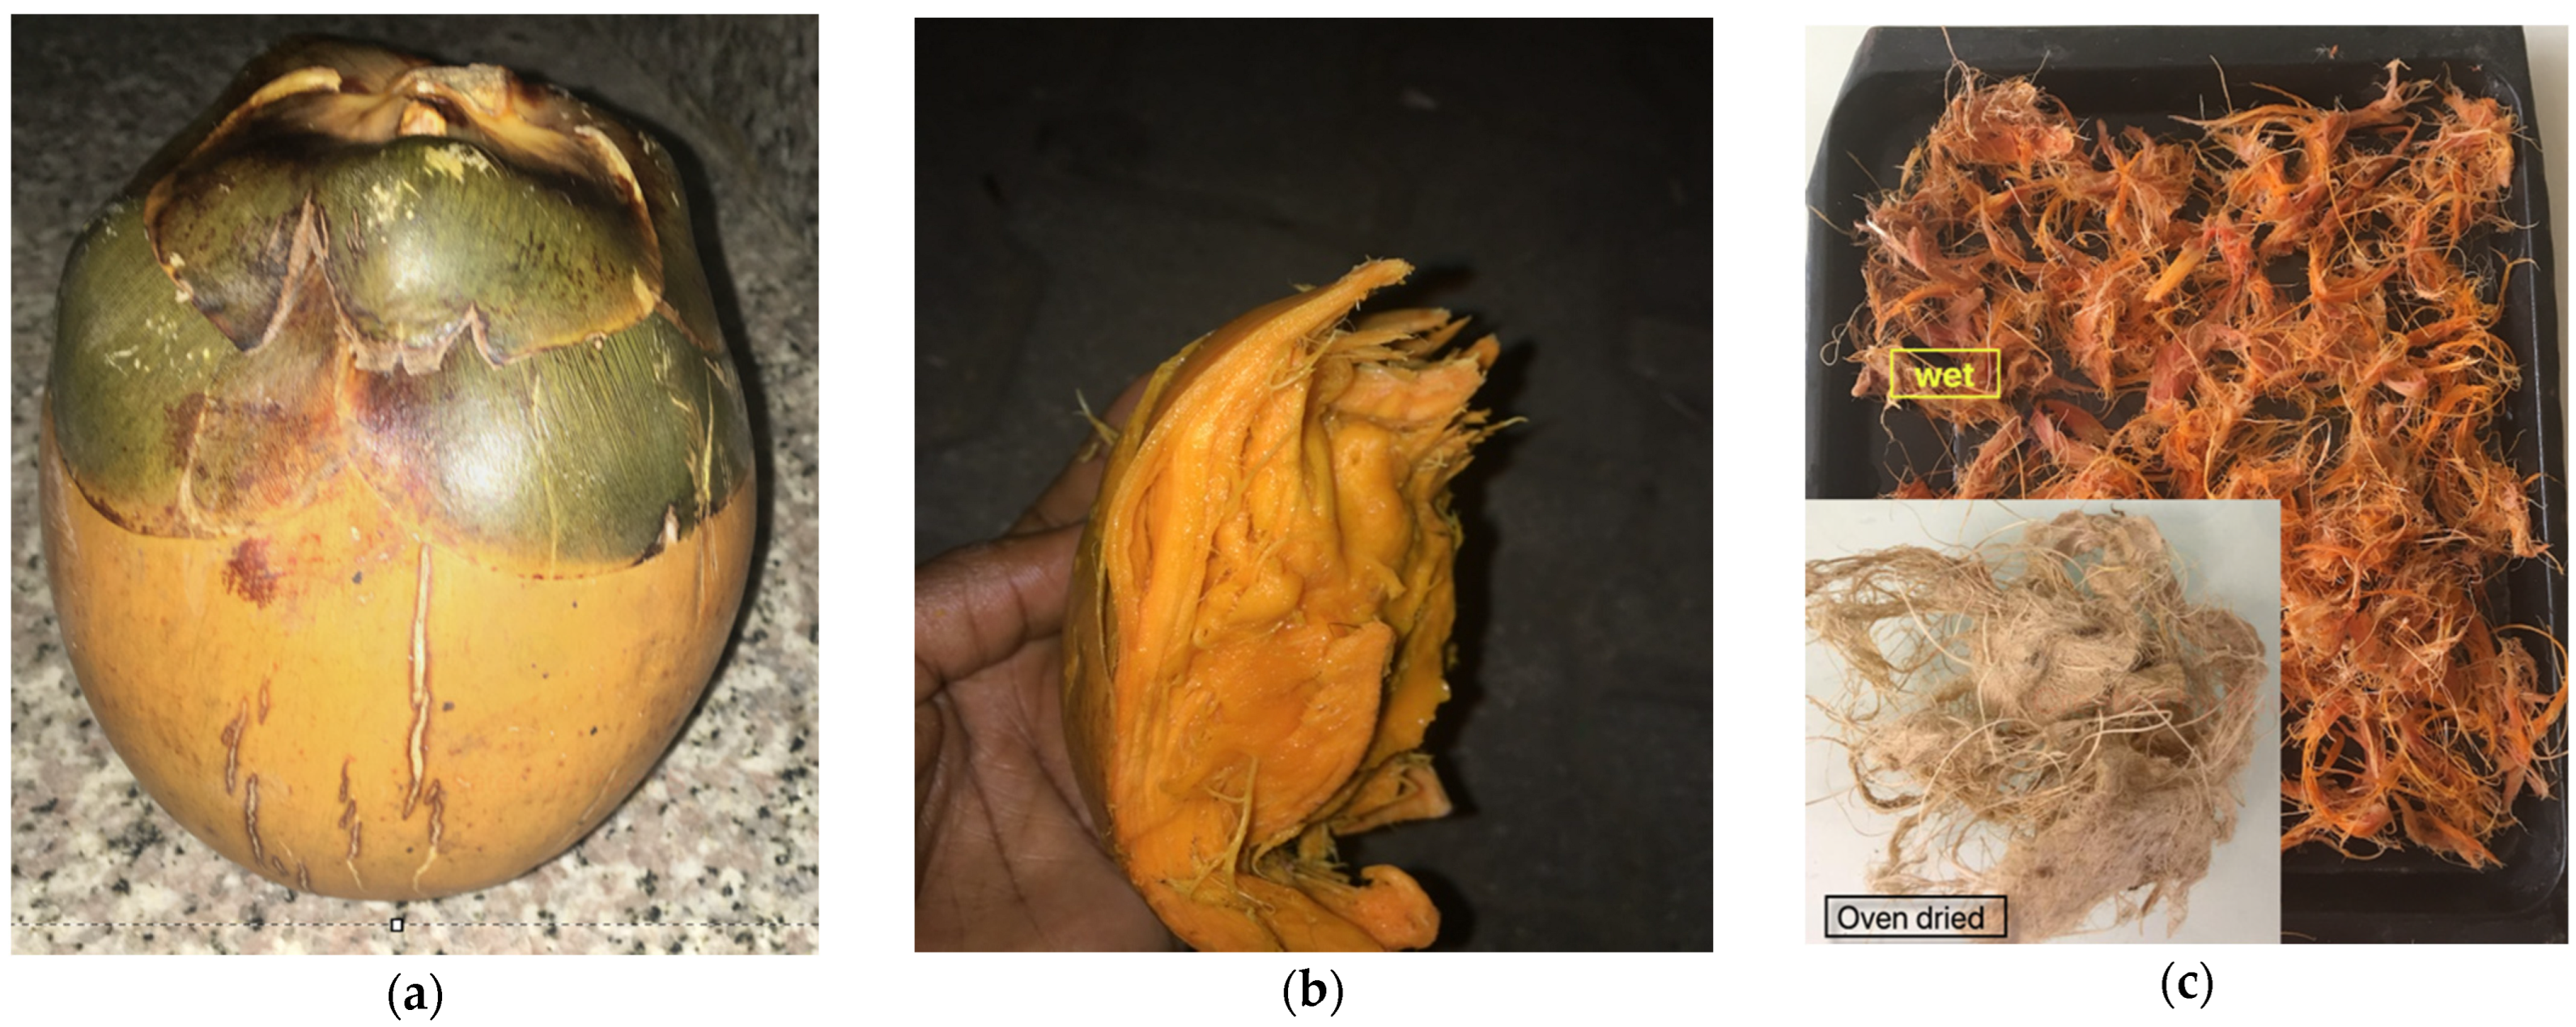
2.1. Extraction of Fiber

The fibers found in Borassus fruits were taken out of fully ripe fruits. The selection criteria for the ripe fruits are that they frequently provide better yields and require less processing time since it is easier to extract their fibres. The maturation process results in cleaner fibres with improved bonding qualities and reduced impurities and waxes. These ripe Borassus fruits were gathered in Jabi, Federal Capital Territory, Nigeria. The fruits were cut into large, vertical slices and cooked for 30 min at 80 °C in tap water [4]. The process is aimed at softening the fibers’ tissues to facilitate their separation from other components and remove impurities. Therefore, the temperature and the duration were found to be efficient and effective. Coarse and fine fibers were the two types that were obtained (as seen in Figure 1). The fibers were distributed from edge to edge within the fruit nut, with the fine fibres being closest to the nut and the coarse fibres primarily near the shell. The fruit’s shell was composed of a collection of coarse fibers that tended to separate once the water was treated. The fruit’s juice-like substance was removed from both the fine and coarse fibers by running water before they were oven-dried for 72 h at 80 °C [4]. Figure 1 shows the manual extraction of the Borassus natural fiber fruit.

2.2. Chemical Treatment

Under a microscope, the natural fibers of Borassus were found to have many surface pores and contaminants, which is why a chemical treatment was required. In addition to eliminating surficial pores, the alkaline treatment aims to eliminate impurities to promote greater adhesion between the fibers and matrix. When exposed to moisture or a humid environment, the chemical treatment reduces the fibers’ hygroscopic swelling rate. The fibers from both the coarse and fine Borassus fruits were impregnated for 1, 2, 4, 24, 48, and 72 h in a sodium hydroxide solution at a weight/volume ratio of 5% at 27 °C and a liquor ratio of 10:1. Following the impregnation, the fibers were regularly cleaned with distilled water [46].

2.3. Physical and Morphological Properties

The Scanning Electron Microscope (SEM) technique was used to measure the diameter of the BNF. The analysis was conducted in many fibers (50–100), and the mean long and short diameters were kept for this study, with the long and short diameters equal to 175 µm to 25 µm, respectively. The analysis was conducted on the natural fibers before and after chemical treatment to ascertain the effect of the chemical treatment on the fiber’s morphology and microstructure. The microscopic analysis was made with a CARL ZEISS instrument; model EVO40 EP (Nantes, France) was implemented with an EDX system [3].

2.4. Hygroscopic Behavior (Sorption–Desorption)

To understand how the fine and coarse fibers behaved in a humid environment, a sorption–desorption analysis was performed on them. Natural Borassus fruit fibers (BNF) and chemically treated Borassus fruit fibers (CBNF) were subjected to analysis following varying exposure times to the chemical treatment (1, 2, 4, 24, 48, and 72 h). Dynamic vapor sorption analysis was used to determine the water sorption isotherms of BNF and CBNF. Using a recording ultramicrobalance with a mass resolution of ±0.2 µg, the sorption and desorption of water as a function of relative humidity were measured gravimetrically using a dynamic gravimetric vapor-sorption device (DVS, IGAsorp, Hiden Isochema, Nantes, France). The following relative humidity profile was applied to the samples (≈5–20 mg): 0–90% RH at 23 °C in increments of 10% RH [16]. Mass equilibrium was reached at each humidity level by measuring the percent mass change with respect to time (i.e., the slope or first derivative of the mass with respect to time, namely dm/dt) [47].

2.5. Machine-Learning Models

2.5.1. Decision Tree Regression (DTR)

One type of supervised machine-learning technique that may be applied to both regression and classification problems is the decision tree classifier. It is a tree-structured classifier in which internal decision tree nodes represent the characteristics of the supplied dataset. The decision rules are represented by the decision tree’s branches, while the classifier’s final output is shown by the leaf. Decision Tree Regression (DTR) uses the input data to build a tree-like model of decisions and their potential outcomes [48,49]. The following features of the experimental protocol are included to simplify its replication:
Data: X (matrix), y (vector)
Split: X_train, y_train, X_test, y_test
Tree: T = DecisionTree()
     •
T.build(X_train, y_train)
  ○
Recursively split nodes:
  ▪
Find the best feature f using a splitting criterion (e.g., Giniimpurity, information gain)
  ▪
Split node into child nodes based on f
  ○
Stop splitting when criteria met
Prediction:
     •
ŷ = T.predict(x)
Evaluation:
     •
Metrics on X_test

2.5.2. Gradient Boosting Regressor (GBR)

For regression and classification purposes, gradient boosting is a machine-learning technique that generates a prediction model as an ensemble of weak prediction models [50], typically decision trees. It builds the model step-by-step; it is one of the boosting procedures and is used to lower the model’s bias error [35]. The gradient boosting regressor (GBR) model’s experimental protocol is described as follows:
Initialization:
 •
ŷ0 = initial model prediction (e.g., average target value)
 •
M = ensemble of weak learners
Boosting iterations:
 •
For m = 1 to M:
    ○
Calculate residuals: ri = yi − ŷi1
    ○
Train weak learner hm(x) on (X, r)
    ○
Update ensemble: ŷi = ŷi−1 + α * hm(xi)
Prediction:
 •
ŷ = Σ[αm * hm(x)]
Evaluation:
 •
Metrics on X_test
A primary dataset including 294 observations has been generated using the results of the hygroscopic properties experiments. The BNF’s mass, relative humidity, ambient temperature, and time of exposure are the variables that constitute the main dataset, which is used to test and train the output parameter before being processed to encode categorical features and divided into training and testing (80/20). The details of some of the data are shown in Table 2. A summary of the structure and functioning of both models is shown in Table 3.

2.5.3. Evaluation Metrics

Four performance indicators: mean square error (MSE), root mean square error (RMSE) [51], coefficient of determination (R2) [52], and mean absolute error (MAE) [52] are employed during this investigation to assess the performance of the GBR and DTr models. Table 4 provides more information on how to calculate these evaluation metrics.

2.5.4. Framework for Experiments

Python 2.7.12 was utilized to implement the tests, and the hardware framework used for the execution environment was an Intel Core (TM) i5-4790 CPU running at 3.60 GHz with 4 GB of RAM. The experimental framework is summarized in Figure 2.

3. Results and Discussions

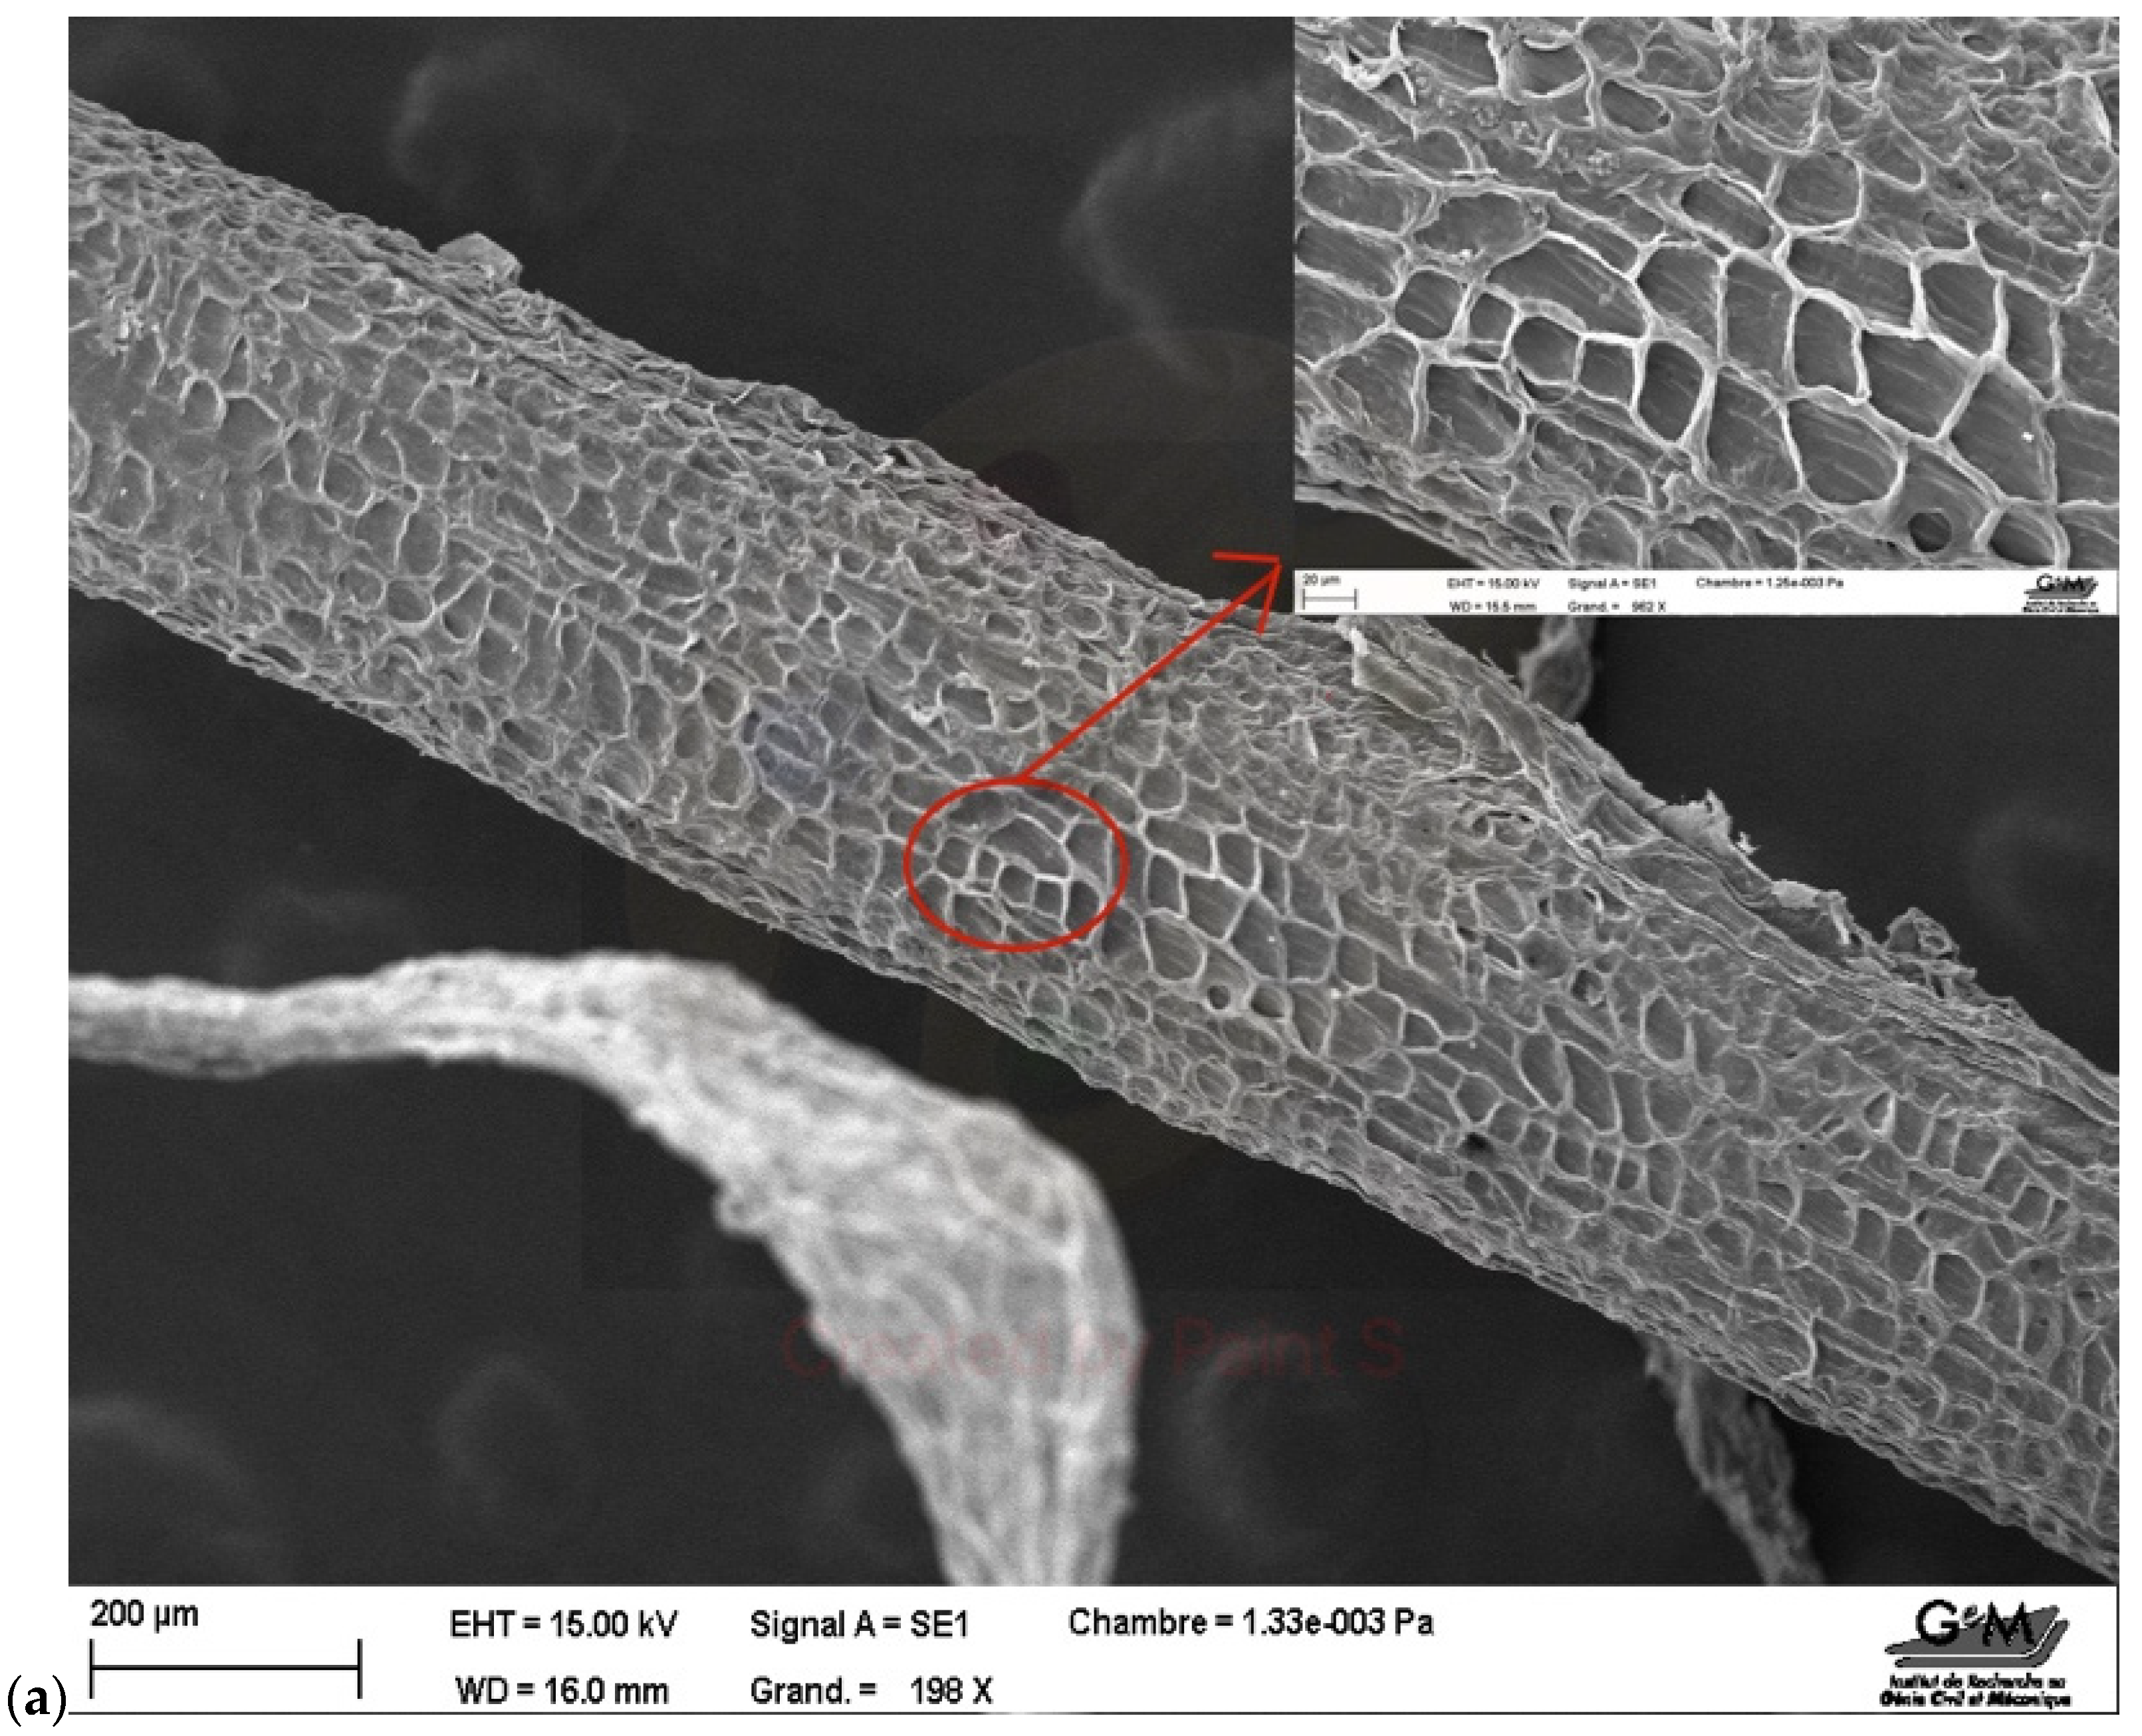
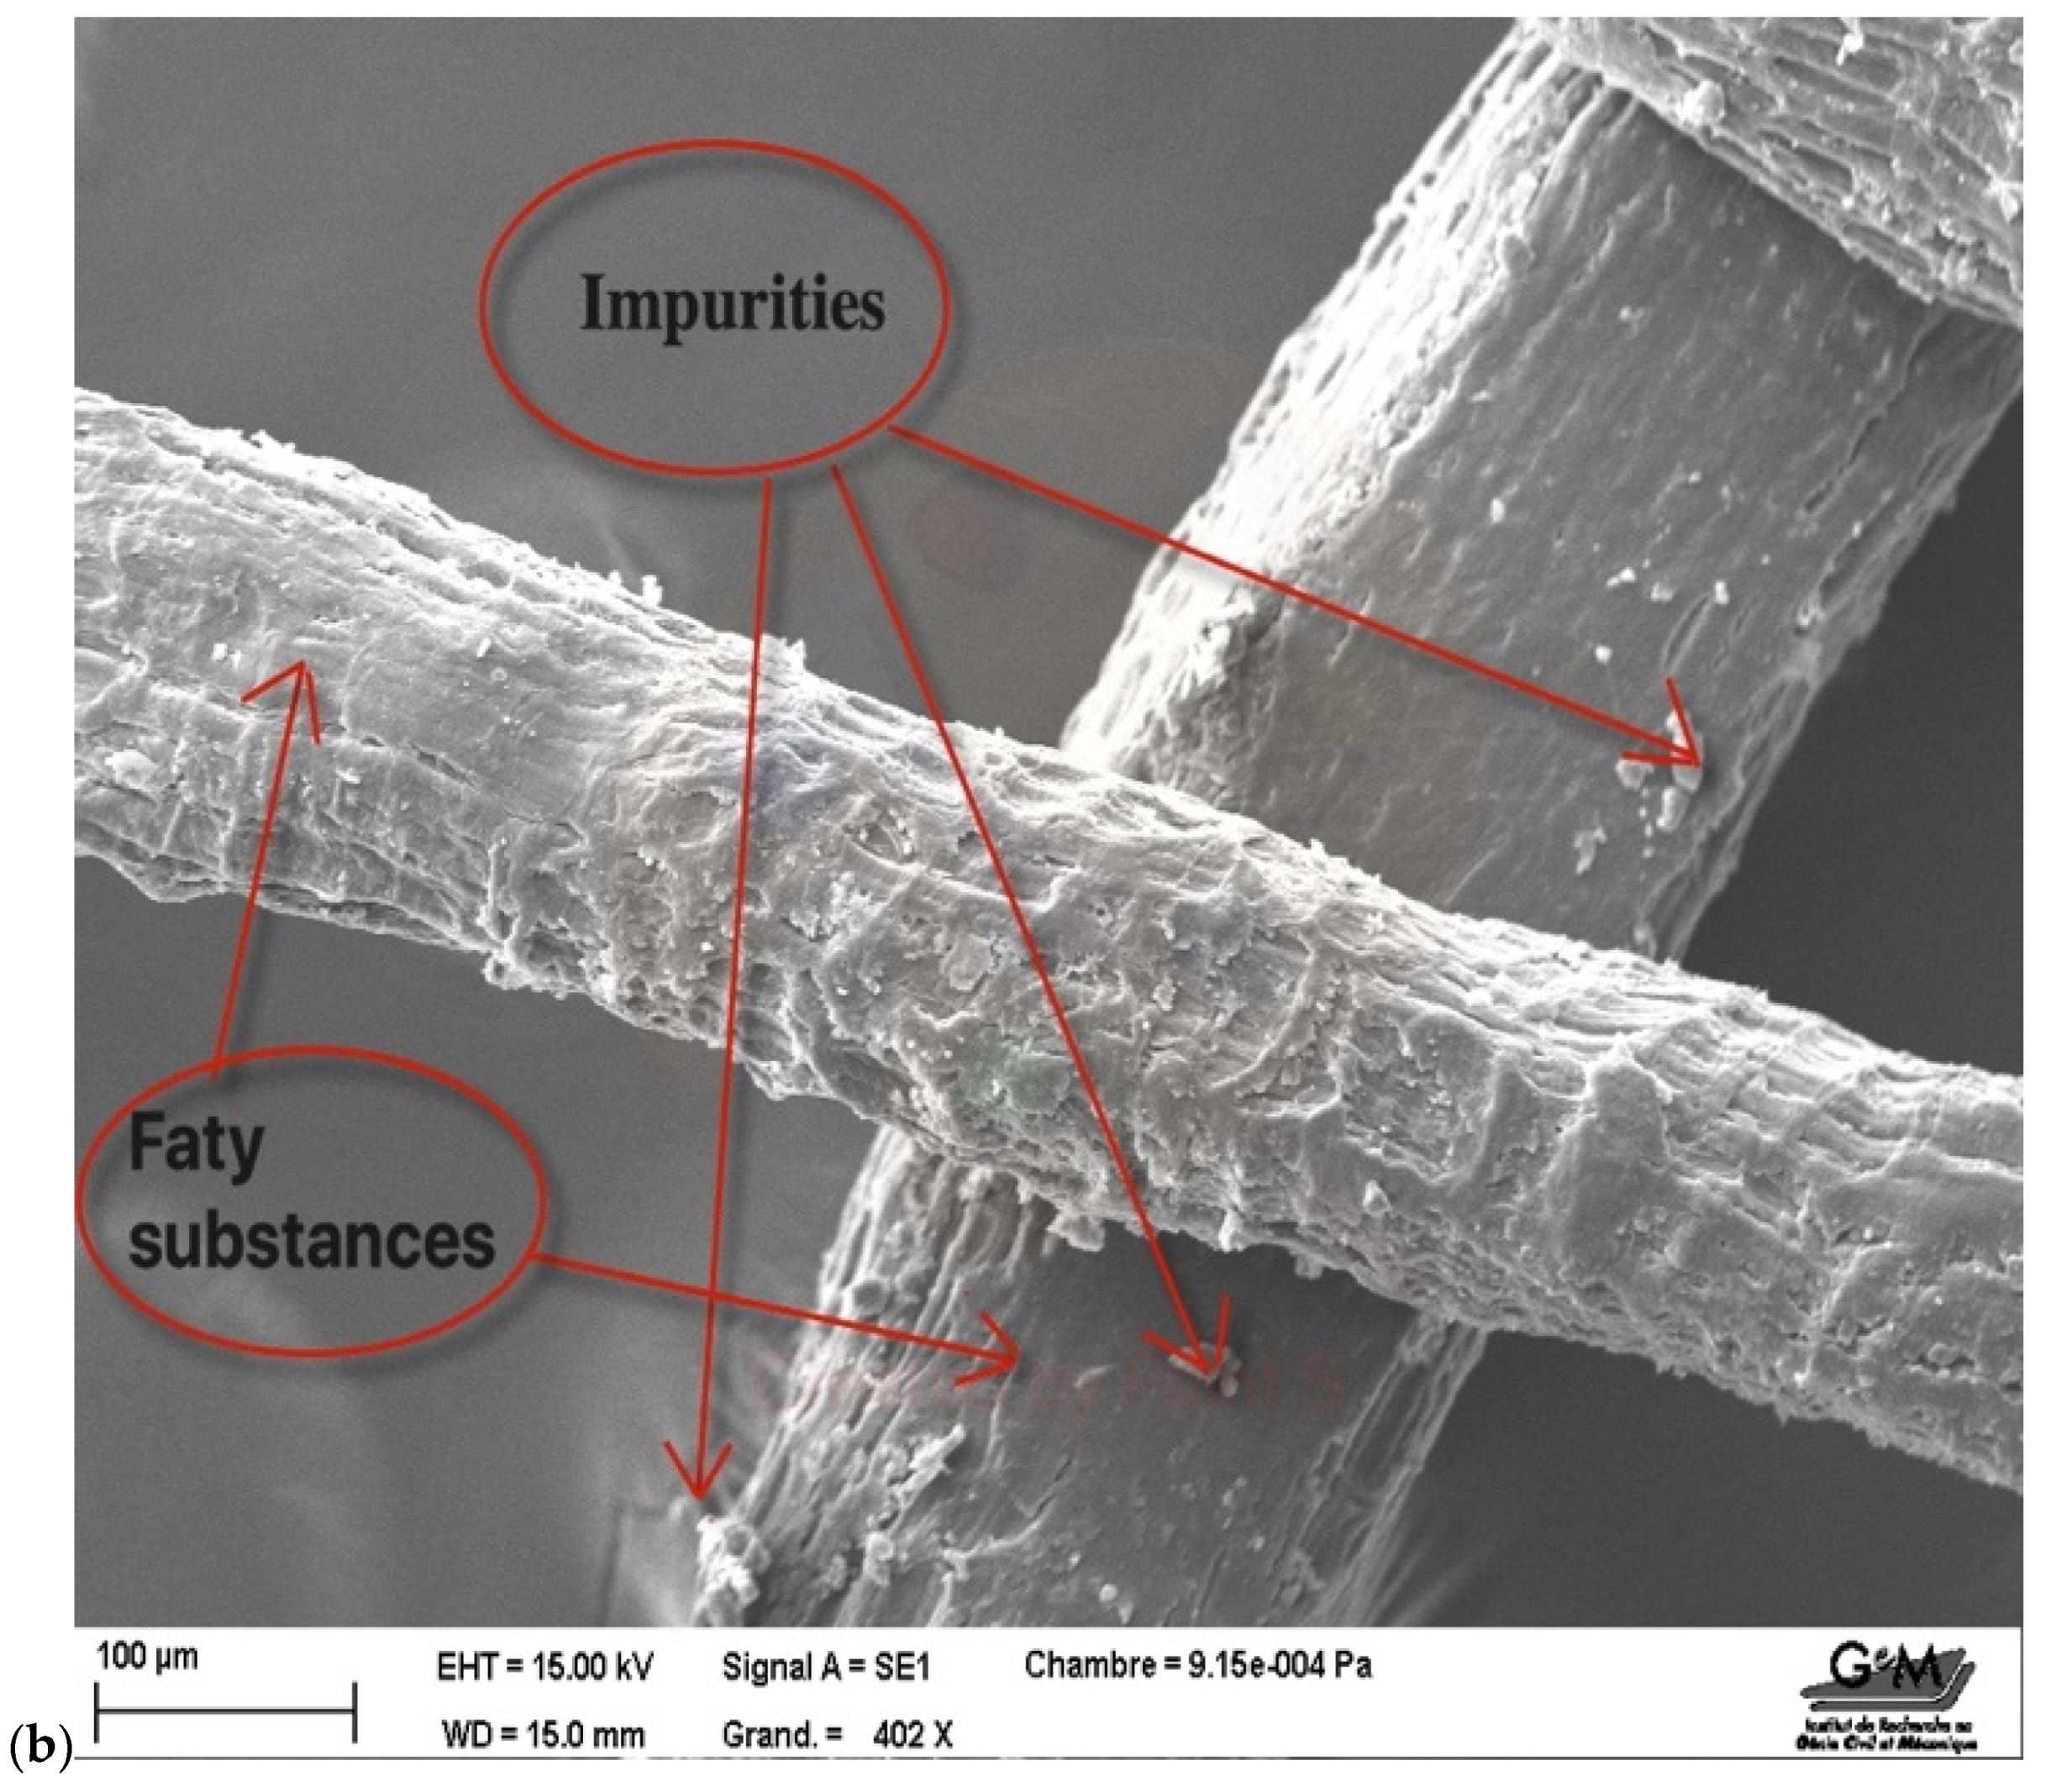
3.1. Effect of the Alkaline Treatment on the Fibers’ Morphology and Microstructure

From the diameter- and length-distribution examination, it was observed that the natural fiber diameter was uniform throughout the length, hence the average was considered (Figure 3a). The average values of the diameter distribution indicated that most fibers existed around 150 µm ± 5, whereas the length distribution showed that the average values of fiber length were 15 cm ± 5. The natural fibers exhibited a multi-cellular structure with a very porous surface. Additionally, to the surface pores, the fibers contained some impurities, as seen in Figure 3b. By performing the alkaline treatment on the fibers, an increase in the fiber’s volume and swelling was observed. The swelling resulted in a more uniform diameter along the length and a smoother fiber surface. This can be explained by the removal of cellulosic material contained in the BNF by the sodium hydroxide (NaOH) solution [53]. The treatment of the BNF by the sodium hydroxide (NaOH) solution removes hemicellulose and lignin primarily compared to other components like waxes and pectins.
Visual examination (in Figure 4) of the BNF at various treatment times reveals that within the first four hours of treatment, the color of the NaOH solution changes from light brown to very dark brown. The NaOH solution’s dark color was noted for the treatment at 4, 24, and 48 h. After 72 h, the solution’s colour usually becomes lighter again. This indicates that lignin and other impurities have been removed from the natural fiber. Lignin, a complex polymer that binds cellulose fibers together, needs to be eliminated to increase the fiber’s strength [54], absorbency [55], and dyeability [56]. This visual observation serves as a preliminary sign of the alkaline treatment process’s efficacy. As lignin and other impurities break down during alkaline treatment, the color lightens, making the fiber more resistant to additional manipulation. Nonetheless, the NaOH’s color shift from very dark brown to light brown after 72 h would suggest that no further impurities are being removed [9]. The degree of polymerization (DP) of cellulose, or the average number of glucose units in a cellulose chain, decreases because of the alkaline treatment. Impurities can hydrolyze, cross-link, or crystallize the cellulose fibres, resulting in a decrease, increase, or change in DP. Examples of these impurities are hemicellulose, lignin, phenolic compounds, water, and acid. Thus, the fiber’s absorbency and wettability are enhanced by the DP decrease, which creates a more porous and open fiber structure as seen in Figure 3. Verma reported that alkali infiltrates the amorphous region, causing the cellulose fibres to swell. Subsequently, the alkali diffuses laterally down the polymer chain, forming an alkali complex. After that, the alkali reaches the crystalline area and forms Na-Cell II, an antiparallel crystalline soda complex [57]. The following equation can describe the chemical reaction occurring:
B N F   O H + N a O H = B N F   O N a + H 2 O
Figure 4. Visual observation of the Borassus natural fiber at treatment times of (a) 1 h, (b) 2 h, (c) 4 h, and (d) 72 h, showing the alkaline solution’s change in color during the different treatment times.
Applsci 14 07540 g004

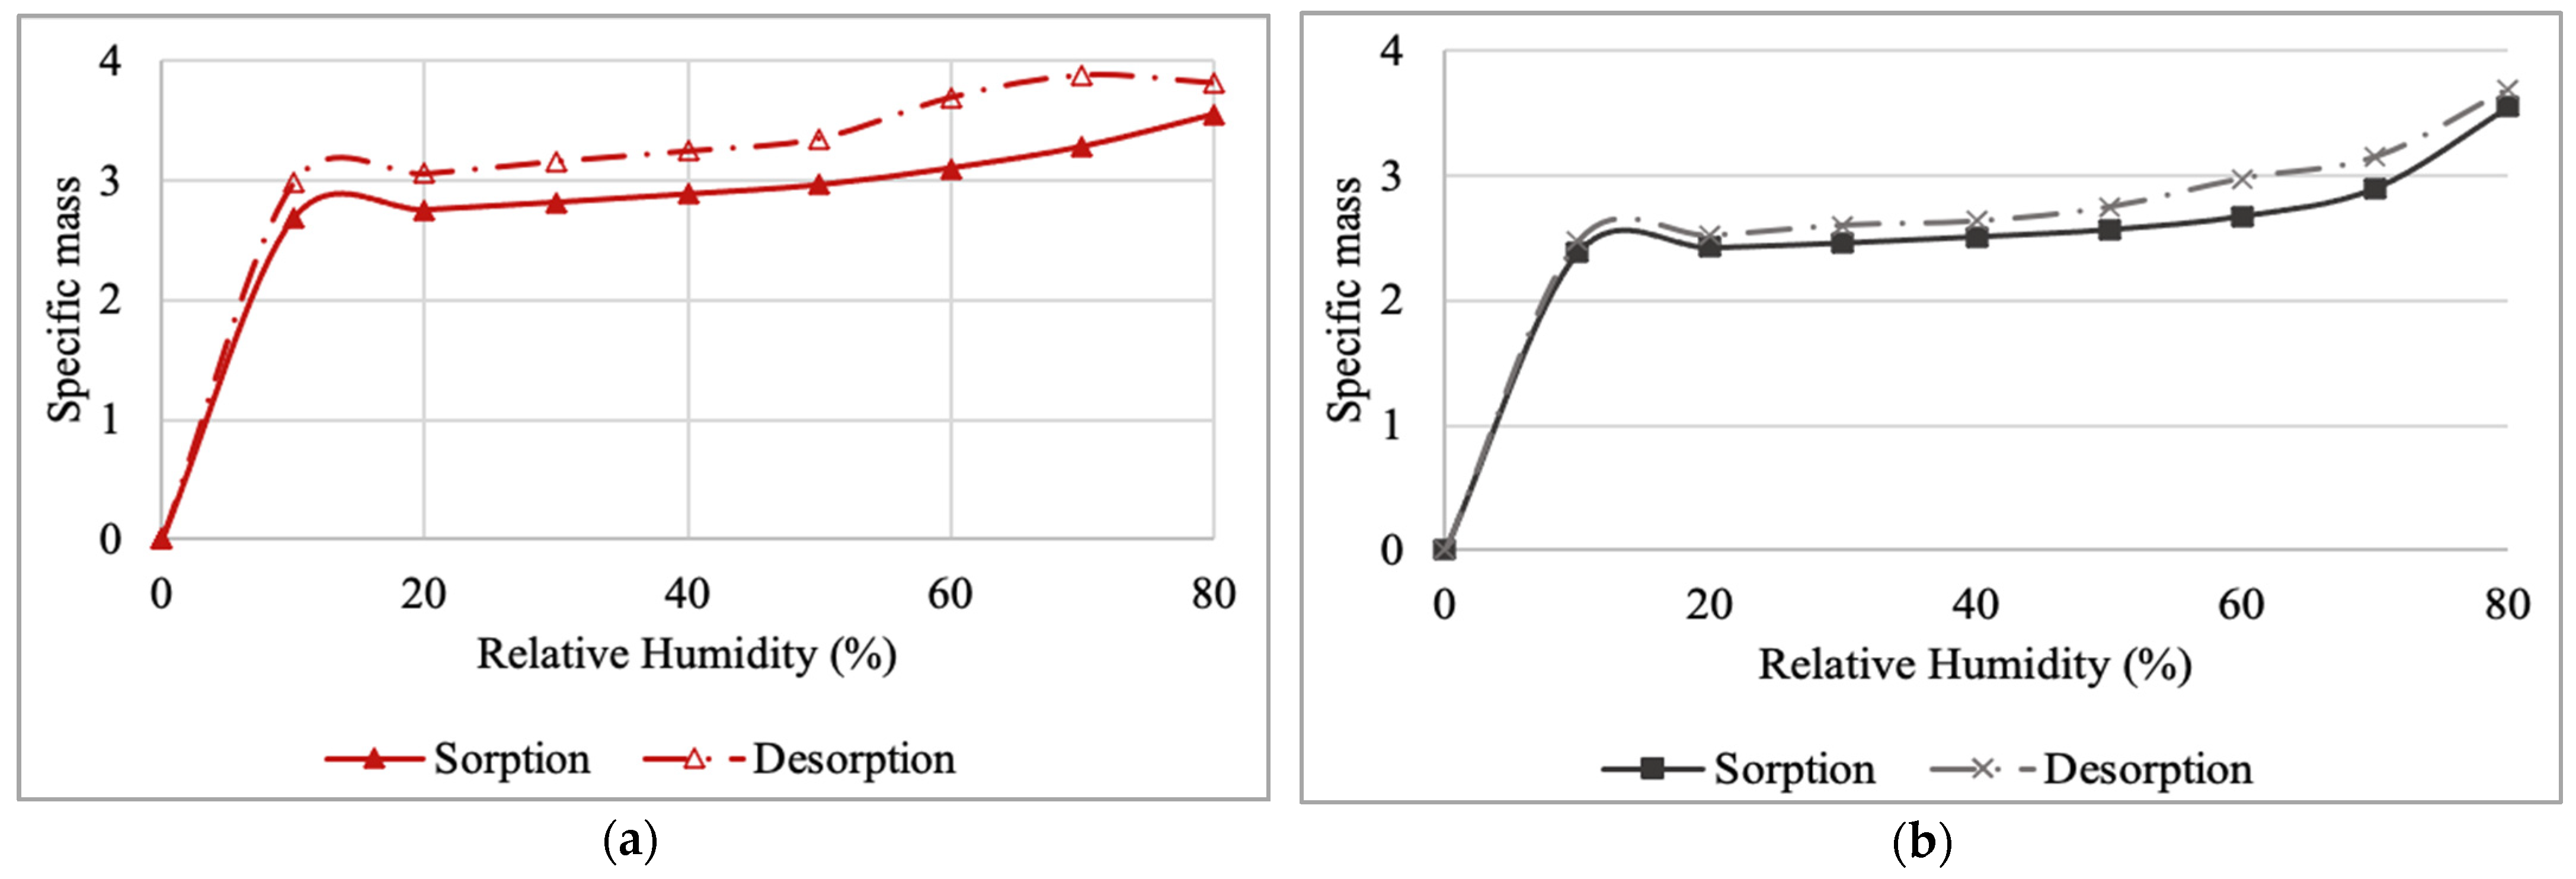
3.2. Sorption–Desorption Characteristics

Natural fibres’ specific absorption–desorption properties originate from their intrinsic characteristics. Water absorption results from the synthesis of hydrogen bonds between water molecules and the hydroxyl groups on the cellulose chains of natural fibres. The amount of water absorbed depends on several factors, including surface structure, porosity, crystallinity, and kinds of fiber. Natural fiber dynamic vapor sorption (DVS) isotherm data usually exhibit hysteresis, which indicates that the isotherms both of adsorption and desorption branches do not overlap. This is due to various factors, including capillary condensation, swelling, and the rearrangement of polymer chains. The extent of hysteresis is influenced by the fiber type, crystallinity, and porosity [58]. The untreated and treated Borassus fibers’ sorption and desorption curves are not entirely reversible, indicating that the way the fibers absorb water vapor differs from how they desorb that moisture. The intricate microstructure of the fiber, which is made up of cellulose microfibrils embedded in a hemicellulose and lignin matrix, might be the cause of this behavior [16]. The relationship between the amount of water vapor adsorbed onto the Borassus fiber and the equilibrium concentration of the water vapor is displayed by the sorption and desorption isotherm curves. The curves for treated and untreated Borassus fiber displayed an initial linear feature between 0–10% relative humidity (RH). A linear relationship between the amount of water vapor adsorbed and the RH in the range of 0–10% is demonstrated by the linearity at 0–10% RH shown to both treated and untreated fibres. This means that the specific mass (amount of water adsorbed per unit mass of fiber) increases proportionally with the RH. This linearity applies to both sorption and desorption. This information suggests that the Borassus fibers have a high affinity for water vapor at low RH levels [47]. They readily adsorb water vapor in this range, and the amount adsorbed is directly proportional to the humidity. This could be due to the presence of hydrophilic functional groups on the fiber’s surface that readily interact with water molecules [59]. Borassus fiber treated after 24 h displayed this linearity from 20% RH, unlike the various treated fibers that displayed it at 10% RH. The 24 h treatment might have altered the surface morphology of the Borassus fibers in a way that promotes uniform water adsorption across the RH range starting from 20%. This could lead to a linear relationship between RH and specific mass addition or dimensional change. After this linear region, both graphs displayed a sharper curve within a 10% RH range. This suggests a more rapid change in moisture content within this specific humidity range. The untreated Borassus fibers exhibited a more pronounced curve compared to the treated fibers. This implies that the treatment process affected the fibers’ moisture sorption and desorption differently. Following this sharp region, the graphs tend to flatten out, indicating a less dramatic change in moisture content as the RH continues to increase or decrease. Following this sharp region, the curves flatten out. However, another sharp peak arises at 60% RH and beyond. The sorption and desorption graphs of the untreated and treated fibers are not fully reversible, meaning that the manner the fibers absorb water vapor is not identical to the manner the fibers desorb that moisture. Hill and Norton reported that when a material is first dry, water is absorbed into it causing sorbed water layers to gradually fill the cell wall microcapillaries, while desorption happens from the water’s evaporated surface boundary in these microcapillaries [60]. Chen and Wangaard believed that variations in the contact angle between the sorbed water and the interior surface of the wood substance were the cause of the discrepancies between the adsorption and desorption loops [61]. While the forming water film is in touch with a non-wet surface during adsorption, the water film in the cell wall’s internal microcapillaries is in contact with a fully wet surface during the desorption cycle. The BNF swells in a humid environment, which causes internal strains to develop in the structure. For instance, natural fibers lose water as they dry, allowing for the observation of shrinkage [47]. Figure 5 shows the various sorption versus desorption behaviors.

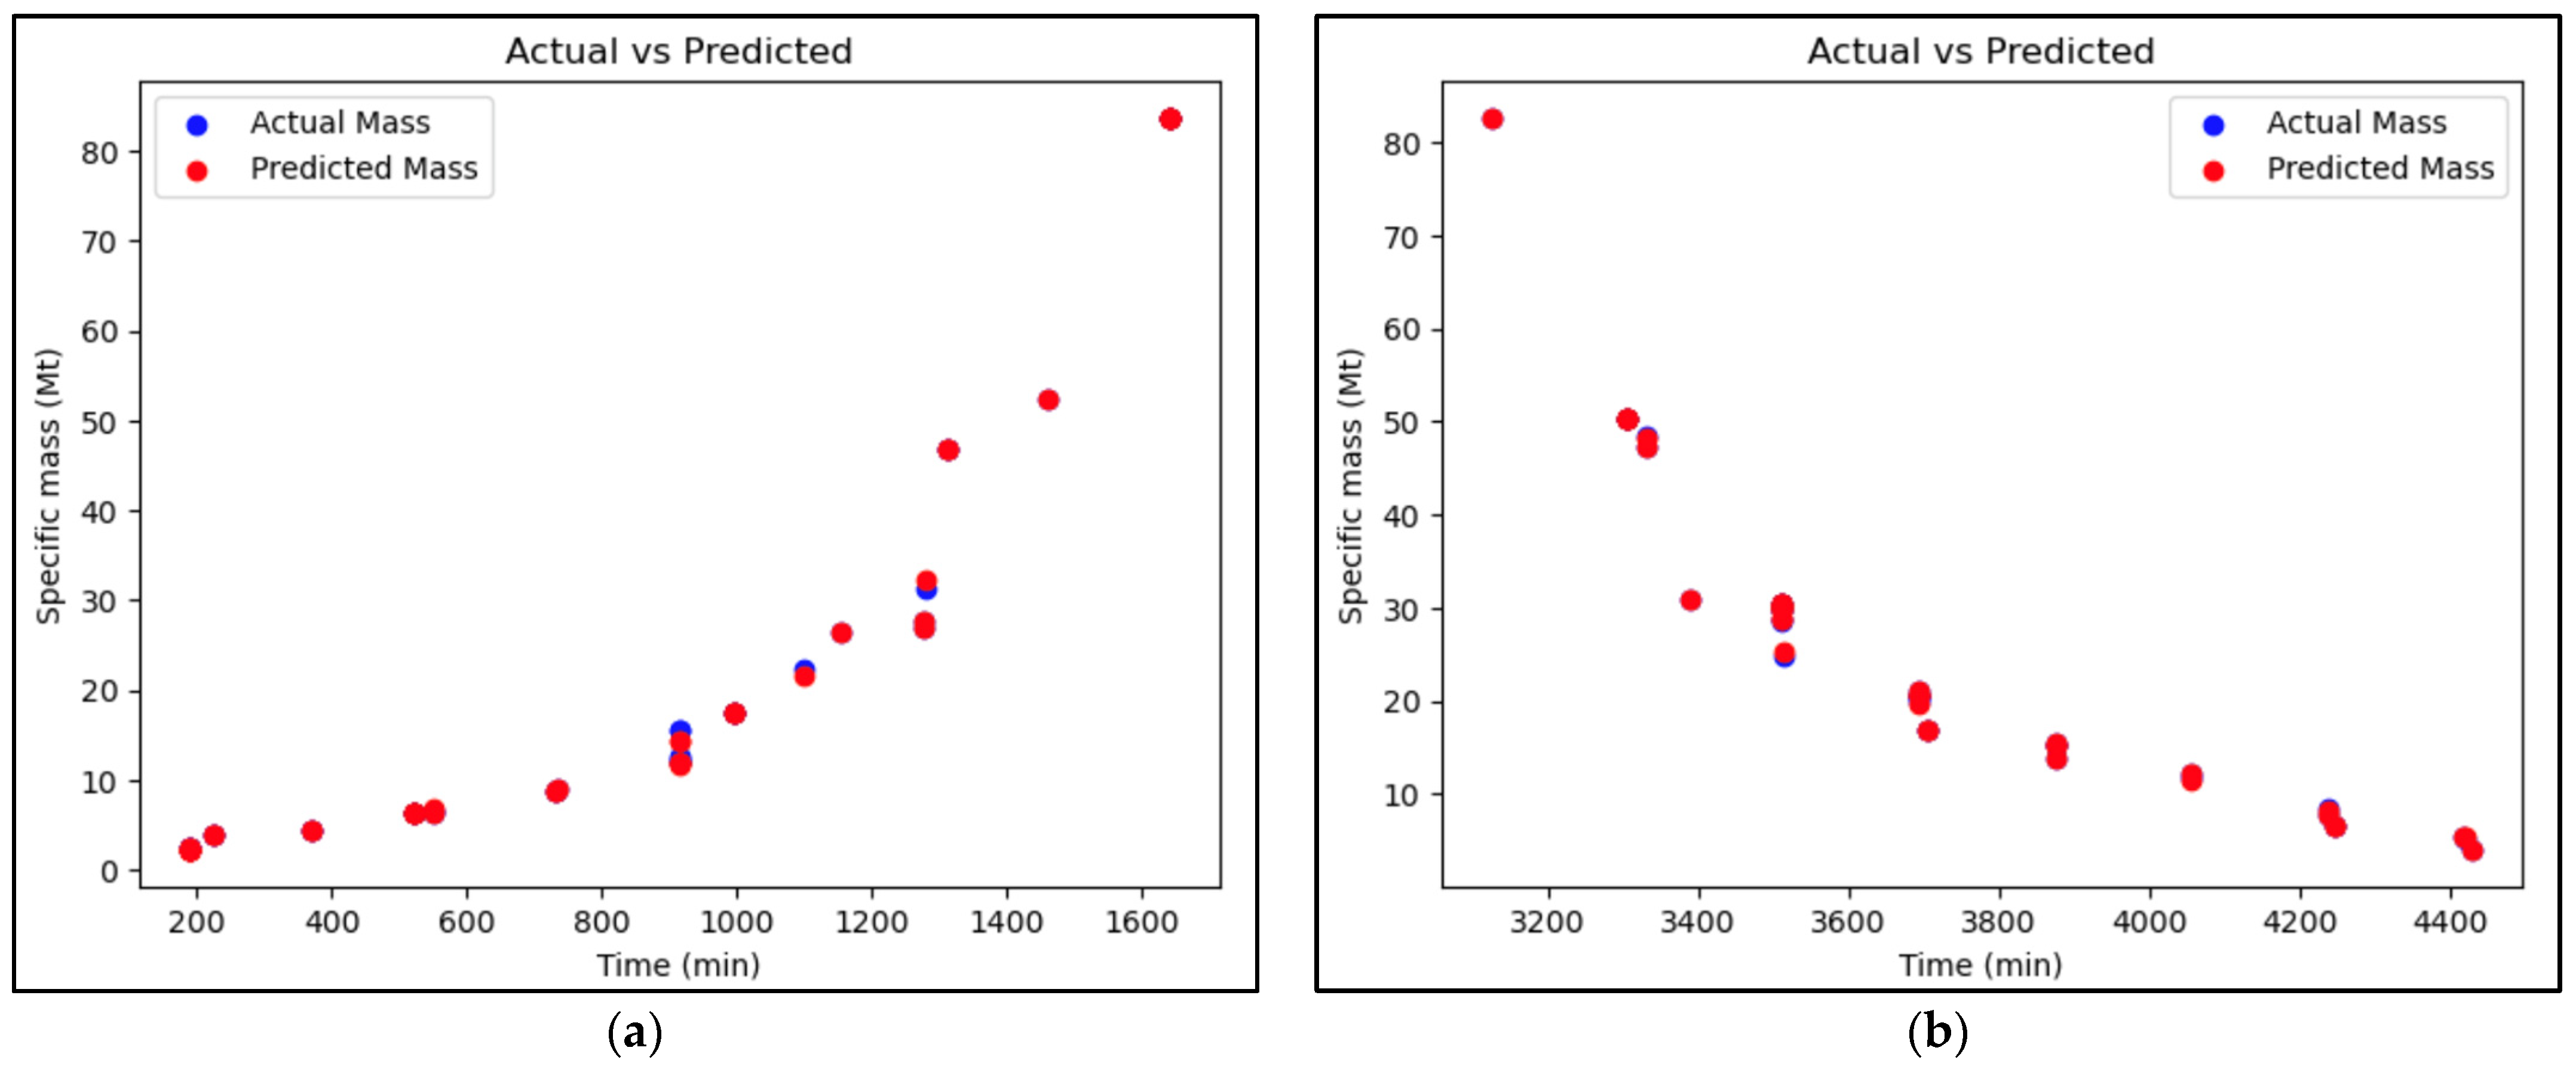
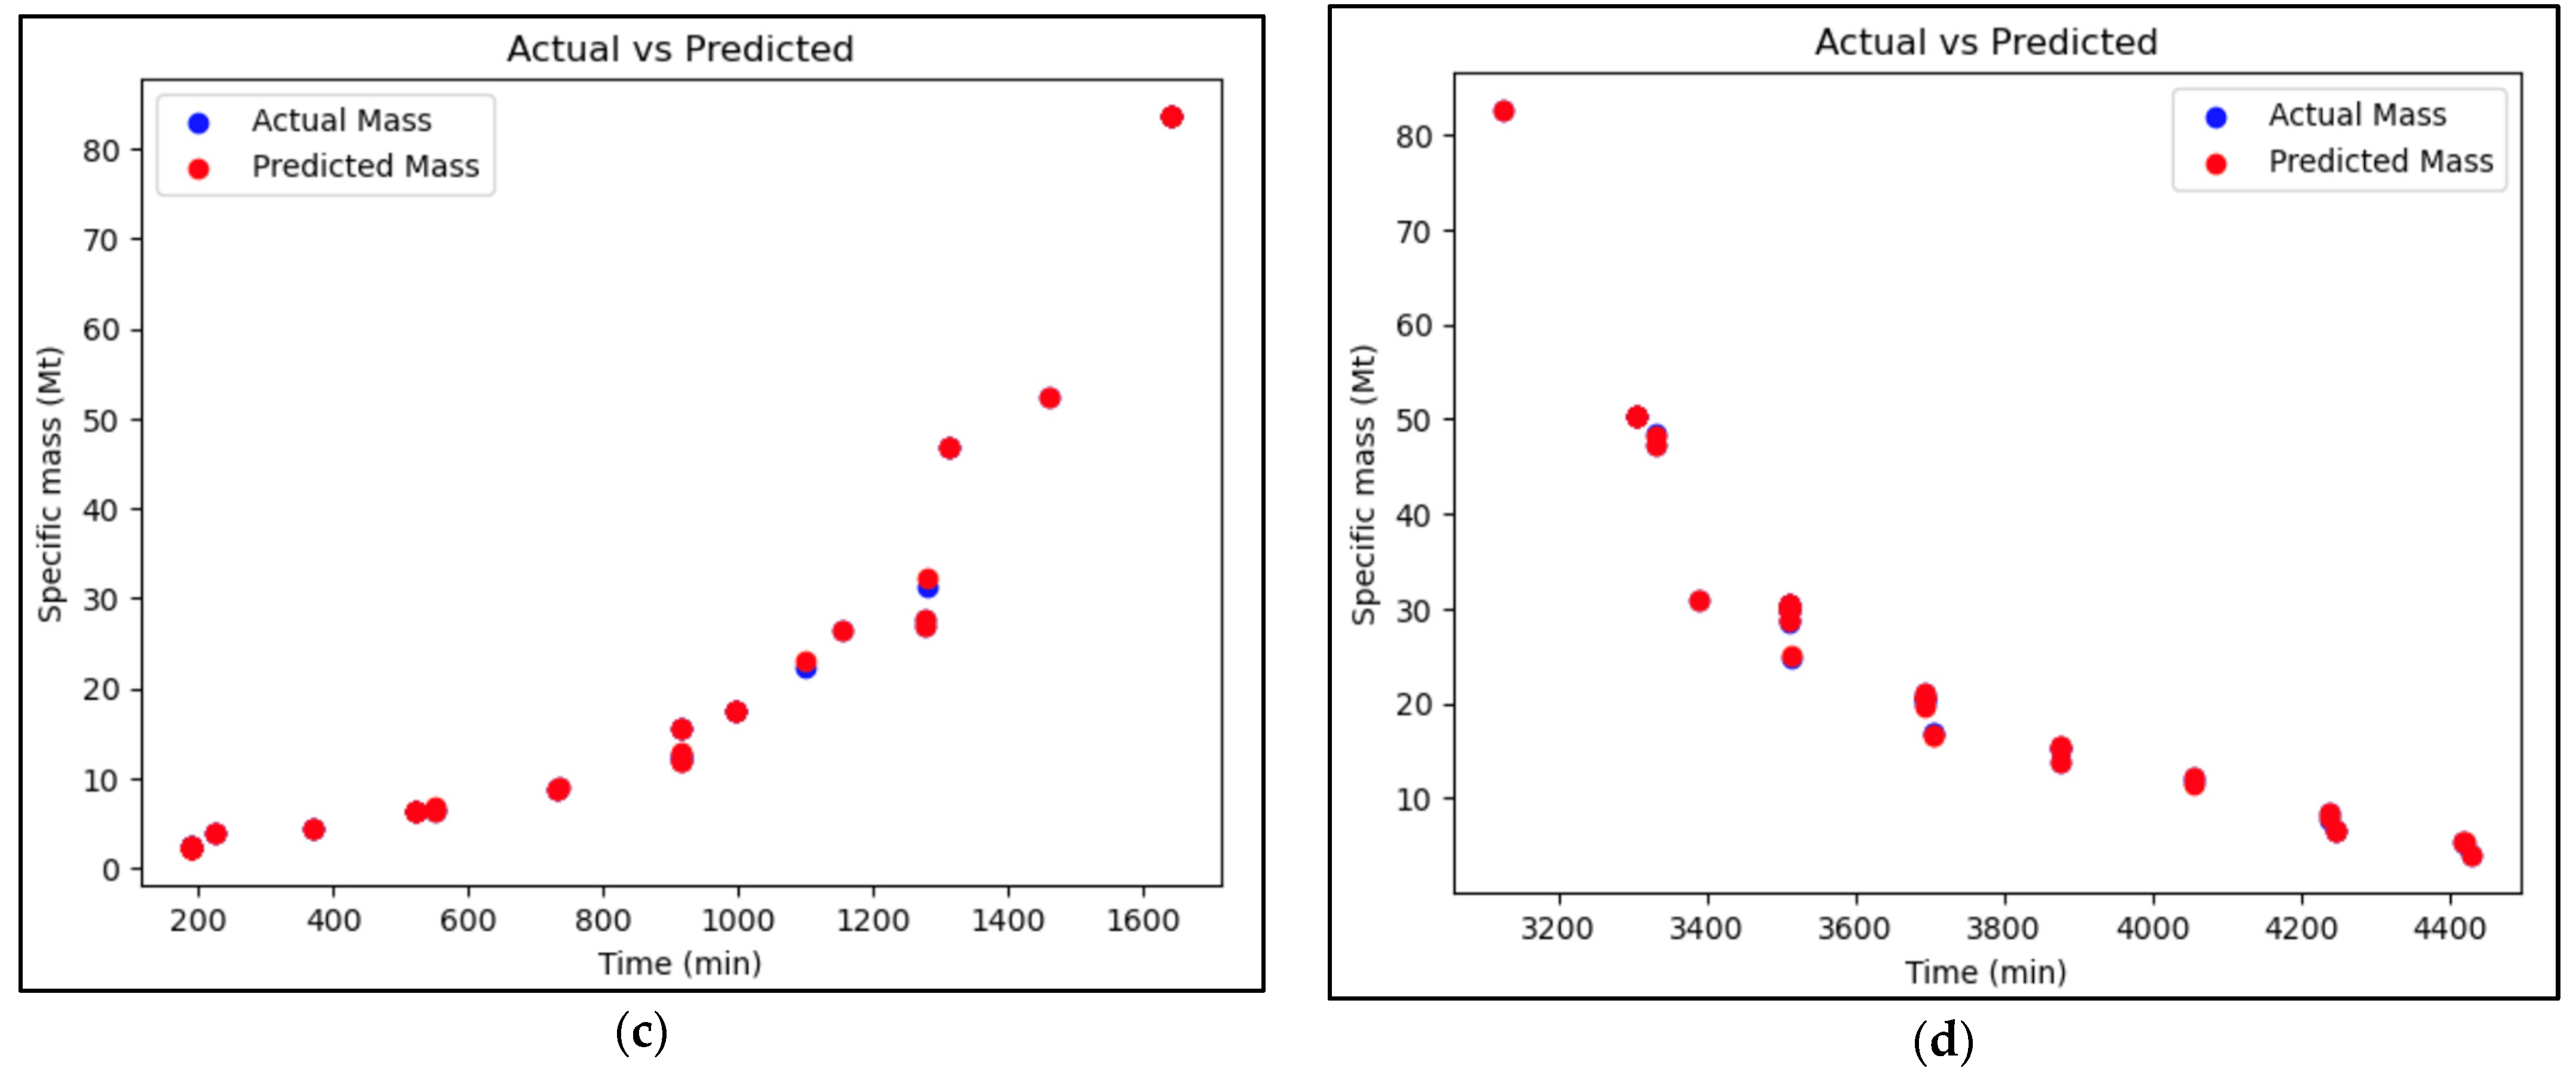
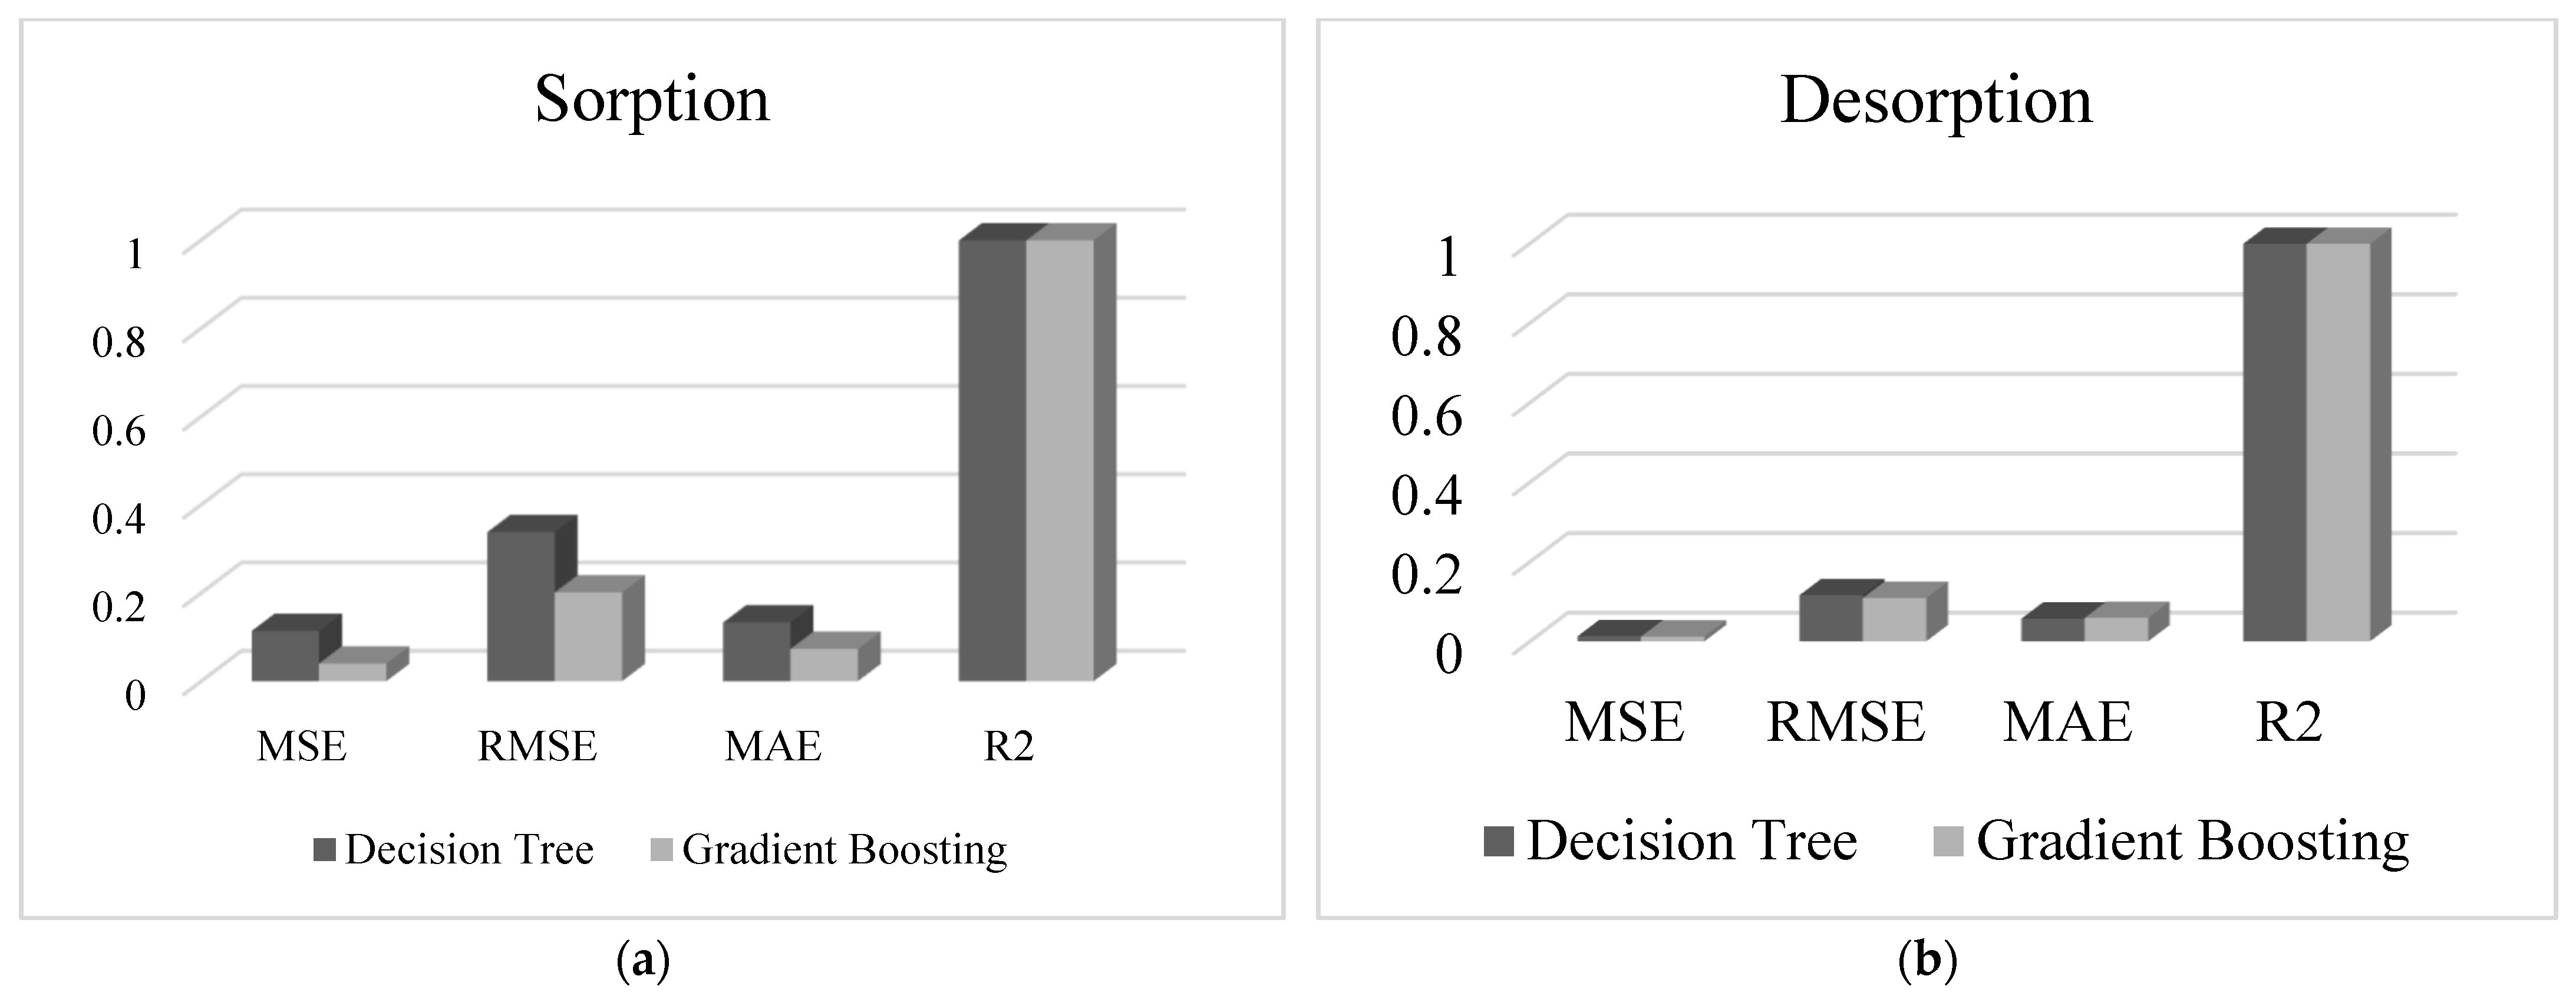
3.3. Comparative Assessment of DTR and GBR during the Forecasting Process

The results shown in Figure 6 corroborate that the testing, training, and validation of the GBR and DTR models for the predictions of the sorption and desorption of the BNF were successful. However, the performance of the models is accessed based on the results obtained from the evaluation metrics.
The results shown in Figure 7 represent the various evaluation metrics obtained from the GBR and DTR for the prediction of the sorption and desorption levels of the BNF. The Mean Absolute Errors were equal to 0.072 and 0.133 for the GBR and DTR. This signifies that both models indicated good prediction with a low MAE. Nevertheless, GBR displayed a lower MAE (0.072), indicating very good accuracy because a lower MAE is better. Therefore, GBR outperformed DTR in terms of the MAE metric during the prediction of the sorption level in the BNF. Meanwhile, during the desorption level prediction, both GBR and DTR depicted low MAE values of 0.059 and 0.057, respectively. Comparing the MAE of DTR during the prediction of the sorption and desorption level, there is a decrease from 0.133 to 0.057, indicating that DTR performed better when predicting the desorption compared to the sorption level’s prediction. The value of MAE varied from 0 to 0.08 when a tree-based model was used to predict the compressive strength of concrete [62]. These values are close to the present results. Nonetheless, there is an investigation where GBR and DT exhibited an MAE of 8.65 and 8.94, respectively [32]. That shows the significant difference in terms of the MAE results with our present work. The difference during these investigations was that different types of data were used (primary in our case and secondary dataset in the previous work), with different materials both conventional and unconventional (concrete in the previous study and natural fiber in the present).
The MSE for GBR and DTR demonstrated values of 0.04 and 0.114, respectively, during the sorption level’s prediction. The MSE measures the average of the squares of the errors, meaning the difference between the estimated values and the actual value [33]. Furthermore, an MSE of 0.04 for GBR confirms the small size of the errors for this model’s predictions of the sorption level. An MSE of 0.114 indicates that the squared errors are low for the DTR, contributing to the model’s effective performance. However, this value is higher than the one observed in GBR. The value of MSE is like the results obtained during the prediction of the photochemical ozone creation potential for the Life Cycle Assessment (LCA) [63]. However, during the prediction of the desorption level in the BNF, both models displayed low MSE 0.012 and 0.013 for GBR and DTR, respectively, which is another indication that the models are making good predictions. It is important to note that MSE penalizes large errors more than MAE, so a very low MSE suggests that the models are making predictions of the desorption close to the actual values of the desorption level in the BNF [33]. Subsequently, GBR displayed higher performance against DTR in terms of MSE evaluation during the prediction of the sorption level in the BNF.
Gradient boosting regressor and DTR models revealed an RMSE of 0.201 and 0.338, respectively, during the sorption level’s prediction. The RMSE provides a measure of how accurately the model predicts the sorption characteristics of the BNF [30]. An RMSE of 0.201 for the GBR indicates that the model’s predictions are quite similar to the actual values of the sorption, with a small average deviation. However, the RMSE of 0.338 exhibited by the DTR is high compared to the GBR. Henceforth, both GBR and DTR were efficient during the prediction of the sorption level of the BNF, and the highest efficiency was showcased by the GBR model. Moreover, the RMSE values for GBR and DTR models are 0.109 and 0.116, which is again very low, meaning both models performed very efficiently during the prediction of the desorption level in the BNF. However, these values are lower than the ones obtained during the prediction of the sorption level.
The value of R2 was equal to 0.999 for both GBR and DTR during the prediction of both sorption and desorption levels of the BNF. It is noteworthy to recall that R2 is a statistical measure that defines how well the regression predictions approximate the real data points [64]. An R2 of approximately 0.999 is exceptionally high, indicating that nearly 100% of the variability in the selected output is explained by the inputs used in both models. An R2 value of 1 indicates that the model explains all of the variance in the data, while an R2 of 0 indicates that the model explains none of the variance. That can be explained by the importance/significance of the input variables on the output [24]. Previously, a study using GB to predict the compressive strength obtained R2 of 0.97 and 0.96 during the training and testing, respectively. This shows the high performance of the GBR model during the prediction of the unconfined compressive strength of stabilized soil [65]. The similarity can be due to the unconventional nature of the matrix used in both studies: earth-based matrix. However, during the prediction of concrete’s compressive strength, both GBR and DTR displayed lower R2 (0.83 and 0.88, respectively) [32]. It follows that the input parameters and data points utilized to run the model have a direct impact on the models’ performance. That means that the sorption rate of the BNF is highly dependent on the temperature, humidity, duration of exposure, and mass. The results obtained from both models demonstrate an excellent fit of the models to our primary dataset.

4. Practical and Theoretical Implications with Examples to Enhance Decision-Making

Decision Tree Regression (DTR) and Gradient Boosting Regression (GBR) models have shown significant potential in predicting the hygroscopic properties of Borassus Natural Fiber (BNF). These models offer both practical and theoretical implications for the industry.
Theoretically, DTR and GBR models provide valuable insights into the relationships between various factors influencing BNF hygroscopic properties. DTR, for instance, can identify the most critical parameters affecting hygroscopicity through its decision rules, while GBR can capture complex nonlinear interactions between variables. By understanding these relationships, researchers can develop a deeper understanding of the underlying mechanisms governing BNF behavior.
Practically, these models have direct implications for the production and utilization of BNF. Accurate predictions of hygroscopic properties are essential for optimizing production and application processes. DTR models can be used to create simple, interpretable rules for rapid decision-making in the construction field, such as determining appropriate properties based on the application’s requirement. GBR models, on the other hand, can provide more precise predictions, aiding in the development of advanced composite systems for strengthening processes or the design of BNF formulations with desired hygroscopic properties.
To avoid problems like swelling or cracking, precise predictions of hygroscopicity, for instance, can assist in identifying the ideal moisture content for composite manufacturing. Additionally, choosing the right raw materials to create composites from BNF with appropriate characteristics can be influenced by considering how the various components affect hygroscopicity. In the end, these models help to increase the sustainability and efficiency of BNF manufacturing and utilization. Some examples of the impact on the decision-making process are shown in Table 5.

5. Conclusions

During this investigation, fibers were extracted manually and chemical-free from the Borassus fruit. Alkaline treatment or mercerization was conducted on the natural fiber to improve its properties. The treatment might have introduced functional groups onto the fiber surface that interacted with water molecules in a specific way, leading to a linear dependence on relative humidity (RH).
This research contributes to the understanding of BNF behavior, particularly its hygroscopic properties. By demonstrating the effectiveness of GBR and DTR models in predicting these properties, it offers a novel approach to characterizing natural fibers.
The key findings of the investigation can be compiled as:
  • Borassus fruit fibers exhibit hysteresis in moisture absorption and desorption, influenced by their cellular structure.
  • Alkaline treatment alters fiber morphology, leading to increased porosity and a more uniform diameter.
  • GBR and DTR models accurately predict the hygroscopic properties of both treated and untreated fibers.
  • GBR outperforms DTR in terms of model-fit metrics (R2, MSE, RMSE, and MAE)
The implications of the study can be summarized as follows:
  • Practical Applications: The developed models can be used to optimize the production and application of Borassus fruit-based materials, leading to improved product performance and reduced costs.
  • Research Advancement: The findings provide a foundation for further research into the relationship between fiber structure, chemical treatment, and hygroscopic behavior.
  • Industry Impact: The study offers a potential alternative to traditional, time-consuming methods for characterizing fiber properties, contributing to the development of more sustainable and cost-effective materials.
By accurately predicting hygroscopic properties, this research enables the development of BNF composites with enhanced dimensional stability and tailored properties for specific applications in the construction industry.

6. Possible Directions for Future Studies

This study’s main focus was on the potential of BNF as a sustainable material by exploring the fiber’s morphological and hygroscopic properties. A more thorough assessment of mechanical properties, including modulus of elasticity, tensile strength, and flexural strength, would offer a more complete understanding of the fiber’s engineering potential. Furthermore, because the study was conducted on a small scale, additional research is required to validate the results on a larger sample size. Moreover, while the GBR and DTR models demonstrated promising results in predicting hygroscopic properties, their performance could be enhanced by incorporating additional parameters and exploring other machine-learning algorithms. A deeper investigation into the relationship between hygroscopic behavior and fiber microstructure could also provide valuable insights.
The challenges and limitations encountered during this study can be summarised:
  • The manual extraction of fibers may introduce inconsistencies in fiber purity and damage the fiber structure.
  • Data variability as natural fibers exhibit variable intrinsic properties
  • The ML models may not be optimal for all types of fibers and experimental data.
These challenges and limitations can be addressed by developing a detailed extraction procedure where parameters such as extraction time, force, and equipment will be included. Implement rigorous quality-control processes to measure the fibers’ various features (purity, dimension). Proceed to extensive sampling to consider parameters such as fiber types, conditions, etc. Develop machine-learning techniques such ensemble learning or deep learning to handle the various parameters of the fibers.
Future research should focus on:
  • Expanding the characterization of Borassus fruit fiber to include mechanical properties, thermal properties, and chemical composition.
  • Developing scalable and efficient extraction processes for large-scale fiber production.
  • Enhancing the predictive capabilities of the models by incorporating more data and exploring other machine-learning techniques.

Author Contributions

Conceptualization, A.A.M., M.M.B. and N.L.; Data curation, A.C.; Formal analysis, A.C. and N.L.B.; Funding acquisition, A.A.M.; Investigation, A.A.M. and N.L.B.; Methodology, A.A.M., A.C., I.I.O., T.T.S. and H.S.J.; Resources, N.L.B.; Supervision, M.M.B., N.L. and H.S.J.; Validation, A.A.M., M.M.B. and T.T.S.; Writing—original draft, A.A.M., I.I.O. and T.T.S.; Writing—review and editing, N.L., I.I.O. and H.S.J. All authors have read and agreed to the published version of the manuscript.

Funding

This research was funded by the L’Oréal-UNESCO for Women in Science, a postdoctoral fellowship for the Sub-Saharan Africa region young talents 2022.

Institutional Review Board Statement

Not applicable.

Informed Consent Statement

Not applicable.

Data Availability Statement

The data presented in this study are available on request from the corresponding author after obtaining permission of an authorized person.

Acknowledgments

The authors gratefully acknowledge the Pan African Materials Institute (PAMI), the African Bank of Development (AfDB), the African University of Science and Technology (AUST), and the Institut de recherche en Genie Civil et Mecanique (GeM) Interactions Eau-Geomateriaux research group.

Conflicts of Interest

The authors declare no conflicts of interest.

References

  1. Mahamat, A.A.; Bih, N.L.; Ayeni, O.; Onwualu, P.A.; Savastano, H.; Soboyejo, W.O. Development of Sustainable and Eco-Friendly Materials from Termite Hill Soil Stabilized with Cement for Low-Cost Housing in Chad. Buildings 2021, 11, 86. [Google Scholar] [CrossRef]
  2. Reddy, K.O.; Guduri, B.R.; Rajulu, A.V. Structural characterization and tensile properties of Borassus fruit fibers. J. Appl. Polym. Sci. 2009, 114, 603–611. [Google Scholar] [CrossRef]
  3. Mahamat, A.A.; Leklou, N.; Obianyo, I.I.; Poullain, P.; Stanislas, T.T.; Ayeni, O.; Bih, N.L.; Savastano, H. Assessment of hygrothermal and mechanical performance of alkali activated Borassus fiber reinforced earth-based bio-composite. J. Build. Eng. 2022, 62, 105411. [Google Scholar] [CrossRef]
  4. Reddy, K.O.; Shukla, M.; Maheswari, C.U.; Rajulu, A.V. Mechanical and physical characterization of sodium hydroxide treated Borassus fruit fibers. J. For. Res. 2012, 23, 667–674. [Google Scholar] [CrossRef]
  5. Sudhakara, P.; Reddy, K.O.; Prasad, C.V.; Jagadeesh, D.; Kim, H.; Kim, B.; Bae, S.; Song, J. Studies on Borassus fruit fiber and its composites with Polypropylene. Compos. Res. 2013, 26, 48–53. [Google Scholar] [CrossRef]
  6. Megalingam, A.; Kumar, M.; Sriram, B.; Jeevanantham, K.; Vishnu, P.R. Borassus fruit fiber reinforced composite: A review. Mater. Today Proc. 2021, 45, 723–728. [Google Scholar] [CrossRef]
  7. Morton, J. Notes on Distribution, Propagation, and Products of Borassus Palms (Arecaceae). Econ. Bot. 1988, 3, 420–441. [Google Scholar] [CrossRef]
  8. Mahamat, A.A.; Dayyabu, A.; Sanusi, A.; Ado, M.; Obianyo, I.I.; Stanislas, T.T.; Bih, N.L. Dimensionnal stability and strength appraisal of termite hill soil stabilisation using hybrid bio-waste and cement for eco-friendly housing. Heliyon 2022, 8, e09406. [Google Scholar] [CrossRef]
  9. Farahani, G.N.; Ahmad, I.; Mosadeghzad, Z. Effect of Fiber Content, Fiber Length and Alkali Treatment on Properties of Kenaf Fiber/UPR Composites Based on Recycled PET Wastes. Polym. Technol. Eng. 2012, 51, 634–639. [Google Scholar] [CrossRef]
  10. Kubat, M. An Introduction to Machine Learning; Springer Nature: Dordrecht, The Netherlands, 2017. [Google Scholar]
  11. Weber, M.; Borcherding, K. Behavioral influences on weight judgments in multiattribute decision making. Eur. J. Oper. Res. 1993, 67, 1–12. [Google Scholar] [CrossRef]
  12. AlKhereibi, A.H.; Wakjira, T.G.; Kucukvar, M.; Onat, N.C. Predictive Machine Learning Algorithms for Metro Ridership Based on Urban Land Use Policies in Support of Transit-Oriented Development. Sustainability 2023, 15, 1718. [Google Scholar] [CrossRef]
  13. Pamučar, D.; Stević, Ž.; Sremac, S. A New Model for Determining Weight Coefficients of Criteria in MCDM Models: Full Consistency Method (FUCOM). Symmetry 2018, 10, 393. [Google Scholar] [CrossRef]
  14. Sabziparvar, A.; Boulos, L.; Foruzanmehr, M.R. Effect of fiber length and treatments on the hygroscopic properties of milkweed fibers for superabsorbent applications. Environ. Technol. Innov. 2022, 28, 102930. [Google Scholar] [CrossRef]
  15. Obianyo, I.I.; Onwualu, A.P.; Mahamat, A.A. Evaluation of Predictive Models for Mechanical Properties of Earth-Based Composites for Sustainable Building Applications. In New Advances in Soft Computing in Civil Engineering, AI-Based Optimization and Prediction; Bekdaş, G., Nigdeli, S.M., Eds.; in Studies in Systems, Decision and Control; Springer Nature: Cham, Switzerland, 2024; Volume 547, pp. 179–190. [Google Scholar] [CrossRef]
  16. Célino, A.; Fréour, S.; Jacquemin, F.; Casari, P. The hygroscopic behavior of plant fibers: A review. Front. Chem. 2014, 1, 43. [Google Scholar] [CrossRef]
  17. El Hachem, Z.; Célino, A.; Challita, G.; Moya, M.-J.; Fréour, S. Hygroscopic multi-scale behavior of polypropylene matrix reinforced with flax fibers. Ind. Crop. Prod. 2019, 140, 111634. [Google Scholar] [CrossRef]
  18. Obianyo, I.I.; Auta, J.T.; Sciacca, D.; Mahamat, A.A.; Kelechi, S.E.; Onwualu, A.P. Machine learning models for predicting the compressive strength of agro-waste stabilized bricks for sustainable buildings. Discov. Civ. Eng. 2024, 1, 45. [Google Scholar] [CrossRef]
  19. Gadagi, A.; Sivaprakash, B.; Adake, C.; Deshannavar, U.; Hegde, P.G.; Santhosh, P.; Osman, A.I. Epoxy composite reinforced with jute/basalt hybrid—Characterisation and performance evaluation using machine learning techniques. Compos. Part C Open Access 2024, 14, 100453. [Google Scholar] [CrossRef]
  20. Lee, S.; Vo, T.P.; Thai, H.-T.; Lee, J.; Patel, V. Strength prediction of concrete-filled steel tubular columns using Categorical Gradient Boosting algorithm. Eng. Struct. 2021, 238, 112109. [Google Scholar] [CrossRef]
  21. Ma, H.; Liu, J.; Zhang, J.; Huang, J. Estimating the Compressive Strength of Cement-Based Materials with Mining Waste Using Support Vector Machine, Decision Tree, and Random Forest Models. Adv. Civ. Eng. 2021, 2021, 6629466. [Google Scholar] [CrossRef]
  22. Taallah, B.; Guettala, A.; Guettala, S.; Kriker, A. Mechanical properties and hygroscopicity behavior of compressed earth block filled by date palm fibers. Constr. Build. Mater. 2014, 59, 161–168. [Google Scholar] [CrossRef]
  23. Stanislas, T.T.; Komadja, G.C.; Obianyo, I.I.; Ayeni, O.; Mahamat, A.A.; Tendo, J.F.; Junior, H.S. Multivariate regression approaches to predict the flexural performance of cellulose fibre reinforced extruded earth bricks for sustainable buildings. Clean. Mater. 2023, 7. [Google Scholar] [CrossRef]
  24. Mahamat, A.A.; Boukar, M.M.; Ibrahim, N.M.; Stanislas, T.T.; Bih, N.L.; Obianyo, I.I.; Savastano, H. Machine Learning Approaches for Prediction of the Compressive Strength of Alkali Activated Termite Mound Soil. Appl. Sci. 2021, 11, 4754. [Google Scholar] [CrossRef]
  25. Wei, W.; Zhang, C.; Deng, D. Content Estimation of Foreign Fibers in Cotton Based on Deep Learning. Electronics 2020, 9, 1795. [Google Scholar] [CrossRef]
  26. Neo, P.K.; Leong, Y.W.; Soon, M.F.; Goh, Q.S.; Thumsorn, S.; Ito, H. Development of a Machine Learning Model to Predict the Color of Extruded Thermoplastic Resins. Polymers 2024, 16, 481. [Google Scholar] [CrossRef] [PubMed]
  27. Ali, M.; Kumar, S.; Pal, R.; Singh, M.K.; Saini, D. Graph- and Machine-Learning-Based Texture Classification. Electronics 2023, 12, 4626. [Google Scholar] [CrossRef]
  28. Pawlak, T.; Pilarska, A.A.; Przybył, K.; Stangierski, J.; Ryniecki, A.; Cais-Sokolińska, D.; Pilarski, K.; Peplińska, B. Application of Machine Learning Using Color and Texture Analysis to Recognize Microwave Vacuum Puffed Pork Snacks. Appl. Sci. 2022, 12, 5071. [Google Scholar] [CrossRef]
  29. Alam, S.; Sultana, N.; Hossain, S.Z. Bayesian optimization algorithm based support vector regression analysis for estimation of shear capacity of FRP reinforced concrete members. Appl. Soft Comput. 2021, 105, 107281. [Google Scholar] [CrossRef]
  30. Mahamat, A.A.; Boukar, M.M.; Leklou, N.; Obianyo, I.I.; Stanislas, T.T.; Bih, N.L.; Ayeni, O.; Ibrahim, N.M.; Savastano, H. A Machine Learning Led Investigation Predicting the Thermos-mechanical Properties of Novel Waste-based Composite in Construction. Waste Biomass Valorization 2024, 15, 5445–5461. [Google Scholar] [CrossRef]
  31. Shang, M.; Li, H.; Ahmad, A.; Ahmad, W.; Ostrowski, K.A.; Aslam, F.; Joyklad, P.; Majka, T.M. Predicting the Mechanical Properties of RCA-Based Concrete Using Supervised Machine Learning Algorithms. Materials 2022, 15, 647. [Google Scholar] [CrossRef]
  32. Ahmad, A.; Ostrowski, K.A.; Maślak, M.; Farooq, F.; Mehmood, I.; Nafees, A. Comparative Study of Supervised Machine Learning Algorithms for Predicting the Compressive Strength of Concrete at High Temperature. Materials 2021, 14, 4222. [Google Scholar] [CrossRef]
  33. Mahamat, A.A.; Boukar, M.M. On the Use of Machine Learning Technique to Appraise Thermal Properties of Novel Earthen Composite for Sustainable Housing in Sub-Saharan Africa. In Innovations and Interdisciplinary Solutions for Underserved Areas; Springer: Cham, Switzerland, 2023; pp. 161–170. [Google Scholar]
  34. Spiegel, M.R.; Stephens, L.J. Schaum’s Outline of Statistics, 4th ed.; McGraw-Hill: New York, NY, USA, 2008. [Google Scholar] [CrossRef]
  35. Shao, Q.; Zhang, W.; Cao, X.; Yang, J.; Yin, J. Threshold and moderating effects of land use on metro ridership in Shenzhen: Implications for TOD planning. J. Transp. Geogr. 2020, 89, 102878. [Google Scholar] [CrossRef]
  36. Priya, K.S. Linear Regression Algorithm in Machine Learning through MATLAB. Int. J. Res. Appl. Sci. Eng. Technol. 2021, 9, 989–995. [Google Scholar] [CrossRef]
  37. Bentéjac, C.; Csörgő, A.; Martínez-Muñoz, G. A comparative analysis of gradient boosting algorithms. Artif. Intell. Rev. 2021, 54, 1937–1967. [Google Scholar] [CrossRef]
  38. Le, H.-A.; Le, D.-A.; Le, T.-T.; Le, H.-P.; Hoang, H.-G.T.; Nguyen, T.-A. An Extreme Gradient Boosting approach to estimate the shear strength of FRP reinforced concrete beams. Structures 2022, 45, 1307–1321. [Google Scholar] [CrossRef]
  39. Pishro, A.A.; Zhang, S.; Hu, Q.; Zhang, Z.; Pishro, M.A.; Zhang, L.; L’hostis, A.; Hejazi, F.; Liu, Y.; Zhao, Y. Advancing ultimate bond stress–slip model of UHPC structures through a novel hybrid machine learning approach. Structures 2024, 62, 106162. [Google Scholar] [CrossRef]
  40. Wang, W.; Wu, Y.; Liu, W.; Fu, T.; Qiu, R.; Wu, S. Tensile Performance Mechanism for Bamboo Fiber-Reinforced, Palm Oil-Based Resin Bio-Composites Using Finite Element Simulation and Machine Learning. Polymers 2023, 15, 2633. [Google Scholar] [CrossRef] [PubMed]
  41. Zhang, Y.; Xu, X. Machine learning tensile strength and impact toughness of wheat straw reinforced composites. Mach. Learn. Appl. 2021, 6, 100188. [Google Scholar] [CrossRef]
  42. Antil, S.K.; Antil, P.; Singh, S.; Kumar, A.; Pruncu, C.I. Artificial Neural Network and Response Surface Methodology Based Analysis on Solid Particle Erosion Behavior of Polymer Matrix Composites. Materials 2020, 13, 1381. [Google Scholar] [CrossRef] [PubMed]
  43. Pati, P.R. Prediction and wear performance of red brick dust filled glass–epoxy composites using neural networks. Int. J. Plast. Technol. 2019, 23, 253–260. [Google Scholar] [CrossRef]
  44. Alakara, E.H.; Nacar, S.; Sevim, O.; Korkmaz, S.; Demir, I. Determination of compressive strength of perlite-containing slag-based geopolymers and its prediction using artificial neural network and regression-based methods. Constr. Build. Mater. 2022, 359, 129518. [Google Scholar] [CrossRef]
  45. Manikandan, P.; Selija, K.; Vasugi, V.; Kumar, V.P.; Natrayan, L.; Santhi, M.H.; Kumaran, G.S. An Artificial Neural Network Based Prediction of Mechanical and Durability Characteristics of Sustainable Geopolymer Composite. Adv. Civ. Eng. 2022, 2022, 9343330. [Google Scholar] [CrossRef]
  46. Li, X.; Tabil, L.G.; Panigrahi, S. Chemical Treatments of Natural Fiber for Use in Natural Fiber-Reinforced Composites: A Review. J. Polym. Environ. 2007, 15, 25–33. [Google Scholar] [CrossRef]
  47. Célino, A.; Fréour, S.; Jacquemin, F.; Casari, P. Characterization and modeling of the moisture diffusion behavior of natural fibers. J. Appl. Polym. Sci. 2013, 130, 297–306. [Google Scholar] [CrossRef]
  48. Alghamdi, S.J. Classifying High Strength Concrete Mix Design Methods Using Decision Trees. Materials 2022, 15, 1950. [Google Scholar] [CrossRef]
  49. Sipper, M.; Moore, J.H. AddGBoost: A gradient boosting-style algorithm based on strong learners. Mach. Learn. Appl. 2022, 7, 100243. [Google Scholar] [CrossRef]
  50. Kang, M.-C.; Yoo, D.-Y.; Gupta, R. Machine learning-based prediction for compressive and flexural strengths of steel fiber-reinforced concrete. Constr. Build. Mater. 2021, 266, 121117. [Google Scholar] [CrossRef]
  51. Ben Chaabene, W.; Flah, M.; Nehdi, M.L. Machine learning prediction of mechanical properties of concrete: Critical review. Constr. Build. Mater. 2020, 260, 119889. [Google Scholar] [CrossRef]
  52. Anysz, H.; Brzozowski, Ł.; Kretowicz, W.; Narloch, P. Feature Importance of Stabilised Rammed Earth Components Affecting the Compressive Strength Calculated with Explainable Artificial Intelligence Tools. Materials 2020, 13, 2317. [Google Scholar] [CrossRef]
  53. Naveen, E.; Venkatachalam, N.; Maheswaran, N. Alkalichemical Treatment on the Surface of Natural Fiber. 2007. Available online: https://www.ijirset.com/upload/2015/tapsa/25_ME009.pdf (accessed on 17 July 2024).
  54. Xia, C.; Zhang, S.; Shi, S.Q.; Cai, L.; Huang, J. Property enhancement of kenaf fiber reinforced composites by in situ aluminum hydroxide impregnation. Ind. Crop. Prod. 2016, 79, 131–136. [Google Scholar] [CrossRef]
  55. Tripura, D.D.; Gupta, S.; Debbarma, B.; Deep, R.S.S. Flexural strength and failure trend of bamboo and coir reinforced cement stabilized rammed earth wallettes. Constr. Build. Mater. 2020, 242, 117986. [Google Scholar] [CrossRef]
  56. van der Lugt, P.; Van den Dobbelsteen, A.A.J.F.; Janssen, J.J.A. An environmental, economic and practical assessment of bamboo as a building material for supporting structures. Constr. Build. Mater. 2006, 20, 648–656. [Google Scholar] [CrossRef]
  57. Verma, D.; Goh, K.L. Effect of Mercerization/Alkali Surface Treatment of Natural Fibres and Their Utilization in Polymer Composites: Mechanical and Morphological Studies. J. Compos. Sci. 2021, 5, 175. [Google Scholar] [CrossRef]
  58. Simon, M.; Fulchiron, R.; Gouanvé, F. Water Sorption and Mechanical Properties of Cellulosic Derivative Fibers. Polymers 2022, 14, 2836. [Google Scholar] [CrossRef]
  59. Mahamat, A.A.; Obianyo, I.I.; Ngayakamo, B.; Bih, N.L.; Ayeni, O.; Azeko, S.T.; Savastano, H. Alkali activation of compacted termite mound soil for eco-friendly construction materials. Heliyon 2021, 7, e06597. [Google Scholar] [CrossRef]
  60. Hill, C.A.S.; Norton, A.; Newman, G. The water vapor sorption behavior of natural fibers. J. Appl. Polym. Sci. 2009, 112, 1524–1537. [Google Scholar] [CrossRef]
  61. Chen, C.M.; Wangaard, F.F. Wettability and the IIysteresis Effect in the Sorption of Water Vapor by Wood. Wood Sci. Technol. 1968, 2, 177–187. [Google Scholar] [CrossRef]
  62. Upreti, K.; Verma, M.; Agrawal, M.; Garg, J.; Kaushik, R.; Agrawal, C.; Singh, D.; Narayanasamy, R. Prediction of Mechanical Strength by Using an Artificial Neural Network and Random Forest Algorithm. J. Nanomater. 2022, 2022, 7791582. [Google Scholar] [CrossRef]
  63. Koyamparambath, A.; Adibi, N.; Szablewski, C.; Adibi, S.A.; Sonnemann, G. Implementing Artificial Intelligence Techniques to Predict Environmental Impacts: Case of Construction Products. Sustainability 2022, 14, 3699. [Google Scholar] [CrossRef]
  64. Mahamat, A.A.; Boukar, M.M. Machine learning techniques versus classical statistics in strength predictions of eco-friendly masonry units. In Proceedings of the 2021 16th International Conference on Electronics Computer and Computation (ICECCO), Kaskelen, Kazakhstan, 25–26 November 2021; pp. 1–4. [Google Scholar]
  65. Tran, V.Q. Hybrid gradient boosting with meta-heuristic algorithms prediction of unconfined compressive strength of stabilized soil based on initial soil properties, mix design and effective compaction. J. Clean. Prod. 2022, 355, 131683. [Google Scholar] [CrossRef]
Figure 1. (a) Whole Borassus fruit, (b) sliced Borassus fruit, and (c) wet and oven-dried Borassus fruit fiber.
Applsci 14 07540 g001
Figure 2. Flowchart summarizing the stages followed during this investigation.
Applsci 14 07540 g002
Figure 3. (a) Chemically treated Borassus fibers (CBNF) and (b) untreated Borassus fibers (BNF).
Applsci 14 07540 g003aApplsci 14 07540 g003b
Figure 5. Sorption and desorption behavior of: (a) untreated, (b) treated after 1 h, (c) treated after 24 h, (d) treated after 48 h, and (e) treated after 72 h.
Applsci 14 07540 g005aApplsci 14 07540 g005b
Figure 6. Prediction vs. experimental using DTR for: (a) sorption level in the BNF, (b) desorption level in the BNF. Prediction vs. experimental using GBR for: (c) sorption level in the BNF, (d) desorption level in the BNF.
Applsci 14 07540 g006aApplsci 14 07540 g006b
Figure 7. Evaluation metrics for decision tree and gradient boosting during the prediction of: (a) sorption rate of the BNF and (b) desorption rate of the BNF.
Applsci 14 07540 g007
Table 1. State-of-the art application of machine-learning approaches in natural fiber applications with the various parameters used.
ReferenceMaterial TypeML Technique UsedInputsPredicted OutputsStatistical Evaluation Metrics
[27]Brodatz and Salzburg texture image (fiber)Decision tree (DT), random forest (RF), support vector machine (SVM), and K-nearest neighbor (KNN)Fibers images (Brodatz and Salzburg)TextureAccuracy
[26]Thermoplastic ResinsDecision Tree Regression (DTR) and Random Forest Regression (RFR), Multi Linear Regression (MLR)Polycarbonate resin with different pigmentsFiber’s colorPearson correlation coefficient (PCC)
[19]Epoxy composite reinforced with jute/basalt hybridGradient Boosting (GB), AdaBoost, and XGBoostSpindle speed, Feed rate, Depth of cutSurface roughnessAverage, and maximum error
[40]Bamboo Fiber-Reinforced, Palm Oil-Based Resin Bio-CompositesDecision Tree Regression (DTR) and Random Forest Regression (RFR), Gradient Boosting (GB), CatBoost, and XGBoostBamboo Fiber volume fraction, fiber length (L), fiber diameter (D), the ratio of length to diameter, resin failure stress and resin failure strainTensile strengthR2, MSE, and MAE
[41]Wheat straw-reinforced polypropylene compositesGaussian Process Regression (GPR)Fiber content, hold time, molding pressure, hold temperatureTensile strength and impact toughnessR2, RMSE, and MAE
[42]Glass Fiber Polymer matrix compositeArtificial Neural Network (ANN), Response Surface Methodology (RSM)Slurry Pressure, Impingement Angle, Nozzle DiameterErosion rateR and MSE
[43]Red brick dust-filled glass epoxy compositeArtificial Neural Network (ANN)Impact velocity, impingement angle, erodent size & temperatureErosion rateR2, RMSE, and MAE
[20]Concrete-filled steel tubular columnsGradient Boosting (GB)Section type, load, specimens, violin plot, and Heat-mapStrengthsR2, MSE, RMSE, MAE, and CoV
[44]Eco-Friendly ConcreteSupport vector machine (SVM), linear regression (LR)W/C, RAC%, superplasticizer, and ageCompressive strengthR2 and RMSE
[29]FRP-reinforced concrete membersBayesian optimization algorithm (BOA), support vector regression (SVR)Epsilon, box constraint, and kernel scale and kernel functionShear capacityR2, RMSE, MAE, and FB
[45]Sustainable geopolymer compositeArtificial Neural Network (ANN)RHA substitution proportion, NaOH concentration, and fiber contentCompressive and flexural strengthR2 and RMSE
Table 2. Details of the experimental results used to create the primary data, with the different variables used as inputs during testing and training for the GBR and the DTR models to predict the specific mass.
Time (min)Mass (mg)Relative Humidity RH (%)Temp. (°C)Specific Mass Mt (%)Time (min)Mass (mg)Relative Humidity RH (%)Temp. (°C)Specific Mass Mt (%)
7.7810.0124.262.680.01
7.9710.324.262.690.06
8.0510.424.262.690.08
8.1710.524.262.690.11
187.7410.6624.272.752.281310.6780.0024.213.9446.79
187.7611.0124.272.752.281310.6980.0024.213.9446.79
187.7811.3324.272.752.281310.7180.0024.213.9446.79
187.811.6124.272.752.281310.7280.0024.213.9446.79
187.8111.8724.272.752.281310.7480.0024.213.9446.79
187.8312.0924.272.752.281310.7680.0024.203.9446.79
187.8412.2924.272.752.281278.9780.0024.243.5532.37
187.8612.4724.272.752.281278.9980.0224.243.5532.42
187.8812.6624.272.752.281458.8681.2624.253.9547.09
187.912.8324.272.752.281459.1282.1024.263.9547.31
187.9112.9924.272.752.281459.4483.0024.283.9747.78
187.9313.1624.272.752.281459.8483.9024.313.9948.65
187.9513.3324.272.752.281461.0184.9024.314.0751.80
187.9613.4824.272.752.281461.2285.0024.314.0952.41
187.9813.6524.272.752.281461.2485.0024.314.0952.46
18813.8124.272.752.281642.6485.0024.264.9383.64
188.0113.9724.272.752.281642.6685.0024.264.9383.64
188.0314.124.272.752.281642.6785.0024.274.9383.64
188.0514.2724.272.752.281642.6985.0024.274.9383.64
188.0614.4224.272.752.281642.7185.0024.274.9383.64
188.0814.5624.272.752.291642.7285.0024.274.9383.64
188.114.6924.272.752.291642.7485.0024.274.9383.64
188.1114.8524.272.752.291642.7685.0024.274.9383.64
188.1314.9924.272.752.291642.7785.0024.274.9383.64
188.1515.1224.272.752.291642.7985.0024.274.9383.64
Table 3. Structure and functioning of DTR and GBR.
DTRGBR
Structure: Comprises a tree-like structure where nodes represent decisions based on feature values, and leaves represent the output (predicted values).
Functioning:
  • Recursively splits the data into subsets based on feature values to minimize a cost function (typically mean squared error for regression).
  • At each split, it chooses the feature and threshold that results in the largest reduction in impurity.
Structure: An ensemble of multiple weak learners (usually shallow decision trees) combined to form a strong predictive model.
Functioning:
  • Sequentially builds trees, with each tree trained to correct errors made by the previous trees.
  • Uses a loss function to measure errors and adjusts the model iteratively to minimize this loss.
  • Combines the predictions of all trees, usually through a weighted sum, to make the final prediction.
Table 4. Evaluation metrics used for the GBR and DTR algorithms.
Evaluation Metrics and Their EquationsParameter’s Definition
(1) M A E = i = 1 n ( y i , e x p y i , pred ) n Where
n = represents the total number of data values
y i,exp = represents the actual value
yi,pred = represents predicted value
(2) M S E = 1 n i = 1 n ( y i , exp y i , pred ) 2 n = represents the total number of data values
yi,exp = represents the actual value
yi,pred = represents predicted value
(3)RMSE= 1 n i = 1 n ( y i , e x p y i , pred ) 2 n = represents the total number of data values
yi,exp = represents the actual value
yi,pred = represents predicted value
(4) R 2 = i = 1 n ( y i , e x p y i , pred ) 2 i = 1 n ( y i , e x p ( 1 n i = 1 n y i , e x p ) ) 2 n = represents the total number of data values
yi,exp = represents the actual value
yi,pred = represents predicted value
Table 5. Practical and theoretical implications of DTR and GBR.
Practical ImplicationsTheoretical Implications
DTRDTR
Easy interpretabilityProne to overfitting
Handling numerical and categorical features without extensive preprocessingInaccurate for complex relationships
Quick development of the model and its trainingInadequate for continuous features
Best for categorical features
Can identify the most important features
Wide range applications
GBRGBR
Easy interpretabilityRequires hyperparameter tuning
High accuracy on complex datasetsReduce variance
Flexibility in handling various data types and non-linear relationshipEnsemble of multiple trees thus hard to understand the internal working
Less prone to overfittingAccurate for complex nonlinear relationships
Examples of how the models can enhance decision-making
The rationale behind the model’s forecasts can be comprehended during the application of the BNF thanks to the decision rules of the tree’s simplicity.
Both models can be used to predict accurately the engineering properties of BNF based on moisture absorption, mass, temperature, etc. by allowing an understanding of the most important factors
Models can be used to identify factors to alternate the BNF characteristics to enable improve their properties based on their application
Models can be used to determine the BNF failure characteristics for early prevention or reinforcement
Models can be used to produce BNF based on specific applications
Disclaimer/Publisher’s Note: The statements, opinions and data contained in all publications are solely those of the individual author(s) and contributor(s) and not of MDPI and/or the editor(s). MDPI and/or the editor(s) disclaim responsibility for any injury to people or property resulting from any ideas, methods, instructions or products referred to in the content.

