Article

Deep Learning-Based Calculation Method for the Dry Beach Length in Tailing Ponds Using Satellite Images

1
School of Civil Engineering, North China University of Technology, Beijing 100144, China
2
China Renewable Energy Engineering Institute, Beijing 100120, China
3
BGRIMM Technology Group, Beijing 100160, China
*
Author to whom correspondence should be addressed.
Appl. Sci. 2024, 14(17), 7560; https://doi.org/10.3390/app14177560
Submission received: 16 June 2024 / Revised: 2 August 2024 / Accepted: 8 August 2024 / Published: 27 August 2024
(This article belongs to the Section Civil Engineering)

Abstract

:
The dry beach length determines the hydraulic boundary of tailings impoundments and significantly impacts the infiltration line, which is crucial for the tailings dam. A deep learning method utilizing satellite images is presented to recognize the dry beach area and accurately measure the length of dry beaches in tailing ponds. Firstly, satellite images of various tailing ponds were gathered and the collection was enlarged to create a dataset of satellite images of tailing ponds. Then, a deep learning method was created using YOLOv5-seg to identify the dry beach area of tailing ponds from satellite images. The mask of the dry beach region was segmented and contour extraction was then carried out. Finally, the beach crest line was fitted based on the extracted contour. The pixel distance between the beach crest line and the dry beach boundary was measured and then translated into real distance by ground resolution. This paper’s case study compared the calculated length of dry beach with the real length obtained by field monitoring. The results of the case study showed that the minimum error of the method was 2.10%, the maximum error was 3.46%, and the average error was 2.70%, indicating high precision for calculating dry beach length in tailing ponds.

1. Introduction

With the development of the social economy, the demand for mineral resources is increasing [1]. Tailings is the byproduct generated from the extraction and beneficiation of ore, and consists of waste rock, slag, wastewater, and chemical wastes. The compounds are acidic or alkaline, with elevated levels of dangerous heavy metals that can cause serious environmental damage if not managed correctly [2]. To prevent pollution, tailings is typically deposited into tailing ponds. A tailings pond is a containment area for storing industrial wastes, such as tailings, produced by metal and non-metal mining [3]. It is created by constructing dams at the river closure of a valley or by enclosing it on all sides. The tailings pond is a geotechnical engineering structure with internal water forces that create a complex multi-field coupling effect, making it more susceptible to deterioration compared to other forms of water-storage dams. According to statistics, tailings dams have a roughly tenfold higher failure rate than water-storage dams due to factors such foundation settlement, dam seepage, earthquakes, and extreme weather [2,4]. Several significant failures of tailings dams have been documented worldwide in recent decades, resulting in several adverse effects on the surrounding environment and adjoining residential communities [5,6,7,8,9,10,11,12]. The 2019 rupture of the Brumadinho tailings dam in Brazil caused 259 deaths. It had a significant environmental impact by increasing heavy metal levels in the Paraopepa River, posing a health risk to communities nearby [13]. Tailing ponds, as substantial geotechnical structures, are recognized as a significant hazard for nearby communities [14]. Comprehensive safety monitoring, timely analysis, and early warning are crucial for enhancing tailings pond safety management and preventing dam-failure accidents.
Engineers have become increasingly concerned about monitoring the safety of tailing ponds in recent years. The safety monitoring elements of tailing ponds primarily consist of displacement, the infiltration line, the water level in the reservoir area, and the length of the dry beach [15]. The length of the dry beach is a crucial factor that impacts safe operation and directly affects the position of the infiltration line and the flood control capacity of tailing ponds. An insufficient length of dry beach can pose a serious threat to the safety of tailing dams. In history, there have been many collapse accidents associated with tailing ponds due to dry beach length, such as the 2008 Xiangfen tailings dam failure in Shanxi Province, China. Tailing ponds consist of tailings stacking facilities, drainage equipment, discharge spigot, sewage treatment station, safety-monitoring equipment, and other auxiliary facilities [16]. The mineral processing plant mixes tailings with water to form a slurry, which is discharged into the tailings pond for storage through the discharge spigot. After the slurry is discharged into the tailings pond, due to gravity settlement, a dry beach area and water area will be formed [17]. The length of dry beach refers to the distance from the drainage faucet to the waterline, which is closely related to dam safety [18]. The discharge of tailings with high water content into the pond and the influence of rainfall and other factors cause the fluctuation of dry beach length. Therefore, it is necessary to monitor the length of dry beaches. Figure 1 depicts the dry beach area and water area of the tailings pond.
The method of monitoring the length of dry beaches is crucial for tailings pond safety. However, the soft sedimentary surface of beaches make it challenging to manually determine the boundary between the dry beach and water areas. Zhou et al. [19] proposed a slope projection technique for determining the length of a dry beach. This method involves placing multiple measuring points on the dry beach to measure its top elevation, using geometric projection to determine the slope angle of the beach, and incorporating the water level in the reservoir area to calculate the length of the dry beach. Le et al. [20] used angle and laser measuring instruments to measure the dry beach slope and then determined the dry beach length by incorporating the water level in the reservoir area. Liu et al. [21] proposed a laser direct measurement technique that involves scanning the dry beach surface with a laser from the starting point to the water surface. This method determines the length of the dry beach by analyzing the laser’s absorption and reflection properties on the dry beach and water surfaces, in conjunction with the measuring instrument’s rotational angle and geometric projections. Generally, the traditional measuring method of a dry beach is usually contact measurement. The contact method requires the installation and maintenance of measuring devices on a soft deposited beach that is difficult to access. In recent years, advancements in computers and artificial intelligence have led to the application of camera vision image-processing technologies. Adil et al. [22] propose a Python-based algorithm to effectively discover camera parameters, rectify images, generate disparity maps, then use these maps to measure distance accurately. Sadreddini et al. [23] propose a distance measurement method for a single-camera condition. The purpose measure the distance of objects in front of the imaging system in the indoor environment. Camera visual image processing technology involves digitally processing and analyzing images taken by monitors, video cameras, drone cameras, etc. The method analyzes images of the dry beach area near the tailing pond to detect the waterline, determine the pixel coordinates of the water-surface boundary on the dry beach, and calculate the distance using calibrated objects or coordinates in the images. Hu et al. [24] introduced a photogrammetric method to measure the dry beach length. Huang et al. [25] delineated the boundary between the dry beach and water by employing contour identification, threshold segmentation, and watershed algorithms on the collected images. Yang et al. [26] used images captured by a surveillance camera and trained a network model with the mask R-CNN algorithm to identify the waterline and provide its coordinates. However, camera vision image processing still faces the following challenges. On-site deployment of cameras and calibration objects and equipment is necessary, requiring labor-intensive and hazardous manual deployment. The camera and monitoring recordings are not suitable for inclement weather conditions and are restricted by unfavorable weather elements [27]. Changes in the dry beach’s length caused by the continuous discharge of tailings slurry require the relocation of calibration objects and measuring equipment to prevent them from being buried and rendered inoperative [24]. These problems limit the application of this method in the measurement of dry beach length in tailing ponds.
This paper suggests a method for determining the dry beach length using satellite images and deep learning algorithms to address the abovementioned issues. Firstly, the YOLOv5-seg model was established to detect the dry beach area. An edge detection algorithm was then used to extract the dry beach contour. In addition, the beach crest line was fitted by an equation. Afterwards, the distance from the dry beach demarcation line to the beach crest line was calculated to determine the dry beach length. Finally, the method was validated by a tailing pond case in China.

2. Research Framework

This research is structured into four main sections: image capture, dry beach detection, length calculation, and verification and analysis. Figure 2 displays the study framework diagram.
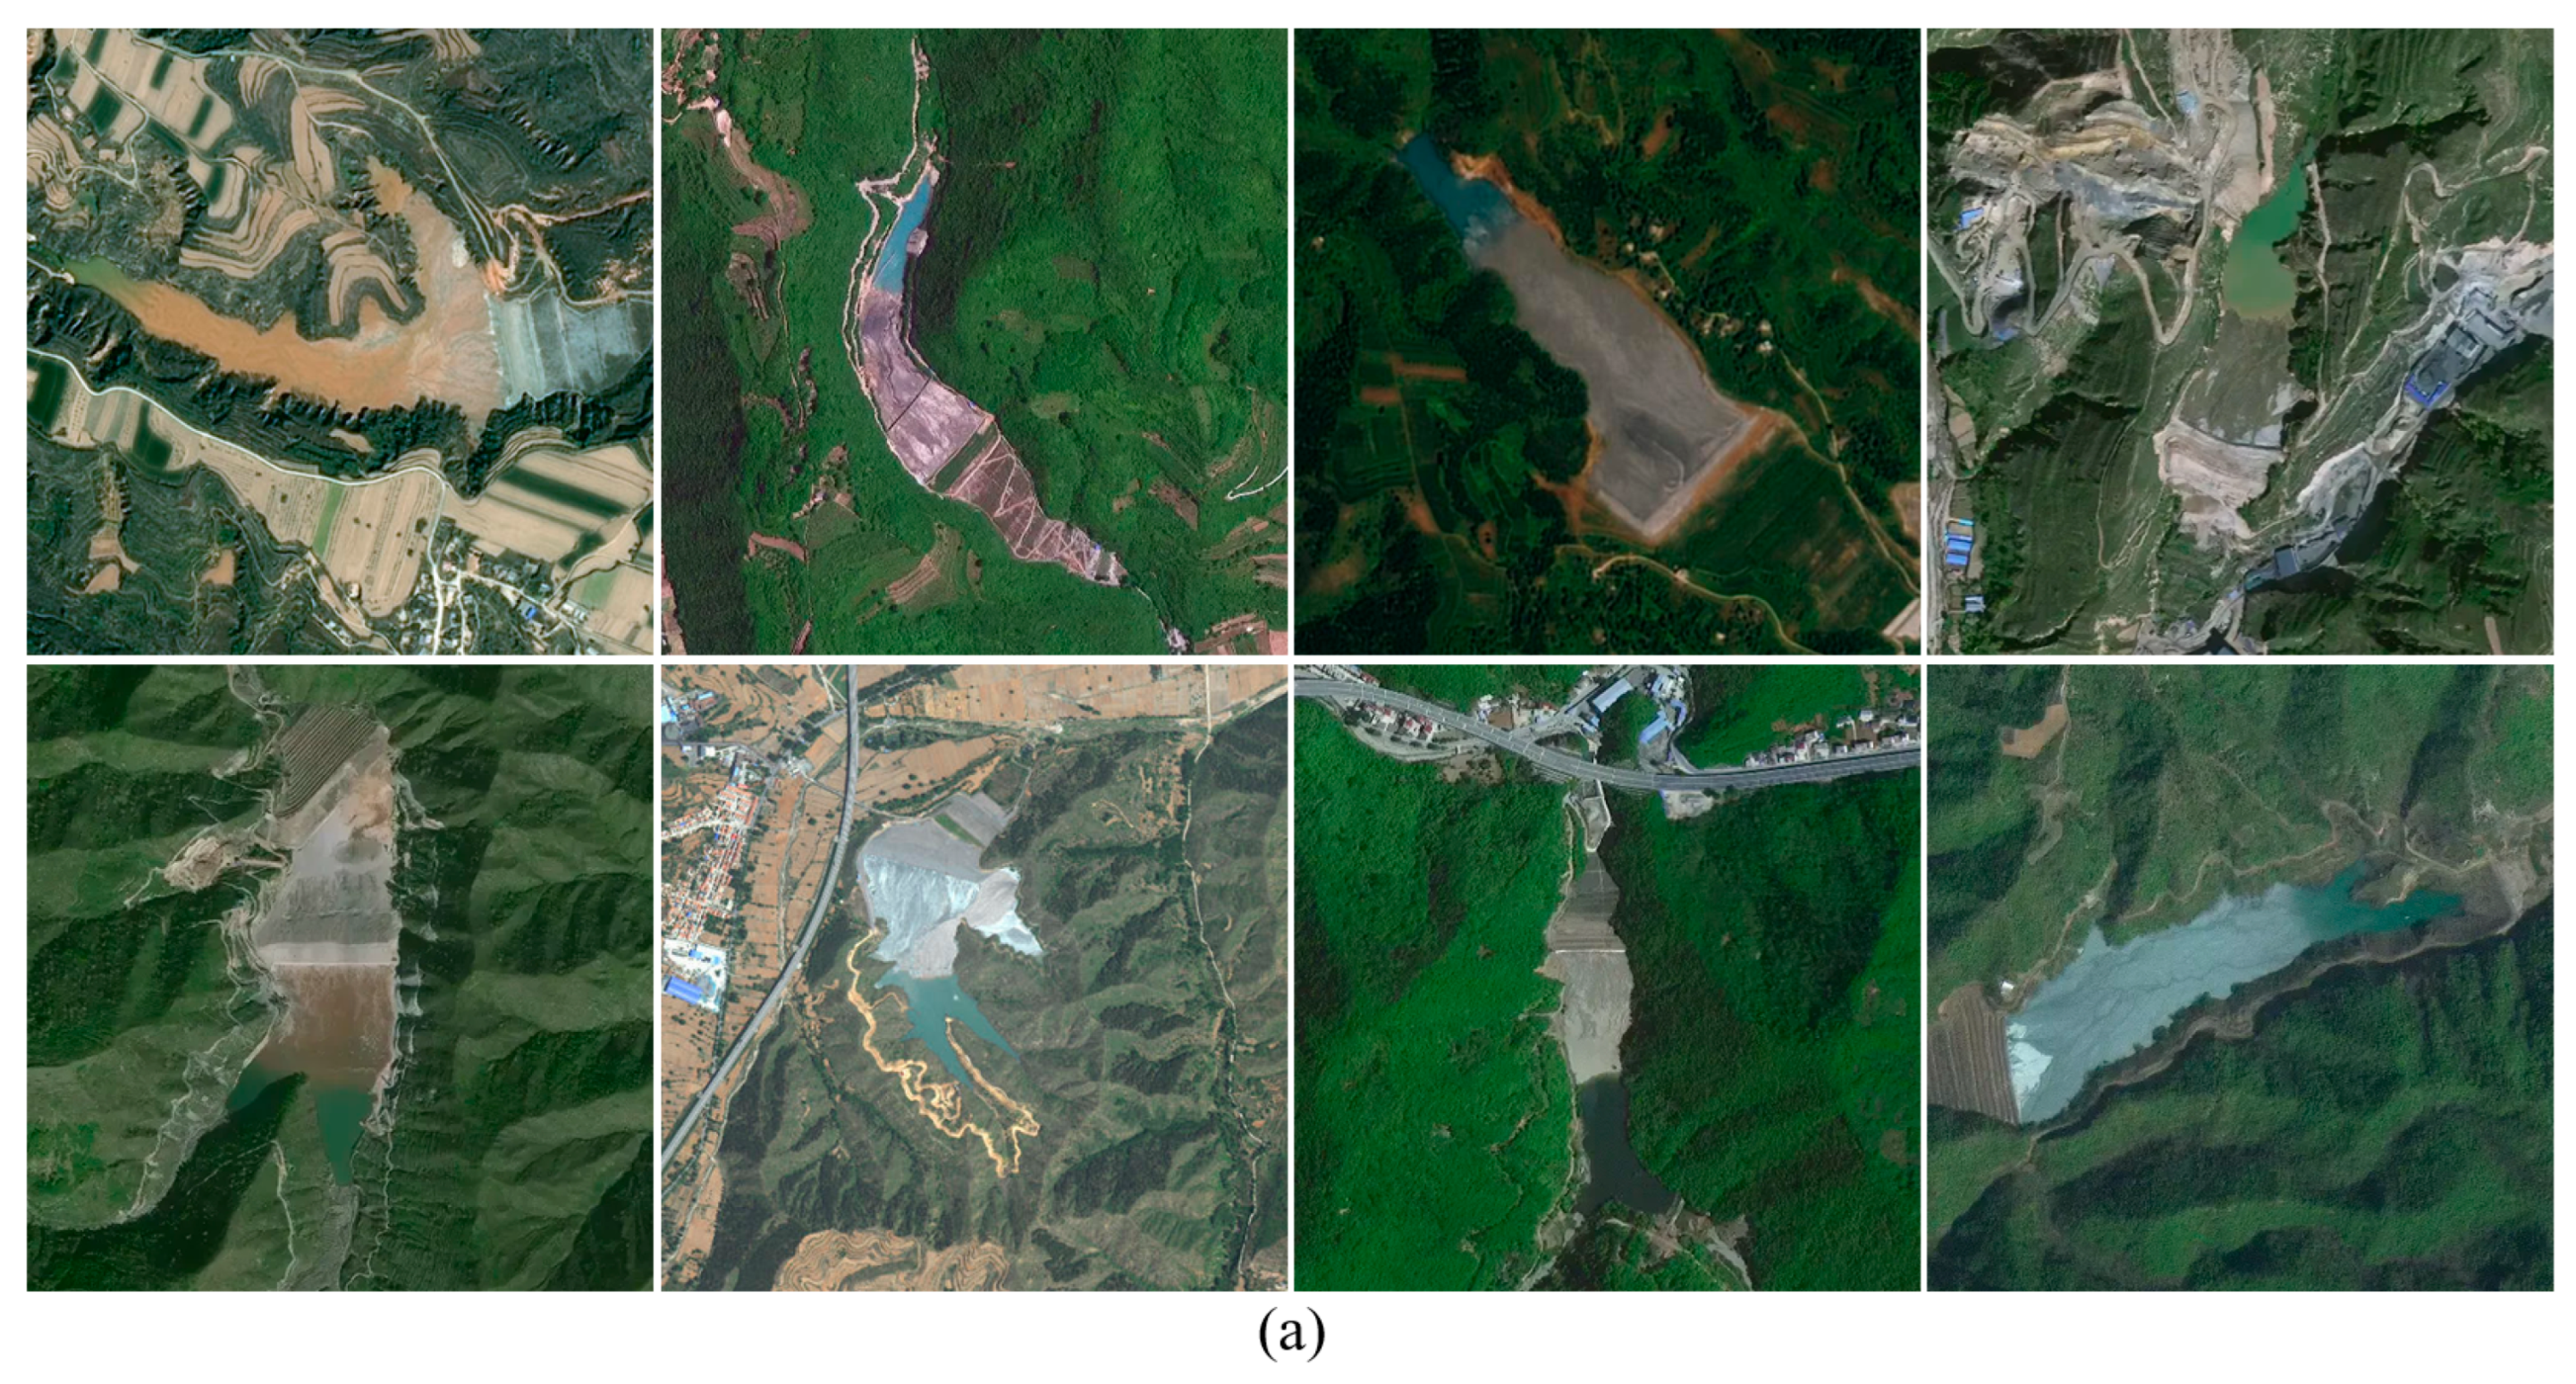
  • Image acquisition involved checking public information on tailing ponds from emergency management department websites in different provinces and cities in China, pinpointing the exact locations using the Gaofen-7 satellite, and downloading satellite images of the tailing ponds. On the websites of emergency management departments in various provinces in China, information about tailings ponds in each province is publicly available, including their geographical location, level, and scale. After obtaining the geographic information of tailings ponds, we can search for their locations on a map.
  • Dry beach detection included creating a dataset of dry beach images of tailing ponds, labeling images with Labelme software (Version 5.4.1), and training the dataset using the YOLOv5-seg model. Labelme is an image annotation tool developed by the Computer Science and Artificial Intelligence Laboratory (CSAIL) of MIT. The source code of the software is open source and has been widely used in object detection semantic segmentation and instance segmentation [28].
  • To calculate the length, the edge detection algorithm was used to extract points on the mask boundary of the dry beach area. Then, an equation was fitted to the beach crest line. Finally, a calculation model was created to determine the distance from the dry beach boundary to the beach crest line.
  • A tailings pond in China was used to verify the method. The dry beach length was calculated and compared with the measured length of monitoring points on each site to verify the accuracy and practicality of the proposed method.

3. Materials and Methods

3.1. Data Acquisition

We collected satellite images of tailing ponds located in China by Gaofen-7 satellite imagery [29]. The Gaofen-7 satellite has a resolution of 0.65 m and an elevation accuracy of 0.1 m, meeting the needs for 1:10,000 scale mapping precision [30]. Three-channel RGB images were acquired as raw data with a resolution of about 2 m and a size of 732 × 732 pixels, and a total of 325 images were taken. The dataset was expanded using four data augmentation methods from OpenCV(Version 4.8.1): mirroring, darkening, rotating, and adding Gaussian noise [31]. This was done to increase sample diversity, enhance model robustness, and improve generalization [32]. An example of this augmentation is illustrated in Figure 3. Changes in image brightness can replicate satellite shooting scenes with varying lighting conditions, mirroring and rotation can replicate varied shooting angles and positions of satellites, and Gaussian noise can replicate artifacts that may occur during image collecting and processing. A dataset consisting of 1625 improved images was ultimately created. To ensure assessment reliability, the dataset is split into two parts: a training set and a validation set. The training set has 80% of the data, and the validation set has the other 20% [33]. This permits complete training and effective validation of datasets [34]. The annotation schematic may be shown in Figure 4. The picture annotation produces a JSON file with details like the label’s outline position and name.

3.2. Detection of Dry Beach Area of Tailing Ponds

3.2.1. YOLOv5-Seg

YOLOv5-seg has extra segmentation in the header and is intended for object detection [35]. The network architecture includes input, Backbone, neck, and head components, as depicted in Figure 5 [36]. The input performs the image preprocessing by means of mosaic data augmentation, adaptive image scaling, and adaptive anchor box computation. The modules for extracting features from the images that make up the Backbone are CBS, CSP, and SPPF. The neck consists of the Feature Pyramid Network (FPN) layer and the Pyramid Attention Network (PAN) layer, which combine features retrieved by the Backbone at many scales to achieve a comprehensive set of feature information. A target detection head and an instance segmentation head are both part of the head. The multi-scale feature fusion method of the regular YOLOv5 is passed down to the target detection head of the network model. This allows for the detection of objects at various feature scales. The instance segmentation head adds an extra output to the target detection of the prototypical network, which performs pixel-by-pixel classification prediction by means of a small Fully Convolutional Neural Network (FCN) and generates binary masks for the objects. YOLOv5 loss functions include three types: classification loss (LCLS), box loss (LBOX) and objectness loss (LOBJ). The box represents the size and exact position of the target. Objectness represents the reliability of the predicted rectangle. Classification represents the category of the target. The characteristic of the loss function is a gap between the predicted information and the expected information (label) of the neural network. The closer the predicted information is to the expected information, the smaller the value of loss function is. The total loss function is weighted first and then λ1, λ2, and λ3, which are the weights of the three losses, respectively, are added as shown in Equation (1) [37].
L o s s = λ 1 L C L S + λ 2 L B O X + λ 3 L O B J
Conv (convolution), BN (batch normalization), and SiLU (activation function) are all contained in the CBS module of YOLOv5. Conv is responsible for dimensionality reduction on the feature graph, while BN performs batch normalization on each batch of data [38]. A function called SiLU is used to increase the nonlinearity of data, expressed as Equation (2). The SiLU function is defined as the product of X and sigmoid(x), X is the input value, and the sigmoid(x) function expression is 1/(1 + e−x). The SiLU function combines the advantages of linear transformation and sigmoid function, which can improve the nonlinear expression ability of the model and alleviate the gradient disappearance problem, so as to improve the training efficiency of the model [39]. CSP plays a significant role in feature extraction. Whereas the CSP2_X structure is applied to the neck, the CSP1_X structure is particularly applied to the trunk. SPPF uses the CBS layer to modify feature dimensions, undergoes three maximum pooling layers, connects their output feature maps using Concat operation, and eventually obtains the output feature maps through the CBS layer [40].
S i L U ( X ) = x * S i g m o i d ( x ) = x 1 1 + e x
YOLOv5s is a smaller version of YOLOv5, with a relatively small model size and fewer parameters, which allows it to run efficiently in environments with limited computing resources. Although YOLOv5s is a lightweight model, it can still provide relatively high detection accuracy in various application scenarios, meeting the needs of most conventional object detection tasks [41]. At present, YOLOv5s has been widely applied in various research fields, including unmanned aerial vehicles, intelligent transportation, environmental monitoring, and remote sensing data analysis [42]. Since our research is based on satellite image data, YOLOv5s was selected as the analysis model.

3.2.2. Experimental Conditions and Parameter Settings

The computer equipment configuration and model training parameters used in this study are shown in Table 1.

3.2.3. Model Performance Evaluation Index

Indicators such as precision (P), recall (R), average precision (AP), and mean average precision (mAP) are essential for assessing the model training results in this study. These indicators are an aid to the evaluation of the accuracy and overall performance of the model [43,44].
Precision (P) is an important metric for assessing the performance of a model as it measures the predictive accuracy of the model by calculating the ratio of true positives to the total number of positive cases predicted by the model. TP (True Positive) represents the scenario where the predicted and actual values are both true. Conversely, FP (False Positive) signifies cases where the predicted value is true while the actual value is false. Lastly, FN (False Negative) denotes instances where the predicted value is false despite the actual value being true.
Recall (R), also referred to as sensitivity, is a crucial metric used to assess the model’s ability to correctly identify positive cases. It measures the percentage of true positive cases correctly detected relative to the total number of true positives.
Average precision (AP) is a fundamental indicator for assessing model performance, calculated as the area under the precision–recall curve. AP is a thorough evaluation of model performance, as it considers the complete precision–recall (P-R) curve and assesses the balance between precision and recall comprehensively. Higher AP values verify the superior performance of the model, indicating great precision and recall. A greater average precision (AP) number signifies a superior model performance, indicating high precision and high recall. The calculation formula is as shown in Equation (3) [38].
A P = 0 1 P ( R ) d R
The mean average precision (mAP) is the average of the AP scores for all categories. Assuming there are n categories of targets to be detected in the dataset, and the AP of the target in the first category is AP1, then the last category is APn, and the average AP of these categories is mAP. The mAP metric is used to test the comprehensive detection ability of the model [45]. [email protected] represents the average accuracy at an IOU threshold of 0.5. A higher [email protected] value signifies better detection accuracy of the object detection model. mAP is a common statistic used to assess the performance of object identification algorithms across several item categories. The calculation formula is as shown in Equation (4).
m A P = A P 1 + A P 2 + + A P n n = i = 1 n A P i n
This study primarily aims to detect the dry beach of tailings pond, specifically focusing on a singular category. In Formula (4), the category is one, thus n = 1. Therefore, when the IOU threshold is consistent, the mAP value of the research model equals the AP value.

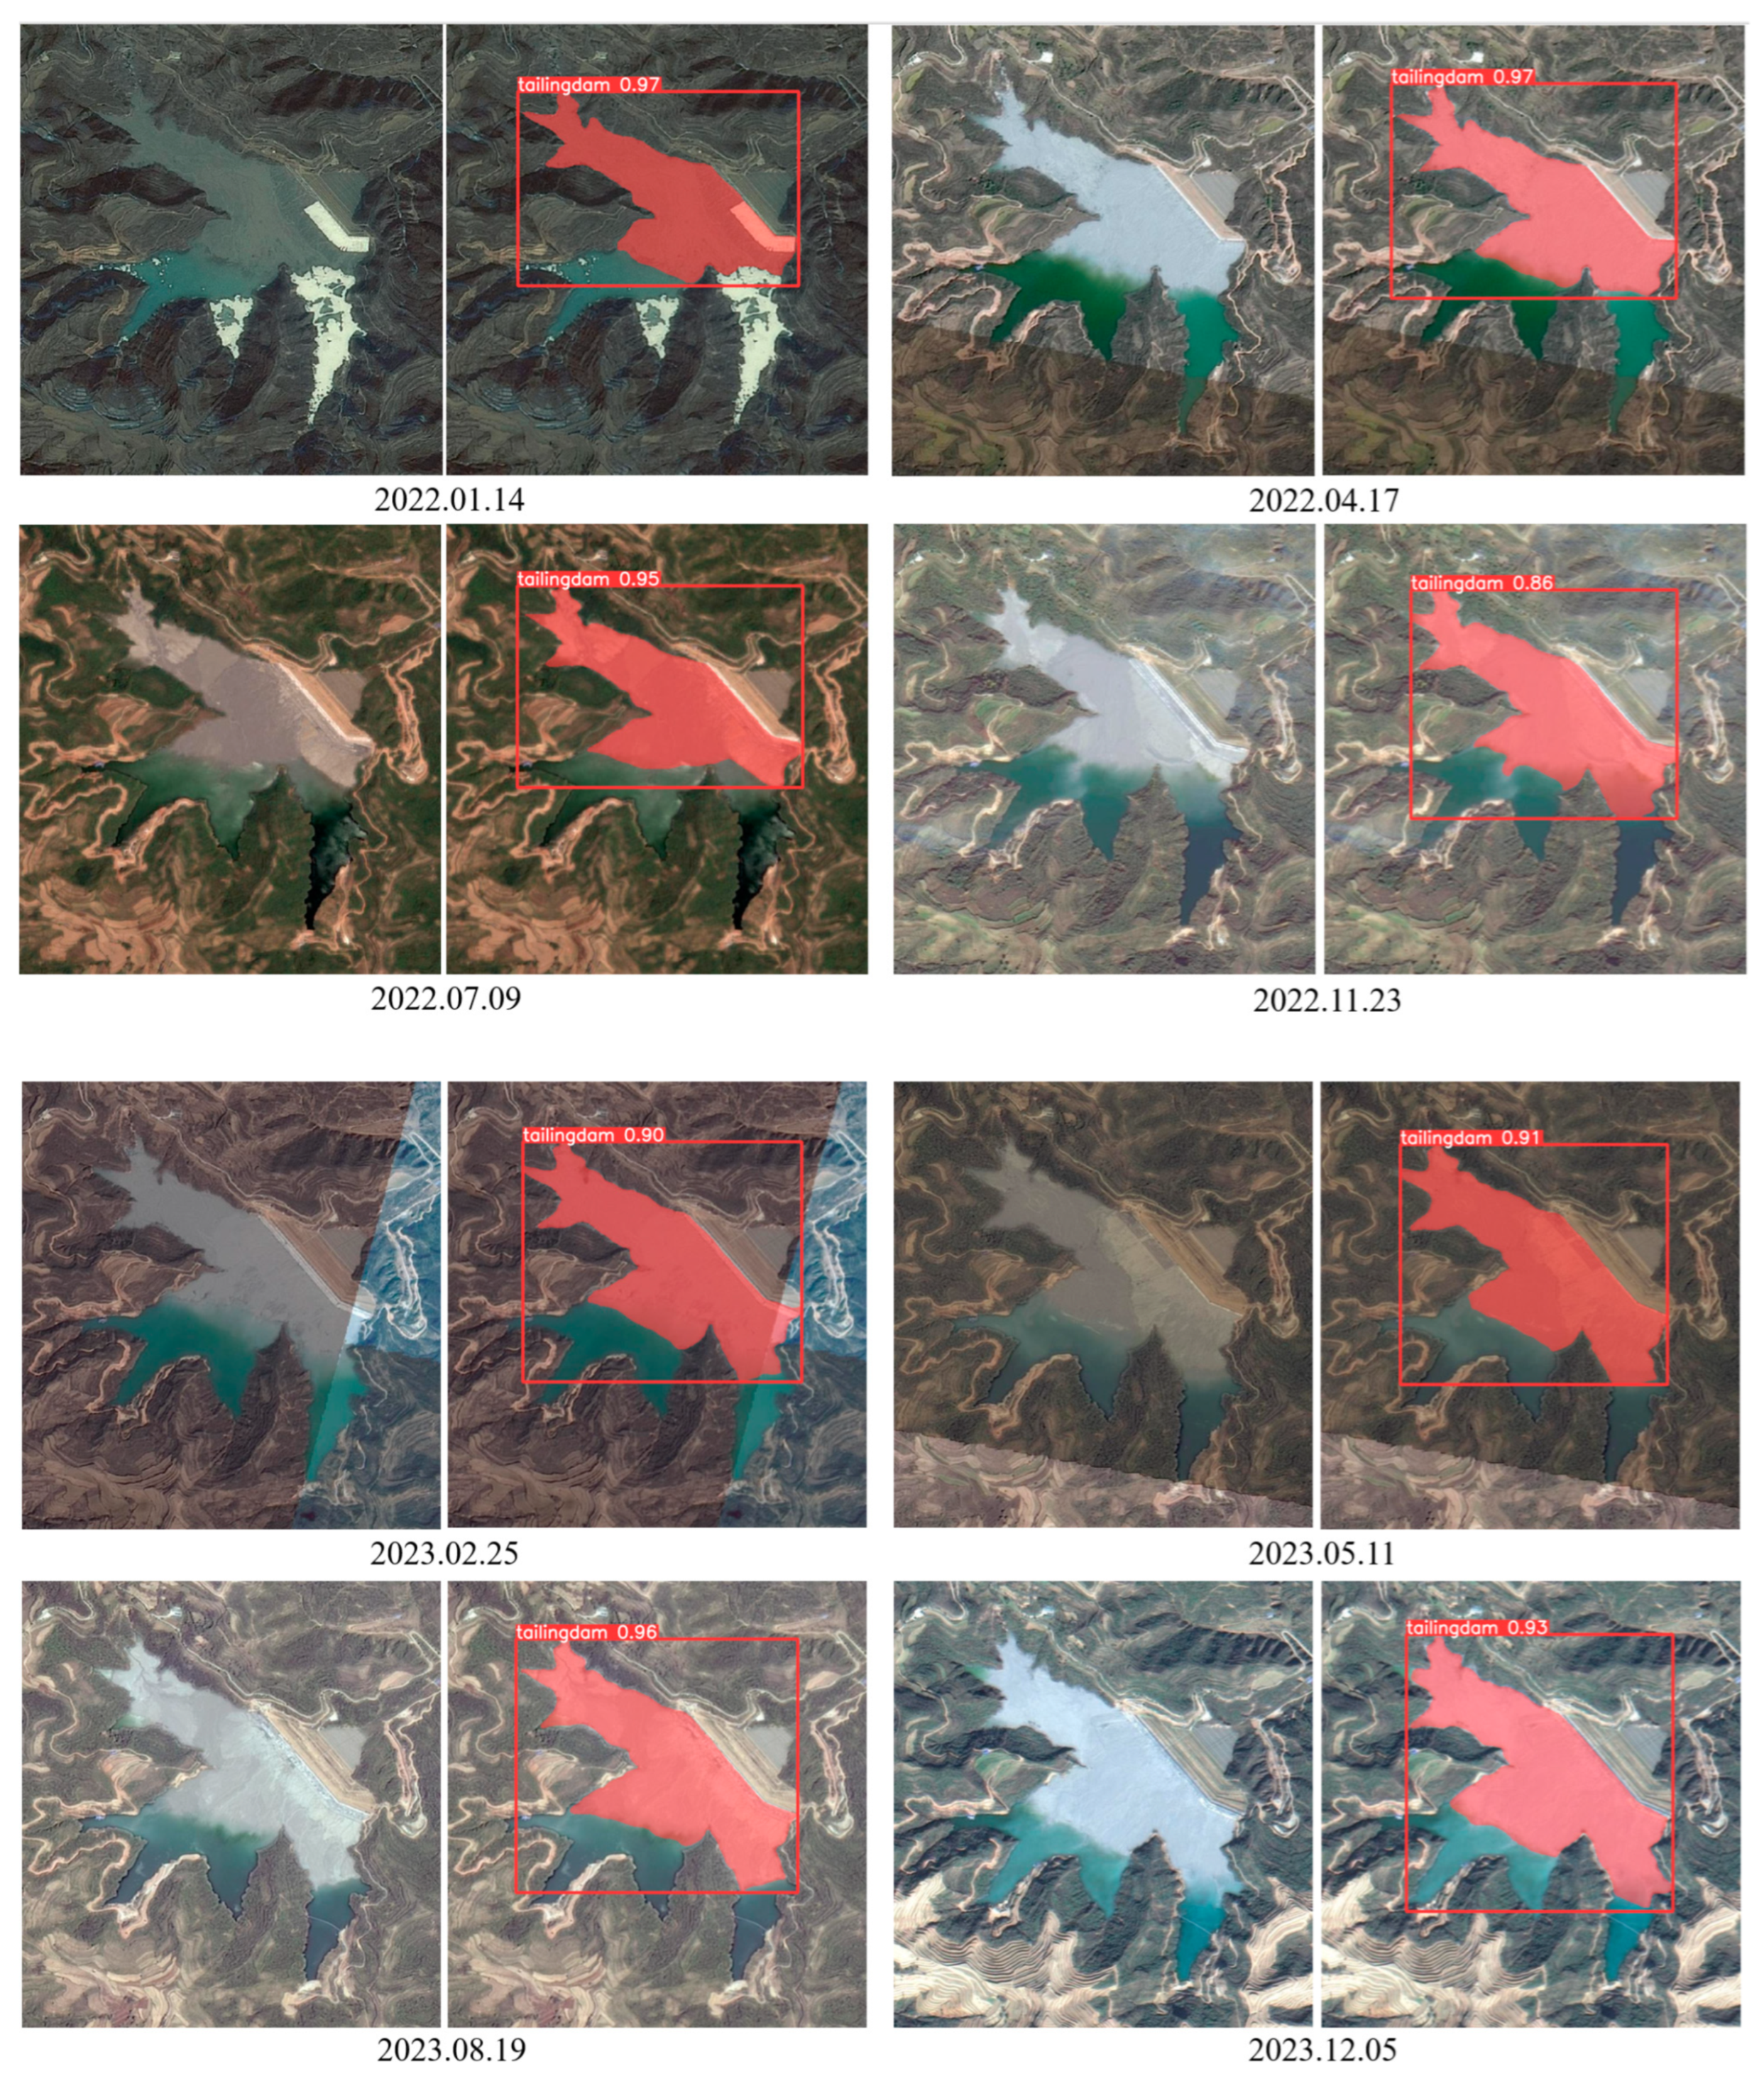
3.2.4. Model Training and Verification Results

After the model training was completed, the model was verified using the validation set. Figure 6 shows the original images and the recognition results of a portion of tailings ponds. It can be seen that the model has a good recognition performance and can identify dry beach areas of tailing ponds with different shapes.
Figure 7 displays the different loss functions utilized for training YOLOv5-seg. The figure displays four distinct forms of the loss function: box loss for detection box loss, seg loss for segmentation loss, obj loss for objectness loss, and cls loss for classification loss. The terms “train” and “val” indicate loss computation during training and validation processes, respectively.
The figure illustrates that after 200 training iterations, both the training loss function and test loss function of the model are lowering and approaching convergence. During the model training in this study, only one detection object is included, which is the dry beach of the tailing pond. The loss functions cls loss and obj loss converge rapidly due to the presence of a single detection object. Accurate prediction and precise contouring of the dry beach area are necessary for length calculation. Therefore, it is necessary to pay attention to segment loss (seg loss) and box loss (predicted box loss). The training data indicate that the train/box loss is 0.01955 and the val/box loss is 0.01869. Both training and testing losses are low, suggesting strong prediction box accuracy. The train/seg loss is 0.01299 and the val/seg loss is 0.01174. This indicates that the model can effectively detect the dry beach region and can be utilized to measure the length of the dry beach.
Figure 8 shows different evaluation metrics for the model training results. The suffix “B” represents the “bounding box” and “M” signifies a “mask”. The figure shows an increase in precision and recall in the training results, suggesting that the model is not overfitted. Two crucial indicators, mAP_0.5(B) and mAP_0.5(M), are used to evaluate the model. mAP_0.5(B) evaluates the model’s performance by measuring the overlap between predicted and true bounding boxes at an IoU threshold of 0.5. mAP_0.5(M) evaluates the model’s performance by measuring the overlap between predicted and true masks at an IoU of 0.5. Figure 7 shows that after training, the accuracy of identifying dry beach areas is 0.89011 at mAP_0.5(B) and 0.89744 at mAP_0.5(M), demonstrating good accuracy in recognizing dry beach areas.

3.2.5. Edge Detection

The dry beach was segmented from the detected image based on the dry beach region mask. The segmented image needs to undergo preprocessing to remove color and noise effects to allow precise determination of the boundaries of the dry beach mask [46]. In this study, the Canny edge detection algorithm was used for image preprocessing.
The Canny edge detection technique is a widely used method in computer vision. It is known for its precise edge detection in images and its strong noise resistance. The Canny edge detection algorithm mainly includes the following four steps:
(1)
Noise reduction. There are noises in the image, which may affect the accuracy of edge detection, so the image needs to be denoised first. The common denoising method is to use Gaussian filtering, which convolves the image with the Gaussian filter to reduce noise in the image. Gaussian filter is a commonly used image processing filter based on Gaussian functions. The Gaussian distribution function is shown in Equation (5):
G x , y = 1 2 π σ 2 exp x 2 + y 2 2 σ 2
where σ denotes the parameters of the Gaussian filter. The original image I(x,y) is convolutionally smoothed with the Gaussian distribution function S(x,y) to obtain the image H(x,y). H(x,y) is shown in Equation (6):
H x , y = S x , y × I x y
(2)
Calculation of image gradient amplitude and direction. Image gradient amplitude can show the change in image pixels, and the gradient direction represents the change in the direction of image pixel intensity. The partial derivatives Wx (i, j) and WY (i, j) of pixel points (i, j) in the X and Y directions are shown in Formula (7) and Formula (8), respectively:
w x i , j = I i , j + 1 I i , j + I i + 1 , j + 1 I i ˙ + 1 , j 2
w y i , j = I i , j I i + 1 , j + I i , j + 1 I i ˙ + 1 , j + 1 2
At this time, the gradient amplitude w(I, J) and gradient direction at the pixel point θ(I, J) as shown in Formulas (9) and (10):
w i , j = w x 2 i , j + w y 2 i , j
θ i , j = arctan w x i , j w y i , j
(3)
Non-maximum suppression. The operation process of non-maximum suppression is to first determine the non-zero point of the gradient direction and then find two adjacent points along the directional derivative of the point. If the amplitude of two adjacent points exceeds the center point, then this non-zero point does not belong to the image edge, and its edge intensity is set to zero.
(4)
Dual threshold selection and edge connection. By setting high and low thresholds, the real and false edges of the image can be effectively distinguished, and finally only the real and useful edge information is retained, which can successfully suppress the existence of pseudo-edge.
Edge detection highlights the mask limit of the dry beach region in black while other sections are displayed in white, as depicted in Figure 9. This method allows for precise determination of the mask’s boundaries, facilitating subsequent linear equation fitting.

3.2.6. Fitting of Beach Crest Line

The dry beach length is the distance from the beach crest line to the dry beach boundary. Since the influence of noise cannot be completely eliminated during image processing, the extracted beach crest line contour may not appear as a straight line after edge identification. Therefore, an equation fitted to the beach crest line is required to facilitate subsequent length calculations.
According to the geometric characteristics of the discharge boundary of different tailings ponds, different polynomials can be selected for fitting. In this study, linear fitting is taken as an example to illustrate the fitting of the beach crest line. For some tailing ponds, in which the beach crest line is irregular, more complex fitting equations can be used. The least square method is the most common straight line fitting method. Given a set of points {(xi, yi) |1 ≤ i ≤ n}, the regression linear equation is y = ax + b. Let the sum of squared errors be:
E = i = 1 n a x i + b y i 2
When the regression line minimizes the sum of squared errors, it is sufficient to calculate the partial derivative of the line parameters. The parameters a and b meet:
E a = 0 ; E b = 0
Then we have the following equation:
i = 1 n 2 a x i + b y i x i = 0 ; i = 1 n 2 a x i + b y i = 0
By finding the values of a and b in the above method, the fitted line can be obtained.
OpenCV is an open-source software package used for computer vision processing. The functions in the OpenCV database are utilized for linear equation fitting. The equation of the line is found, as shown in Figure 10.

3.2.7. Length Calculation

This study involves a two-stage process for calculating length: the first phase determines the distances between pixel spots on the dry beach in the figure and the second step translates these distances into actual distances by scales.
For the purpose of this study, the dry beach length can be determined by measuring the distance from each pixel point on the dry beach boundary to the beach crest line. In geometric problems, the distance formula from point to line is widely used. The distance from point P(x0, y0) to line Ax + By + C = 0 is as shown in Formula (14):
d = A x 0 + B y 0 + C A 2 + B 2
Each pixel point on the dry beach contour line was traversed to calculate the pixel-point distance from each pixel point to the linear equation (the beach crest line). Figure 11 displays the schematic.
The pixel distances calculated above were converted. The satellite image resolution in this investigation was 2 m. The pixel distances of the dry beach in the image were converted to actual lengths using the scale information to obtain the actual maximum, minimum, and average distances of the dry beach length.

4. Case Study

A tailings pond located in Gansu Province, China, was used to validate the method proposed in this paper. The region is in the temperate monsoon season, with moderate rainfall and less cloud cover, which is conducive to satellite photography. The terrain where the tailings pond is located is dominated by mountains and hills, and the surrounding vegetation coverage is relatively sparse, and is mainly composed of grassland and shrubs. The tailings pond is of the valley type. The site location and landform is shown in Figure 12. There are three monitoring points, A, B, and C, for dry beach length on-site. Monitoring points A and B are positioned at one-third and two-thirds of the primary beach crest line, while monitoring point C is situated at the midpoint of the secondary beach crest line, as seen in Figure 13.

4.1. Identification Results of Dry Beach Area

Eight satellite images of the tailings pond were obtained in 2022 and 2023, with one image captured throughout each quarter of the year. Acquiring satellite imaging data for the past two years can assure their veracity. As shown in Figure 14, water levels, vegetation cover, and surface characteristics of tailing ponds vary seasonally. The YOLOv5-seg model was utilized to detect the dry beach area in eight satellite images, and the results of the recognition are displayed in Figure 14.

4.2. Calculation of Dry Beach Length

Taking the satellite image of December 2023 as an example, the recognition result of dry beach area is shown in Figure 15a. Edge detection was performed on Figure 15a and the extracted contour is shown in Figure 15b. The beach crest line was extracted and fitted. The linear equation for the left beach crest line was Y1 = 1.06X − 222.19, and for the right beach crest line, it was Y2 = 0.24X + 242.83. Both lines are displayed in Figure 16a. The dry beach length at monitoring points A, B, and C was calculated. Using line Y1 as the X-axis, the pixel point distances from points A and B on the line Y1 to the boundary of the dry beach were calculated by Equation (11), as shown in Figure 16b. Similarly, the pixel distance from point C to the boundary of the dry beach was calculated by Equation (11), as shown in Figure 16c. Finally, the pixel distance was converted to the actual distance according to the scale.

4.3. Analysis of Results

The on-site monitoring points of the dry beach length of the tailings pond are displayed in Figure 13. The actual length of the dry beach measured on site was used to verify the calculation results, as shown in Figure 17, Figure 18 and Figure 19. In this case, the minimum calculation error is 2.10%, the maximum calculation error is 3.46%, and the average error is 2.70%. This proves that the method used in this study is feasible and reliable. The dry beach length of the tailings pond represented obvious changes with different seasons. From monitoring point B, it can be concluded that from January 2022 to February 2023, the length of dry beach was shortened from 411.46 m to 343.18 m, and then to 390.44 m. The variation characteristics of dry beach length in 2023 were shorter in summer and longer in winter. This was because rain fell in summer, and the water level rose, submerged the dry beach, and shortened its length. In winter, there was less rainfall, the water level dropped, and the dry beach was exposed more. However, monitoring points A and C were located on the most two sides of the reservoir area. Due to the influence of topography, the dry beach length was relatively less affected by the season.

5. Conclusions

This study introduced a deep-learning-based method for determining the length of dry beach using satellite images. A case study was performed to verify the precision and efficiency of the proposed method. The following conclusions were drawn.
We started by collecting satellite images of tailing ponds to create a dataset. The dataset was used to train the YOLOv5-seg model, and the indicators of the trained model showed an accurate recognition effect. The dry beach length was eventually determined by three steps: edge detection, linear equation fitting, and length calculation. The results of the case study indicate that the minimum error for calculating the length of dry beach using this method is 2.10%, the maximum error is 3.46%, and the average error is 2.70%, indicating its feasibility in dry beach monitoring. This method is less affected by external environmental factors, requires less manual participation, and has high work efficiency. It can offer new ideas for monitoring the length of dry beaches and the safety of tailing ponds.
This study measures the dry beach’s length using satellite images of tailing ponds. The proposed method can save labor and measurement equipment. But there are still some limitations of this study. Satellite data updates have periodicity and cannot meet the requirements of real-time data acquisition. To address this, it is necessary to integrate unmanned aerial vehicles (UAVs) and remote sensing to establish a comprehensive data monitoring system.

Author Contributions

Conceptualization, Z.D. and Q.L.; Methodology, Y.T. and Z.D.; Dataset, Z.D. and G.L.; Software, Y.T. and X.C.; Validation, Y.T. and Z.D.; Formal Analysis, X.C. and Z.D.; Writing—Original Draft Preparation, Z.D.; Writing—Review and Editing, Z.D. and S.Z.; Supervision, Q.L.; Funding acquisition, Q.L. and Z.D. All authors have read and agreed to the published version of the manuscript.

Funding

This work was supported by the National Natural Science Fund of China (grant number 52304202), the National Key Research and Development Program of China (No. 2021YFC3001303), Science and Technology Plan of Beijing: Beijing–Tianjin–Hebei Science and Technology Innovation Collaboration (Z231100003923001), and the Research Start-up Fund of North China University of Technology.

Data Availability Statement

The data presented in this study are available on request from the corresponding author. The data are not publicly available due to company privacy.

Conflicts of Interest

Authors Xuan Cui and Shumao Zhang were employed by the company BGRIMM Technology Group. The remaining authors declare that the research was conducted in the absence of any commercial or financial relationships that could be construed as a potential conflict of interest.

References

  1. Bebbington, A.J.; Humphreys Bebbington, D.; Sauls, L.A.; Rogan, J.; Agrawal, S.; Gamboa, C.; Imhof, A.; Johnson, K.; Rosa, H.; Royo, A.; et al. Resource Extraction and Infrastructure Threaten Forest Cover and Community Rights. Proc. Natl. Acad. Sci. USA 2018, 115, 13164–13173. [Google Scholar] [CrossRef]
  2. Azam, S.; Li, Q. Tailings Dam Failures: A Review of the Last One Hundred Years. Geotech. News 2010, 28, 50–54. [Google Scholar]
  3. Zhou, H.M.; Liu, X.F. Comparing Analysis on the Way of Tailings Disposal in China and Australia. Adv. Mater. Res. 2014, 878, 206–212. [Google Scholar] [CrossRef]
  4. Lyu, Z.; Chai, J.; Xu, Z.; Qin, Y.; Cao, J. A Comprehensive Review on Reasons for Tailings Dam Failures Based on Case History. Adv. Civ. Eng. 2019, 2019, 4159306. [Google Scholar] [CrossRef]
  5. Rico, M.; Benito, G.; Salgueiro, A.R.; Díez-Herrero, A.; Pereira, H.G. Reported tailings dam failures: A review of the European incidents in the worldwide context. J. Hazard. Mater. 2008, 152, 846–852. [Google Scholar] [CrossRef]
  6. Kemp, D.; Owen, J.R.; Lèbre, É. Tailings Facility Failures in the Global Mining Industry: Will a ‘Transparency Turn’ Drive Change? Bus. Strategy Environ. 2021, 30, 122–134. [Google Scholar] [CrossRef]
  7. Owen, J.R.; Kemp, D.; Lèbre, É.; Svobodova, K.; Pérez Murillo, G. Catastrophic Tailings Dam Failures and Disaster Risk Disclosure. Int. J. Disaster Risk Reduct. 2020, 42, 101361. [Google Scholar] [CrossRef]
  8. Piciullo, L.; Storrøsten, E.B.; Liu, Z.; Nadim, F.; Lacasse, S. A New Look at the Statistics of Tailings Dam Failures. Eng. Geol. 2022, 303, 106657. [Google Scholar] [CrossRef]
  9. Stark, T.D.; Moya, L.; Lin, J. Rates and Causes of Tailings Dam Failures. Adv. Civ. Eng. 2022, 2022, 7895880. [Google Scholar] [CrossRef]
  10. Hatje, V.; Pedreira, R.M.A.; De Rezende, C.E.; Schettini, C.A.F.; De Souza, G.C.; Marin, D.C.; Hackspacher, P.C. The Environmental Impacts of One of the Largest Tailing Dam Failures Worldwide. Sci. Rep. 2017, 7, 10706. [Google Scholar] [CrossRef]
  11. Williams, D.J. Lessons from Tailings Dam Failures—Where to Go from Here? Minerals 2021, 11, 853. [Google Scholar] [CrossRef]
  12. Lin, S.-Q.; Wang, G.-J.; Liu, W.-L.; Zhao, B.; Shen, Y.-M.; Wang, M.-L.; Li, X.-S. Regional Distribution and Causes of Global Mine Tailings Dam Failures. Metals 2022, 12, 905. [Google Scholar] [CrossRef]
  13. Mendes, R.G.; Do Valle Junior, R.F.; De Melo Silva, M.M.A.P.; De Morais Fernandes, G.H.; Fernandes, L.F.S.; Pissarra, T.C.T.; De Melo, M.C.; Valera, C.A.; Pacheco, F.A.L. Scenarios of Environmental Deterioration in the Paraopeba River, in the Three Years after the Breach of B1 Tailings Dam in Brumadinho (Minas Gerais, Brazil). Sci. Total Environ. 2023, 891, 164426. [Google Scholar] [CrossRef]
  14. Fernandes, G.W.; Goulart, F.F.; Ranieri, B.D.; Coelho, M.S.; Dales, K.; Boesche, N.; Bustamante, M.; Carvalho, F.A.; Carvalho, D.C.; Dirzo, R.; et al. Deep into the Mud: Ecological and Socio-Economic Impacts of the Dam Breach in Mariana, Brazil. Nat. Conserv. 2016, 14, 35–45. [Google Scholar] [CrossRef]
  15. Wu, M.; Ye, Y.; Hu, N.; Wang, Q.; Tan, W. Scientometric Analysis on the Review Research Evolution of Tailings Dam Failure Disasters. Environ. Sci. Pollut. Res. 2022, 30, 13945–13959. [Google Scholar] [CrossRef]
  16. Wu, X. Image Extraction of Tailings Pond Guided by Artificial Intelligence Support Vector Machine. Wirel. Commun. Mob. Comput. 2022, 2022, 9406930. [Google Scholar] [CrossRef]
  17. Li, Q.; Duan, Z.; Shi, H.; Yu, Y.; Zhang, H.; Fu, B. Development of a full-scale flume test system for depositional behavior study of segregating tailings. Bull. Eng. Geol. Environ. 2024, 83, 66. [Google Scholar] [CrossRef]
  18. Petkovsek, G.; Hassan, M.; Lumbroso, D.; Collell, M.R. A Two-Fluid Simulation of Tailings Dam Breaching. Mine Water Environ. 2021, 40, 151–165. [Google Scholar] [CrossRef]
  19. Zhou, L.; Xie, L.; Zheng, S. Automated Monitoring System for Tailings Pond Dry Beach. CN201237502, 13 May 2009. [Google Scholar]
  20. Le, K.; Yan, X.; Chen, C. A Device and Method for Measuring the Slope and Length of Dry Beaches. CN101865684B, 23 May 2012. [Google Scholar]
  21. Liu, Y.; Zhao, H.; Pu, H.; Li, X. A Dry Beach Length Measurement Device and Its Measurement Method. CN104713521A, 17 June 2015. [Google Scholar]
  22. Adil, E.; Mikou, M.; Mouhsen, A. A novel algorithm for distance measurement using stereo camera. CAAI. Trans. Intell. Technol. 2022, 7, 177–186. [Google Scholar] [CrossRef]
  23. Sadreddini, Z.; Çavdar, T.; Jond, H.B. A distance measurement method using single camera for indoor environments. In Proceedings of the 2016 39th International Conference on Telecommunications and Signal Processing (TSP), Vienna, Austria, 27–29 June 2016; pp. 462–465. [Google Scholar]
  24. Hu, J.; Hu, S.; Kang, F.; Zhang, J. Real-Time Dry Beach Length Monitoring for Tailings Dams Based on Visual Measurement. Math. Probl. Eng. 2013, 2013, 935371. [Google Scholar] [CrossRef]
  25. Huang, Q.; Li, Q.; Wang, Y.; Zhang, J. Dry Beach of Tailings Dam Length Measurement Based on Waterline Recognition. In Proceedings of the 2015 IEEE Advanced Information Technology, Electronic and Automation Control Conference (IAEAC), Chongqing, China, 19–20 December 2015; IEEE: Chongqing, China, 2015; pp. 503–507. [Google Scholar] [CrossRef]
  26. Yang, J.; Sun, Y.; Li, Q.; Qian, Z. Measure Dry Beach Length of Tailings Pond Using Deep Learning Algorithm. In Proceedings of the 2019 International Conference on Robotics, Intelligent Control and Artificial Intelligence, Shanghai, China, 20–22 September 2019; ACM: Shanghai, China, 2019; pp. 503–508. [Google Scholar] [CrossRef]
  27. Tauro, F.; Olivieri, G.; Petroselli, A.; Porfiri, M.; Grimaldi, S. Flow monitoring with a camera: A case study on a flood event in the tiber river. Environ. Monit. Assess. 2016, 188, 118. [Google Scholar] [CrossRef]
  28. Torralba, A.; Russell, B.C.; Yuen, J. LabelMe: Online image annotation and applications. Proc. IEEE 2010, 98, 1467–1484. [Google Scholar] [CrossRef]
  29. Xie, J.; Huang, G.; Liu, R.; Zhao, C.; Dai, J.; Jin, T.; Mo, F.; Zhen, Y.; Xi, S.; Tang, H.; et al. Design and Data Processing of China’s First Spaceborne Laser Altimeter System for Earth Observation: GaoFen-7. IEEE J. Sel. Top. Appl. Earth Obs. Remote Sens. 2020, 13, 1034–1044. [Google Scholar] [CrossRef]
  30. Li, G.; Tang, X. Accuracy evaluation of large lake water level measurement based on GF-7 laser altimetry data. Natl. Remote Sens. Bull. 2022, 26, 138–147. [Google Scholar] [CrossRef]
  31. Mofid, N.; Bayrooti, J.; Ravi, S. Keep your AI-es on the road: Tackling distracted driver detection with convolutional neural networks and targeted data augmentation. arXiv 2020, arXiv:2006.10955. [Google Scholar]
  32. Yoo, J.; Kang, S. Class-Adaptive Data Augmentation for Image Classification. IEEE Access 2023, 11, 26393–26402. [Google Scholar] [CrossRef]
  33. Nguyen, Q.H.; Ly, H.-B.; Ho, L.S.; Al-Ansari, N.; Le, H.V.; Tran, V.Q.; Prakash, I.; Pham, B.T. Influence of Data Splitting on Performance of Machine Learning Models in Prediction of Shear Strength of Soil. Math. Probl. Eng. 2021, 2021, 4832864. [Google Scholar] [CrossRef]
  34. Lobo, V.G.R.; Fonseca, T.C.O.; Moura, F.A.S. Bayesian Cross-Validation of Geostatistical Models. Spat. Stat. 2020, 35, 100394. [Google Scholar] [CrossRef]
  35. Sampurno, R.M.; Liu, Z.; Abeyrathna, R.M.; Ahamed, T. Intrarow Uncut Weed Detection Using You-Only-Look-Once Instance Segmentation for Orchard Plantations. Sensors 2024, 24, 893. [Google Scholar] [CrossRef]
  36. Zhang, J.; Liang, H.; Tong, S.; Zhou, Y.; Kan, J. An Advanced Software Platform and Algorithmic Framework for Mobile DBH Data Acquisition. Forests 2023, 14, 2334. [Google Scholar] [CrossRef]
  37. Rong, T.; Wang, C.; Luo, Q.; Li, Y. Underwater shipwreck target detection based on audio-visual heterogeneous data. In Proceedings of the OCEANS 2023—Limerick, Limerick, Ireland, 5–8 June 2023; pp. 1–6. [Google Scholar] [CrossRef]
  38. Niu, K.; Wang, C.; Xu, J.; Yang, C.; Zhou, X.; Yang, X. An Improved YOLOv5s-Seg Detection and Segmentation Model for the Accurate Identification of Forest Fires Based on UAV Infrared Image. Remote Sens. 2023, 15, 4694. [Google Scholar] [CrossRef]
  39. Elfwing, S.; Uchibe, E.; Doya, K. Sigmoid-weighted linear units for neural network function approximation in reinforcement learning. Neural Netw. 2018, 107, 3–11. [Google Scholar] [CrossRef]
  40. Hu, J.; Li, G.; Mo, H.; Lv, Y.; Qian, T.; Chen, M.; Lu, S. Crop Node Detection and Internode Length Estimation Using an Improved YOLOv5 Model. Agriculture 2023, 13, 473. [Google Scholar] [CrossRef]
  41. Flores-Calero, M.; Astudillo, C.A.; Guevara, D.; Maza, J.; Lita, B.S.; Defaz, B.; Ante, J.S.; Zabala-Blanco, D.; Armingol Moreno, J.M. Traffic Sign Detection and Recognition Using YOLO Object Detection Algorithm: A Systematic Review. Mathematics 2024, 12, 297. [Google Scholar] [CrossRef]
  42. Gong, H.; Mu, T.; Li, Q.; Dai, H.; Li, C.; He, Z.; Wang, W.; Han, F.; Tuniyazi, A.; Li, H.; et al. Swin-Transformer-Enabled YOLOv5 with Attention Mechanism for Small Object Detection on Satellite Images. Remote Sens. 2022, 14, 2861. [Google Scholar] [CrossRef]
  43. Lee, S.; Lee, J.; Moon, H.; Park, C.; Seo, J.; Eo, S.; Koo, S.; Lim, H. A Survey on Evaluation Metrics for Machine Translation. Mathematics 2023, 11, 1006. [Google Scholar] [CrossRef]
  44. Everingham, M.; Eslami, S.M.A.; Van Gool, L.; Williams, C.K.I.; Winn, J.; Zisserman, A. The Pascal Visual Object Classes Challenge: A Retrospective. Int. J. Comput. Vis. 2015, 111, 98–136. [Google Scholar] [CrossRef]
  45. Zhang, L.; Zhao, C.; Feng, Y.; Li, D. Pests Identification of IP102 by YOLOv5 Embedded with the Novel Lightweight Module. Agronomy 2023, 13, 1583. [Google Scholar] [CrossRef]
  46. Jiang, X.; Xu, S.; Wu, J.; Zhou, C.; Ji, S. Boosting Noise Reduction Effect via Unsupervised Fine-Tuning Strategy. Appl. Sci. 2024, 14, 1742. [Google Scholar] [CrossRef]
Figure 1. The structure of a tailings pond and dry beach.
Applsci 14 07560 g001
Figure 2. Diagram of the research framework.
Applsci 14 07560 g002
Figure 3. Picture enhancement. (a) original image; (b) darkening; (c) mirroring; (d) rotating; (e) adding noise.
Applsci 14 07560 g003
Figure 4. Annotated diagram example. (a) original image; (b) annotation labels; (c) annotation results.
Applsci 14 07560 g004
Figure 5. YOLOv5-seg structure diagram.
Applsci 14 07560 g005
Figure 6. Verification results. (a) Original images; (b) recognition results.
Applsci 14 07560 g006aApplsci 14 07560 g006b
Figure 7. Results for different loss functions. (a) Train/loss; (b) val/loss.
Applsci 14 07560 g007
Figure 8. Results of different evaluation indicators. (a) Precision; (b) recall; (c) mAP_0.5.
Applsci 14 07560 g008
Figure 9. Preprocessed image. (a) Detected image before preprocessing; (b) image after edge detection.
Applsci 14 07560 g009
Figure 10. Straight-line fitting treatment. (a) Preprocessing image; (b) linear fitting to beach crest line.
Applsci 14 07560 g010
Figure 11. Calculation of pixel distance of dry beach length.
Applsci 14 07560 g011
Figure 12. Site location of the tailings pond. (a) Site location; (b) satellite image of the tailings pond; (c) terrain and landform of tailings pond.
Applsci 14 07560 g012
Figure 13. Layout of monitoring sites A, B, and C.
Applsci 14 07560 g013
Figure 14. Identification results of dry beach area.
Applsci 14 07560 g014
Figure 15. (a) Detection results; (b) edge detection results.
Applsci 14 07560 g015
Figure 16. (a) Line fitting; (b) length calculation of monitoring points A and B; (c) length calculation of monitoring point C.
Applsci 14 07560 g016
Figure 17. Measurement and calculation results of monitoring point A.
Applsci 14 07560 g017
Figure 18. Measurement and calculation results of monitoring point B.
Applsci 14 07560 g018
Figure 19. Measurement and calculation results of monitoring point C.
Applsci 14 07560 g019
Table 1. Model training environment.
NameDetails
CPUIntel Core i7-13700H (Intel, Santa Clara, CA, USA)
GPUNVIDIA GeForce RTX 4060 (NVIDIA, Santa Clara, CA, USA)
Memory32G
Image size640 × 640
Batch size16
Learning rate0.01
Epoch200
Disclaimer/Publisher’s Note: The statements, opinions and data contained in all publications are solely those of the individual author(s) and contributor(s) and not of MDPI and/or the editor(s). MDPI and/or the editor(s) disclaim responsibility for any injury to people or property resulting from any ideas, methods, instructions or products referred to in the content.

