
Lévy Flight and the Interpersonal Distance of a Pedestrian in a Crowd

SFR Matrix, MOLTECH-Anjou—UMR CNRS 6200, Université d’Angers, F-49000 Angers, France
Appl. Sci. 2024, 14(17), 7585; https://doi.org/10.3390/app14177585
Submission received: 15 July 2024
/
Revised: 20 August 2024
/
Accepted: 24 August 2024
/
Published: 27 August 2024
(This article belongs to the Section Transportation and Future Mobility)
Abstract
:A simple self-experiment allows for the measurement of individual pedestrian movements, aiming to understand the deviations from intended directions seen in heterogeneous human crowds. The method involves pedestrian self-observations using the GPS sensor of a smartphone, providing a unique perspective on individual behavior within a crowd and offering a means to evaluate average pedestrian speed. The study is focused on individual mobility in the context of a heterogeneous crowd rather than the behavior of a crowd composed of similar types of people. With this study, an important contribution to the understanding of interpersonal distances in heterogeneous crowds is made.
1. Introduction
Human mobility has been studied extensively to understand the statistics behind trajectories ranging from a few to thousands of kilometers that occur over short periods of time. D. Brockmann et al. [1] used circulation patterns of banknotes in the United States for studying human travel. The trajectories of banknotes are reminiscent of Lévy flights. The authors concluded that human travel on geographical scales is a superdiffusive process. Marta C. Gonzalez et al. [2] studied the statistical characteristics of intra-urban mobility by considering mobile phone users whose positions are tracked for a six-month period. They measured the distances between the user’s positions during consecutive calls. The distribution of displacements over all users is well approximated by a truncated power law.
An understanding of the basic laws governing human motion is yet to be developed.
All comprehensive analysis remains useful, but there is a need to develop tools for monitoring the time-resolved locations of individuals. Pedestrian movement in a crowd represents a complex system of intentional movements to avoid collisions in order to reach a specific point. These movements include individual and inter-individual actions according to the environment. Previous works have shown the statistical properties of pedestrian dynamics [3,4]. Other experiments have been related to the simulation of micro pedestrian behaviors in shopping streets [5] or pedestrian counterflow in a corridor [6]. Elsewhere, L. Alessandretti et al., tried to understand the differences in mobility behavior across countries, gender groups, and urban-rural areas [7].
However, the deviations of individual movements from the desired directions in human crowds are still poorly understood. Do individuals within human crowds consistently demonstrate consciously random motions? Specifically, as pedestrians navigate through a crowd, can their movements be interpreted through identifiable statistical properties? If such properties exist, do they impact functional aspects such as lane formation or self-behavior?
Collecting the trajectories of pedestrians in crowds allows the detailed analysis of individual movements [8]. The microscopic modeling of trajectories, in order to enable further development in cities, needs an understanding of behaviors at the individual level.
Another reason for the current study is to confirm the results already reported regarding human mobility, albeit conducting experiments on a smaller scale in a confined space. The results have revealed that the mobility patterns of participants in outdoor settings (campuses, metropolitan areas, etc.) closely resemble those of Lévy walks in monkeys [9]. Flight distributions and pause-time distributions closely follow (truncated) power-law distributions. However, in this study, for most of the time, the participants walk in different locations over large surfaces and may also occasionally travel by bus, trolley, cars, or subway trains.
In the present experiment, a simple self-experiment is presented to measure the path of an individual pedestrian. The study has two distinct impacts. The first one is the presentation of individual human mobility and behavior, modeled as a Lévy flight, and the second one is a method to measure the average speed of a pedestrian in a crowd. This is an active experiment (involving walking as fast as possible through a saturated crowd in an outdoor environment). Moreover, most previous studies used remote instruments, for example, an optical tracking system [10] or thermal imaging [11]. A. Seyfried et al., argued that there are insufficient methods of data capture or inadequate resolution in the measurement of time and space for assessing pedestrian dynamics in a crowd [12]. In this study, the walker himself conducts the measurement with his smartphone, and the pedestrian behavior is monitored by self-observation. This study is not about crowds and the behavior of groups of pedestrians in a crowd but about the behavior of a pedestrian who tries to walk as fast as possible in a crowd over a limited transverse distance. Previous experimental measurements have involved adult participants (volunteers). Most have strong physical similarities (they are adults, of average height, etc.). In this manuscript, the originality comes from the number of participants (young adults, elderly adults, children, individuals, groups, families, etc.) and their ethnic origins. To the best of our knowledge, no study has been conducted on pedestrian analysis in the context of a fairground corridor or, more generally, a gathering of people for a demonstration or festive event, with inhomogeneous subjects and differences among participants. An interpersonal distance between groups has been determined, and a general simple method is described herein for measuring interpersonal distance in a heterogeneous crowd. In this work, a novel and generic framework is introduced, allowing us to describe the dynamics of a pedestrian in a simple, geometric local setting, significantly extending previous works on gatherings of people at a local event.
2. Materials and Methods
The experiment took place in a funfair with dimensions of approximately 100 m × 400 m. The funfair was divided into three corridors, each with a transverse size of 4.5 m ± 0.2 m. Pedestrians walked in two directions within each corridor. The estimated number of people passing in front of a stationary point in the middle of the corridor length was 70 ± 5 persons/min. The experiment involved measuring the pedestrian’s path when moving through the crowd in the corridor as quickly as possible (Figure 1) and avoiding interacting as much as possible with other pedestrians. The path was recorded using a smartphone held by a pedestrian during his route. The smartphone captured GPS data that could be stored and analyzed later. Several paths were recorded at different times of the day. The GPS measurements began after several seconds in order to acquire the maximum number of GPS satellites (≈30). The GPS data were stored as longitude and latitude data. The GPS latitude-longitude coordinates or geographic coordinates (WGS84: World Geodetic System) were then transformed into UTM (Universal Transverse Mercator) X and Y coordinates, recorded in meters [13]. WGS84 is an Earth-centered, Earth-fixed terrestrial reference system and geodetic datum. The typical absolute accuracy of GPS positioning is between 4 and 7 m. In this experiment, the resolution depended on the sampling measurements and the difference between two GPS positions, which led to a relatively higher resolution for the walking path. The measurement of relative positions was evaluated by measuring the width of the corridor, which was a known distance that was measured precisely. The measurement had an uncertainty of ±20 cm.
The drift observed during measurements with the GPS sensor cams from the absolute Earth position coordinates acquired during the experiment. The observer’s path was confined within a corridor, but the corridor direction was oriented at an angle of around 10° to the true north. The drift was suppressed in the calculations and the observer’s relative path with respect to the corridor direction was calculated. The measurements were relative, without the aim of precisely determining the position but rather of estimating trajectories by measuring the distance between two GPS acquisitions. The maximum sampling rate for GPS achievable on the Android smartphone is 1 Hz. Considering the funfair environment, pedestrians in the corridor had an average walking speed of less than 1.2 m/s. The average number of people was estimated to be 1.3 ± 0.2 persons/m2. This value was an average value taken at different places in the funfair. The acquisitions were conducted in different corridors of the funfair and in two different directions (forward and back). Measurements were taken in a relatively short time, limiting any offsets. The atmosphere or canopy was a source of noise because of its radiation absorption. The experiments were conducted far from any important electromagnetic radiation sources in an open-air area. The experiments were repeated several times (moving forward and back in the corridor) over two days at the end of the week.
3. Results and Data Analysis
Due to the influence of the subjective intentions of pedestrians, the interactions between the pedestrian under test and others, as well as between the pedestrians and the environment, suggest a complex mobility pattern for the optimum path through the crowd. People were not only walking in forward and backward directions but also standing still in the corridor to observe the playgrounds. Walkers could also randomly cross the corridor transversally when attracted by another activity.
The measured GPS trajectories are illustrated in Figure 2. The pedestrian being tested, who is equipped with a smartphone, anticipates the movements of his neighbors in the opposite or lateral direction by adjusting his trajectory. The trajectory is irregular, with sudden jumps. The tested pedestrian also has to adjust his trajectory based on the number of walkers in front of him to allow him to move as fast as possible. In the corridor, individuals or groups of 2 or 3 walkers may find themselves facing each other, walking in the same or the opposite direction. In such cases, the movement of the tested walker leads to angles close to 90° in order to continue on a trajectory that is parallel to the group of walkers. The paths of walkers crossing the corridor transversally also result in angles greater than 90° to avoid potential collisions with others. The size of the corridor confines the walker and prevents large movements in the y-direction but, at the same time, gives enough degrees of freedom. The trajectories mostly fluctuate in the perpendicular direction of the flow.
To understand the changes in the direction of the tested pedestrian, the distribution of turning angles between successive steps is depicted in Figure 3. It represents the net angular change in orientation between two consecutive directions along the pedestrian path. The angles are calculated with θ = atan(Δy/Δx). The histogram of the angles can be fitted with a Gaussian distribution (Figure 3a).
The pedestrian under test in the corridor does not exhibit evidence of pre-wired preferential angles. While there is a directional trend of moving forward, the resulting probability distribution forms a uniform bell-shaped curve centered at 19.8°, with a standard deviation of ± 57.8°. The absence of preferential angles is identified by the persistence of forward movement. All measured trajectory speeds follow a Gaussian distribution, with a peak at 0.8 m/s (Figure 3b).
The pedestrian’s movements are influenced not only by the current positions of his neighbors but also by the anticipation of future positions. Pedestrians in a crowded environment are constrained by their neighbors to choose a direction; they actively seek a clear passage through the crowd, adhering to a form of politeness or respect, and anticipate the movements of their neighbors in the opposite direction. Thus, the trajectories of individual pedestrians in oppositely moving flows will dynamically evolve into unidirectional lanes and limit the deviations from their desired direction (i.e., taking a direct path to their destination). In this study, the lane formation is limited due to attractiveness on both sides of the corridor, giving a clear, random characteristic of the crowd.
This result also confirms the randomness of the distance covered between each evasive movement of a walker in the lane. The average value of the velocity distribution is 0.8 m/s, with a standard deviation of 0.4 m/s (Figure 3b). It can be observed that the range of speeds extends from a very low velocity of 0.1 m/s to a high velocity (1.6 m/s). The spread of speed values results from the inhomogeneity of pedestrian movements and the diversity of ages and cultures of the people within the crowd (popular event).
The low value of cross-correlation between angles and speed that was inserted in the speed measurement (Figure 3b) confirms the independence between the speed and angles of deviation of the pedestrian under test.
The pedestrian under test chooses to walk along a trajectory deviated by an angle of θ, rather than waiting, either motionless or moving slowly, for the flow of people to pass around him. When the angle is chosen heuristically, as seen in Figure 3c, the speed increases to a maximum. A delay is observed between the choice of angle and the rapid increase in speed. This speed decreases when a new angle is selected. Surprisingly, the maximum speed along the trajectory is almost periodic. To determine the relationship between speed and the choice of an angle of deviation, the maximum angle and speed values are thresholded and reduced to binary values. Speed and angle peaks as a function of time are then determined as a binary variation over time. The Δt values between each of the speed peaks are determined and averaged over the number of trajectories measured. In total, 12 trajectory values are considered. From the mean value of the times () between each speed peak and a calculated average speed () of 0.74 m/s (Figure 3c), we can estimate the space between each group of people. This space is called ‘interpersonal group distance’ (IGD) (Figure 3d). We find, using the following calculation [14,15], that:
IGD = 1.67 m is the interpersonal distance (ID) in the range [0.85 m, 2.52 m], which is in agreement with the values of ‘proxemics theory for social’ purposes [16]. The value must be differentiated from the values of distance within a group itself. The interpersonal distance inside groups with heterogeneity varies from 0.61 m to 0.32 m if it involves a group of two males or an adult and a child [16].
A method for achieving the 3D tracking of nanoparticle motions in a microfluidic channel was developed by Larissa Kohler et al. [17]. The diffusivity and nanoparticle size from a 3D track were established by calculating the mean squared displacement (MSD) value. Stochastic motions highlight the significance of statistical distributions in dynamic systems. Brownian motion has been utilized to model diverse phenomena, such as price fluctuations [18].
Theoretically, the motion in the x and y directions follows a random path, resulting in a two-dimensional mean displacement ⟨Δr⟩ of zero; the mean squared displacement ⟨Δr2⟩ is given by:
⟨Δr2⟩ = ⟨Δx2⟩ + ⟨Δy2⟩ = 4Dt
Here, ⟨Δx2⟩ and ⟨Δy2⟩ are the one-dimensional MSD, D is the diffusion coefficient, and t is the time between data points.
However, Brownian motion can be viewed as a special member of the class of Lévy-flight random walks [19]. A flight is defined as the longest straight-line path of a particle from one point to another without a directional change or pause. Lévy flights describe a class of random walks where the step lengths follow a power-law tailed distribution [20]. In a Lévy flight, the probability P(d) that the walker performs a jump of length d is given by:
where 1 < γ < 3. Lévy flights have been proven to be the best strategy that can be adopted in random searches or for animal foraging [21]. Lévy flights have been observed in the movement patterns of various species, ranging from albatrosses [22] to marine predators, and from spider monkeys [9] to mussels [23]. Lévy flights display various facets of human dynamics and behavior [24]. Lévy flights have also been observed in pedestrian interactions [25]. I. Rhee et al., explored human walking patterns in five outdoor sites and evaluated the performance of mobile networks [26]. They found that human walks in outdoor settings of less than 10 km contain statistically similar features to Lévy walks. C. Feliciani et al. [27] studied pedestrians walking in opposite directions in a mock corridor, obtaining tracking data from video recordings using statistical and fluid-dynamic methods. They also observed Lévy flights. Experiments conducted with pedestrians outdoors or in bottlenecks revealed a power–law relationship underlying pedestrian interactions [28]. Other experiments found that aggregated displacements for students, employees, retirees, and unemployed people all follow a power law with an exponential cut-off. The results were explained by the mixed nature of human travel under the principle of maximum entropy [29].
P(d) ∝ d−γ
With the goal of having details about trajectories and velocities, the most common method for identifying diffusion types is based on mean squared displacement (MSD) [30]. This calculation evaluates the deviation of an individual’s position with respect to their initial position after a time lag. Motion types can be identified based on the diffusion exponent. MSD has been widely applied for various trajectory analysis studies in physics [31].
In order to study the free-scale patterns of the pedestrian under test, a first calculation as a function of time is performed. The trajectories are then decomposed into the x-component and y-component, with x along the corridor length and y being perpendicular to the corridor length. The mean-squared displacement yield of the walking of the solitary pedestrian who is confined in the corridor is:
where time ti refers to the time for the ith position in the GPS-acquired trajectory and Ni is the number of GPS positions used to calculate the average value.
The average distance is represented as a function of time for the 2D movements recorded during the measured trajectory. The MSD square for a trajectory is then acquired with the smartphone GPS and is depicted in Figure 4. A fit with a power law allows us to consider that the mean-squared displacements along the trajectory during the time of the experiment follow a linear trend in the log-log plot. The mean square displacement can be described using the following power law: Δr2(t) ∝ Dtα. When α = 1, the process is called Brownian or normal diffusion. When α > 1, the process is referred to as a super-diffusion process. The diffusion exponent obtained in Figure 4 is 1.49 faster than in the case of a Brownian process, indicating that the pedestrian under test has followed a super-diffusive dynamic along the trajectory. This value is within the range of all the values calculated for the different trajectories. An average value of 1.76 for all the calculated coefficients α is found in the range of [αmin = 1.14, αmax = 2.2].
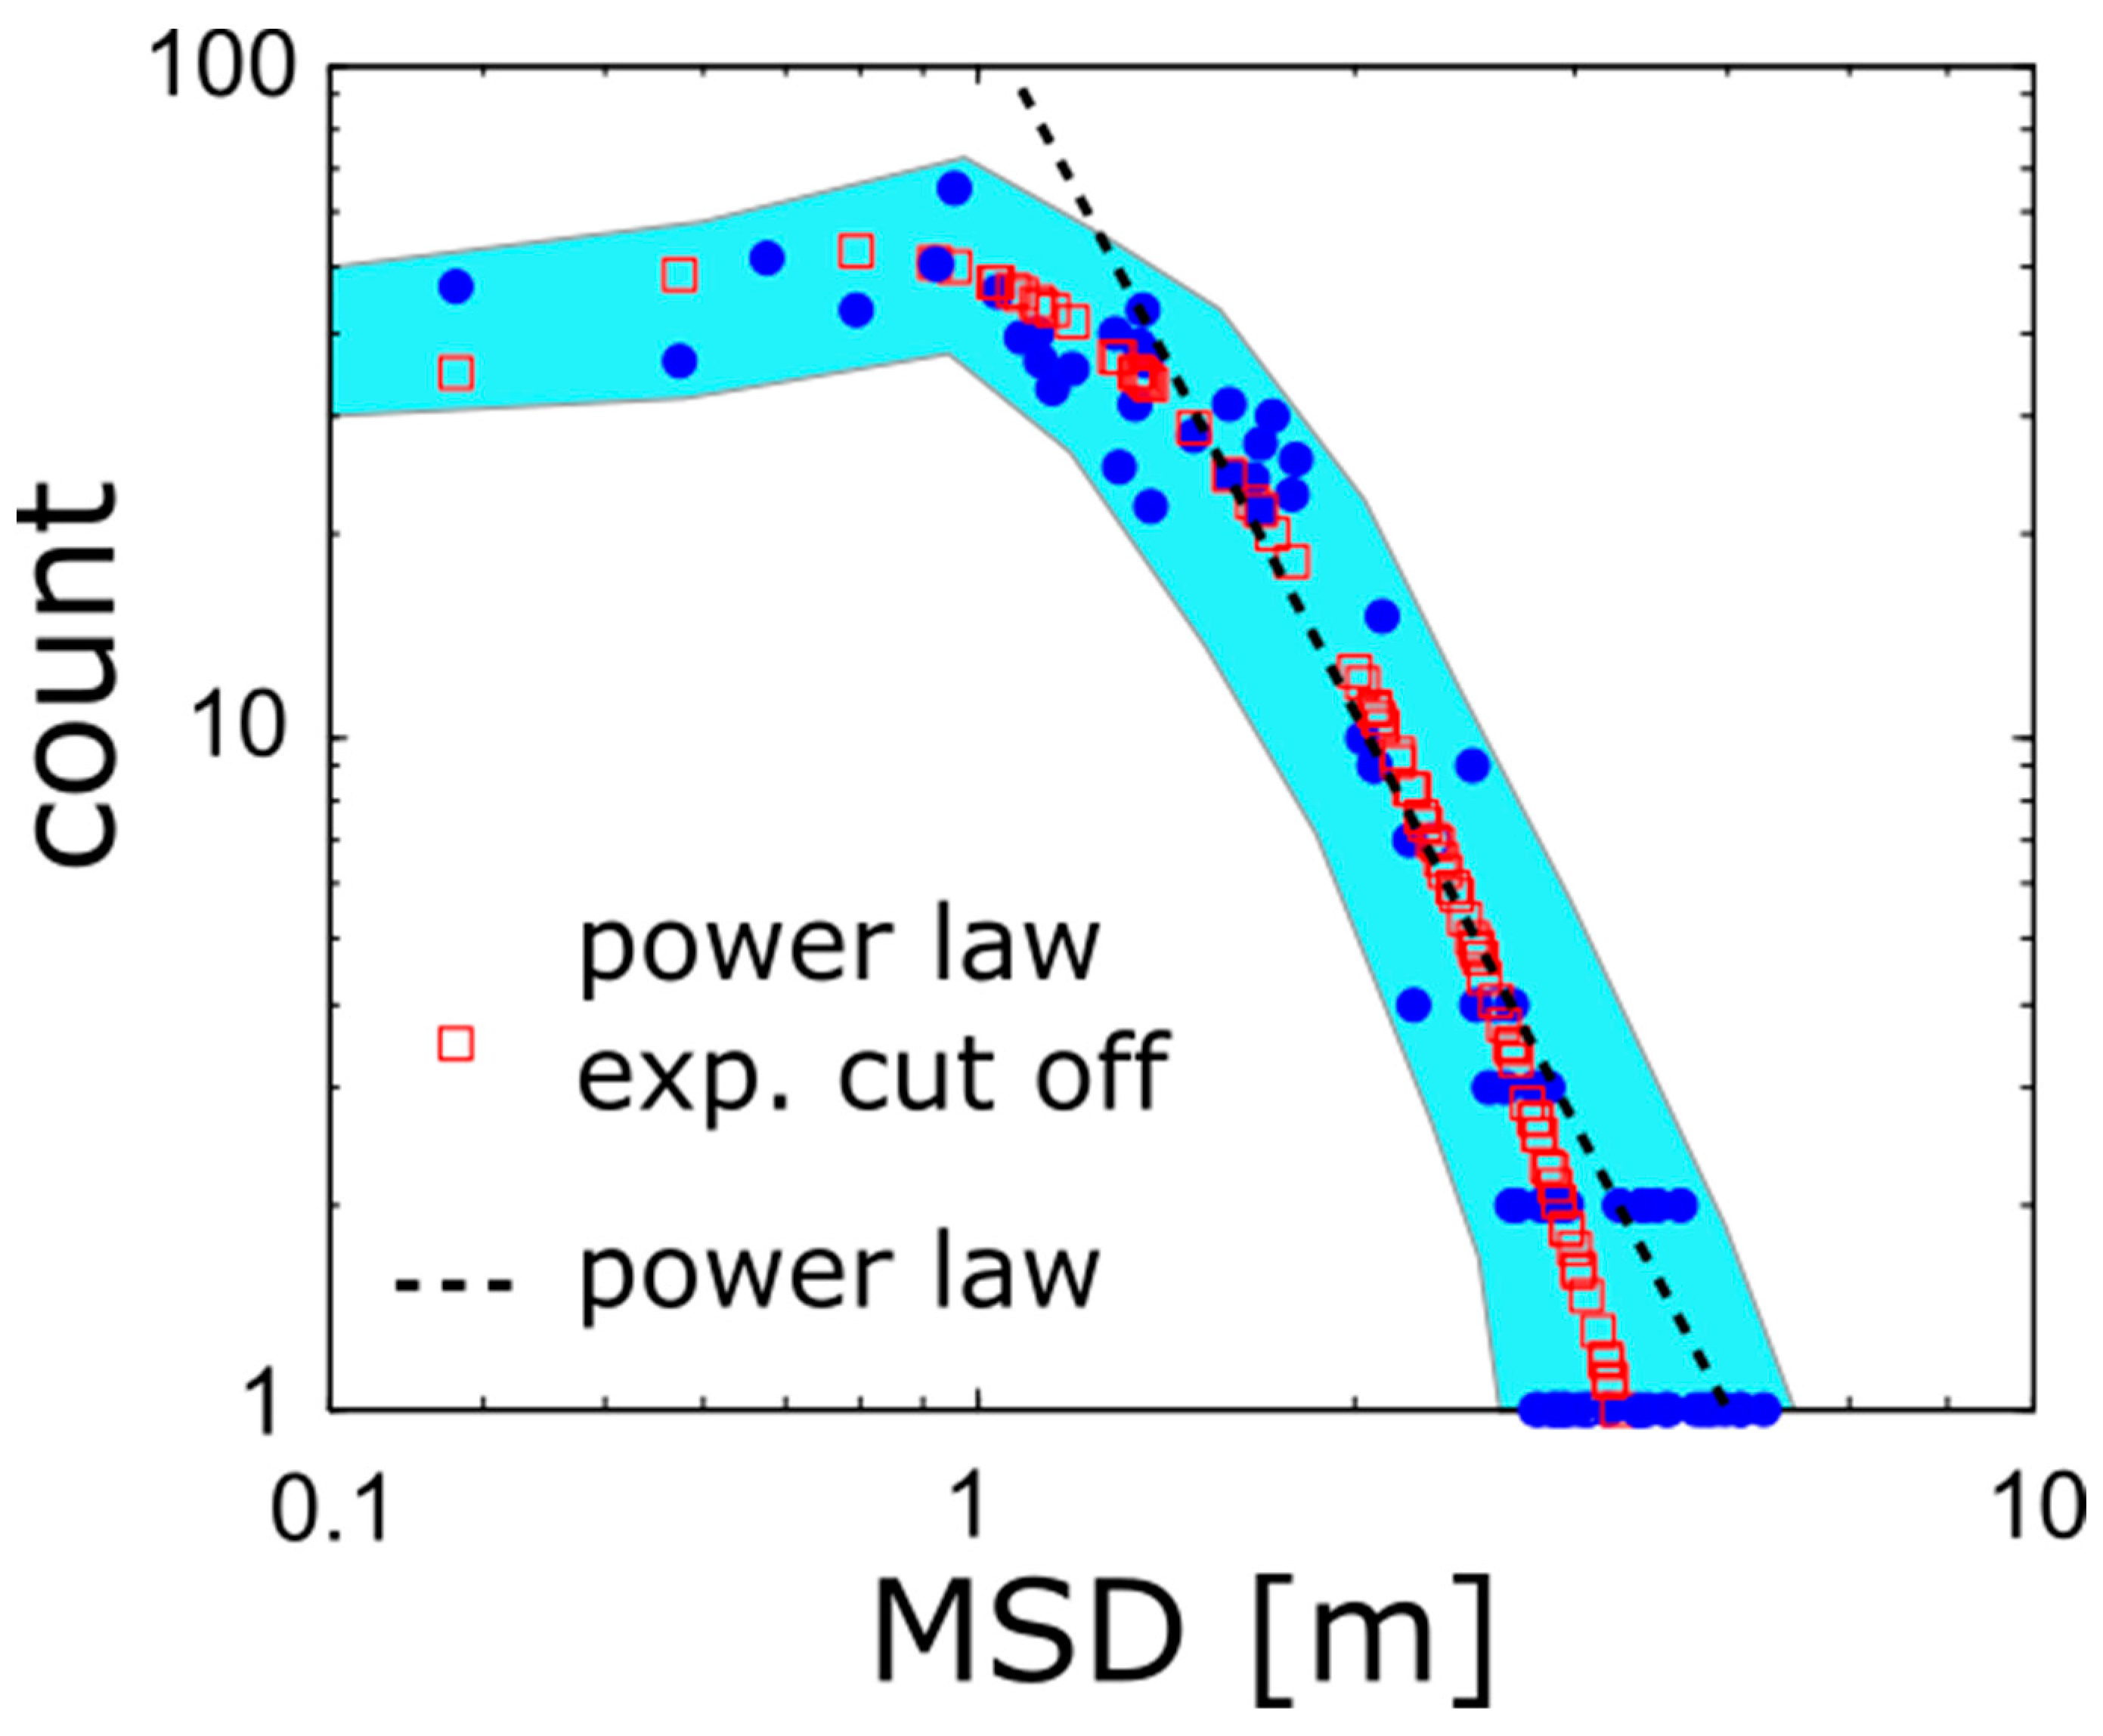
A second calculation is made as a function of the different jump distances. The step-length distributions (i.e., the flight-segment length observed in Figure 2) are fitted to truncated power laws (as expected for Lévy flights), and exponentially truncated power laws with the following equations:
where N1 and N2 are normalization factors that ensure that the distributions sum correctly to unity when integrated over all time intervals between the lower and upper cut-offs, and ; μ1 and μ2 are the power-law exponent, and λ1 is the exponential decay rate [32]. The results are depicted in Figure 5, along with the best-fitting truncated power law and exponential models. For the truncated power law, we chose exponential decay for the longest flights, as reported by Edwards et al. [33]. In this way, our truncated power law model captures the transition from a super-diffusive to a diffusive process. We fitted the models using a maximum likelihood method [34], which has been considered the most accurate method for fitting the power law models, as used by E. P. White et al. [35].
The results were analyzed and plotted with the MATLAB software R2023a. We found the values of 28.3 for N1 and 853 for N2, 2.2 and 2.19 for μ1 and μ2, respectively, and 2.87 for λ1. The lower and upper cut-offs, ℓ1 and ℓ2, are 1.42 m and 2.7 m, respectively. Maximum likelihood estimation (MLE) was used for estimating the parameters. MLE determines the parameter values that maximize the likelihood of the model (in the model, this is a power law with an unknown exponent), given the measured data [36].
The upper cut-offs were taken to be the lengths of the longest recorded flight segments. The distribution is truncated at the length of the longest step in the pedestrian path. The cumulative flight distribution corresponding to the truncated power law is curvilinear when plotted on log-log scales.
The exponent μ falls within the interval 1 < μ < 3, implying that when the pedestrians walked toward a crowd approaching from the opposite direction, their search patterns followed a Lévy walk in a direction perpendicular to the flow.
The results were in agreement with previous studies conducted in special environments, for example, in three rural groups searching for and collecting firewood in the forest or in human hunter-gatherer groups where Lévy walk movement patterns are observed [37,38], and also in different corridor widths [39].
4. Discussion
In most studies of pedestrian behavior and interaction, the individuals considered are typically adults of roughly similar sizes [40]. However, in the experiment under consideration, participants attending the funfair exhibit a diversity of sizes, sexes, and ages [41]. Furthermore, participants gather in families or groups, forming distinct spatial patterns in terms of crowd dynamics. Family groups or groups of teenagers differ in their space occupation and movement features, resulting in clusters of people in the corridor and emphasizing the inhomogeneity of pedestrian traffic [42]. The crowd dynamics in this study are more complex than in previous experiments involving participants who were selected for laboratory-based experimental works.
On average, groups with two or three members are common in the lane, with more complex social groups (family members with/no cultural difference) exhibiting stability and teenager groups showing fluctuating numbers. It is assumed that family members constitute the basic units (cellular groups) of complex social groups.
Notably, there is no correlation between the speed and angles of deviation during the trajectory of the pedestrian under test. While an intuitive expectation might be that a pedestrian moving in a straight line (with a deviation angle of close to zero) would have an accelerated speed, the weak correlation observed during the trajectory emphasizes the randomness of the path. This lack of correlation is attributed to the short distance over which the pedestrian under test can acquire a faster speed. A straight trajectory does not necessarily indicate a faster walking speed.
In the fairground corridor, crowds create little or no traffic flow on either side, and traffic flows randomly. Generally, people pass each other on their right-hand side. Attractions on either side force people to move to the right or left, and their path then continues on the same side as that occupied by the completed activity, moving forward to go and see another attraction. As mentioned by A. Fujita et al., the existence of a lane is stochastic [43] and this result is observed in the experiments. This observation explains the absence of continuous lane formation in the context of the experiment. The spontaneous lane formation that typically occurs in bidirectional flow does not occur in heterogeneous-speed flow in the fairground. Cultural differences also play a role in the measured results, as demonstrated by U. Chattaraj et al. [44]. People with cultural differences could be less sensitive to an increase in density, and the amount of minimum personal space is perceived differently.
Y. Zhao et al., demonstrated that the social repulsive force observed between individual pedestrians tends to increase along with the moving speed of the pedestrians and is much stronger in a face-to-face orientation compared to that in a face-to-back orientation [45]. They also observed that the repulsive force is related to the minimum lateral body width when pedestrians try to decrease their body size in a lateral direction. To reach this goal, pedestrians perform a twisting motion to avoid potential collisions in high-density crowds. This twisting motion, as already observed, explains the small angles plotted in the histogram of Figure 2. A comparison of the histogram of deviation angles and speeds (Figure 2) over the range of possible values shows that path adjustment is preferred to speed change, as shown by M. Huber et al. [46]. Moreover, the pedestrian’s goal in the experiment was to walk as fast as possible along the corridor.
The resulting observations of Lévy flight from the experiment are comparable to the results of Murakami et al. [47] with a close exponent in the power-law function. In an experiment concerning lane formation, the authors used laboratory experiments to observe how flows of oppositely moving pedestrians spontaneously separated into several unidirectional lanes. Pedestrians deviated from the desired direction by a Lévy walk process before lane formation.
5. Conclusions
A smartphone was utilized to measure the trajectory of a pedestrian in a fairground corridor, enabling the acquisition of GPS data along their path. Multiple trajectories were measured with GPS data.
Based on the recorded data, it appears that:
- (i)
- Mean square displacement (MSD) as a function of time, calculated and plotted on a log-log scale, demonstrates a linear curve that could be fitted with a power law.
- (ii)
- The best-fitted coefficient, greater than 1, indicates that the trajectory is the result of Lévy flight behavior. The MSD histogram is best fitted with a power law featuring an exponential cut-off and another power law.
Under the bidirectional parameters of our experiment, pedestrians diffused along the x and y axes with an exponent greater than 1. Consequently, pedestrians walking in opposite or transversal directions (at a low level) relative to the pedestrian under test primarily created a super-diffusive effect in a direction perpendicular to the flow (Δy). Furthermore, the step-length distribution in the lateral direction followed a power law, signifying that pedestrians can deviate from their desired direction with a Lévy walk process.
The strategy observed in the pedestrian under test is also observed in a wide variety of organisms and animals. This movement pattern is often attributed to the success of random searches, particularly in uncertain or dynamic environments [48].
The pedestrian behavior measured during this experiment with a heterogeneous crowd appears to be explained by the same reasoning [49].
This study can be generalized to cases such as the movement of a walker who needs to find a friend in a crowd, the movement of a lost walker in search of a companion, or a child looking for family members. Finally, some works relate to crowd evacuation when considering rescue behavior or crowd evacuation behavior under terrorist attacks [50], but the present study can be used to model an attacker or a person fleeing in a crowd for different reasons.
Moreover, if we consider the trajectory of an autonomous vehicle that moves by probing the space in front of it with ultrasonic proximity sensors or LiDAR, the vehicle’s trajectory could follow the same behavior as that displayed by a pedestrian in a crowd. The study of a pedestrian in a crowd of heterogeneous people enables us to define a behavioral model that can be transposed to an autonomous vehicle, in order to anticipate its trajectory in a complex environment. Another important point is the use of search algorithms based on Lévy flight to guide autonomous vehicles like surface or underwater vehicles toward their goals [51].
Funding
This research received no external funding.
Institutional Review Board Statement
Not applicable.
Informed Consent Statement
Not applicable.
Data Availability Statement
Data are contained within the article.
Conflicts of Interest
The author declares no conflict of interest.
References
- Brockmann, D.; Hufnagel, L.; Geisel, T. The scaling laws of human travel. Nature 2006, 439, 462–465. [Google Scholar] [CrossRef] [PubMed]
- González, M.C.; Hidalgo, C.A.; Barabási, A.-L. Understanding individual human mobility patterns. Nature 2008, 453, 779–782. [Google Scholar] [CrossRef]
- Corbetta, A.; Bruno, L.; Muntean, A.; Toschi, F. High statistics measurements of pedestrian dynamics. Transp. Res. Proc. 2014, 2, 96–104. [Google Scholar] [CrossRef]
- Bode, N.; Ronchi, E. Statistical model fitting and model selection in pedestrian dynamics research. Collect. Dyn. 2019, 4, 1–32. [Google Scholar] [CrossRef]
- Borgers, A.W.J.; Smeets, I.M.E.; Kemperman, A.D.A.M.; Timmermans, H.J.P. Simulation of Micro Pedestrian Behaviour in Shopping Streets. In Proceedings of the 8th International DDSS Conference, Thessalonike, Greece, 4–7 July 2006. [Google Scholar]
- Kretz, T.; Grünebohm, A.; Kaufman, M.; Mazur, F.; Schreckenberg, M. Experimental study of pedestrian counterflow in a corridor. J. Stat. Mech. Theory Exp. 2006, 2006, P10001. [Google Scholar] [CrossRef]
- Alessandretti, L.; Aslak, U.; Lehmann, S. The scales of human mobility. Nature 2020, 587, 402–407. [Google Scholar] [CrossRef]
- Guo, R.-Y.; Huang, H.-J. Formulation of pedestrian movement in microscopic models with continuous space representation. Transp. Res. Part. C 2012, 24, 50–61. [Google Scholar] [CrossRef]
- Ramos-Fernández, G.; Mateos, J.L.; Miramontes, O.; Cocho, G.; Larralde, H.; Ayala-Orozco, B. Lévy Walk Patterns in the Foraging Movements of Spider Monkeys (Ateles geoffroyi). Behav. Ecol. Sociobiol. 2004, 55, 223–230. [Google Scholar]
- Johansson, A.; Helbing, D.; Shukla, P.K. Specification of a Microscopic Pedestrian Model by Evolutionary Adjustment to Video Tracking Data. Adv. Complex. Syst. 2007, 10, 271–288. [Google Scholar] [CrossRef]
- Goubet, E.; Katz, J.; Porikli, F. Pedestrian Tracking Using Thermal Infrared Imaging. In Proceedings of the SPIE, Defense and Security Symposium, Orlando, FL, USA, 18–20 April 2006. [Google Scholar]
- Seyfried, A.; Boltes, M.; Kahler, J.; Klingsch, W.; Portz, A.; Rupprecht, T.; Schadschneider, A.; Steffen, B.; Winkens, A. Enhanced empirical data for the fundamental diagram and the flow through bottlenecks. In Pedestrian and Evacuation Dynamics 2008; Klingsch, W.W.F., Rogsch, C., Schadschneider, A., Schreckenberg, M., Eds.; Springer: Berlin/Heidelberg, Germany, 2010; pp. 145–156. [Google Scholar]
- Available online: https://geofree.fr/gf/coordinateconv.asp#listSys (accessed on 1 January 2020).
- Pouw, C.A.S.; van der Vleuten, G.G.M.; Corbetta, A.; Toschi, F. Data-driven physics-based modeling of pedestrian dynamics. arXiv 2024, arXiv:2407.20794. [Google Scholar]
- Su, J.; Huang, J.; Qing, L.; He, X.; Chen, H. A new approach for social group detection based on spatio-temporal interpersonal distance measurement. Heliyon 2022, 8, e11038. [Google Scholar] [CrossRef]
- Feng, Y.; Li, D. Improved Social Force Models Considering Heterogenous Characteristics among Social Groups. In Proceedings of the 17th COTA (Conference International Conference of Transportation Professionals), CICTP 2017, Shanghai, China, 7–9 July 2017. [Google Scholar]
- Kohler, L.; Mader, M.; Kern, C.; Wegener, M.; Hunger, D. Tracking Brownian motion in three dimensions and characterization of individual nanoparticles using a fiber-based high-finesse microcavity. Nat. Commun. 2021, 12, 6385. [Google Scholar] [CrossRef]
- Biana, X.; Kimb, C.; Karniadakisa, G.E. 111 years of Brownian motion. Soft Matter 2016, 12, 6331–6346. [Google Scholar] [CrossRef] [PubMed]
- Klafter, J.; Shlesinger, M.F.; Zumofen, G. Beyond Brownian motion. Phys. Today 1996, 2, 33–39. [Google Scholar] [CrossRef]
- Song, C.; Koren, T.; Wang, P.; Barabasi, A.-L. Modelling the scaling properties of human mobility. Nat. Phys. 2010, 6, 818–823. [Google Scholar] [CrossRef]
- Viswanathan, G.M.; Buldyrev, S.V.; Havlin, S.; da Luzk, M.G.E.; Raposok, E.P.; Stanley, H.E. Optimizing the success of random searches. Nature 1999, 401, 911–914. [Google Scholar] [CrossRef]
- Viswanathan, G.M.; Afanasyev, V.; Buldyrev, S.V.; Murphy, E.J.; Prince, P.A.; Stanley, H.E. Levy flights search patterns of wandering albatrosses. Nature 1996, 381, 413–415. [Google Scholar] [CrossRef]
- Benhamou, S. How many animals really do the levy walk. Ecology 2007, 88, 1962–1969. [Google Scholar] [CrossRef]
- Baronchelli, A.; Radicchi, F. Lévy flights in human behavior and cognition. Chaos Solit. Fractals 2013, 56, 101–105. [Google Scholar] [CrossRef]
- Karamouzas, I.; Skinner, B.; Guy, S.J. A universal power law governing pedestrian interactions. Phys. Rev. Lett. 2014, 113, 238701. [Google Scholar] [CrossRef]
- Rhee, I.; Shin, M.; Hong, S.; Lee, K.; Kim, S.J.; Chong, S. On the Levy-Walk Nature of Human Mobility. IEEE/ACM Trans. Netw. 2011, 19, 630–643. [Google Scholar] [CrossRef]
- Feliciani, C.; Nishinari, K. Empirical analysis of the lane formation process in bidirectional pedestrian flow. Phys. Rev. E 2016, 94, 032304. [Google Scholar] [CrossRef]
- Moussaïda, M.; Helbingb, D.; Theraulaz, G. How simple rules determine pedestrian behavior and crowd disasters. Proc. Natl. Acad. Sci. USA 2011, 108, 6884–6888. [Google Scholar] [CrossRef] [PubMed]
- Yan, X.-Y.; Han, X.-P.; Wang, B.-H.; Zhou, T. Diversity of individual mobility patterns and emergence of aggregated scaling laws. Sci. Rep. 2013, 3, 2678. [Google Scholar] [CrossRef]
- Travers, T.; Colin, V.G.; Loumaigne, M.; Barillé, R.; Gindre, D. Single-Particle Tracking with Scanning Non-Linear Microscopy. Nanomaterials 2020, 10, 1519. [Google Scholar] [CrossRef]
- Turchi, P. Quantitative Analysis of Movement; Eds Sunauer Associates: Sunderland, MA, USA, 1998. [Google Scholar]
- Reynolds, A.M.; Ouellette, N.T. Swarm dynamics may give rise to Lévy flights. Sci. Rep. 2016, 6, 30515. [Google Scholar] [CrossRef]
- Edwards, A.M.; Phillips, R.A.; Watkins, N.W.; Freeman, M.P.; Murphy, E.J.; Afanasyev, V.; Buldyrev, S.V.; da Luz, M.G.E.; Raposo, E.P.; Stanley, H.E.; et al. Revisiting Lévy flight search patterns of wandering albatrosses, bumblebees and deer. Nature 2007, 449, 1044–1048. [Google Scholar] [CrossRef] [PubMed]
- Hilborn, R.; Mangel, M. The Ecological Detective Confronting Models with Data; Princeton University Press: Princeton, NJ, USA, 1997; Chapter 7. [Google Scholar]
- White, E.P.; Enquist, B.J.; Green, J.L. On estimating the exponent of power-law frequency distributions. Ecology 2008, 89, 905–912. [Google Scholar] [CrossRef]
- Clauset, A.; Shalizi, C.R.; Newman, M.E.J. Power-Law Distributions in Empirical Data. SIAM Rev. 2009, 51, 4. [Google Scholar] [CrossRef]
- Reynolds, A.; Ceccon, E.; Baldauf, C.; Medeiros, T.K.; Miramontes, O. Lévy foraging patterns of rural humans. PLoS ONE 2018, 13, e0199099. [Google Scholar] [CrossRef]
- Raichlena, D.A.; Woodb, B.M.; Gordonc, A.D.; Mabullad, A.Z.P.; Marlowee, F.W.; Pontzerf, H. Evidence of Lévy walk foraging patterns in human hunter—Gatherers. Proc. Natl. Acad. Sci. USA 2014, 111, 728–733. [Google Scholar] [CrossRef] [PubMed]
- Jin, C.-J.; Jiang, R.; Liu, T.; Li, D.; Wang, H.; Liu, X. Pedestrian dynamics with different corridor widths: Investigation on a series of uni-directional and bi-directional experiments. Phys. A Stat. Mech. Its Appl. 2021, 581, 126229. [Google Scholar] [CrossRef]
- Boltes, M.; Seyfried, A. Collecting pedestrian trajectories. Neurocomputing 2013, 100, 127–133. [Google Scholar] [CrossRef]
- Gorrini, A.; Vizzari, G.; Bandini, S. Age and group driven pedestrian behavior: From observations to simulations. Collect. Dyn. 2016, 1, 1. [Google Scholar]
- Xi, J.-A.; Zou, X.-L.; Chen, Z.; Huang, J.-J. Multi-pattern of complex social pedestrian groups. Transp. Res. Procedia 2014, 2, 60–68. [Google Scholar] [CrossRef]
- Fujita, A.; Feliciani, C.; Yanagisawa, D.; Nishinari, K. Traffic flow in a crowd of pedestrians walking at different speeds. Phys. Rev. E 2019, 99, 062307. [Google Scholar] [CrossRef]
- Chattaraj, U.; Seyfried, A.; Chakroborty, P. Comparison of pedestrian fundamental diagram across cultures. Adv. Complex. Syst. 2009, 12, 393. [Google Scholar] [CrossRef]
- Zhao, Y.; Lu, T.; Su, W.; Wu, P.; Fu, L.; Li, M. Quantitative measurement of social repulsive force in pedestrian movements based on physiological responses. Transp. Res. Part. B 2019, 130, 1–20. [Google Scholar] [CrossRef]
- Huber, M.; Su, Y.-H.; Kruger, M.; Faschian, K.; Glasauer, S.; Hermsdorfer, J. Adjustments of Speed and Path when Avoiding Collisions with Another Pedestrian. PLoS ONE 2014, 9, e89589. [Google Scholar] [CrossRef]
- Murakami, H.; Feliciani, C.; Nishinari, K. Lévy walk process in self-organization of pedestrian crowds. J. R. Soc. Interface 2019, 16, 20180939. [Google Scholar] [CrossRef] [PubMed]
- Mann, R.P.; Garnett, R. The entropic basis of collective behavior. J. R. Soc. Interface 2015, 12, 20150037. [Google Scholar] [CrossRef] [PubMed]
- Cordes, J.; Schadschneider, A.; Nicolas, A. Dimensionless numbers reveal distinct regimes in the structure and dynamics of pedestrian crowds. PNAS Nexus 2024, 3, 120. [Google Scholar] [CrossRef] [PubMed]
- Liu, J.; Jia, Y.; Mao, T.; Wang, Z. Modeling and simulation analysis of crowd evacuation behavior under terrorist attack. Phys. A Stat. Mech. Its Appl. 2022, 604, 127891. [Google Scholar] [CrossRef]
- Katada, Y.; Hasegawa, S.; Yamashita, K.; Okazaki, N.; Ohkura, K. Swarm Crawler Robots Using Lévy Flight for Targets Exploration in Large Environments. Robotics 2022, 11, 76. [Google Scholar] [CrossRef]
Figure 1.
(a) Image of the experiment conducted along a lane in the funfair. (b) Representation of the lane inside the funfair. The pedestrian with his smartphone travels inside the crowded lane with a width of D, walking as fast as possible.
Figure 1.
(a) Image of the experiment conducted along a lane in the funfair. (b) Representation of the lane inside the funfair. The pedestrian with his smartphone travels inside the crowded lane with a width of D, walking as fast as possible.
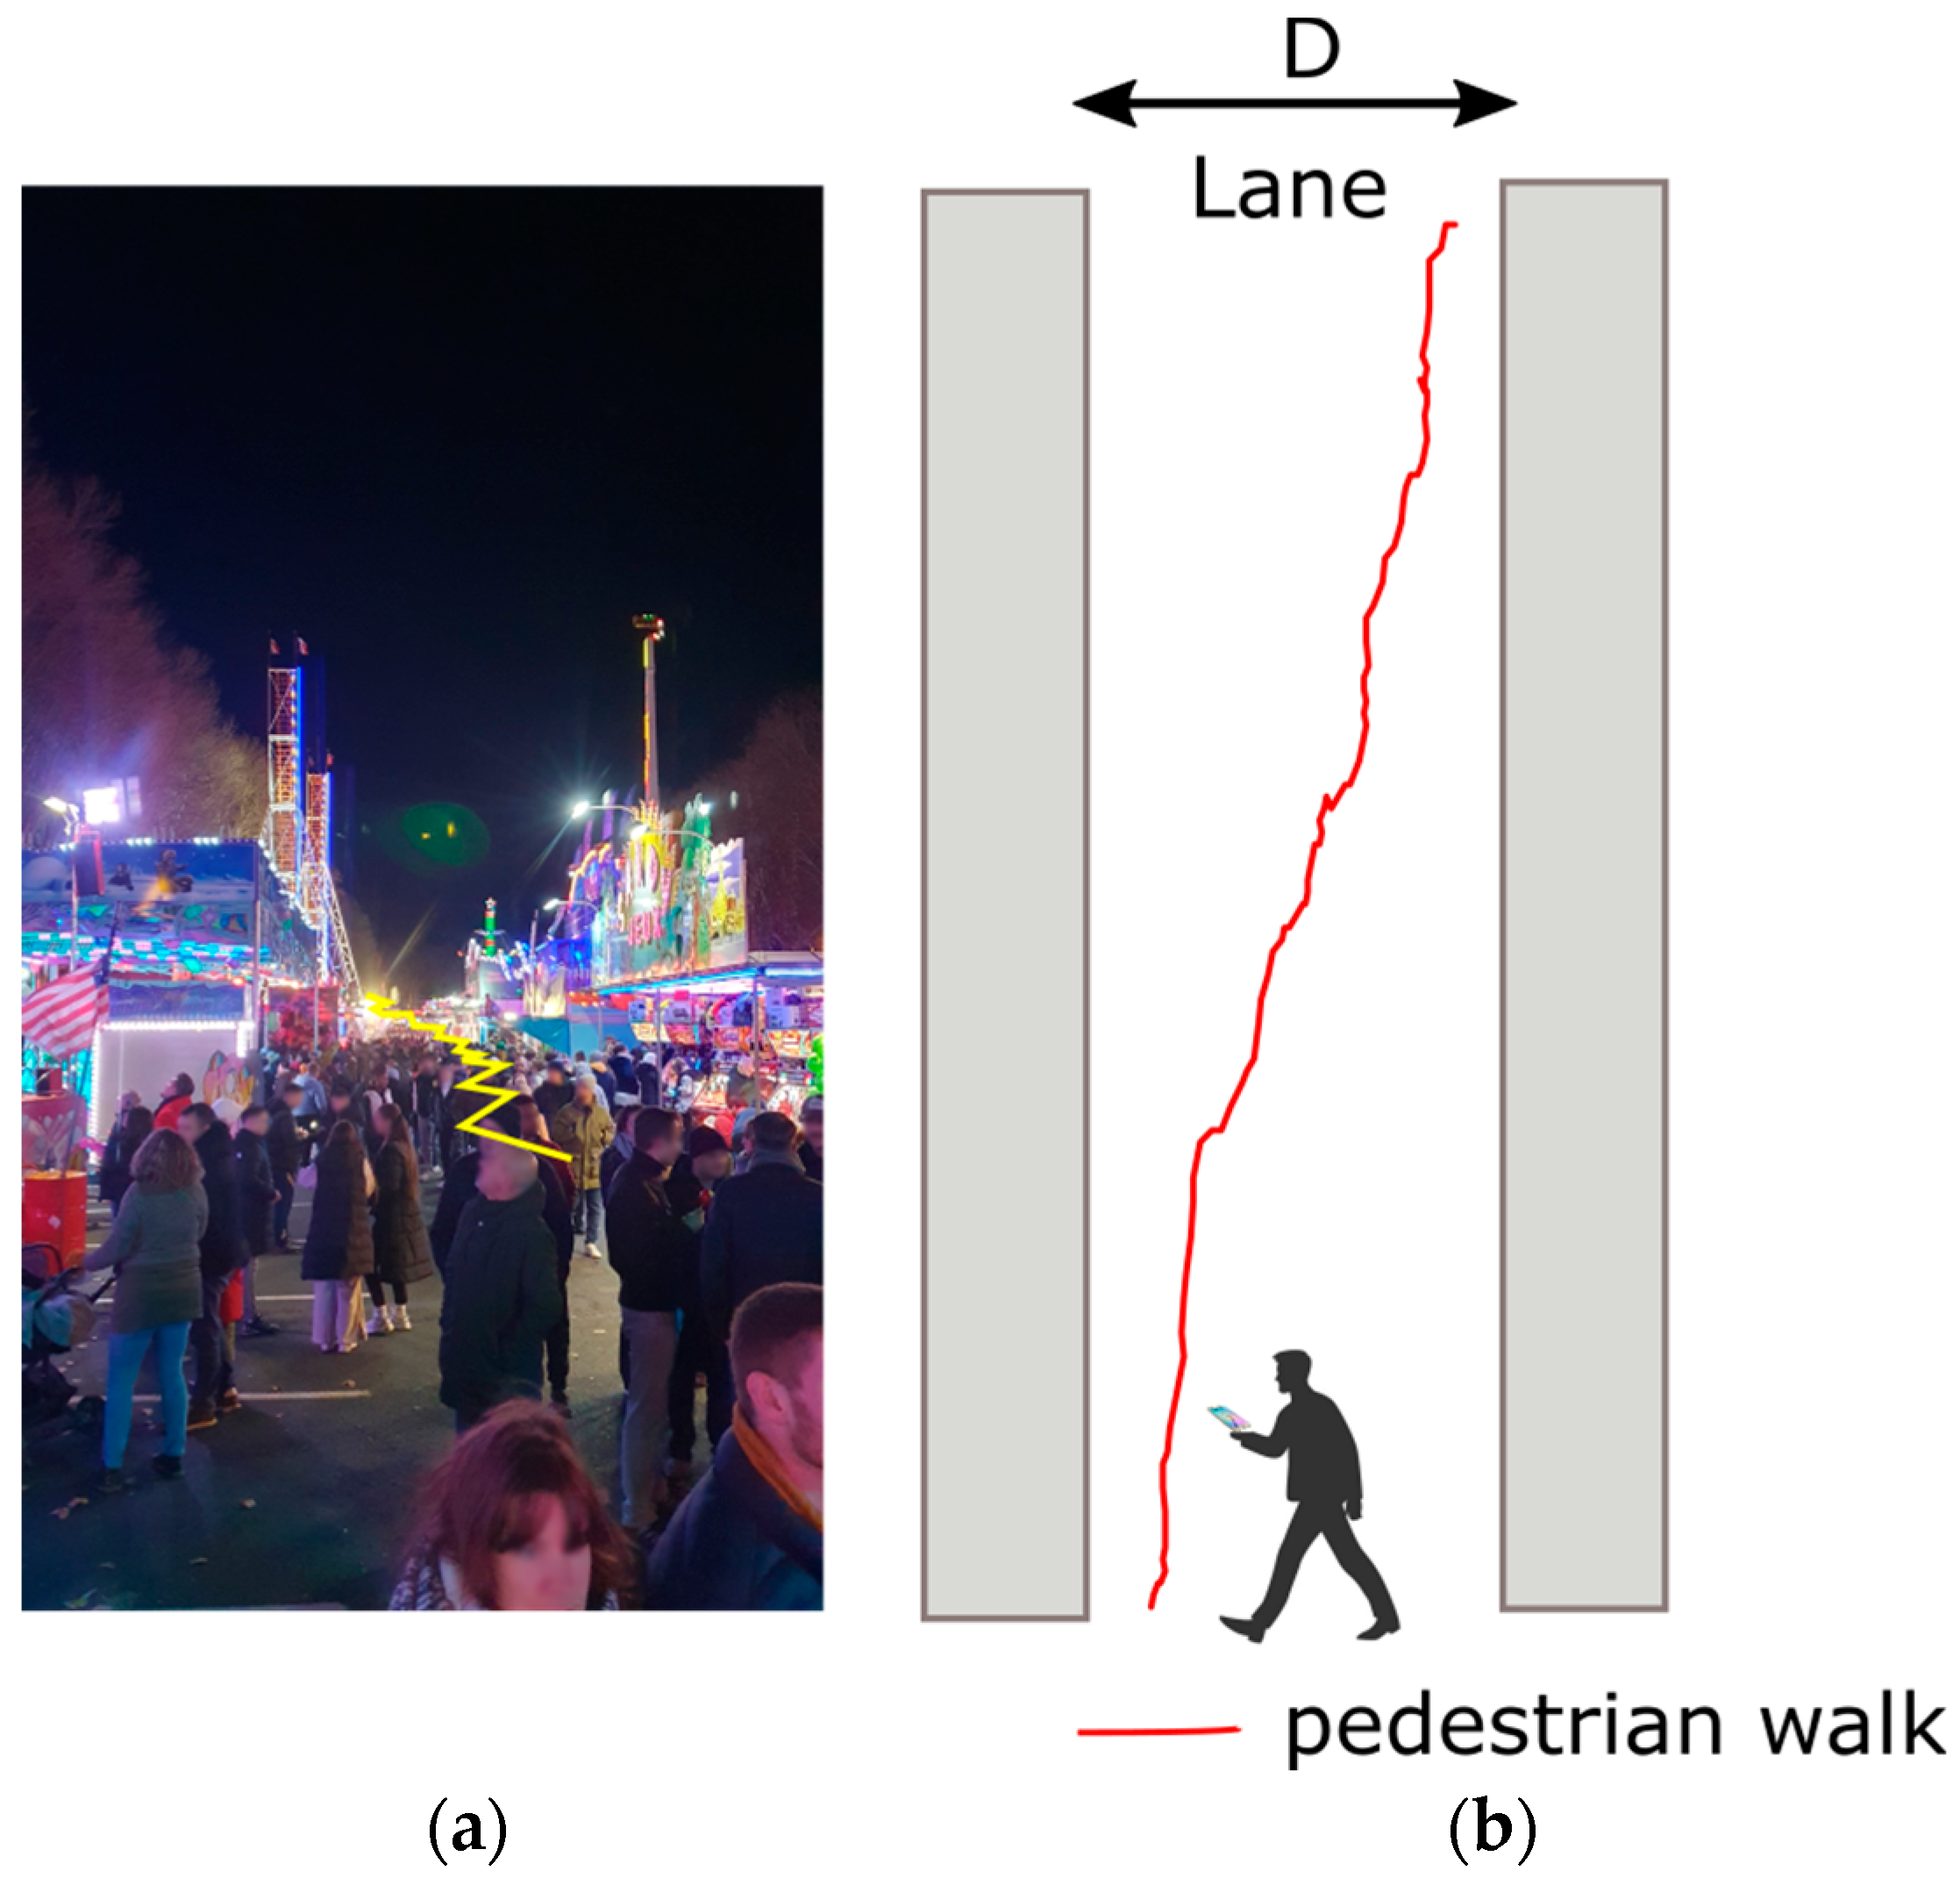
Figure 2.
Typical 2D trajectories along the path acquired by the walker with the GPS sensor of his smartphone differentiated by different colors. The drift of the trajectory is due to the corridor’s orientation in relation to the cardinal axes.
Figure 2.
Typical 2D trajectories along the path acquired by the walker with the GPS sensor of his smartphone differentiated by different colors. The drift of the trajectory is due to the corridor’s orientation in relation to the cardinal axes.
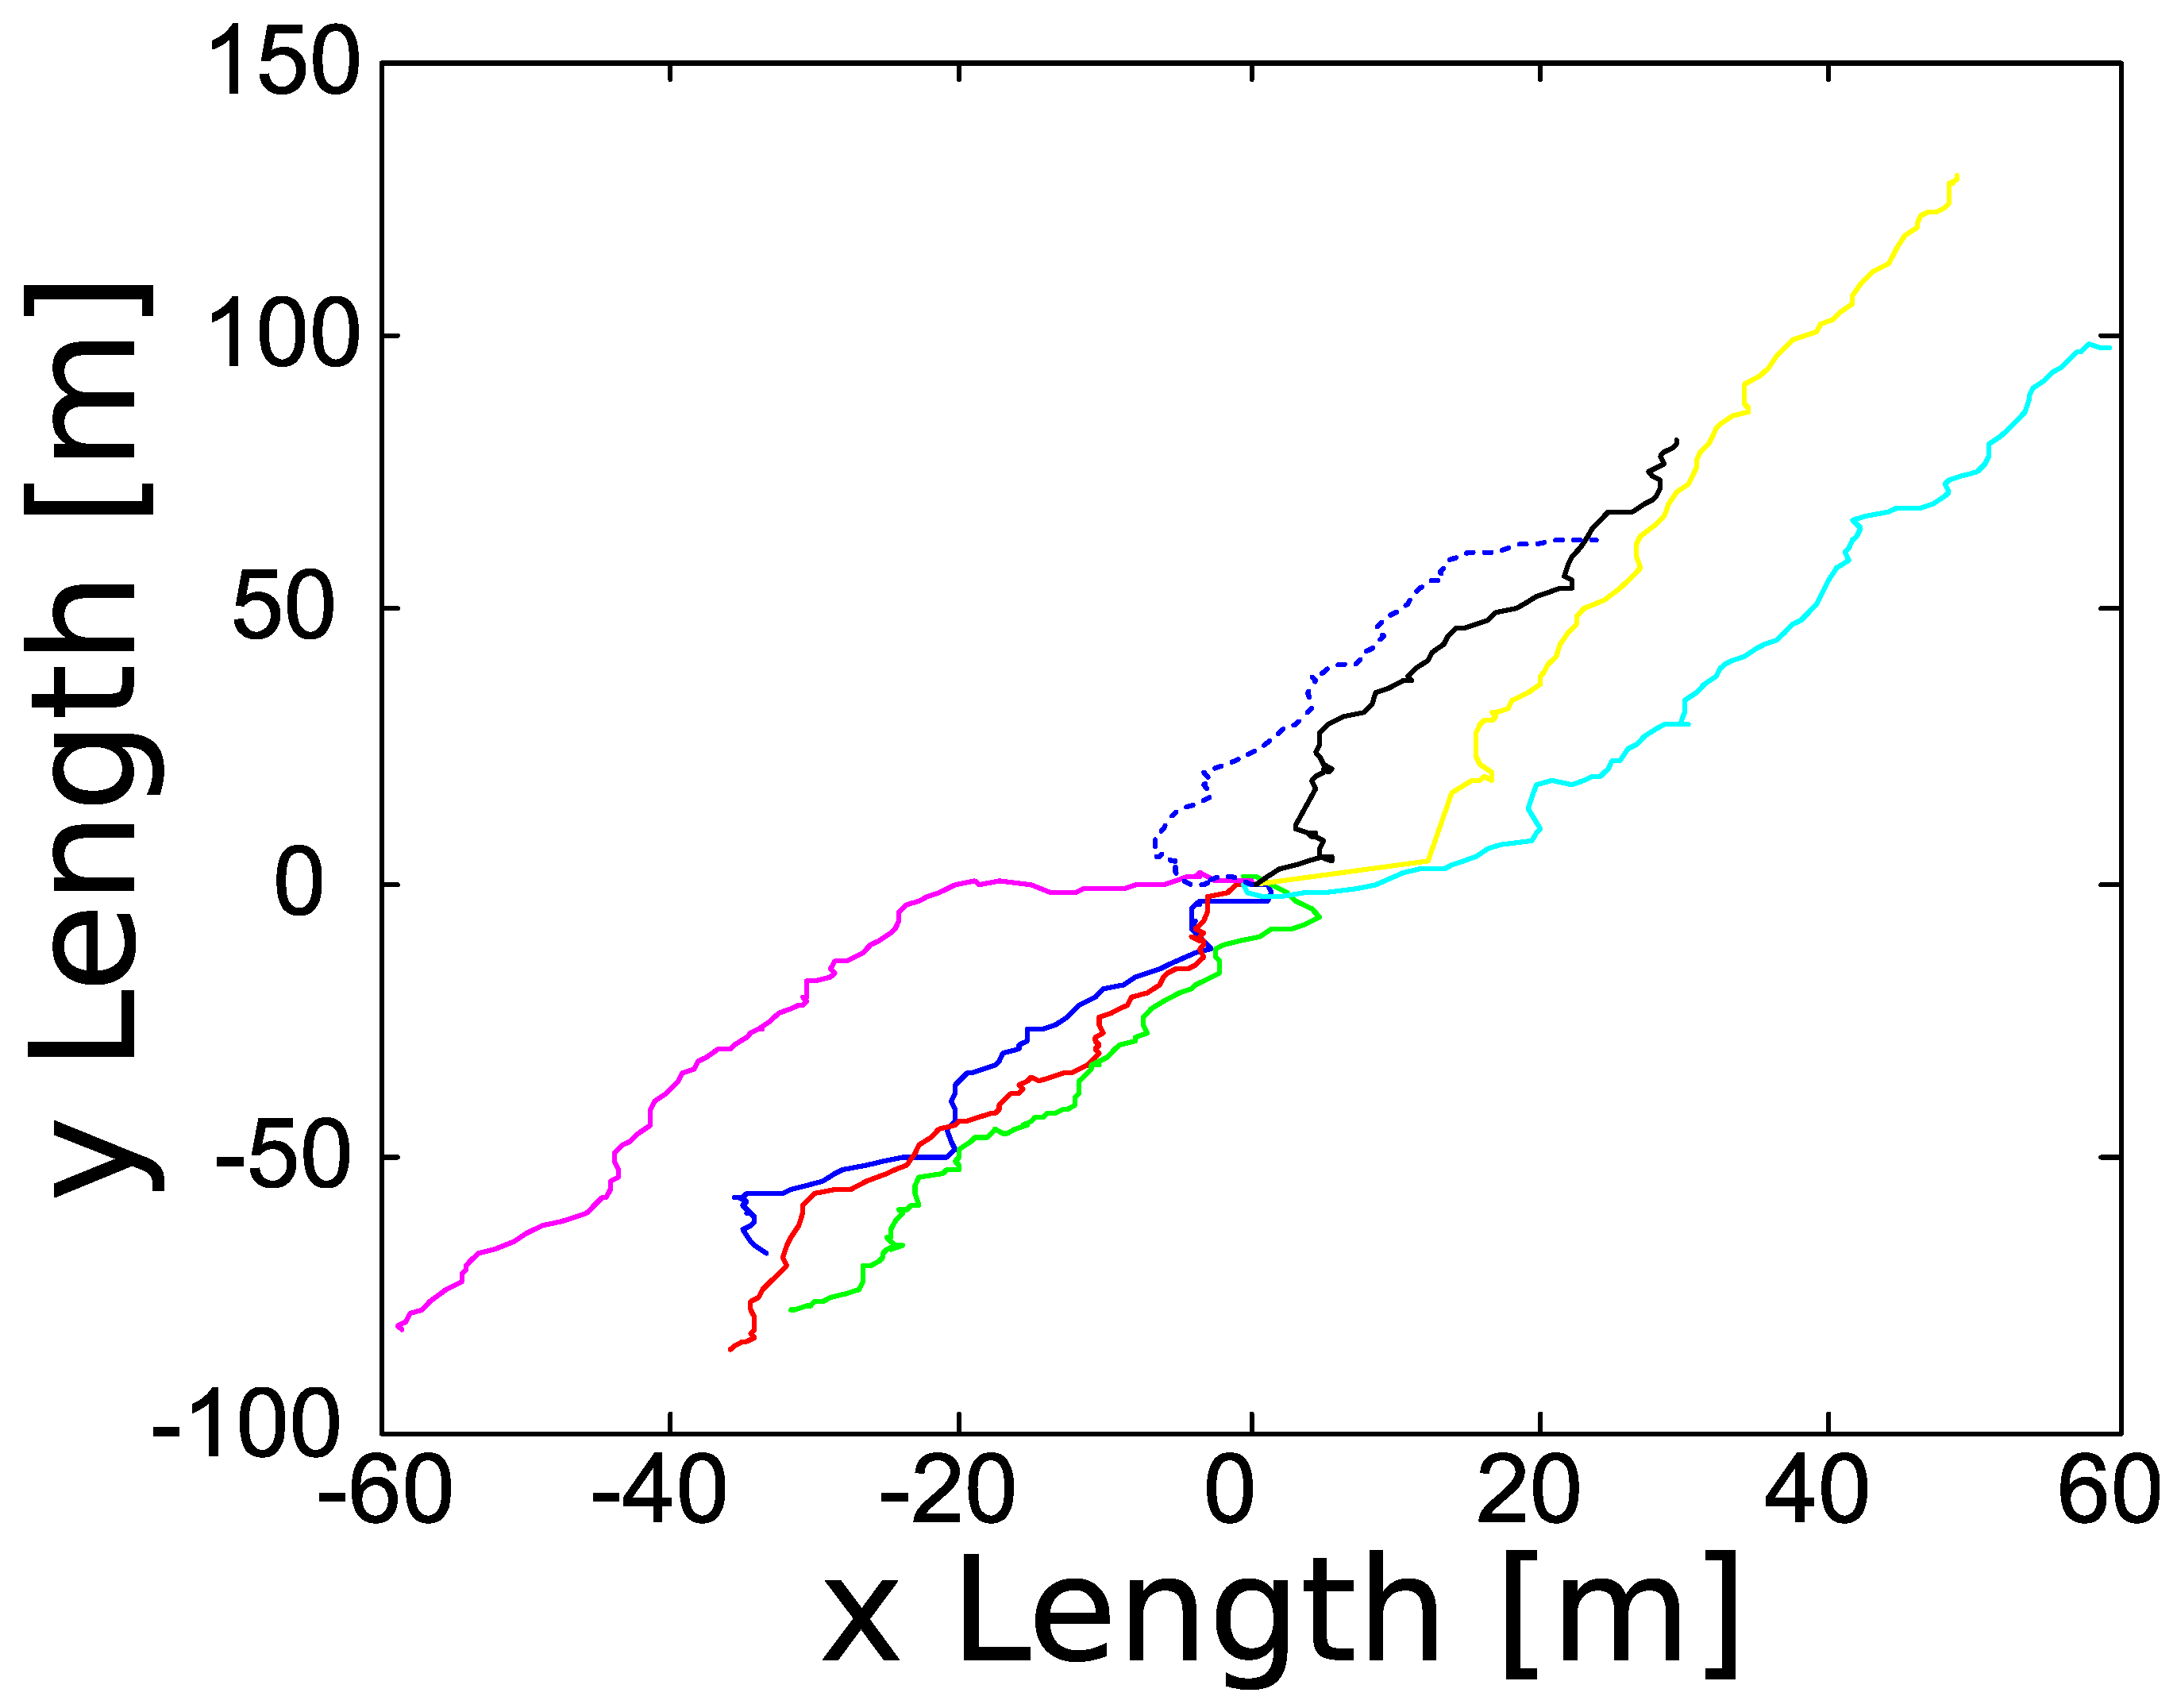
Figure 3.
(a) Turning angle distribution θ during pedestrian walks along the lane; (b) speed distribution during the pedestrian walk; (c) comparison of speeds and turning angles vs. time. The speed and angle variations are converted into on/off values (black and green lines respectfully); (d) model of the social force acting on the pedestrian during the test.
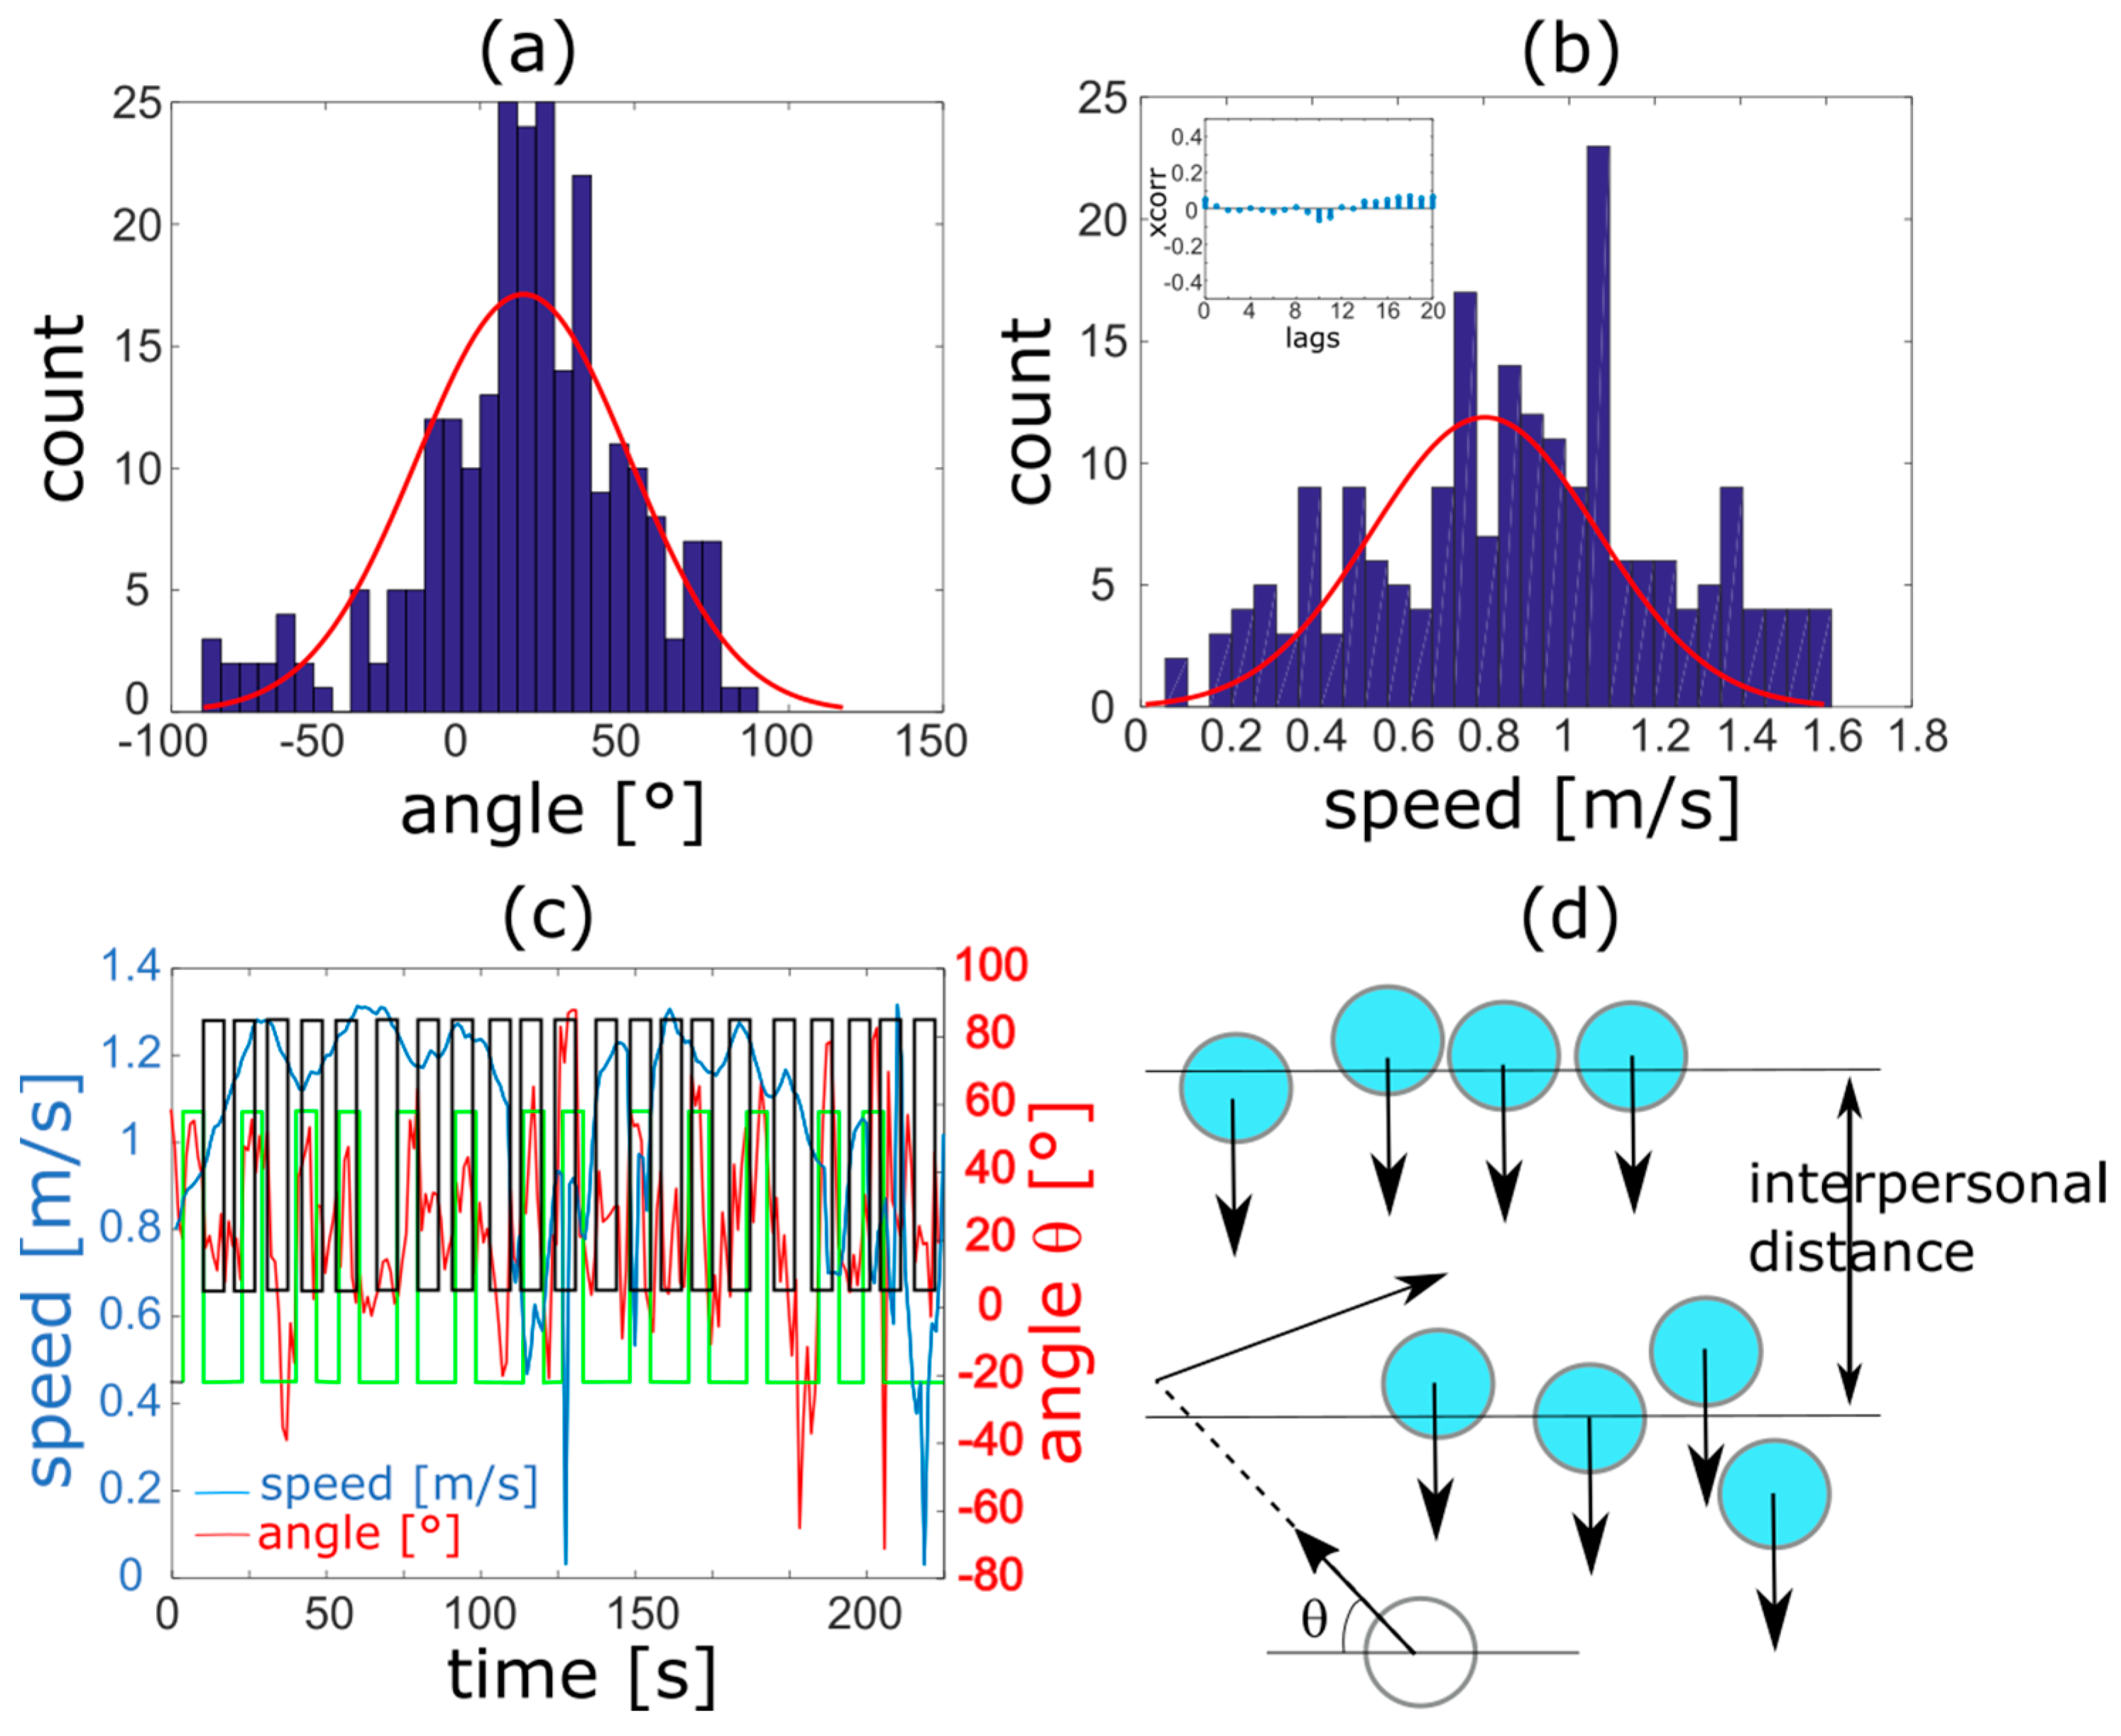
Figure 4.
Calculated mean-square displacement along the lane as a function of time, shown in log-log format. The experimental curve (blue circles) is fitted with a power law Dtα, where t is the time and D and α are constant.
Figure 4.
Calculated mean-square displacement along the lane as a function of time, shown in log-log format. The experimental curve (blue circles) is fitted with a power law Dtα, where t is the time and D and α are constant.
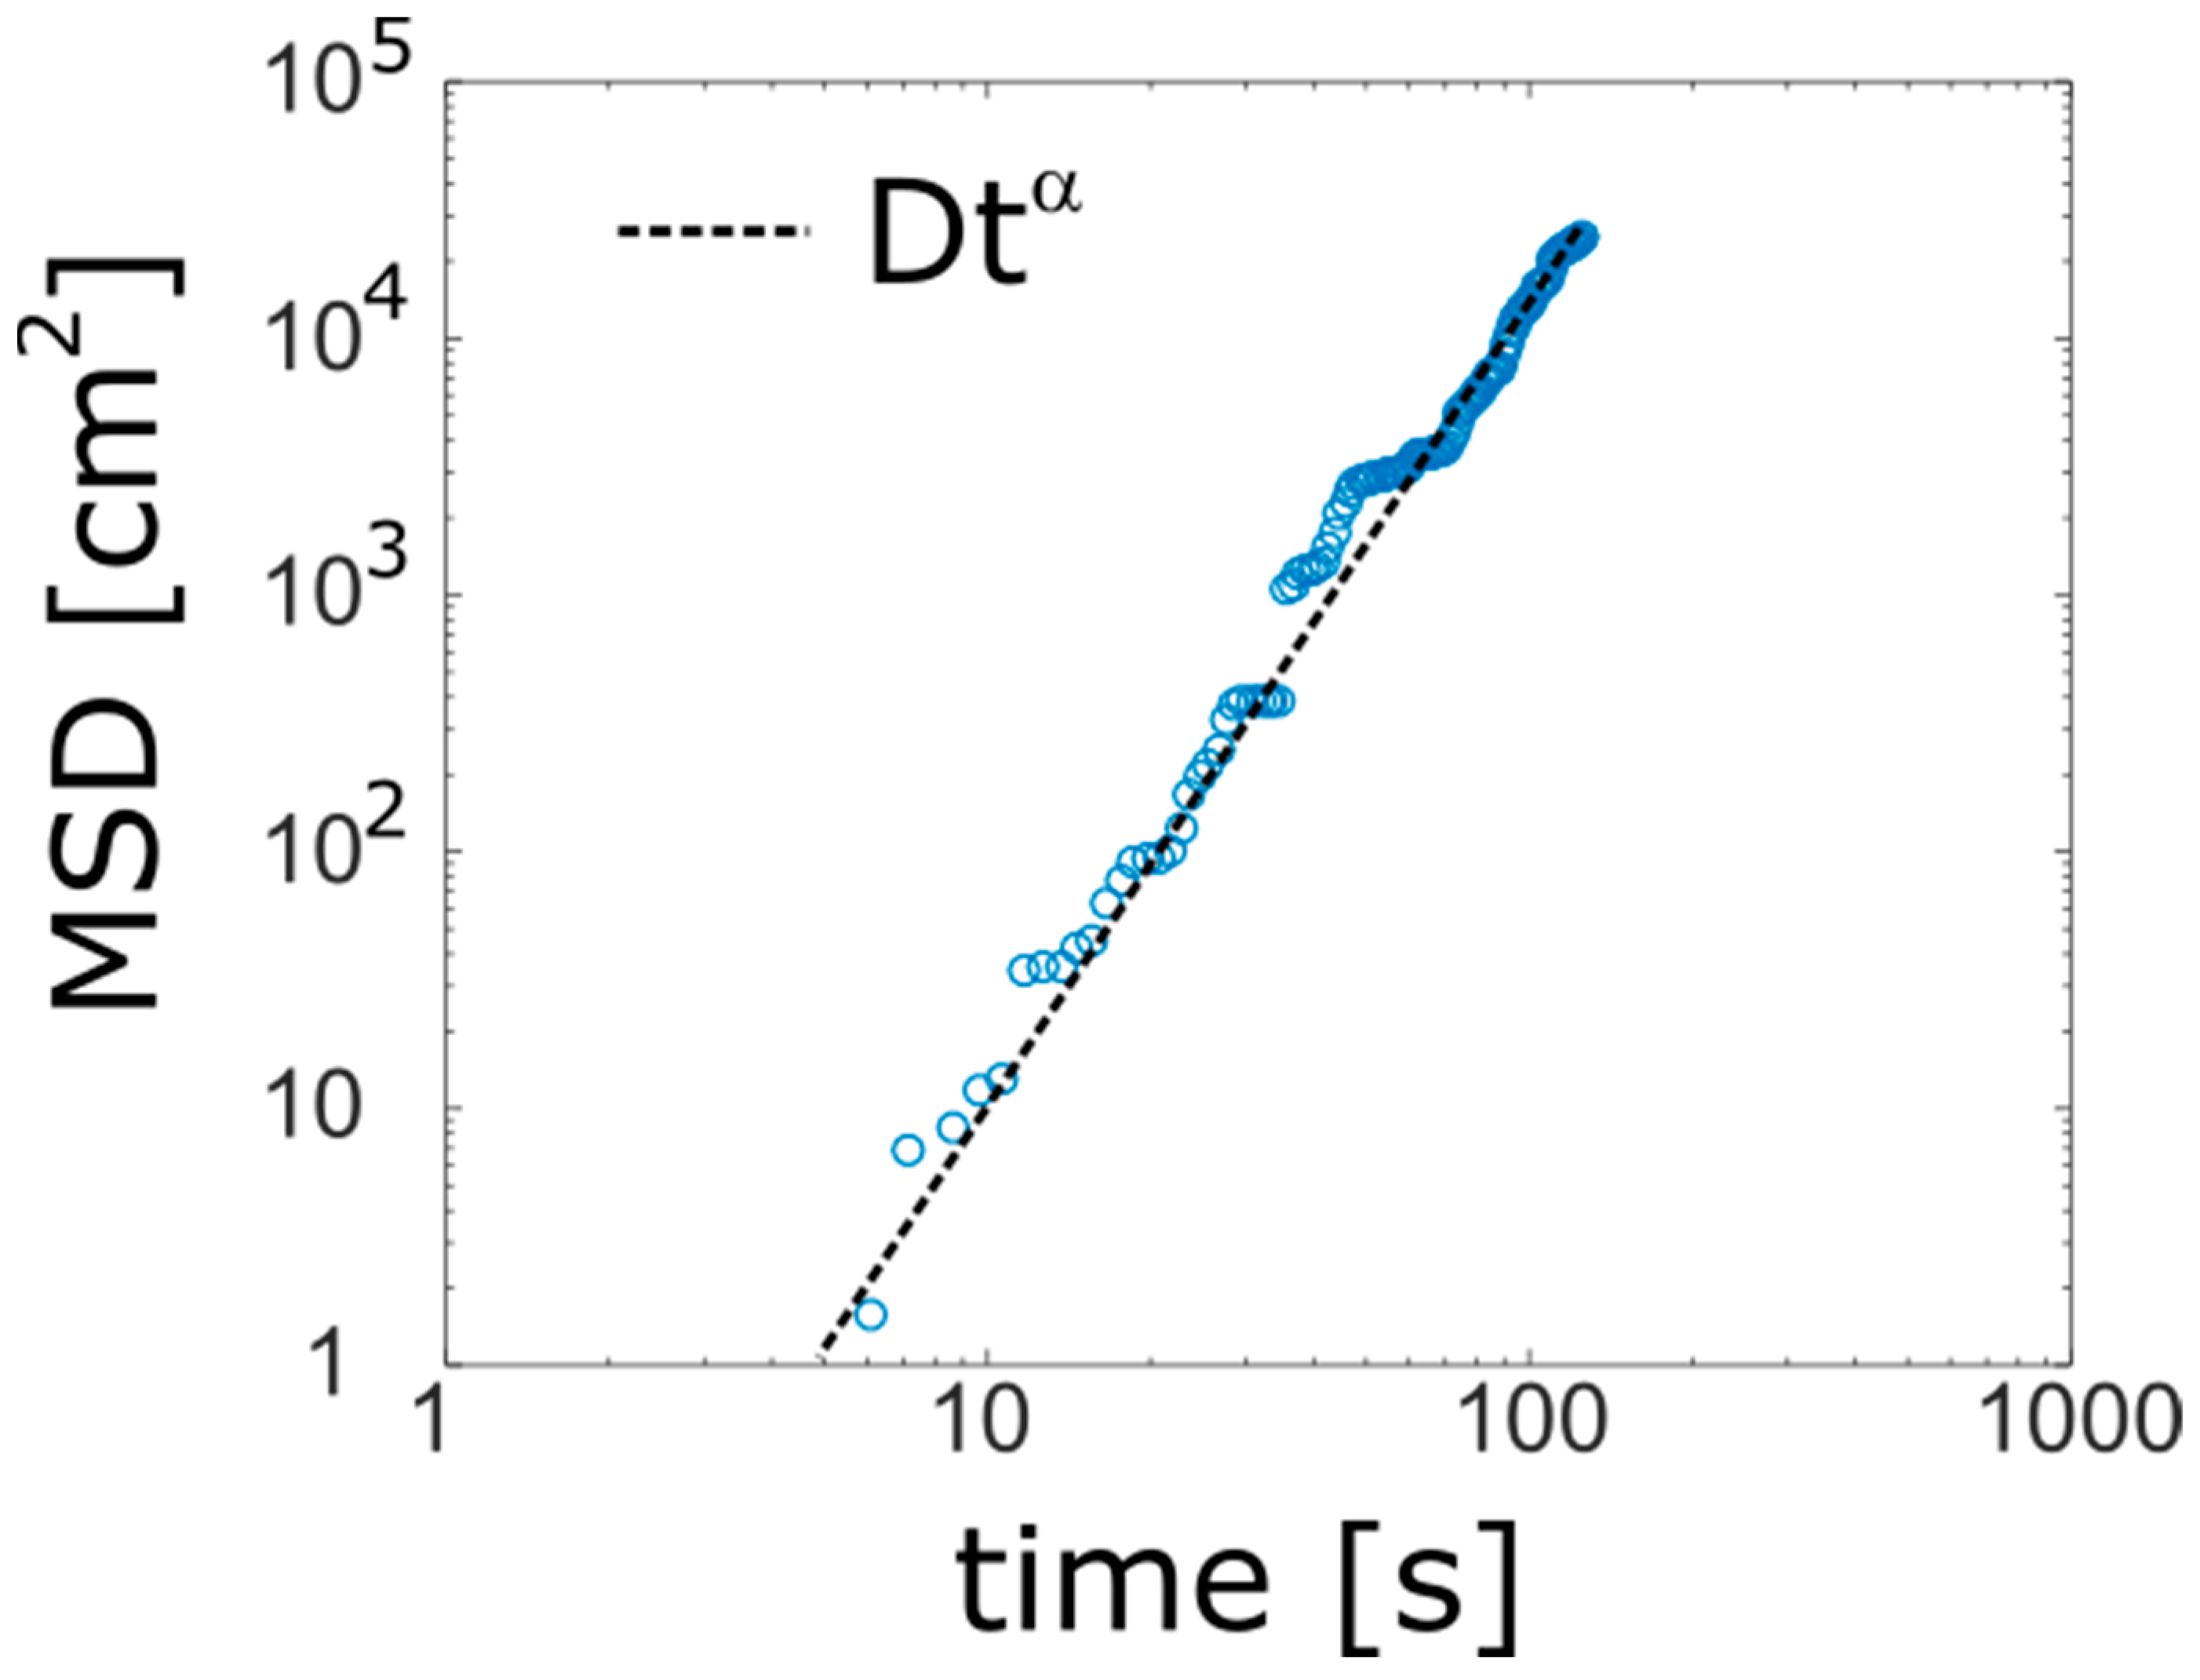
Figure 5.
Experimental rank distributions of step lengths (MSD) along the trajectory (blue circles). The black dots and red circles are the model fits of a truncated power law and an exponential distribution, respectively.
Figure 5.
Experimental rank distributions of step lengths (MSD) along the trajectory (blue circles). The black dots and red circles are the model fits of a truncated power law and an exponential distribution, respectively.
Disclaimer/Publisher’s Note: The statements, opinions and data contained in all publications are solely those of the individual author(s) and contributor(s) and not of MDPI and/or the editor(s). MDPI and/or the editor(s) disclaim responsibility for any injury to people or property resulting from any ideas, methods, instructions or products referred to in the content. |
© 2024 by the author. Licensee MDPI, Basel, Switzerland. This article is an open access article distributed under the terms and conditions of the Creative Commons Attribution (CC BY) license (https://creativecommons.org/licenses/by/4.0/).
Share and Cite
MDPI and ACS Style
Barillé, R. Lévy Flight and the Interpersonal Distance of a Pedestrian in a Crowd. Appl. Sci. 2024, 14, 7585. https://doi.org/10.3390/app14177585
AMA Style
Barillé R. Lévy Flight and the Interpersonal Distance of a Pedestrian in a Crowd. Applied Sciences. 2024; 14(17):7585. https://doi.org/10.3390/app14177585
Chicago/Turabian StyleBarillé, Régis. 2024. "Lévy Flight and the Interpersonal Distance of a Pedestrian in a Crowd" Applied Sciences 14, no. 17: 7585. https://doi.org/10.3390/app14177585
Note that from the first issue of 2016, this journal uses article numbers instead of page numbers. See further details here.