Article

Analysis of the Stability of a High Fill Slope under Different Gradients and Precipitation Conditions

1
School of Urban Geology and Engineering, Hebei GEO University, Shijiazhuang 050031, China
2
School of Civil and Architecture Engineering, East China University of Technology, Nanchang 330013, China
3
Seventh Geological Brigade of Hubei Geological Bureau, Yichang 443100, China
*
Authors to whom correspondence should be addressed.
Appl. Sci. 2024, 14(17), 7590; https://doi.org/10.3390/app14177590
Submission received: 20 July 2024 / Revised: 22 August 2024 / Accepted: 23 August 2024 / Published: 28 August 2024
(This article belongs to the Special Issue Slope Stability and Earth Retaining Structures—2nd Edition)

Abstract

:
The stability problem of high fill slopes has always been a research hotspot. Its failure mechanism is complex and prominent, featuring strong concealment, a short occurrence time and great harmfulness. In this paper, the stability of a high fill slope under rainfall conditions will be studied by using indoor tests, numerical simulations, etc. The study is based on a high fill slope in Yichang City. The evolution law of high fill slope stability under the maximum rainfall condition is revealed. The results show the following: The influence of moisture content on stress–strain curves is reflected in both the curve’s shape and the peak value of deviatoric stress. Under the constraint of confining pressure, the curve decreases and the peak value of deviatoric stress decreases with the increase of moisture content at the same confining pressure. The safety factor obtained by a rigid body limit equilibrium analysis and numerical calculation indicates that the safety factor for a 30° slope meets the requirements for slope stability evaluation and remains in a fundamentally stable state. An on-site investigation suggests that surface failure and shallow failure may be primary failure modes for this slope; therefore, it is recommended to implement slope protection measures. This study provides valuable references for similar high fill slopes.

1. Introduction

With the development of society and the economy, it is inevitable that a high fill slope will be formed through engineering construction. Compared to general slopes, high fill slopes are more susceptible to engineering disasters such as debris flows, landslides, and collapses due to external factors. The instability mechanism of these slopes is also more complex. Therefore, it is essential to conduct a detailed study and analysis of the stability of high fill slopes based on the specific conditions of the project.
Currently, numerous scholars have conducted extensive research on the determination of fill slope parameters and stability analyses. The diversity in analyzing slope geotechnical parameters underscores the fundamental role of determining these parameters for stability analyses [1,2,3]. The main methods for slope stability analyses include the limit equilibrium method, based on the rigid body theory of equilibrium, and the numerical analysis method, based on finite element (EM) and finite difference (FDM) [4,5]. In a paper by Zhu et al. [6], the deformation process of high-loess-filled slopes under different rainfall disaster mitigation measures was studied using the Flume Test (which includes the following three parts: an experimental slope system, a rainfall system, and a data acquisition system). It was found that the deformation process of the slope is highly correlated with the variation of the pore water pressure. When the slope fails, the pore water pressure at each position in the slope will experience a sudden fluctuation in response to the instantaneous excitation. Zhang et al. [7], using three types of rainfall combined with actual rainfall events and data, analyzed the stability of high embankment fill bodies on slopes, considering the effects of water deterioration. According to the simulation analyses, the negative pore water pressure (matric suction) exhibits a greater area of dissipation under the multi-peak type of rainfall with the assistance of the antecedent rainfall, and the evident decrease in safety factors with the smallest value is also found with the upward movement of the potential sliding surface. When considering the deterioration effect of water, the stability of embankment slopes is more easily affected by the infiltration of rainwater, and the position of the potential sliding surface is more consistent with the dispersal of matrix suction. Zhao et al. [8], combining indoor tests and simulation calculations, analyzed the embankment slope of a certain area in Baoshan, Yunnan Province, which contains a soft weak layer, focusing on the influence of hygroscopic swelling on the embankment slope of expansive soil. A proposal was made to improve the stability of the slope by directly reinforcing the soft weak layer with rigid piles. Dai Xue et al. [9] studied the stability of a vertical slope on a high embankment at a certain site using the Geo-Studio, Liren software, and Ansys software, and conducted stability analyses using the M-P method, Bishop method, and strength reduction method. He Linlin et al. [10] used the unbalanced thrust method, simplified Bishop strip method, and finite element strength reduction method to compare the stability of a typical section of the Wushan Shennvfeng Airport high embankment under four conditions of natural, rainstorm, cleared natural, and cleared rainstorm, and the results showed that the engineering measures of clearing the embankment surface could significantly enhance the stability of the high embankment. Zhou et al. [11] conducted centrifugal model tests on a high embankment using an improved, generalized proportionality method to study its dynamic response. The study found that the large dynamic displacements near the slope surface caused the development of lateral cracks. The seismic response under seismic motion showed that the high embankment with inclined non-uniform strata has the characteristics of multiple modes and a low fundamental frequency, making it more susceptible to seismic motion with rich frequency components.
Compared to general slopes, high fill slopes are more susceptible to external factors and their failure mechanisms are more complex. They possess characteristics such as strong concealment, a short occurrence time, and great harmfulness. Therefore, it is essential to conduct relevant research on the stability analyses of high fill slopes. This paper takes a high embankment slope in Yichang City as the research object and conducts stability research on the slope under rainfall infiltration conditions through indoor tests and numerical simulations for three different slope gradients. It reveals the evolution of high embankment slope stability under maximum rainfall conditions and draws conclusions regarding the stability state of the slope.

2. Slope Geological Model

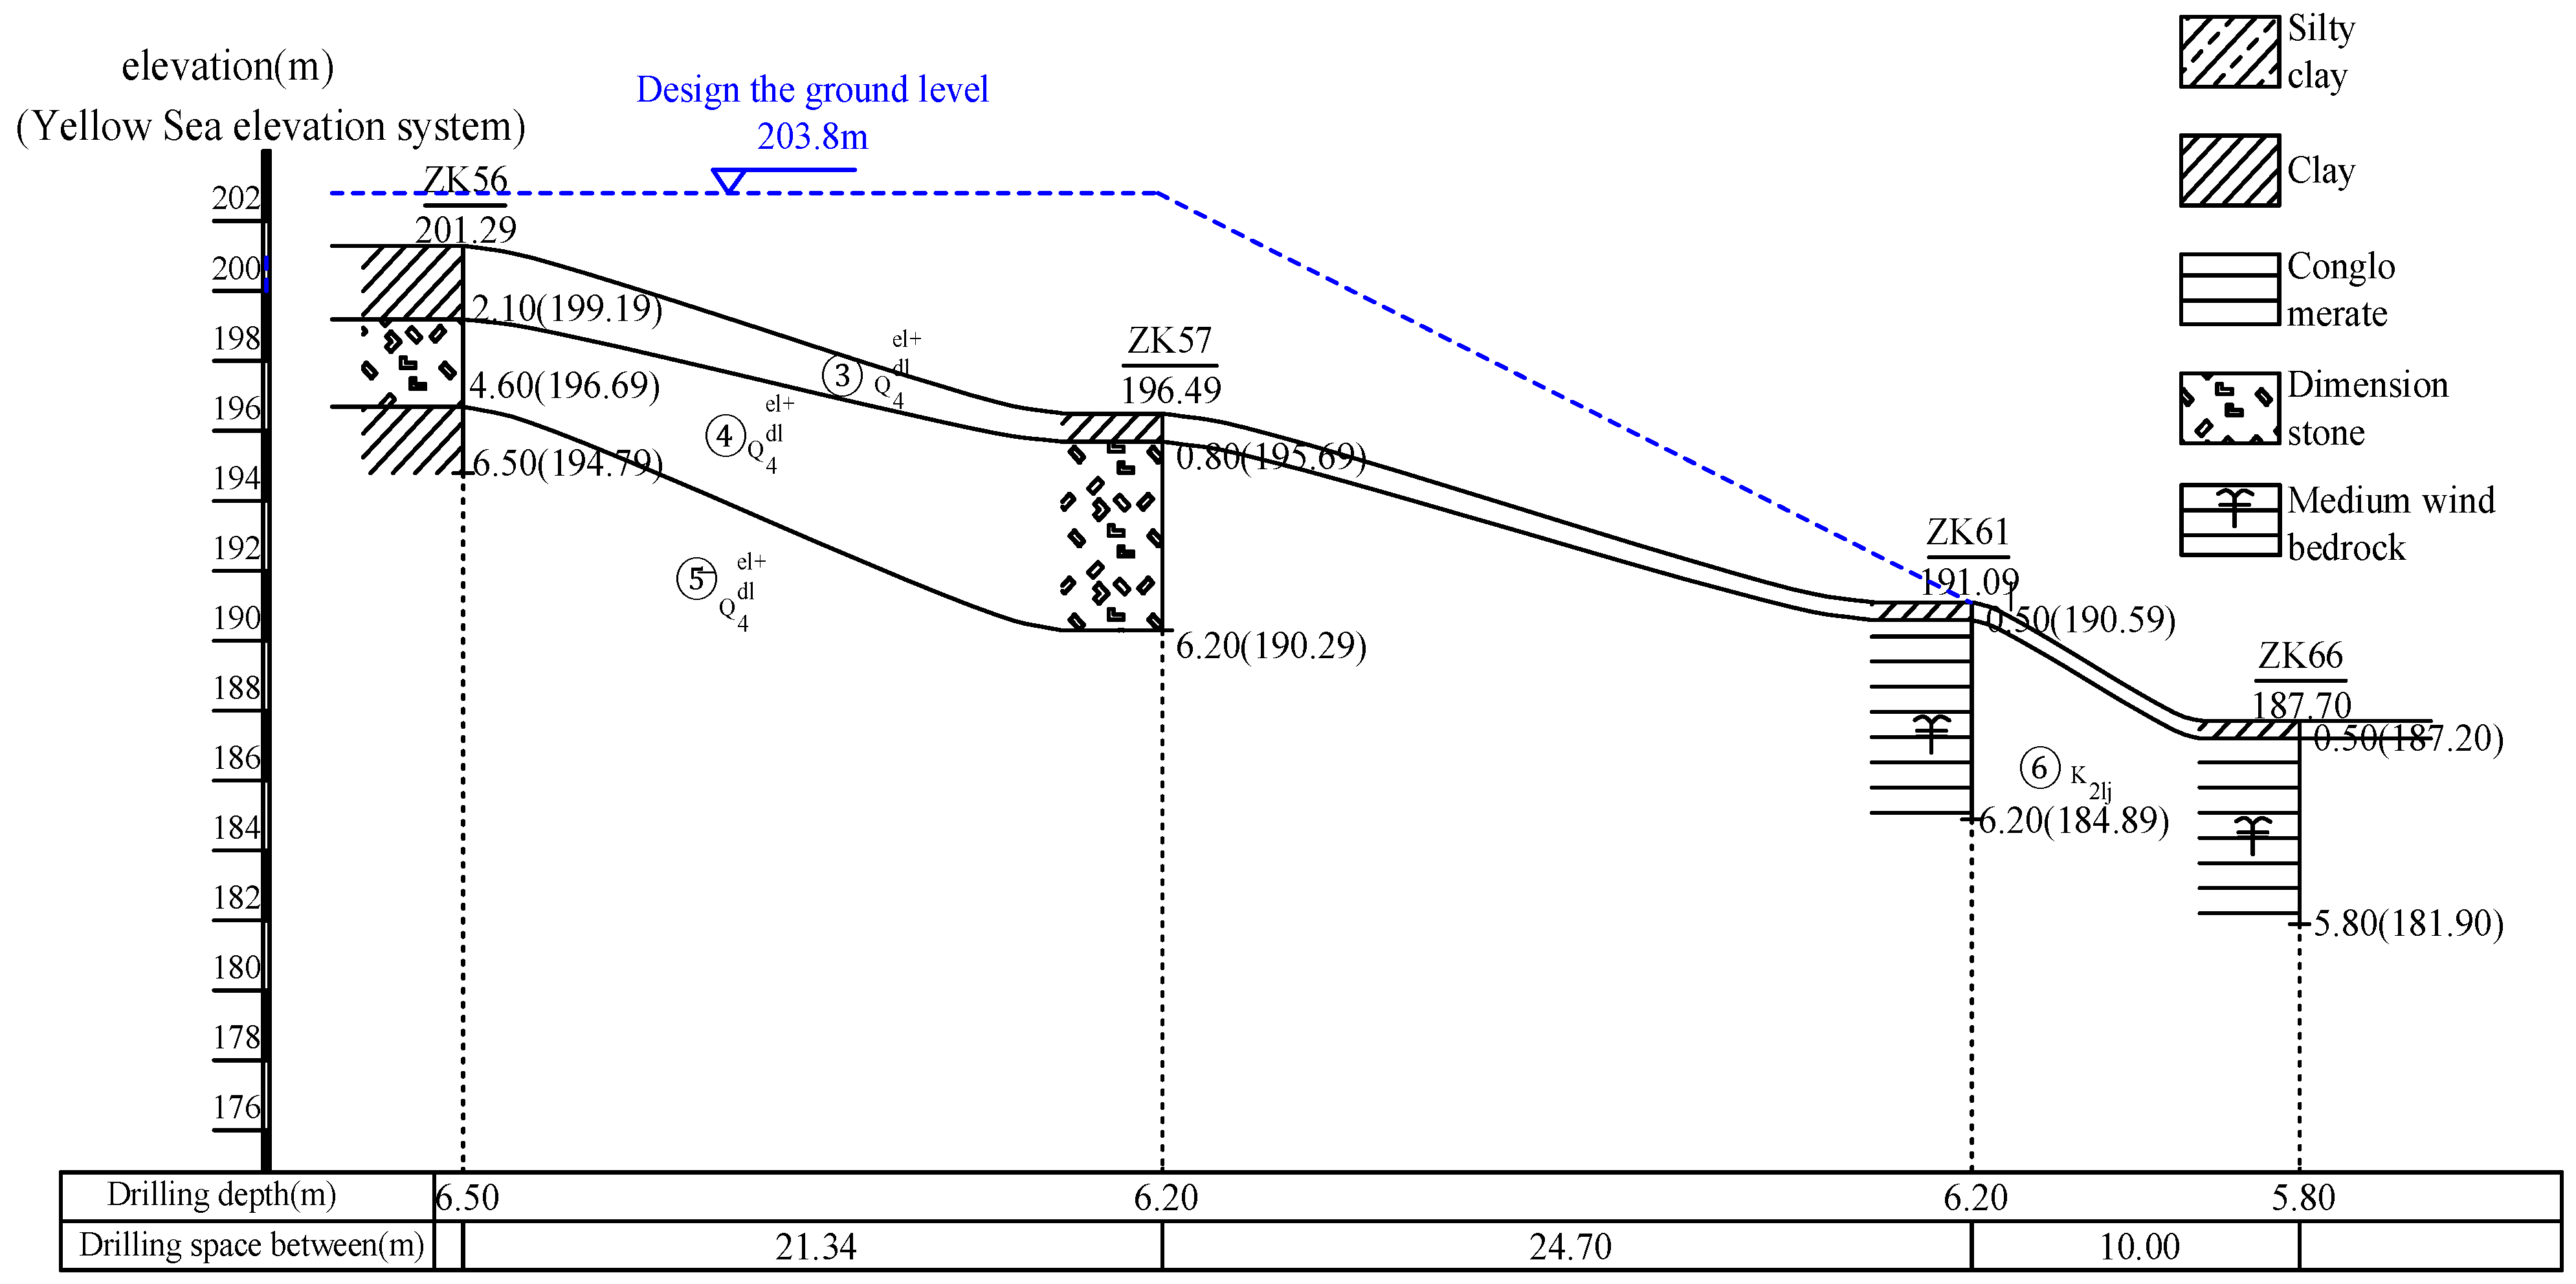
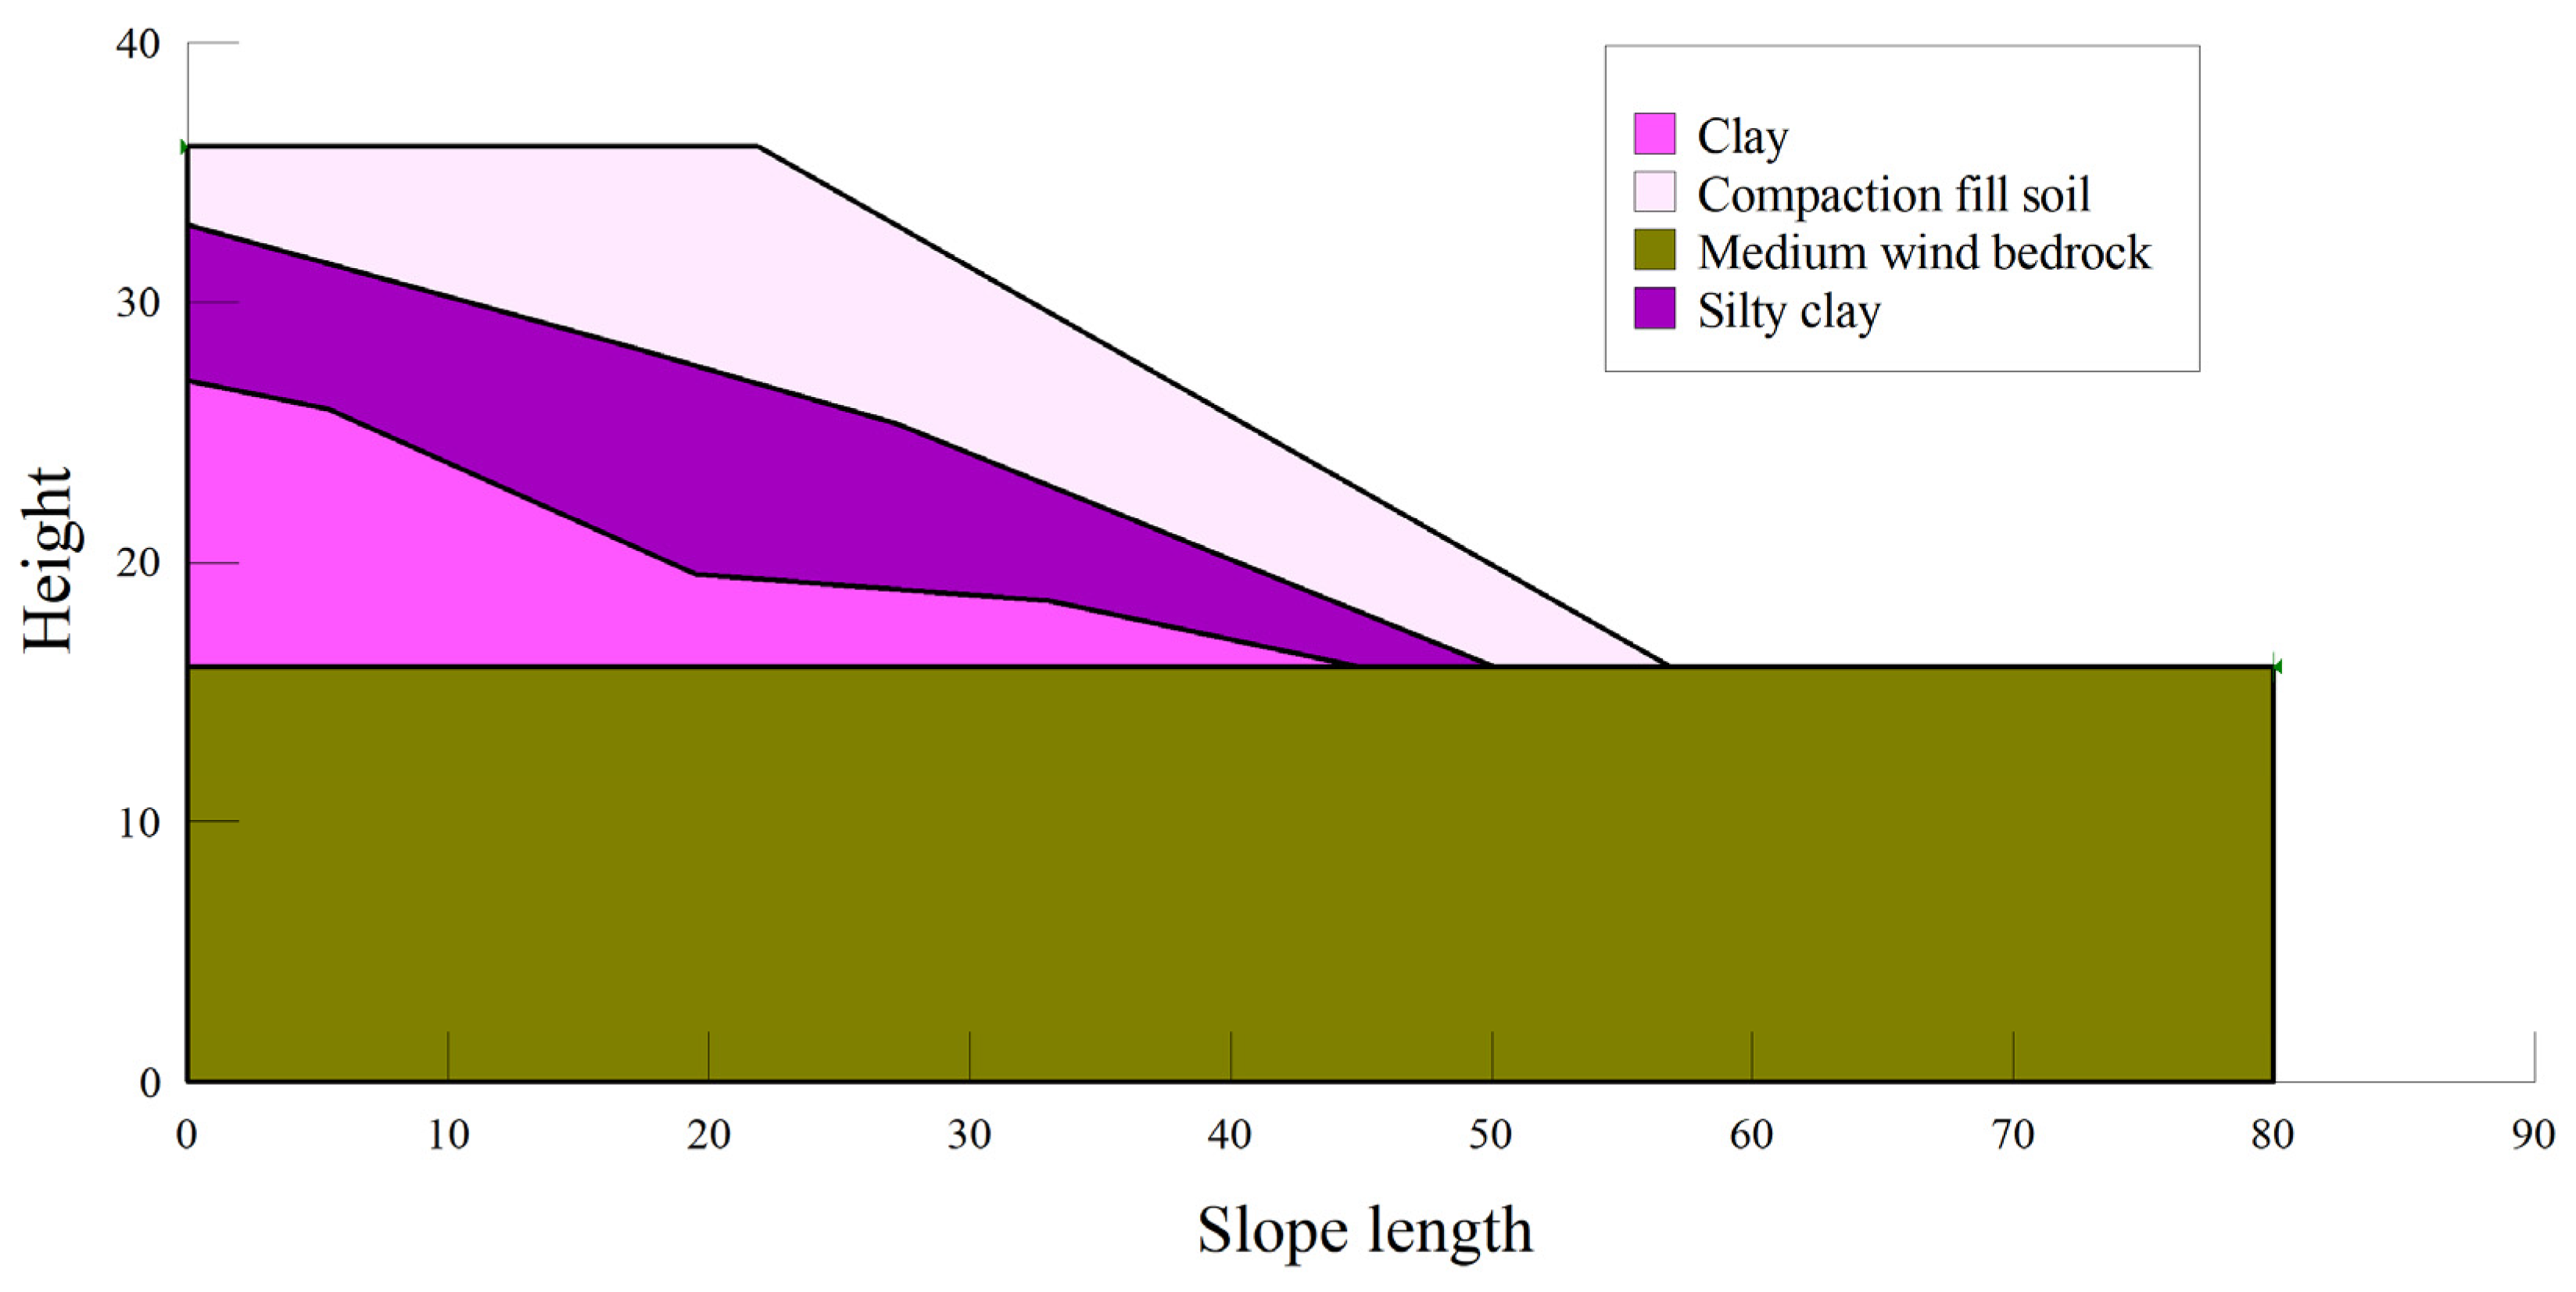
2.1. Basic Geological Overview

The site of a waste disposal project in Yichang City is situated in Fenghuangguan Village, Yingkou Town, Yilong District. It is adjacent to Dangyang City on the east, and the Shanghai-Chongqing Expressway passes through the southern part of the area. The eastern side of the site is close to a rural road, providing convenient transportation access. The site falls within an area characterized by structurally eroding hilly terrain with significant variations in topography, ranging from 180~210 m in elevation. The highest point within the surveyed area is located on the southern side of the site, while the lowest point lies in a central valley within the site, resulting in a maximum elevation difference of approximately 30 m. Steep slopes are prevalent and exhibit terraced distribution patterns with well-developed vegetation cover.
After the proposed site is leveled to the designed elevation, the excavated filling slope will be formed. According to the standard “Code for investigation of geotechnical engineering (Number: GB 50021-2001)” [12] and “Technical code for building slope engineering (Number: GB 50330-2013)” [13], the survey grade of the slope project section A2~A3 backfill will form a soil slope, with a slope length of approximately 82 m and a slope height of approximately 20.4 m; the damage consequence is serious, and the slope’s engineering safety level is level 1. Slope A4~A7’s excavation will form a rock soil slope, with a slope length of approximately 320.8 m and a slope height of approximately 16 m; the damage is serious, and the safety level of the slope’s engineering is level 2. The slopes consist of various types of rock and soil, exhibiting non-uniformity and significant variations in properties. In addition to fill soil, there is a distribution of red clay on the slope, resulting in a moderately complex geological environment for the slope. The distribution of the slope engineering projects is shown in Figure 1.
The sedimentary layers in the site are composed of Quaternary Miscellaneous Fill (Qml), Quaternary Alluvium-Pleistocene Clay (Q4al+pl), Quaternary Eolian Clay (Q4el+dl), Quaternary Eolian Boulders (Q4el+dl), and Upper Cretaceous Luojingtan Formation (K2lj) gravel. According to regional geology, the bedrock geological strata in the site generally slope south-east, with an angle of 6°~13° on average, and have a total thickness of greater than 200 m.
Through on-site investigation, it is known that the ponds in the original site area have all been drained. They are mainly replenished by rainfall and surrounding domestic wastewater and are discharged through evaporation and surface runoff to the low-lying areas in the southwest. The main source of surface water is atmospheric precipitation. Due to the large terrain slope of the site, the atmospheric precipitation mainly collects in the gullies of the site in the form of slope runoff and is discharged to the outside of the site in the southwest direction through the gullies. A small amount penetrates to the lower part of the slope in the form of linear flow along the pore channels.
The main types of groundwater in the site are perched water and fissure water. The perched water is mainly stored in the first layer of miscellaneous fill and the fourth layer of blocky soil. The main source is atmospheric precipitation, which provides a small amount of water and is greatly affected by the season. It is discharged through evaporation and seepage to the lower terrain at the west side of the slope; the fissure water mainly exists in the fissures of the bedrock, and is an insufficient amount of water. During the investigation, simple hydrological observations were carried out in each borehole. No stable and continuous groundwater level was found in the site area, and no seepage points or spring points were exposed. Groundwater has little influence on the slope support construction.
The slope represents a typical high fill slope, backfilled with soil to depths ranging from 20 m to 30 m and reaching up to 45 m at its deepest point. The fill material comprises fragmented rock and coarse-grained soil, primarily composed of shale and mudstone fragments, as well as clayey silt, exhibiting a slight moisture content and dense compaction. Gravel particle sizes typically range from 0 mm to 30 mm, constituting approximately 20% of the composition; boulders range from 220 mm to 300 mm in size, accounting for approximately 25% of the composition. These angular boulders are predominantly characterized by strong weathering and angular shapes. The backfill soil on the slope has undergone layer-by-layer compaction through rolling methods, achieving a compaction degree between 92 and 94%, with a maximum dry density of 1.93 g/cm3. The optimal moisture content is determined to be around 11.0%. This backfill material originates from excavated earth and rock materials that were excavated during site leveling activities. A schematic representation of the typical cross-section of the high fill slope can be shown in Figure 2.

2.2. Types of Slope Instabilities

According to the planning scheme, the excavation of the hillside on the southern side of the site will create an artificial slope with a maximum height of approximately 16 m (rock and soil slope); while the northern and eastern sides of the site will be backfilled to form an artificial slope with a maximum height of approximately 20.4 m. Prior to slope stabilization, there were several occurrences of rolling stones and shallow surface sliding on the slope; however, no evident signs of a large-scale instability such as prominent cracks or landslides were observed, as shown in Figure 3.
After analyzing the engineering geological conditions, the anticipated slope failure modes prior to treatment are categorized into three types: type 1 involves primarily surface debris soil detachment under natural conditions; type 2 entails localized arcs sliding along the upper portion of the slope in saturated conditions; and type 3 encompasses the overall downward sliding of the slope along the base cover under extreme circumstances such as continuous or heavy rainfall.

3. Study of the Physical and Mechanical Parameters of Backfill Soil

The backfill soil, as the primary component of the slope, consists of coarse-grained, compacted soil exhibiting noticeable non-uniformity and anisotropy. Due to its considerable depth, the slope is susceptible to deformation and failure, making the stability of the slope entirely reliant on the physical and mechanical properties of the backfill. Following an analysis and determination of the instability geological model of the slope, it becomes imperative to investigate the physical and mechanical parameters of the backfill. For a similar high embankment slope in a reference project, particle size fraction tests, limit water content tests, compaction tests, and triaxial tests were conducted to ascertain particle gradation, soil type, optimum water content, and selected soil shear strength parameters. Furthermore, triaxial testing revealed how water content influences the internal friction angle, cohesion, and stress–strain curve characteristics in soil samples.

3.1. Determination of the Physico-Mechanical Parameters of Backfill Soil

The backfill soil samples were primarily extracted from the A2~A3 section of the backfill. In order to determine the backfill soil’s particle gradation, a soil particle sieving test was conducted in accordance with the standard “Test Methods of Soils for Highway Engineering (Number: JTG 3430-2020)” [14] to analyze the particle gradation composition and grain group content of the soil samples, as shown in Figure 4: the x axis is the Ln of the sieve size. The results of the test revealed that the coefficient of uniformity (CU) for the grain screening test was 10.2, while the curvature coefficient (CC) was 1.3.
Meanwhile, based on the above criteria, the DZY-II Multi-functional Electric Compaction Instrument was adopted, and a sample container with a volume of 2177 cm3, a height of 17 cm, and an inner diameter of 15.2 cm was selected for the test. The bottom of the hammer is 5 cm, the hammer mass is 4.5 kg, and the height of the hammer is 45 cm. The maximum dry density ρ d m a x and optimal moisture content ω o p t of the slope soil sample were identified as 17.32 kN/m3 and 20.15%, respectively, which provided parameters for the triaxial test in the next step. As shown in Figure 5.

3.2. Indoor Triaxial Test

3.2.1. Sample Preparation and Scheme Setting

To investigate the impact of moisture content on the shear strength of the fill slope soil and the variations in its cohesion, friction angle, and stress–strain curve as moisture content changes, in accordance with the standard “Test Methods of Soils for Highway Engineering (Number: JTG 3430-2020)” [14], unconsolidated undrained shear tests were conducted to analyze the changes in cohesion and friction angle, as well as stress–strain curve trends for low liquid limit clay under different initial moisture contents and confining pressure conditions. Additionally, the cohesion and friction angle of the soil samples taken at various moisture content levels were determined.
The individual sample sizes and triaxial test setup is shown in Figure 6. The optimal moisture content is 20.15%; therefore, 18%, 19%, 20%, and 21%, as the 4 kinds of moisture content samples were set. First of all, the dried low liquid limit clay was crushed with a wooden stick and passed through a 2 mm sieve. The soil samples below 2 mm were prepared according to 4 target moisture contents, and the prepared soil samples were sealed in plastic bags and moistened for 24 h. Then, they were compacted in four layers using the three-valve plate and the compactor. The test specimen had a diameter of 39.1 mm, a cross-sectional area of 1200 mm2, a specimen height of 70 mm, and a volume of 84 cm3. Last, they were weighed and sealed with plastic wrap. Four target confining pressures of 50 kPa, 100 kPa, 200 kPa, and 300 kPa were set to obtain the shear strength, and the shear rate was 0.8 mm/min. The test was stopped when the axial strain reached 15%.

3.2.2. Analysis of the Experimental Results

As shown in Figure 7, it was found that the moisture content has a significant impact on the stress–strain curve due to the change of confining pressure, which mainly manifests in the peak value and the morphological features of the curve. Under the same confining pressure, the stress–strain curve of different moisture contents will accompany an increase in axial strain; the deviatoric stress value will rise to its peak first and then gradually decrease, resulting in a flatter curve with continued axial strain. Additionally, differences exist between the curves of varying moisture contents; the overall height decreases as moisture content increases, and peak deviatoric stress diminishes accordingly.
This phenomenon indicates that as moisture content rises, maximum deviatoric stress withstandable by specimens during shearing decreases while failure mode shifts from ‘brittle’ to ‘plastic’. Considering also confining pressure’s role on the stress–strain curves, we found the following: at 50 kPa confining pressure, the morphology changes from ‘steep’ to ‘gentle’, with increasing moisture content showing relatively large differences; at 300 kPa confining pressure, morphological differences are smaller and curves tend towards gentleness. Thus, it is evident that the influence of moisture content on the stress–strain curves is constrained by confining pressure.
According to the standard “Test Methods of Soils for Highway Engineering (Number: JTG 3430-2020)” [14] unconsolidated undrained shear tests, the data corresponding to the internal friction angle and cohesion at four different water content levels of 18%, 19%, 20%, and 21% are shown in Figure 8. Under the influence of water content, both the internal friction angle and cohesion exhibit a decreasing trend as the water content increases. When the water content increases from 17% to 19%, the internal friction angle decreases from 36.05° to 32.88°, representing a decrease of 9%. The cohesion also decreases from 89.66 kPa.
The results indicate that cohesion is more significantly affected by water content than the internal friction angle. This is attributed to an increase in free water within unsaturated clay with increasing water content, leading to a reduction in the shear strength of the soil mass. According to the parameter values of the saturation state of other soil masses in the on-site investigation report and the results of the comprehensive test, it was found that when the moisture content of the sample soil mass is 21%, the soil mass has reached the saturation state.
The shear strength values corresponding to different confining pressures of 50 kPa, 100 kPa, 200 kPa, and 300 kPa are depicted in Figure 9. With varying confining pressures, the soil’s shear strength diminishes as water content increases. Higher confining pressure leads to greater shear strength values and accentuates the declining trend. At low water content levels, non-saturated soil particles possess a thin surface film of bound water that promotes adhesion and cohesion, resulting in robust shear resistance. As the water content rises, the bound water film thickens and the free water content increases, leading to reduced friction and cohesion between soil particles and consequently decreasing shear strength. According to the unconsolidated, undrained shear test data and the field survey results, the shear strength index of the high fill slope soil sample is 35 kPa, and the internal friction angle is 19°.

3.3. Determination of the Numerical Analysis Parameters of the Backfill Slope

Considering the impact of precipitation, the soil parameters in both natural and saturated states are established. By integrating the on-site investigation report, indoor compaction test results, and indoor unconsolidated and unconfined triaxial test results, a comprehensive analysis of the physical and mechanical indicators of coarse-grained soil backfilling on the slope is conducted to propose the physical and mechanical parameters for the slope backfilling soil. The specific calculation values are presented in Table 1.

4. Stability Analysis of the High Fill Slope

4.1. Slope Stability Analysis Based on the Rigid Body Limit Balance Method

First, typical cross-sections of the A2–A3 slope for backfill were selected and analyzed using the limit equilibrium method. Additionally, referring to the typical embankment slope cross-section in Figure 1, a model was constructed using Geo-Studio geotechnical software (2024) to calculate the stability coefficient of the slope under different working conditions. This slope is classified as a permanent slope with a safety grade of level one and a design safety factor of 1.30.
Considering the actual conditions of the slope, both natural and saturated working conditions were taken into account. The natural condition is considered normal, while the saturated condition represents an extreme scenario. Exploration has revealed that there is no groundwater level present in the natural condition; therefore, to simplify calculations, a seepage analysis was not conducted. Instead, natural and saturated unit weights were used to represent their respective working conditions.

4.2. Overall Stability Analysis of the Slope

When conducting an overall analysis of the slope, the base of the clay layer was designated as the sliding surface, and the slope stability coefficient was computed using the SLOPE/W module in Geo-Studio geotechnical software. The stability analysis modeling is shown in Figure 10.
Geotechnical parameters were chosen based on Table 1, and the models for calculating overall stability of the slope under natural and rainfall saturated conditions are depicted in Figure 11 and Figure 12, respectively. The calculations reveal that the stability coefficient of the slope under natural conditions is 1.508, while it is 1.318 under saturated conditions. The overall stability coefficient exceeds 1.30, indicating that the slope’s stability level is general; however, it reaches a critical state under saturated conditions.
According to Figure 13, the calculation results indicate that under rainfall-saturated conditions, with the fill soil layer bottom as the sliding surface, the local stability coefficient of the fill layer is 2.201, demonstrating a favorable slope stability.

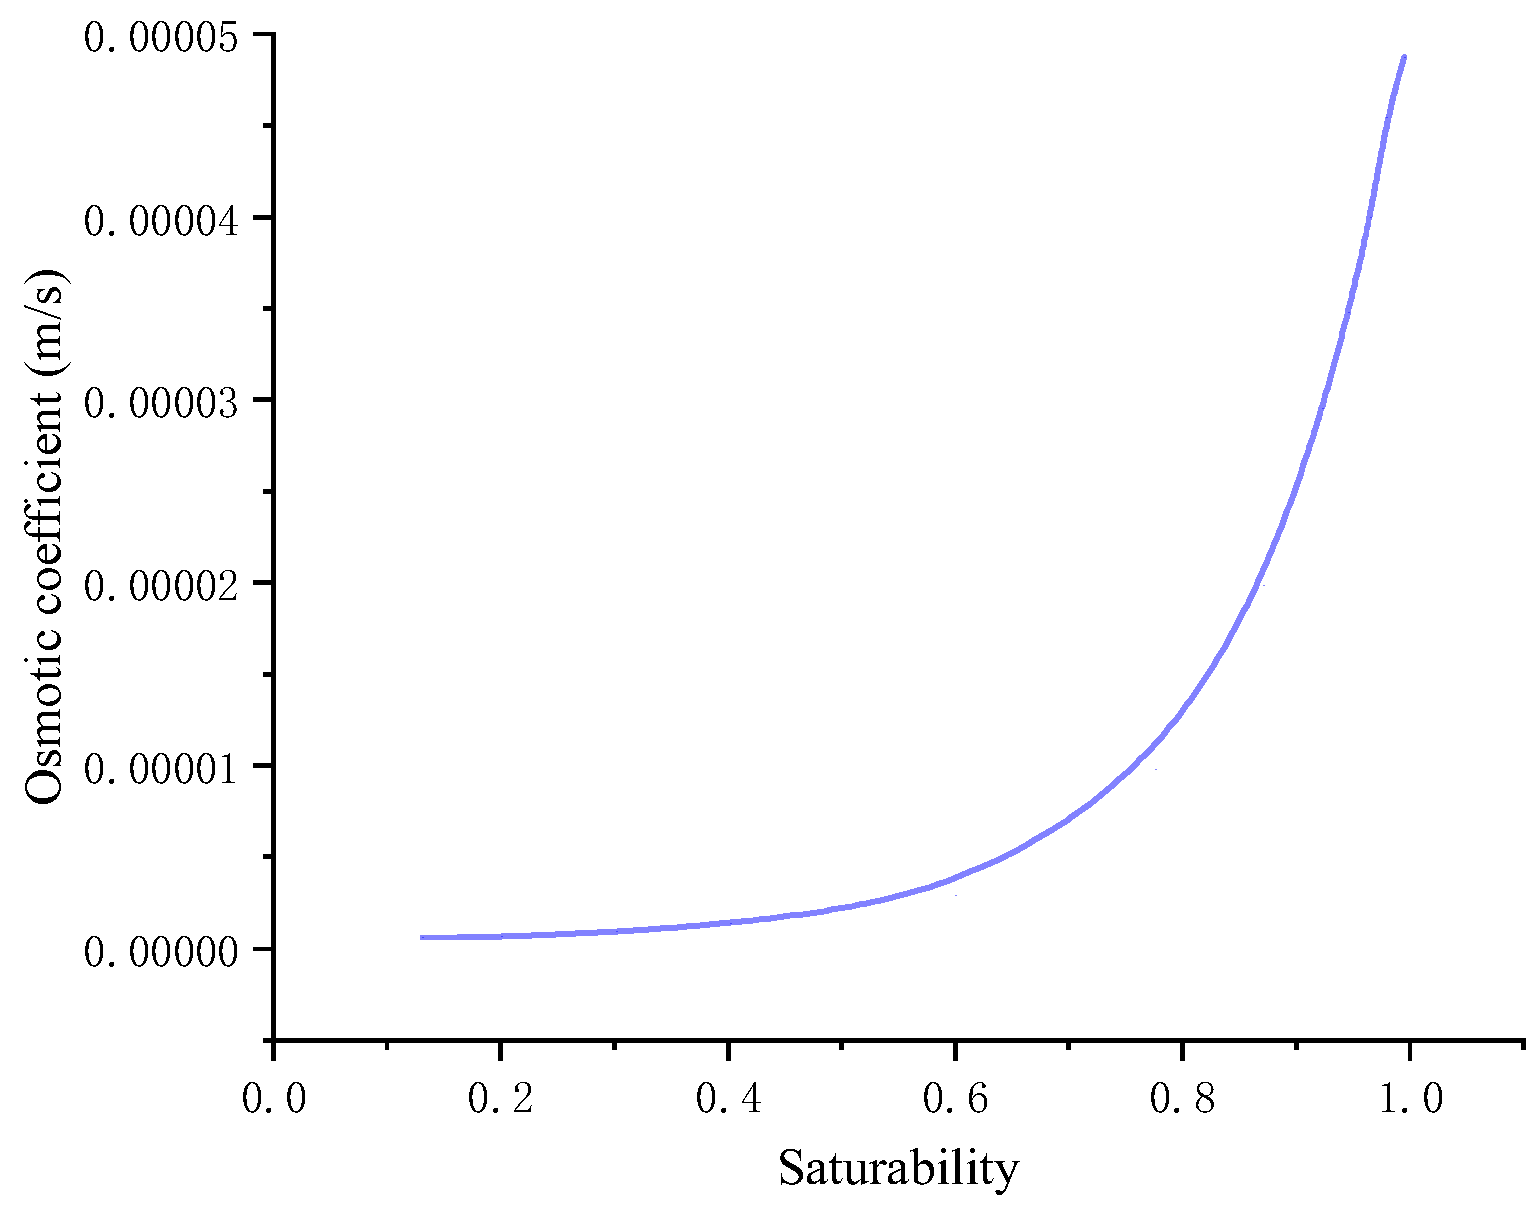
4.3. Analysis of the Numerical Calculation Results of the Saturation State of the Backfill Slope

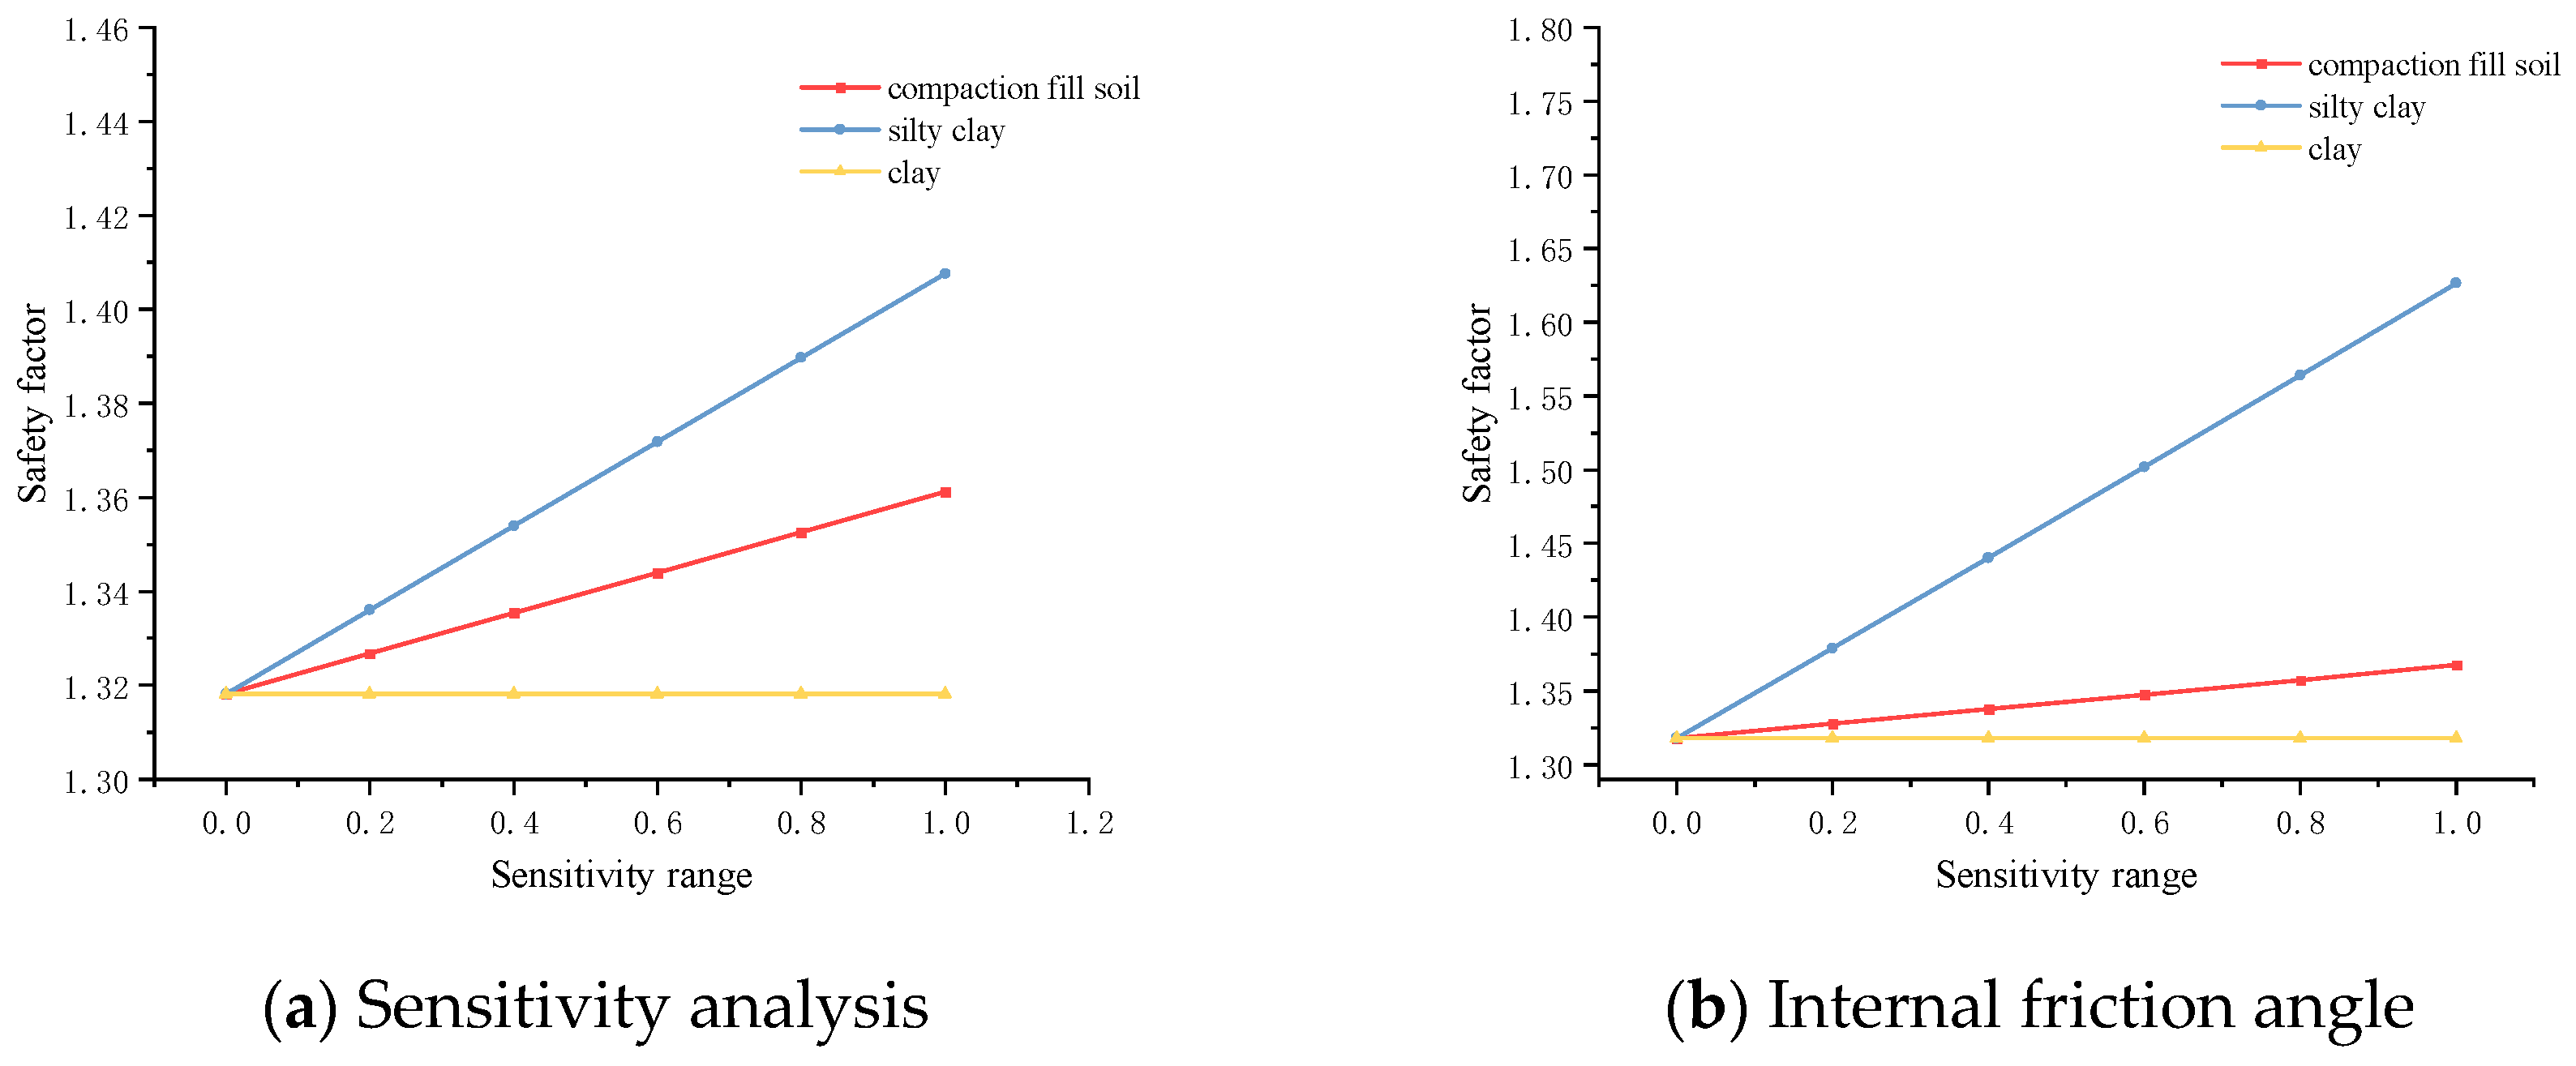
4.3.1. The Sensitivity Analysis of Soil Body Parameters

When conducting a stability analysis of a high fill slope, it is essential to perform a sensitivity analysis on the soil parameters. When various factors change within their possible ranges, to analyze the trend and degree of the deviation of the system characteristic value p from the benchmark state p due to these factor changes, an analysis method is performed and this is called a sensitivity analysis [15]. By utilizing the sensitivity analysis function in Geo-Studio geotechnical software, the sensitivity results for backfill soil parameters affecting slope stability were obtained. Figure 14 indicates that the clayey loam soil parameters exhibit the highest sensitivity to soil stability, followed by the compacted fill soil parameters. Consequently, it can be inferred that selecting the clayey loam soil layer as the sliding surface is feasible.

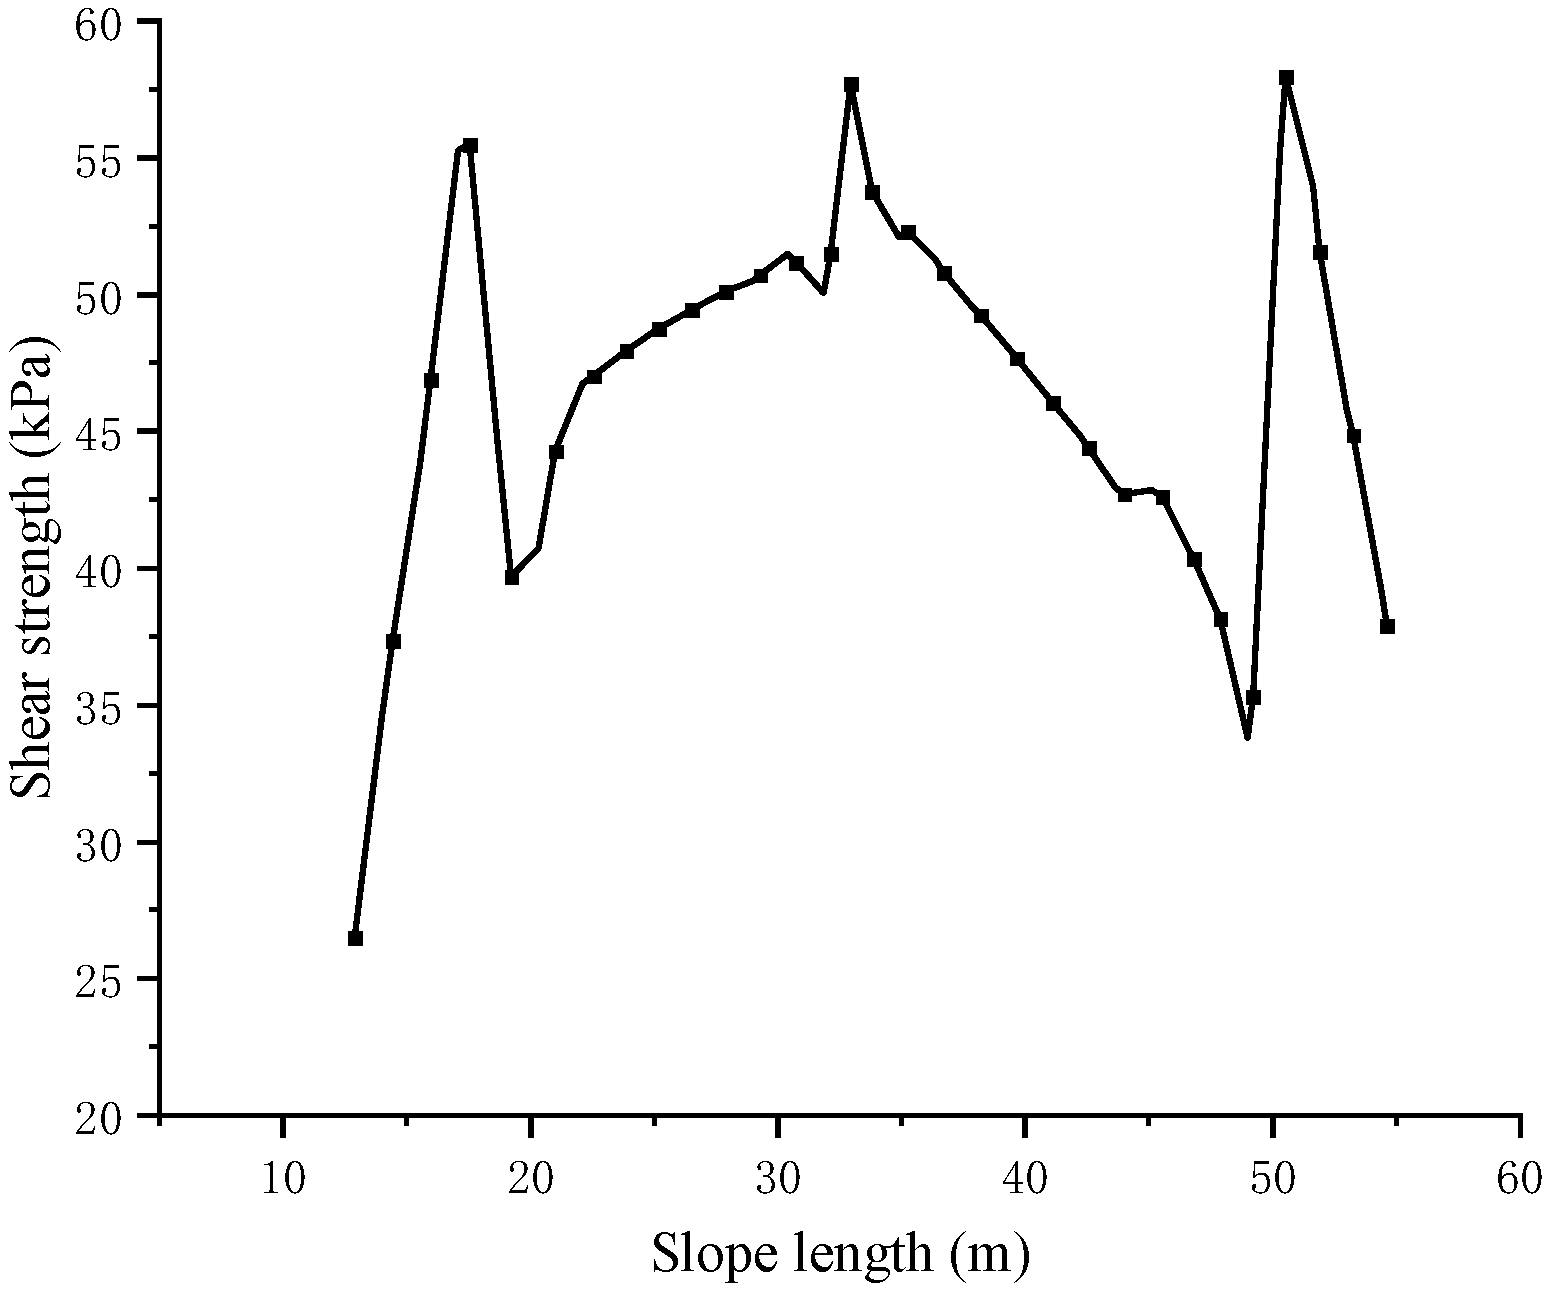
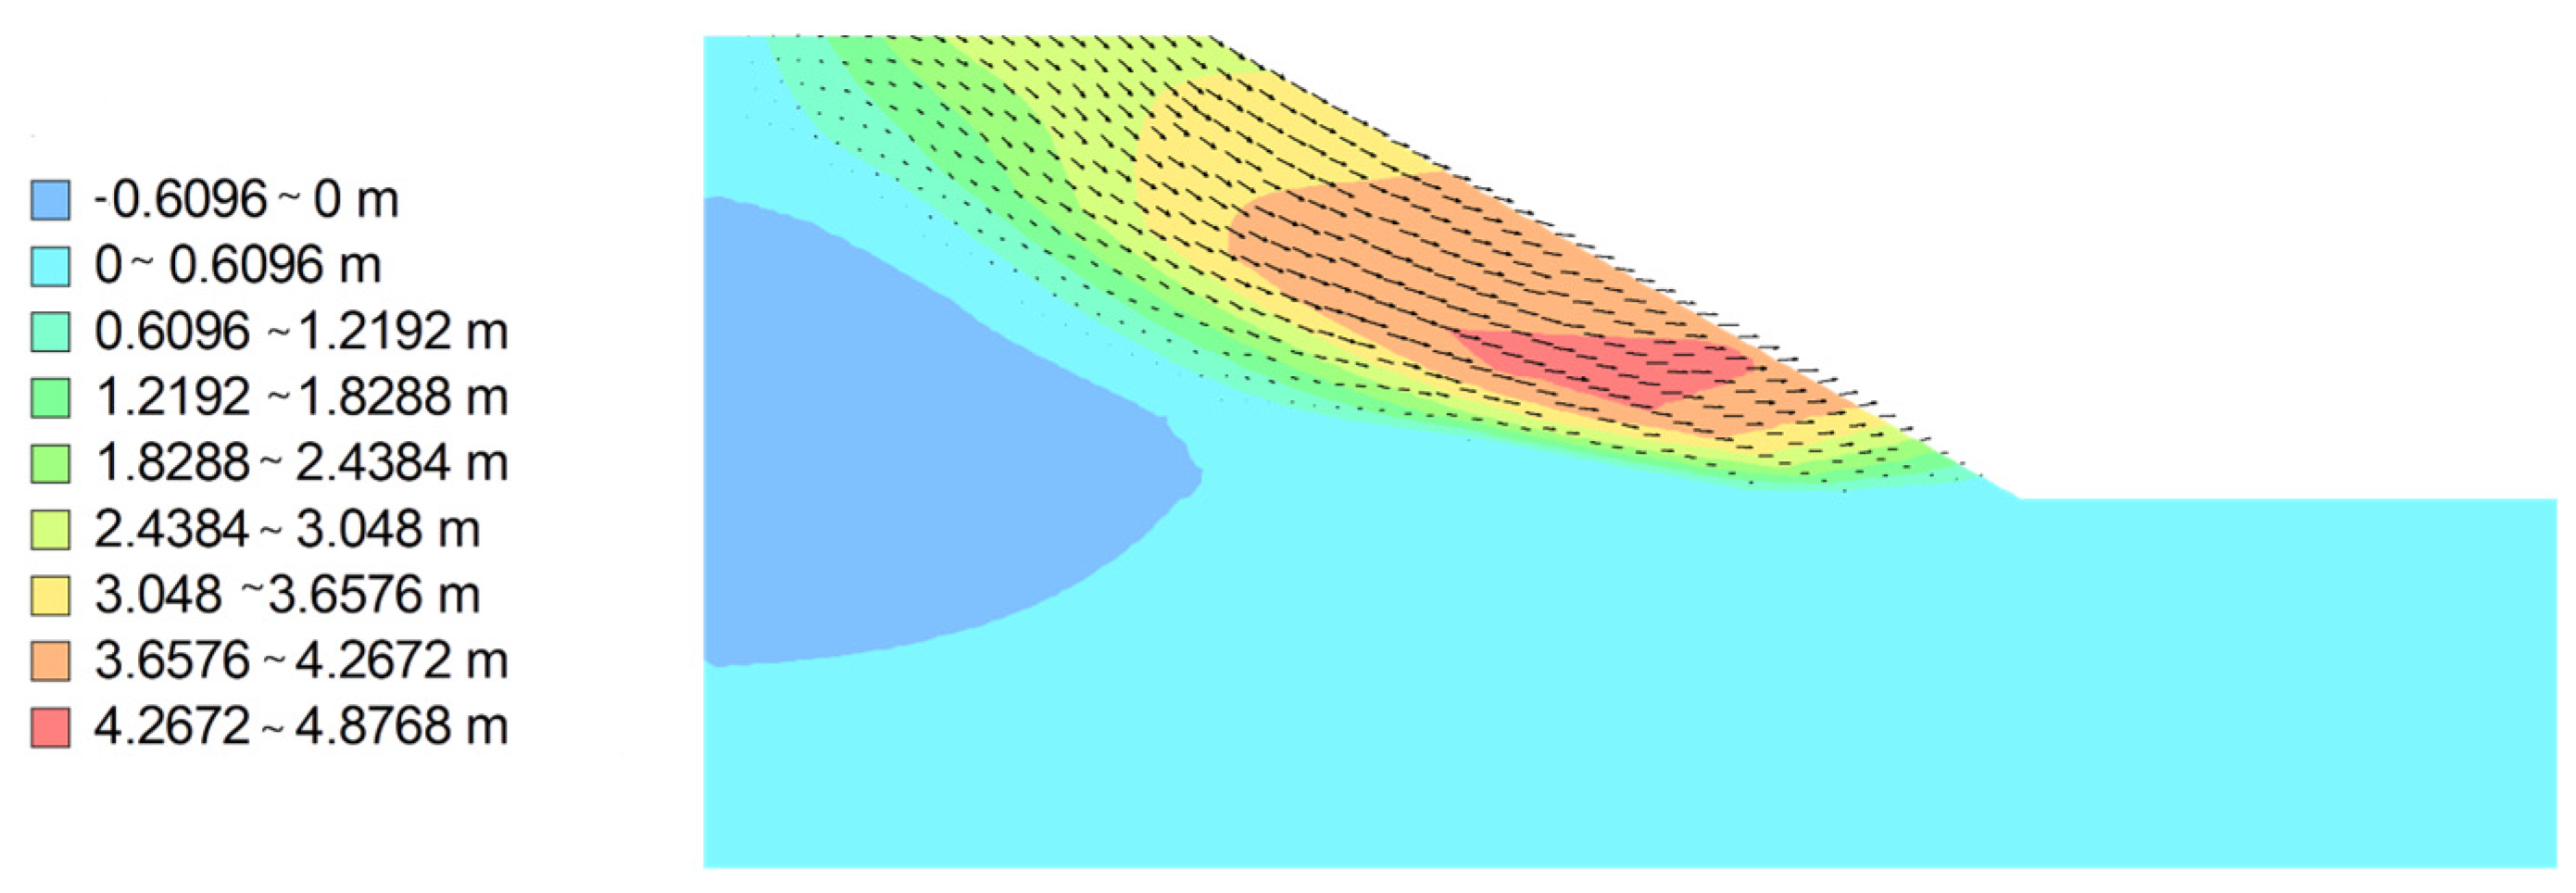
4.3.2. Mechanical Analysis of the Slope Sliding Surface

Based on the aforementioned calculation results, a mechanical analysis of the sliding surface in the critical state was conducted. Figure 15 and Figure 16 illustrate that the shear strength at the sliding surface exhibits concavity. The cohesion strength of the compacted fill layer decreased from 32 kPa at the undamaged surface to 17.5 kPa at the failure surface due to soil failure. Additionally, Figure 16 indicates that the point of failure near the sliding surface is located 15 m away from the shoulder of the slope, while another point of failure at the toe of slope is situated directly at its base.

4.4. Numerical Simulation Analysis of High Fill Slope Stability with Different Slope Rates

4.4.1. Establishment of Slope Model and Setting of Boundary Conditions

In this numerical simulation, the research focuses on the typical cross-section of the high fill slope in section A2–A3 of the relied-on project. A numerical analysis model was established using Geo-Studio software to study the evolution law of slope stability under different slope gradient conditions. The base width of the slope is 80 m, with a height of 36 m, and it was graded at level 1. Three different slope gradient conditions (30°, 40°, and 50°) are investigated, with an example model established for a 30° slope gradient, as shown in Figure 17.
The model was discretized using quadrilateral and triangular meshes, as well as plane, four-node, strain-controlled pressure elements. A total of 2155 nodes and 2061 elements were incorporated into the model. Based on on-site survey data and in-house geotechnical tests, the slope soil from top to bottom comprises compacted fill, clayey soil, clay, and medium-weathered rock.
When analyzing slope stability under rainfall infiltration conditions, rainfall is applied to the slope top and all the slope’s surfaces without considering surface runoff. The downslope surface is free to drain, while the rainfall boundary function is represented by appropriate rainfall intensity for different conditions. In the numerical simulation analysis, a fixed boundary condition of x = 0 and y = 0 was defined at the bottom of the model; similarly, a fixed boundary condition of x = 0 was defined for the side.
The upper surface of the slope was left undefined. The soil constitutive model utilized in this analysis is based on Elasto-Plastic theory using the Mohr-Coulomb constitutive model.

4.4.2. Parameter Setting of the Numerical Model

Prior to conducting numerical simulation calculations, it is essential to establish the material properties of each soil layer, encompassing the specific weight, cohesion, and internal friction angle of each soil layer, as well as other fundamental physical and mechanical parameters. Furthermore, consideration should be given to the unsaturated characteristics of the soil, necessitating determination of the soil–water characteristic curve and permeability coefficient for each soil layer.
Based on the geotechnical investigation report of the high embankment slope project, the soil mechanical parameters were determined through in-house tests [14], combined with practical experience in geotechnical engineering. Simplified calculations were conducted by assuming a permeability coefficient of 2 × 10⁻⁶ m/s for medium-weathered rock and 5 × 10⁻⁵ m/s for the remaining soil layers.
The soil–water characteristic curve, also known as the soil–moisture characteristic curve, reflects the relationship between soil saturation and matrix suction. It is an essential requirement for simulating the stability of unsaturated soil slopes. Based on the results of the survey report and relevant research findings [16], the numerical simulation analysis of slope stability in this paper adopts the soil–water characteristic curve shown in Figure 18.
Using Gardner’s empirical model and Van Genuchten’s permeability coefficient model, the permeability coefficient curve of the slope soil was obtained, as shown in Figure 19.

4.4.3. Setting of the Rainfall Duration Curve under the Maximum Daily Rainfall

The project site is situated in Yichang City, Hubei Province, characterized by substantial precipitation and an extended rainy season that often leads to high embankment slope failures. An analysis of the historical monthly precipitation data from last year revealed a peak daily rainfall of 216 mm in our investigation area. Considering both meteorological–hydrological features at our site and safety standards for this engineering endeavor, it is imperative to conduct stability simulations under extreme conditions when assessing proposed high embankment slopes that will be subjected to maximum daily rainfalls. Henceforth, we have chosen 220 mm as our designated value for studying the maximum daily precipitation. The rainfall statistics of the project area from January to December in 2023 are shown in Table 2.
The simulated rainfall process occurs within a single day, from the onset of rainfall to its cessation. Specifically, the rainfall intensity gradually increases from zero to its peak value and then remains constant at a peak intensity of 220 mm/d before subsequently decreasing back to zero. As depicted in Figure 20, the area under the curve formed by the rainfall intensity amplitude and time axis represents the total daily rainfall. To achieve a daily precipitation amount of 220 mm, the duration of rainfall spans 3 days on the horizontal axis, with a peak rainfall intensity of 0.15 m3/d/m2. The time taken for the rainfall intensity to increase from zero to its peak value as well as decrease from its peak value back to zero is 1 day for both.

4.5. Slope Stability Analysis of Different Slope Rates under the Maximum Daily Rainfall Condition

The stability of high fill slopes with slope angles of 30, 40, and 50° was numerically simulated using the method of intensity reduction. This study reveals the evolutionary patterns of high embankment slope stability under different slope angles in saturated conditions. Furthermore, based on the simulation analysis results, the design scheme for the referenced project’s high embankment slope was validated for its rationality.
Figure 21, Figure 22 and Figure 23 illustrate that the maximum horizontal displacement of the high fill slope occurs near the toe at various slope gradients, with a gradual decrease in value as one moves up the slope. Similarly, the maximum settlement displacement of the high embankment slope is observed at the point of slope transition at the top, with a decreasing value as one moves down, accompanied by a vertical upward bulge on the toe due to rainwater infiltration and soil saturation.
As the slope angle increases, the safety coefficient gradually decreases, and the stability state of the slope also transitions from stable to marginally stable and ultimately to unstable. At a slope angle of 50°, the safety coefficient is 0.950, indicating an unstable condition. With a 40° slope angle, the safety coefficient measures at 1.025, placing it in a critical state. A 30° slope yields a safety coefficient of 1.318, signifying marginal stability with proximity to the threshold value Fst = 1.30 for overall stability under non-maximum daily rainfall conditions.
Under natural conditions and maximum daily rainfall, the high fill slope with a 30° gradient meets the requirements for slope stability. However, it should be noted that the stability analysis in this chapter does not account for slope protection and support structures. Considering numerical simulation under rainfall conditions as the most unfavorable factor, the stability state of the high fill slope with a 30° gradient can be classified as stable, meeting the safety grade requirements for project engineering at level 1.

5. Discussion

This paper is based on the high fill slope of a proposed domestic waste treatment project site in Yichang City and selects the typical profile of the backfill slope from section A2 to A3 for a stability analysis. Initially, the engineering geological conditions of the research area, encompassing topography, meteorology and hydrology, geological strata and rock properties, as well as regional geological structures, were briefly outlined. Subsequently, an analysis was conducted on the failure modes, factors influencing instability, and stability evaluation criteria for the high fill slope.
The influence of rainfall on slopes primarily arises from alterations in the mechanical properties of the slope, including a reduction in soil matrix suction, an elevation of pore water pressure, and a decrease in soil shear strength. These changes can result in slope instability and failure. Given the intricate nature of rainfall patterns and the diverse characteristics of slope soils, stability variations for tall embankment slopes under different operational conditions will differ. Therefore, it is imperative to conduct stability analyses for the reference project under various specific rainfall scenarios through on-site investigations, laboratory tests, and numerical simulations.

6. Limitations

Owing to the intricate failure mechanisms associated with high fill slopes, there exists a diversity of research methods and approaches; however, certain limitations persist within this study. The prolonged duration and variability of precipitation during Hubei Province’s rainy season necessitate an expanded consideration beyond the one typical rainfall pattern presented here; improvements must be made to simulate extreme weather scenarios accurately when investigating how different rain patterns impact high embankment slope stability numerically.
The current numerical simulations overlook protective or supportive measures for these slopes; henceforth, it is recommended that various reinforcement strategies be simulated and compared to offer enhanced theoretical insights into practical engineering applications concerning high embankments’ stability analyses moving forward. Furthermore, it is imperative to acknowledge that the soil layers within these sloping terrains do not behave uniformly, as assumed in our simulations, nor do the simulations account for the surface runoff dynamics which occur naturally within real-world settings due to varying permeability coefficients across different sections or the potential formation of rain-induced surface runoffs.

7. Conclusions

The paper focuses on high embankment slopes as the research subject and is based on the investigation of geological models of the slopes. It employs indoor and outdoor rock and soil experiments as well as a numerical analysis. The main conclusions are as follows:
(1)
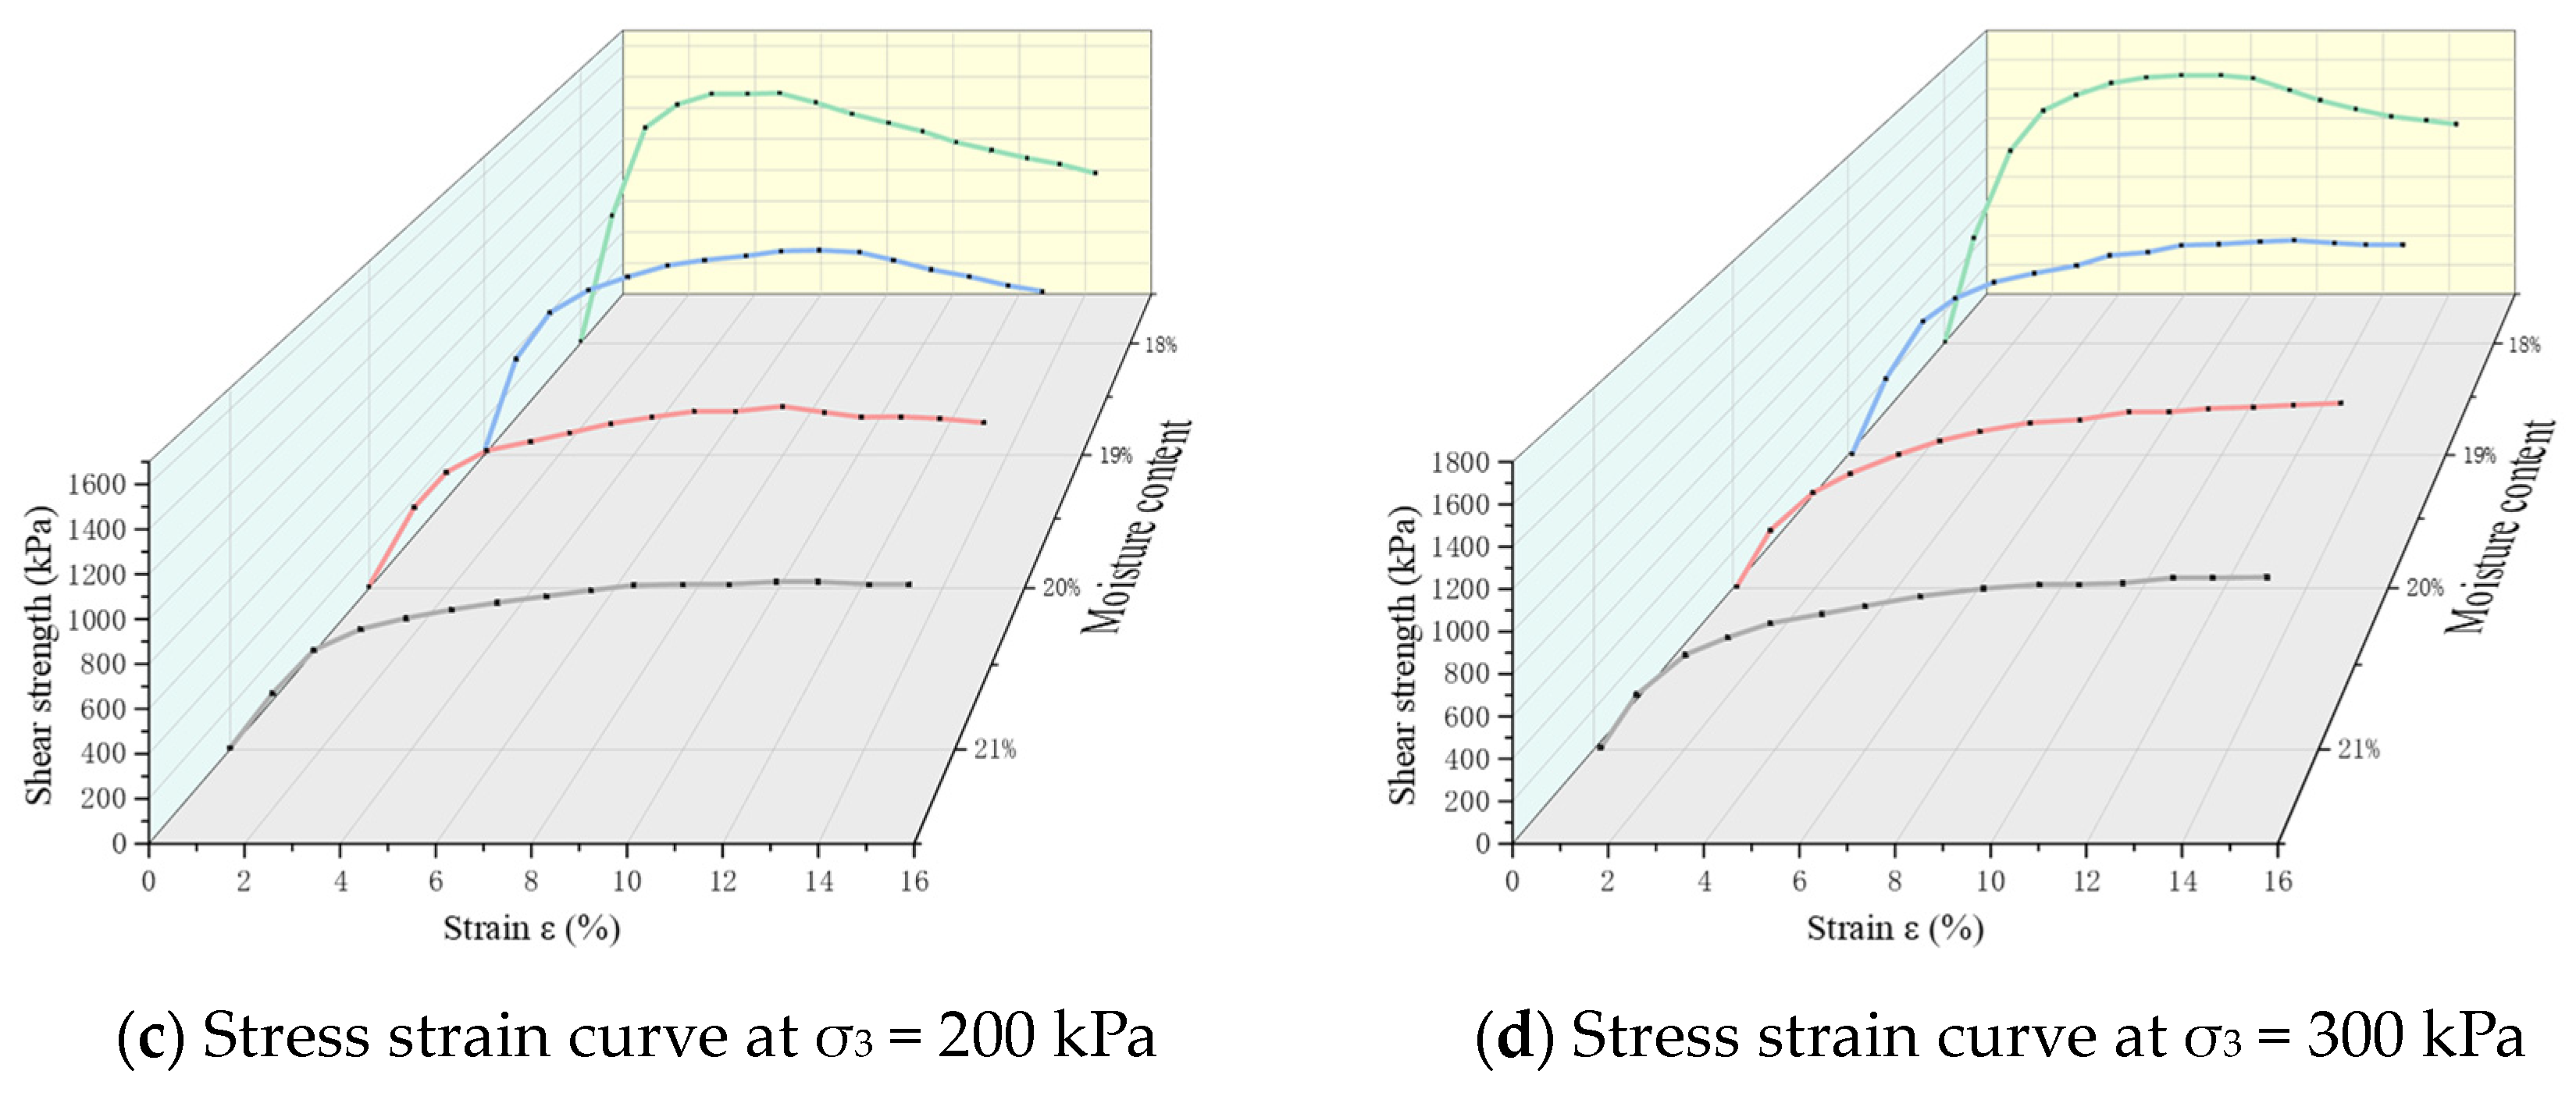
The influence of water content on stress–strain curves is primarily manifested in the curve shape and the magnitude of the deviator stress peak. Under identical confining pressure, an increase in water content leads to an overall decrease in the stress–strain curve, along with a reduction in the magnitude of the deviator stress peak. Following the attainment of this peak, the curve gradually descends until it becomes flat. Changes in confining pressure result in noticeable alterations to the curve shape at different water contents, indicating that the impact of water content on curve shape is constrained by confining pressure.
(2)
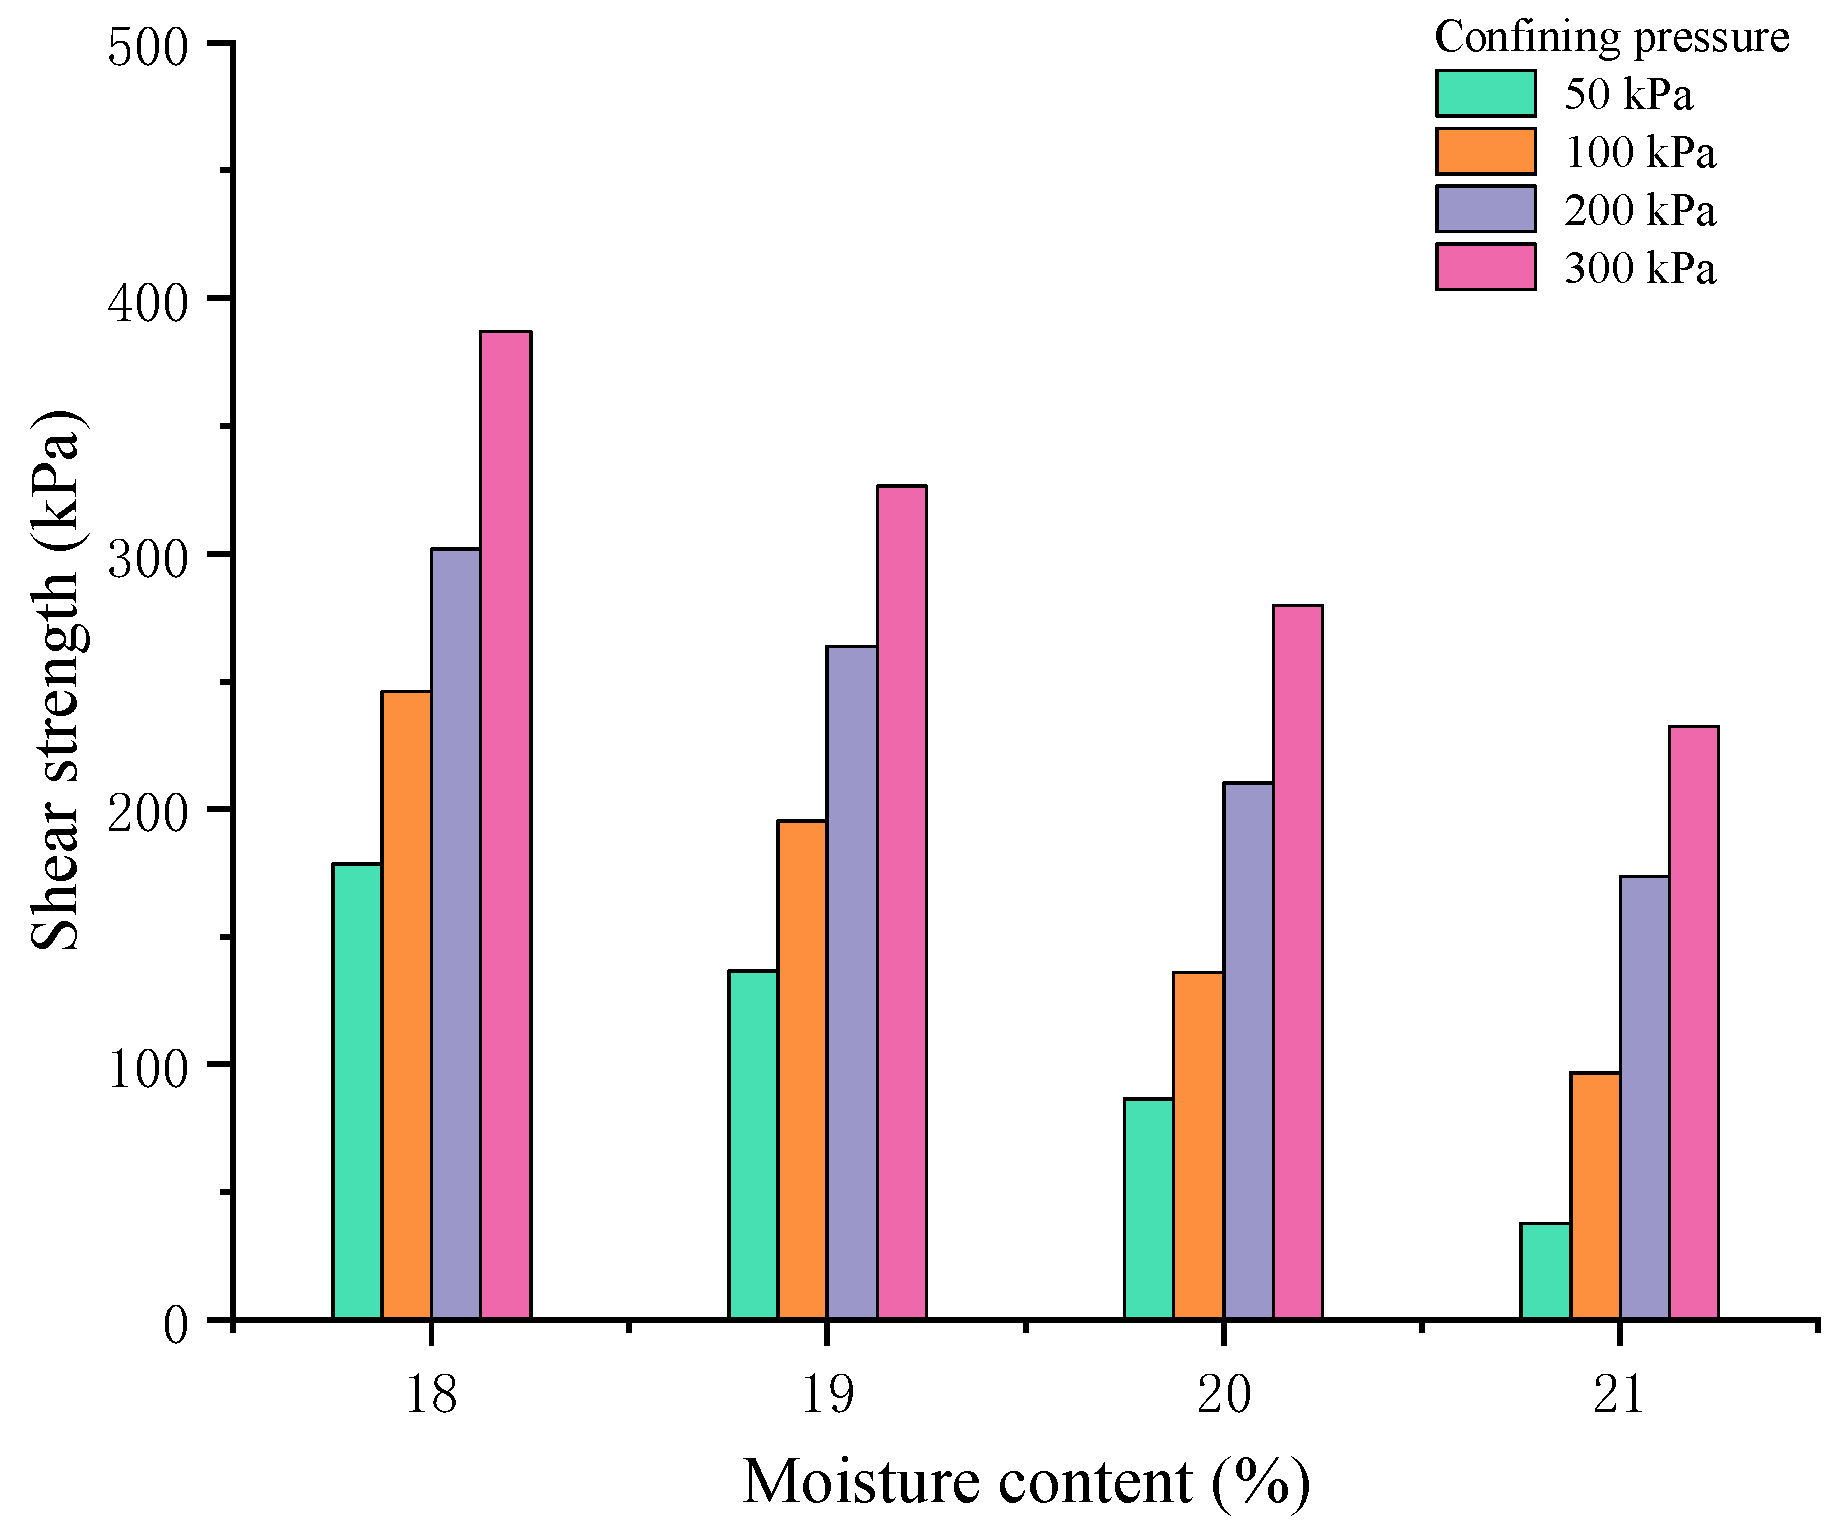
With the rise of the water content, both the internal friction angle and cohesion of the soil diminish. However, the magnitudes of their being affected by the water content of the soil vary. When the water content increases from 18% to 19%, the internal friction angle drops from 36.05° to 32.88°, a decrease of 3.17°, with a reduction amplitude of 9%. The cohesion reduces from 89.66 kPa to 63.21 kPa, a decrease of 26.45 kPa, with a reduction amplitude of 29.5%. The aforementioned data suggest that the influence of the water content of the soil on cohesion is significantly greater than that on the internal friction angle. Additionally, the shear strength value of the soil decreases as the water content increases. Moreover, the greater the confining pressure, the higher the shear strength value. At the same time, the greater the confining pressure, the more pronounced the decreasing trend of the shear strength value of the soil.
(3)
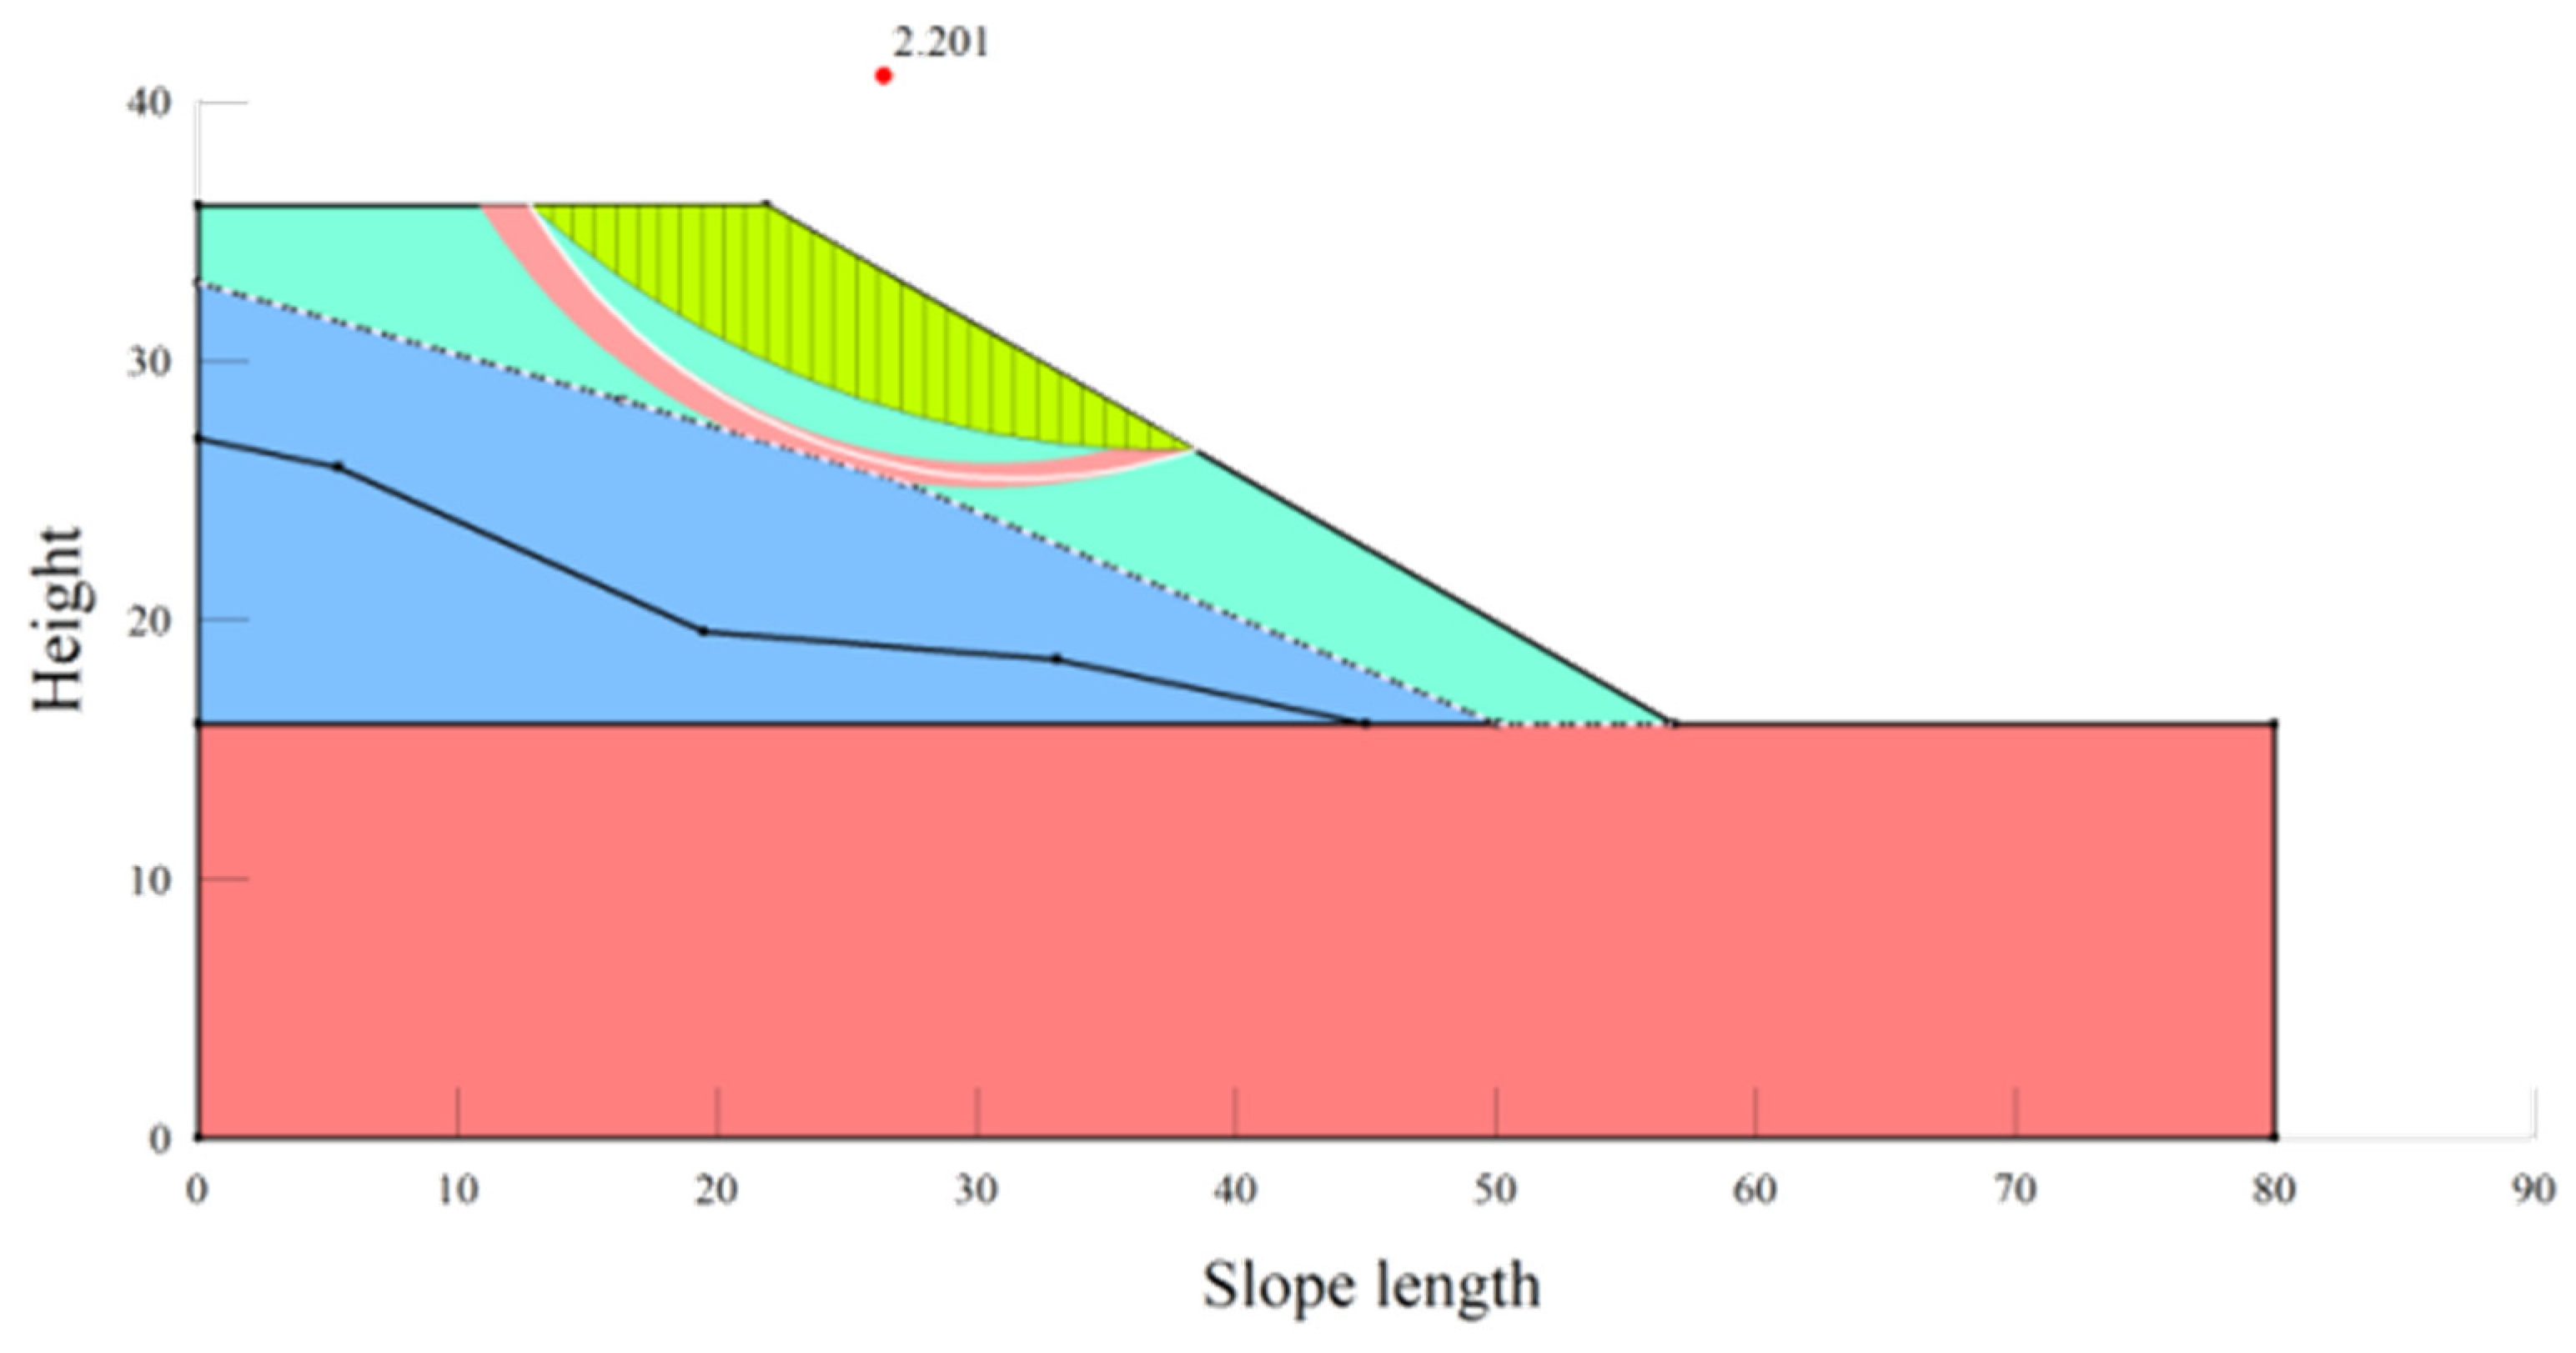
The rigid limit equilibrium analysis indicates that the overall slope stability is satisfactory, with the stability coefficients all exceeding 1.30; the local stability calculation results reveal that the central slope in saturated working conditions exhibits a significantly higher stability coefficient of over 1.35.
(4)
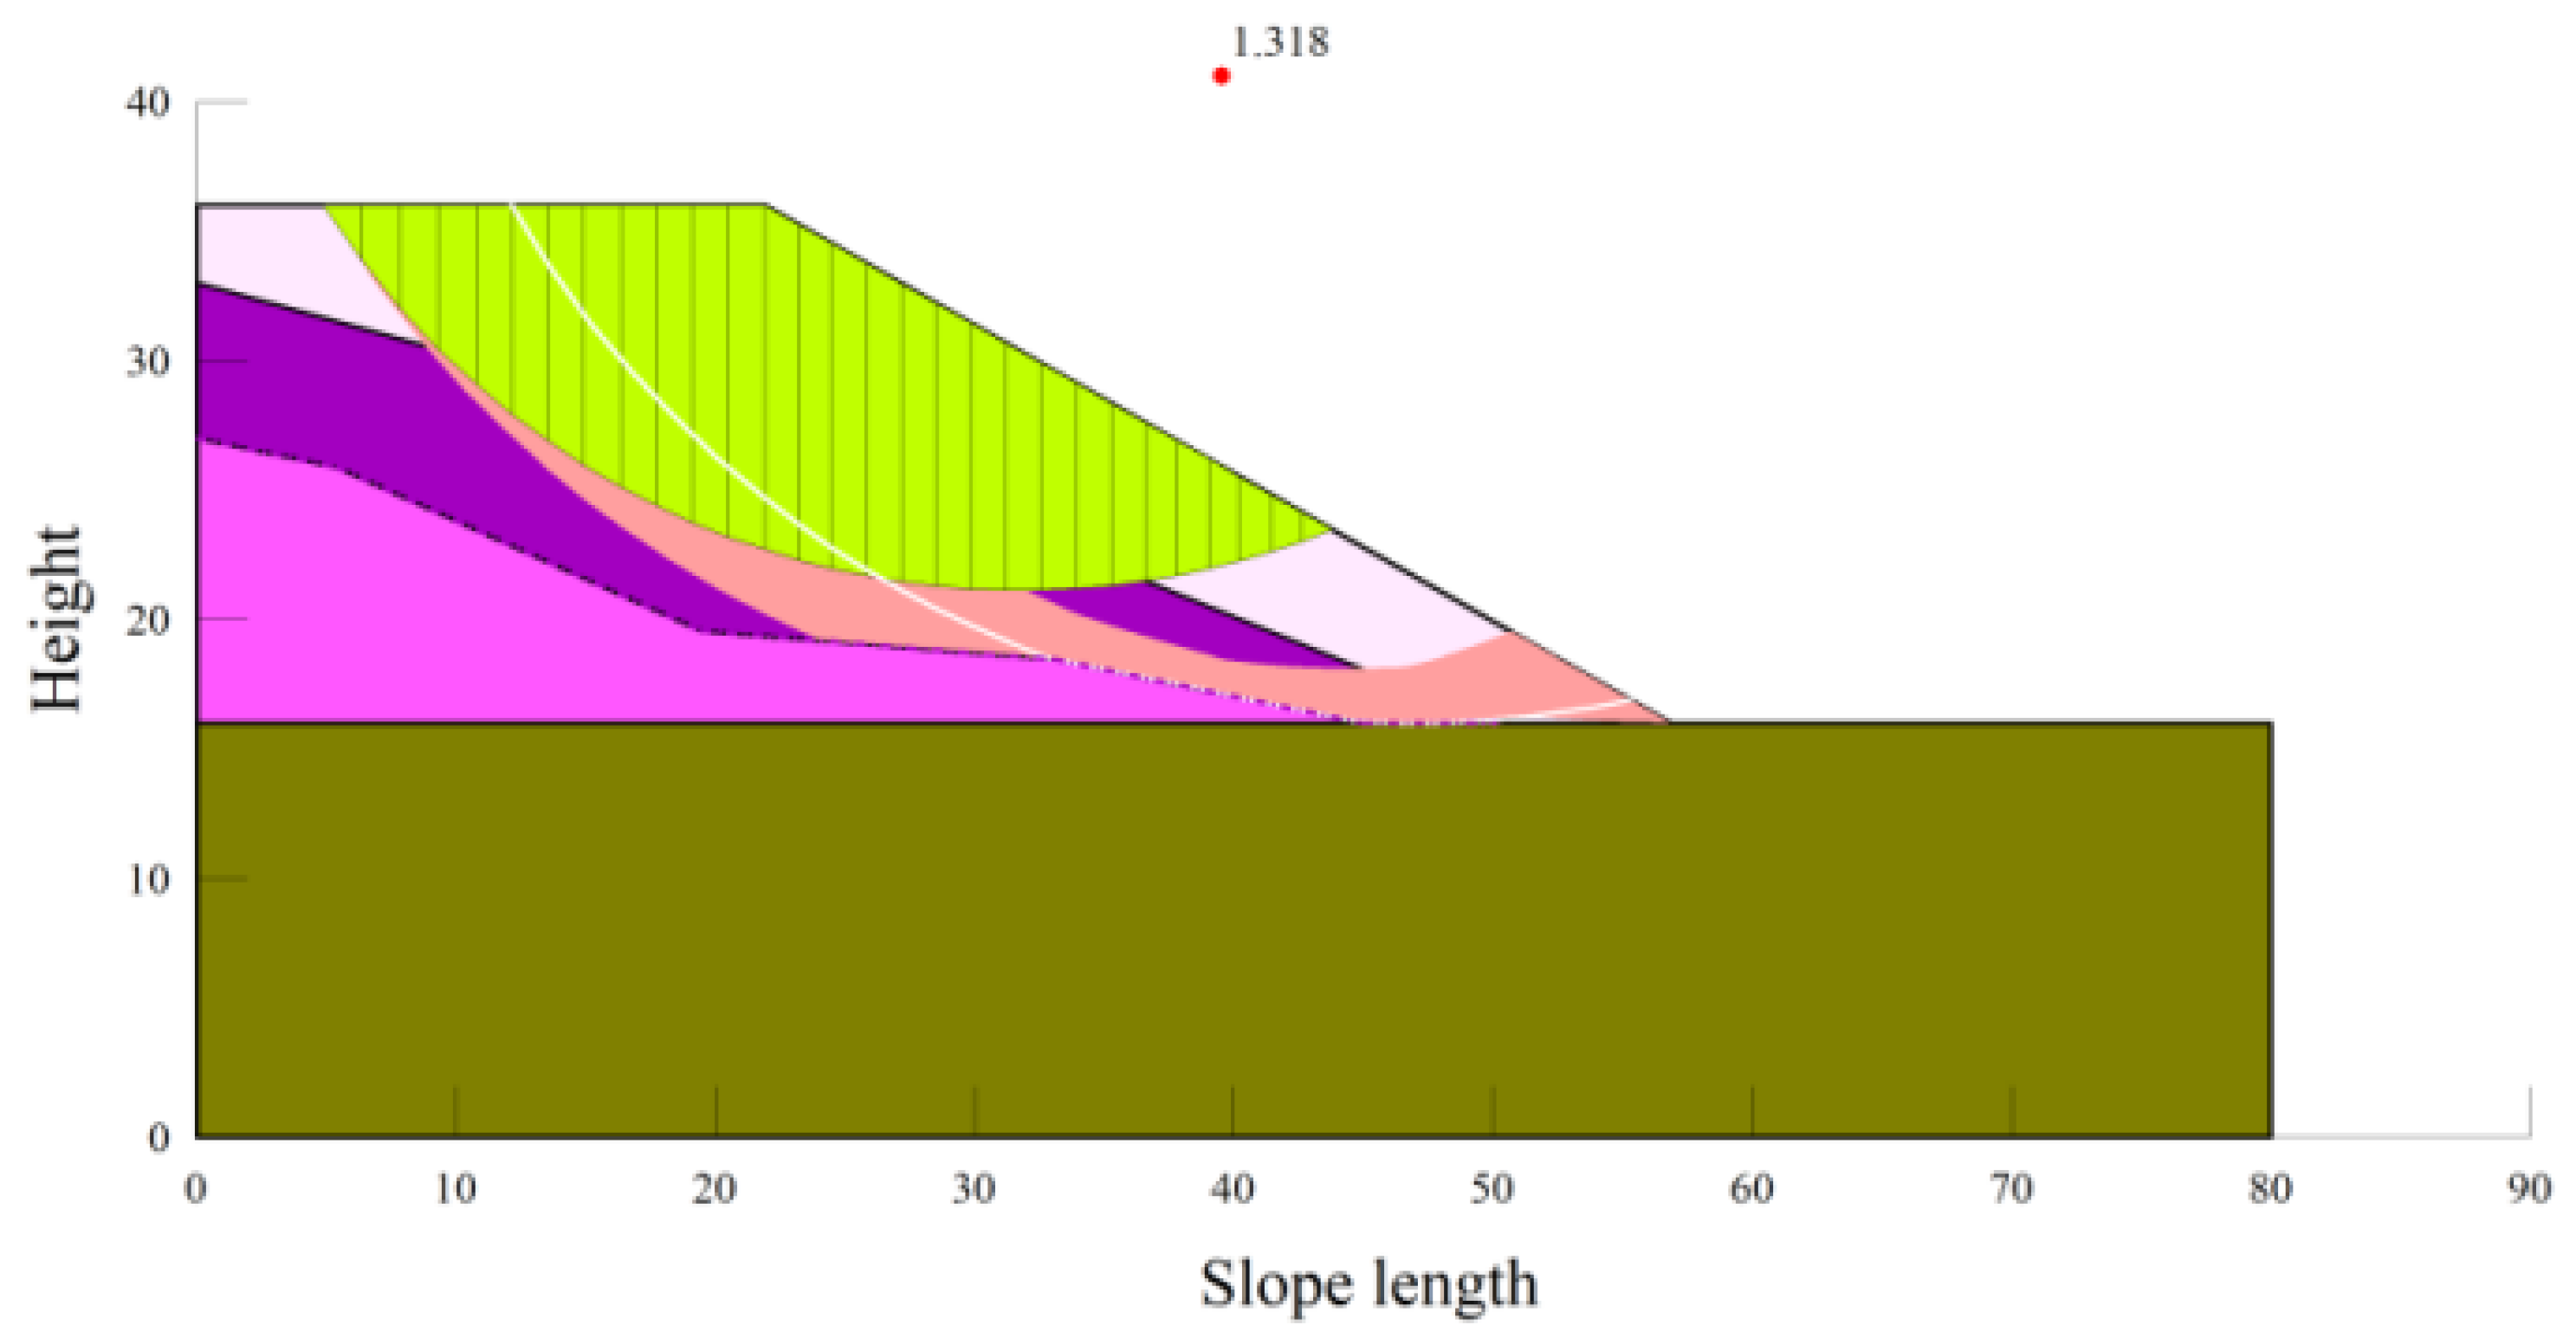
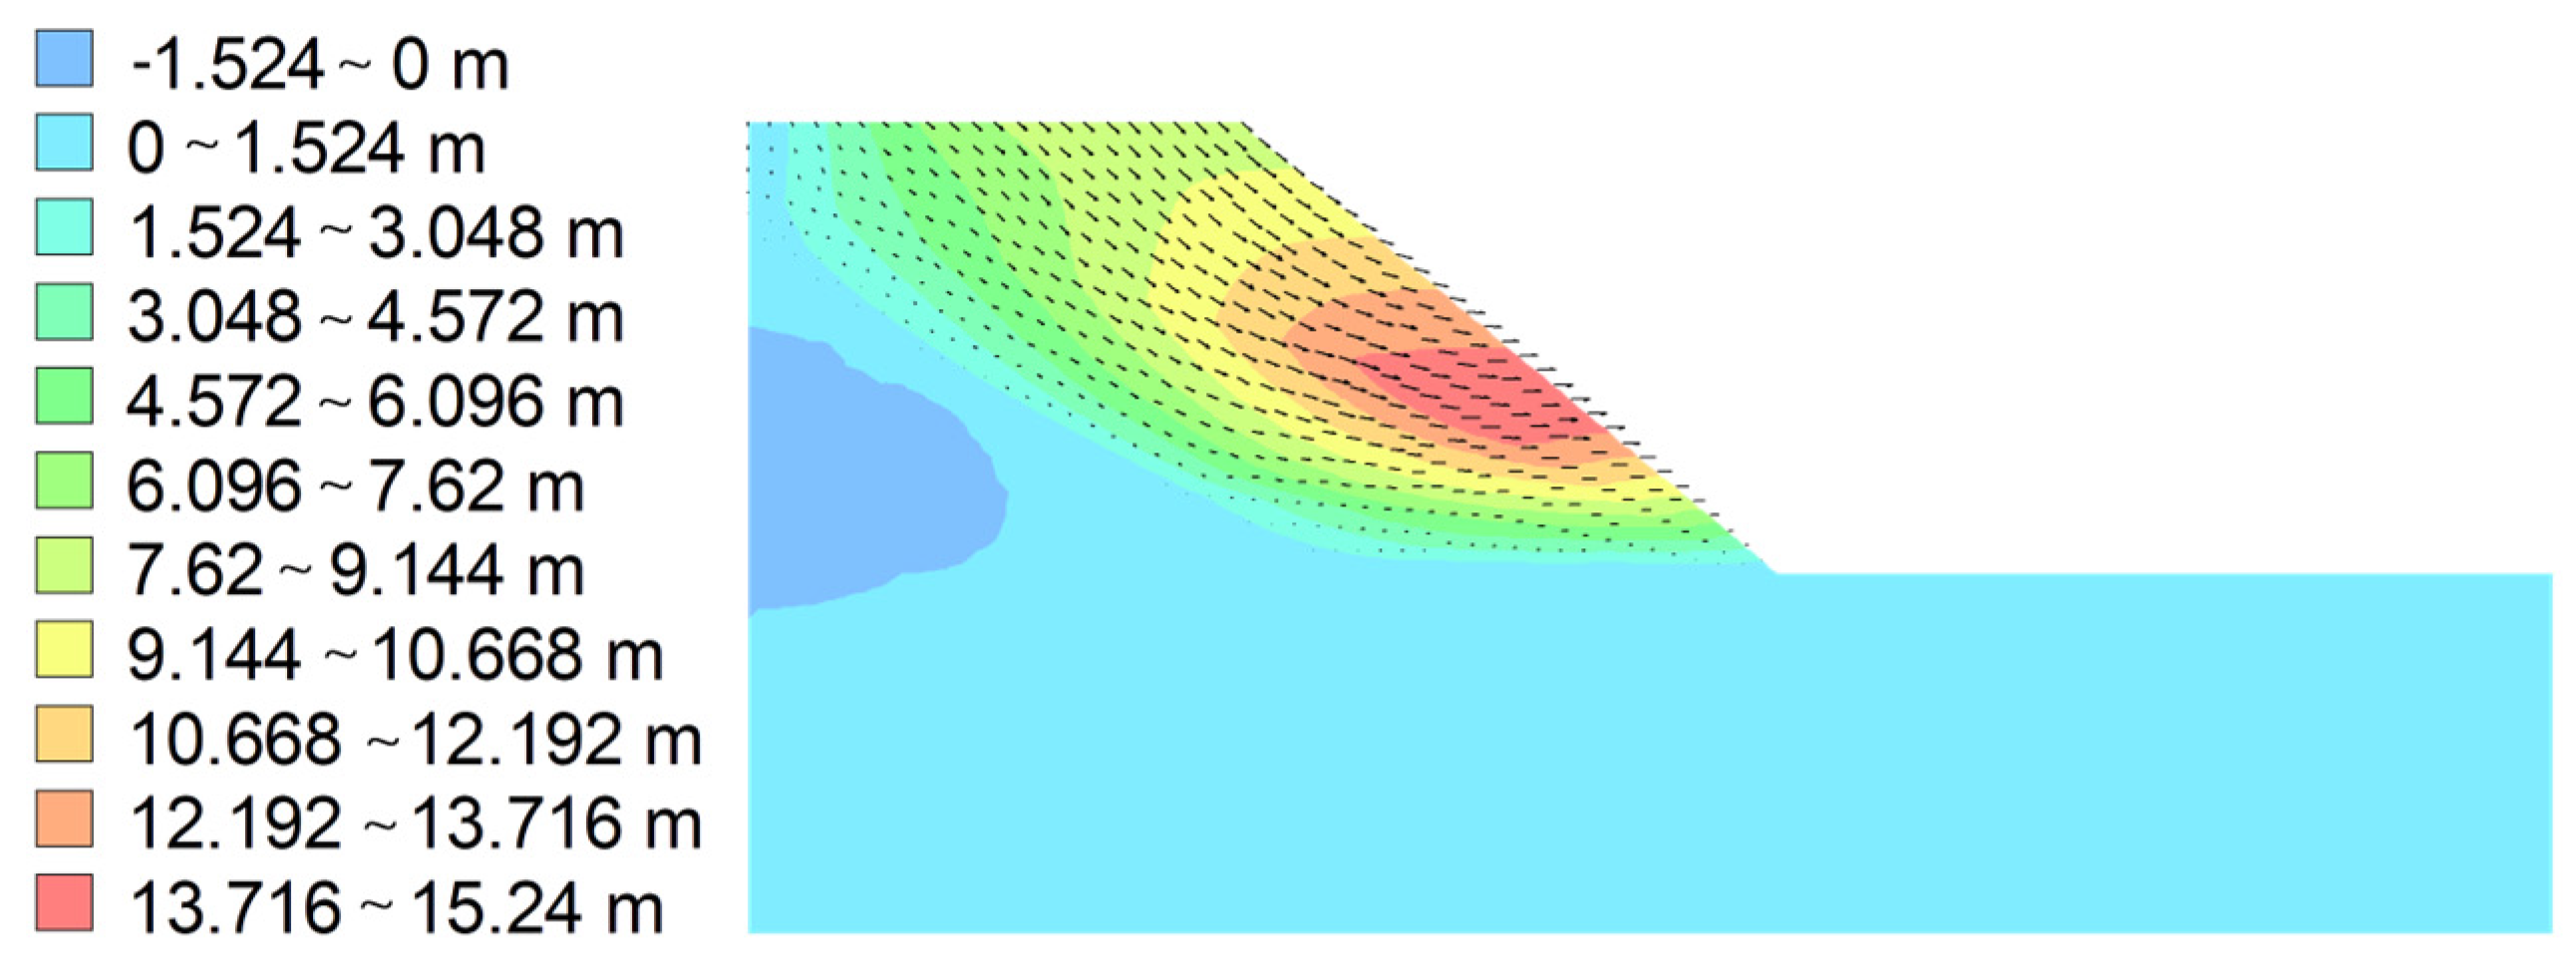
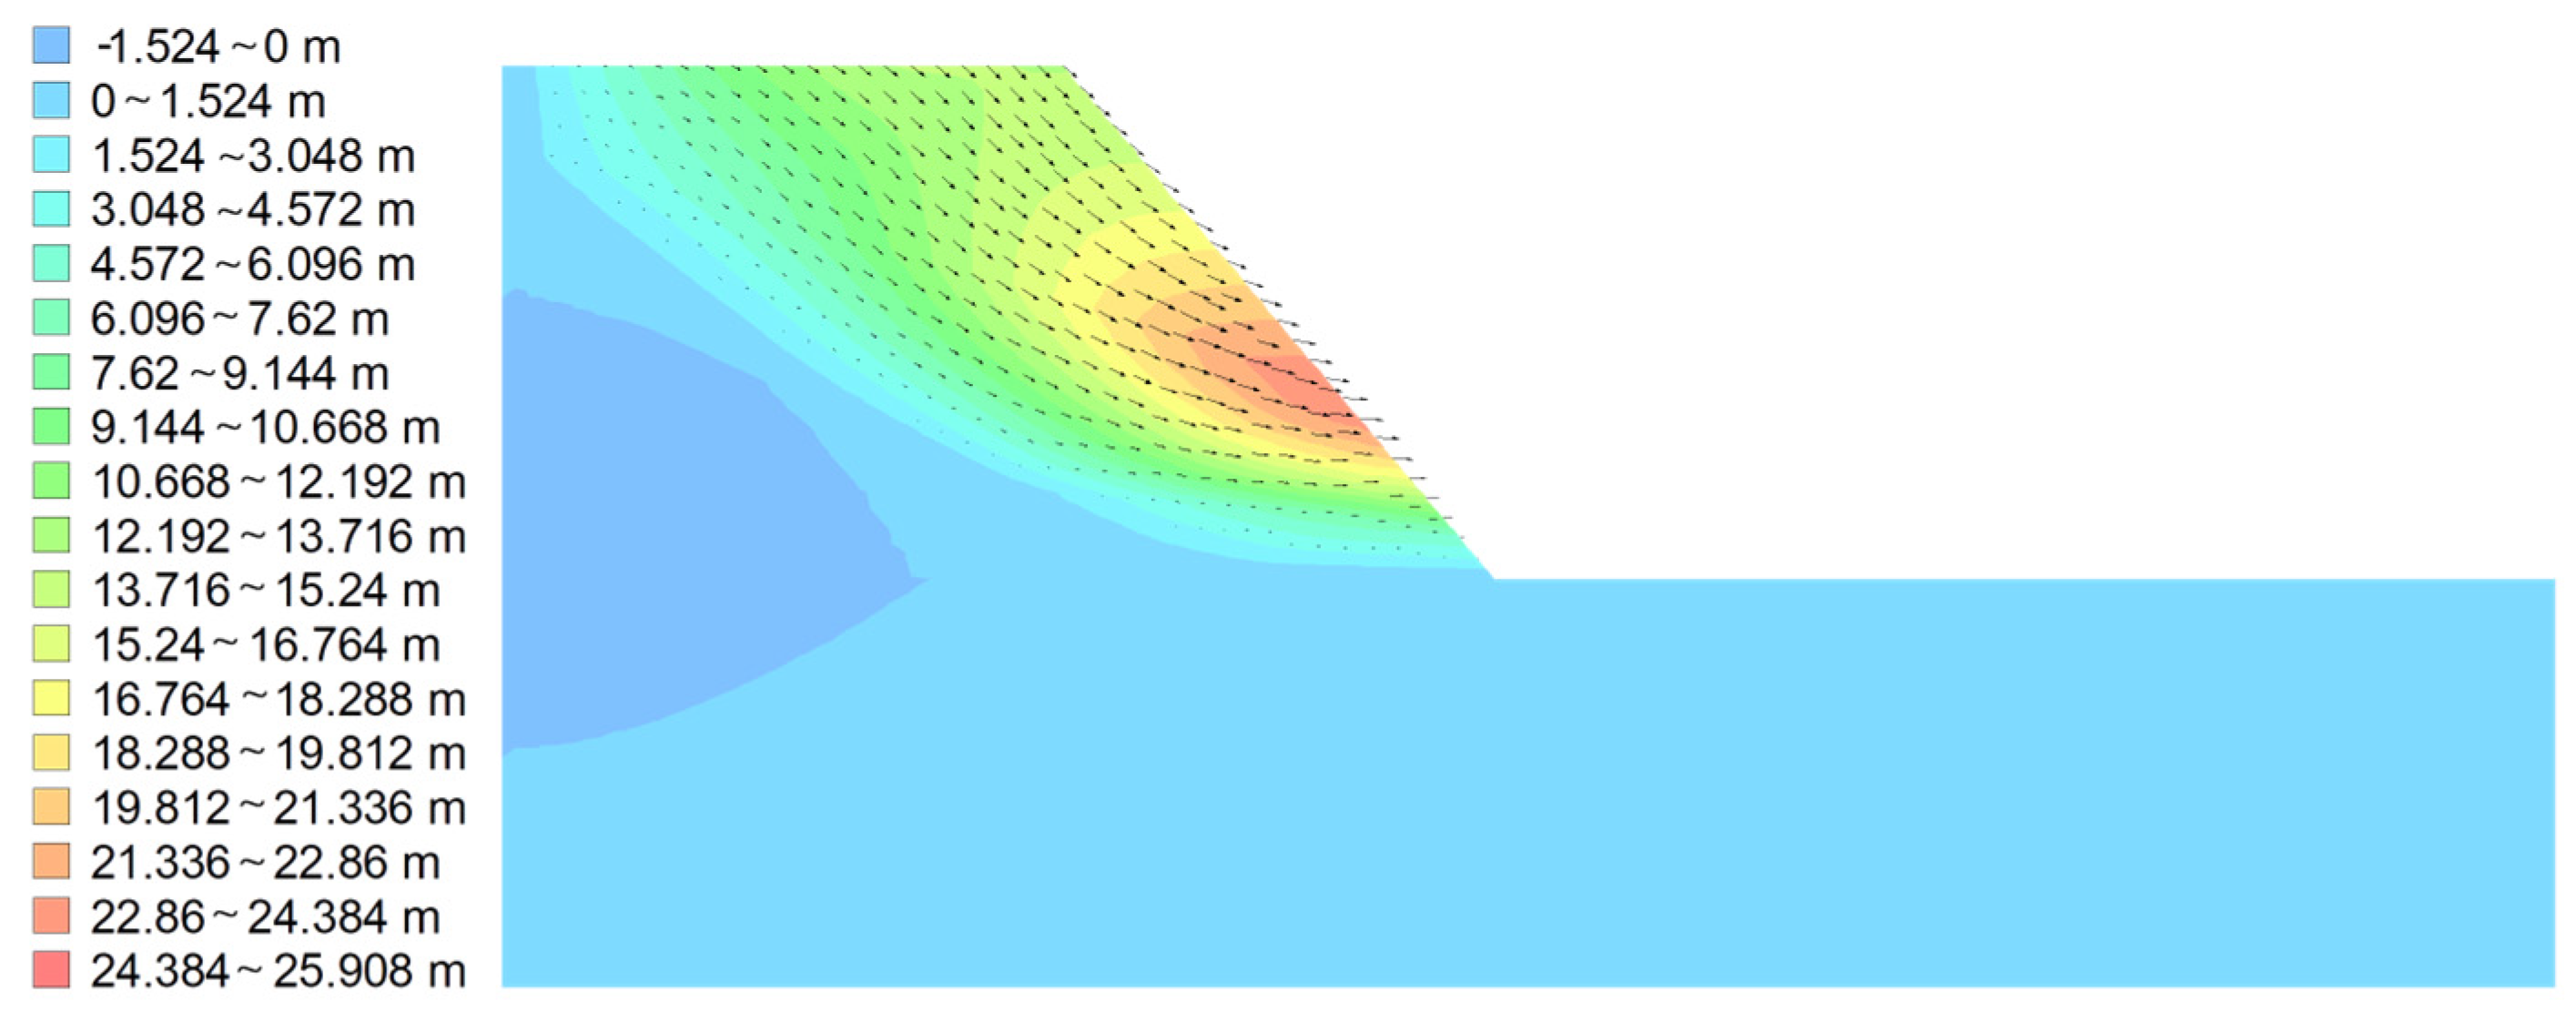
The safety coefficients of high fill slopes with slope angles of 30°, 40°, and 50° under a maximum daily rainfall of 220 mm are determined to be 1.318, 1.025, and 0.950, respectively. With the increase in slope angle, there is a corresponding decrease in the safety coefficient by 22.2% and 7.3%. The slope with a 30° angle meets the evaluation requirements for stability and remains in a fundamentally stable state.
(5)
Comprehensive assessment of slope stability indicates overall favorable conditions. On-site investigation suggests that surface and shallow-layer instability may be the primary factors contributing to slope instability. It is advisable to implement measures for slope protection.

Author Contributions

Writing and editing, H.Z.; software, C.Z.; methodology, W.Z.; resources, X.W.; supervision, J.Z. All authors have read and agreed to the published version of the manuscript.

Funding

This research was funded by the National Natural Science Foundation of China (51908176) and the Hebei Provincial Key Laboratory of Meteorological and Ecological Environment (Z-1502). Their support is gratefully acknowledged.

Institutional Review Board Statement

Not applicable.

Informed Consent Statement

Not applicable.

Data Availability Statement

Data are contained within the article.

Conflicts of Interest

The authors declare no conflicts of interests.

References

  1. Bao, H.; Liu, L.; Lan, H.; Peng, J.; Yan, C.; Tang, M.; Guo, G.; Zheng, H. Evolution of High-Filling Loess Slope under Long-Term Seasonal Fluctuation of Groundwater. Catena 2024, 238, 107898. [Google Scholar] [CrossRef]
  2. Yang, Z.; Cheng, X. High Fill Slope Collapse: Stability Evaluation Based on Finite Element Limit Analyses. Transp. Geotech. 2024, 44, 101156. [Google Scholar] [CrossRef]
  3. Mei, Y.; Zhou, D.; Hu, C.; Wang, X.; Zhang, Y.; Xiao, N.; Shi, W. Study on Deformation Characteristics of Loess Ultrahigh-Fill Slope Based on Large-Scale Undisturbed Soil Centrifugal Model Tests. Front. Earth Sci. 2022, 10, 848542. [Google Scholar] [CrossRef]
  4. Park, I.; Kang, C.; Bayat, A. Determination of Geotechnical Parameters for Underground Trenchless Construction Design. Bull. Eng. Geol. Environ. 2023, 82, 9. [Google Scholar] [CrossRef]
  5. Sun, K.; Zhang, L.; Jiang, G.; Yang, K.; Xiao, S. Stability Analysis of High Fill Slope of Laolinchangin Wushan County, Three Gorges Reservoir Area. J. China Three Gorges Univ. (Atural Sci.) 2024, 1–8. [Google Scholar]
  6. Zhu, Y.; Zhuang, J.; Zhao, Y. Failure Process of High-Loess-Filled-Slopes (HLFSs) during Precipitation under Different Mitigation Measures. Appl. Sci. 2024, 14, 419. [Google Scholar] [CrossRef]
  7. Zhang, Z.; Sheng, Q.; Song, D.; Fu, X.; Zhou, Y.; Huang, J. Stability Evaluation of the High Fill Deposit Slope Subjected to Rainfall Considering Water Deterioration. Bull. Eng. Geol. Environ. 2023, 82, 68. [Google Scholar] [CrossRef]
  8. Zhao, S.; Zheng, J.; Yang, J. Stability Analysis of Embankment Slope Considering Water Absorption and Softening of Subgrade Expansive Soil. Water 2022, 14, 3528. [Google Scholar] [CrossRef]
  9. Dai, X.; Zhang, J. Comparative Study on Analysis Methods of Slope Stability At a Certain Site. J. Saf. Sci. Technol. 2021, 17, 119–124. [Google Scholar]
  10. He, L.; Qian, J.; Zhao, C.; Li, Z. Study on Stability Analysis Method of High Fill Slope of Wushan Shennv Peak Airport. J. Hefei Univ. Technol. (Nat. Sci.) 2023, 46, 646–651, 703. [Google Scholar]
  11. Zhou, Y.-G.; Meng, D.; Ma, Q.; Huang, B.; Ling, D.-S.; Chen, Y.-M. Centrifuge Modeling of Dynamic Response of High Fill Slope by Using Generalized Scaling Law. Eng. Geol. 2019, 260, 105213. [Google Scholar] [CrossRef]
  12. GB 50021-2001; Ministry of Housing and Urban-Rural Development of the People’s Republic of China. Code for Investigation of Geotechnical Engineering. China Architecture Building Press: Beijing, China, 2009.
  13. GB 50330-2013; Ministry of Housing and Urban-Rural Development of the People’s Republic of China. Technical Code for Building Slope Engineering. China Architecture Building Press: Beijing, China, 2014.
  14. JTG 3430-2020; Ministry of Transport of the People’s Republic of China. Test Methods of Soils for Highway Engineering. China Communications Press: Beijing, China, 2021.
  15. Liu, W.; Yang, N.; Bai, F.; Chang, P. Parameter optimizationof covariance-driven stochastic subspace identification methodbased on sensitivity analysis. Eng. Mech. 2021, 38, 157. [Google Scholar]
  16. Dou, H.-Q.; Xie, S.; Wang, H.; Jane, W.-B. Numerical analysis of seepage characteristics and stability for spheroidal weathered granite-like soil slopes under rainfall conditions. J. Eng. Geol. 2023, 3, 638–649. [Google Scholar] [CrossRef]
Figure 1. Distribution of slope engineering projects.
Applsci 14 07590 g001
Figure 2. Typical high fill slope profile.
Applsci 14 07590 g002
Figure 3. Damage to the slope surface.
Applsci 14 07590 g003
Figure 4. Particle grading curves.
Applsci 14 07590 g004
Figure 5. Compaction test results.
Applsci 14 07590 g005
Figure 6. Three axis sample and three axis test.
Applsci 14 07590 g006
Figure 7. Stress and strain curves under different water content and surrounding pressure.
Applsci 14 07590 g007aApplsci 14 07590 g007b
Figure 8. Internal friction angles and cohesion at different water contents.
Applsci 14 07590 g008
Figure 9. Shear strength values of soil at different water contents.
Applsci 14 07590 g009
Figure 10. Stability analysis modeling.
Applsci 14 07590 g010
Figure 11. The calculation model for the overall stability of the slope profile.
Applsci 14 07590 g011
Figure 12. Overall stability calculation model of slope profile saturation condition.
Applsci 14 07590 g012
Figure 13. Stability calculation model of the filling part under the saturation condition of the slope profile.
Applsci 14 07590 g013
Figure 14. Parametric sensitivity analysis.
Applsci 14 07590 g014
Figure 15. The cohesion varies with the sliding surface distance.
Applsci 14 07590 g015
Figure 16. The shear strength changes with the sliding surface distance.
Applsci 14 07590 g016
Figure 17. The slope calculation model with a slope rate of 30.
Applsci 14 07590 g017
Figure 18. Soil hydraulic characteristic curve for soil.
Applsci 14 07590 g018
Figure 19. Change curve of the permeability coefficient of the soil.
Applsci 14 07590 g019
Figure 20. Curve of rainfall under maximum daily rainfall.
Applsci 14 07590 g020
Figure 21. 30° Overall displacement in the limit state of slope.
Applsci 14 07590 g021
Figure 22. 40° Overall displacement in the limit state of slope.
Applsci 14 07590 g022
Figure 23. 50° Overall displacement in the limit state of slope.
Applsci 14 07590 g023
Table 1. Values of geotechnical parameters.
Slope CompositionSpecific Weight/(kN·m−3)Standard Bearing Strength of Rock and SoilElasticity Modulus/MPaPoisson
NaturalSaturationNaturalSaturation
Internal Friction Angle φ/(°)Cohesion C/(kPa)Internal Friction Angle φ/(°)Cohesion C/(kPa)
Compaction fill soil19.320.519351632150.32
Silty clay18.519.01119101760.30
Clay18.619.1162815268.60.32
Medium wind bedrock26.026.43018030170-0.23
Table 2. Statistical table of rainfall in January to December 2023.
MonthNumber of Consecutive Days of RainfallMaximum Rainfall (mm)
January213.2
February316.4
March249.6
April588.6
May4145.7
June6216
July6164.1
August4113.8
September275.9
October277.2
November150.6
December246.7
Disclaimer/Publisher’s Note: The statements, opinions and data contained in all publications are solely those of the individual author(s) and contributor(s) and not of MDPI and/or the editor(s). MDPI and/or the editor(s) disclaim responsibility for any injury to people or property resulting from any ideas, methods, instructions or products referred to in the content.

