Article

Comparative Study of a Buck DC-DC Converter Controlled by the MPPT (P&O) Algorithm without or with Fuzzy Logic Controller

The Department of Power Engineering and Computer Science, Faculty of Engineering, University “Vasile Alecsandri” of Bacau, 600115 Bacau, Romania
*
Author to whom correspondence should be addressed.
Appl. Sci. 2024, 14(17), 7628; https://doi.org/10.3390/app14177628
Submission received: 18 July 2024 / Revised: 11 August 2024 / Accepted: 26 August 2024 / Published: 29 August 2024
(This article belongs to the Special Issue Trends, Research and Development in DC–DC Power Converters)

Abstract

:
This work presents a comparative study of a step-down converter controlled through the algorithm MPPT Perturb and Observe (P&O) with or without a fuzzy logic controller supplied by a photovoltaic system. This study aimed at increasing the quantity of electric energy taken over from the photovoltaic systems by the load through the DC-DC convertor. To follow up the maximum power point where the transfer is performed from the photovoltaic system to the load at maximum power, the Perturb and Observe (P&O) method was used. Two programs were elaborated in MATLAB-Simulink R2018a to control the buck convertor commanded through the P&O algorithm with or without a fuzzy logic controller. The analysis of the results showed that a higher quantity of energy is transferred from the source to the receptor circuit in the case of the buck convertor controlled through the P&O algorithm with a fuzzy logic controller. The P&O algorithm was implemented on an experimental stand at the Laboratory of Electrical Machinery and Drives of the Engineering Faculty in Bacau, with the help of a program issued in the Arduino IDE programming environment. The analysis of the results showed that for an increase in the power conveyed to the receptor circuit, there will also be an increase in the filling factor of the PWM signal that controls the power transistor in the structure of the DC-DC convertor. The P&O algorithm with a fuzzy logic controller may also be implemented in the DC-DC converters in the structure of the driving systems of electric vehicles.

1. Introduction

DC-DC convertors transform the electric energy supplied by a DC source into DC energy, but of another value, adjustable in any event. These are also known as DC variators because they only modify the amplitude of the DC voltage. Most DC-DC convertors run in forced commutation by using the technique of voltage modification as the modulation of the pulse width (pulse width modulation—PWM). The power circuit of a DC-DC convertor is built with semiconductor elements with controlled commutation such as thyristors, GTO thyristors, bipolar transistors of MOSFET, or IGBT types. The passing in conduction as well as the blocking of the components are defined through the control and are performed at very precise moments. DC-DC convertors find their applicability in building the supply sources through commutation, in interconnecting the regenerable sources, and in electric drives with DC motors. Based on the ratio between the input and output voltage, DC-DC convertors can be defined in the following categories:
-
STEP-DOWN converters or serial converters (BUCK converters), where the output voltage is lower than the input voltage or at most equal;
-
STEP-UP converters or parallel converters (BOOST converters), where the output voltage is higher or at least equal to the input voltage;
-
STEP—DOWN/UP converters or series-parallel converters (BUCK–BOOST converters), where the output voltage can be lower or higher than the input voltage;
-
CUK converters—hybrid converters of boost and buck converters;
-
Bridge-type converters.
The DC-DC buck type can be controlled based on the P&O algorithm in order to run at the maximum power point to transfer a higher quantity of energy from the DC source to the receptor circuit [1,2,3]. In order to enhance the energy transfer from a DC source to the receptor circuit, fuzzy logic controllers are used to control the DC-DC convertors [4,5,6,7,8]. The control of the buck DC-DC converter by means of the algorithm of control through slipping with the input LC filter is presented in [9,10]. The control of the DC-DC converter to run at the maximum power point can also be performed based on the method of observation of the adaptive perturbation [11]. The MPPT algorithm, performed through the methods CF-P&O-INC, is also used as a strategy of energy management for distributed photovoltaic systems [12]. The use of the red-tailed hawk algorithm for the MPPT algorithm with a single sensor for a photovoltaic system is presented in [13]. Ref. [14] presents a study for improving the design of control systems with a fuzzy logic controller (FLC) of the fuel sources with a membrane to follow the maximum power point (MPPT). An analysis of the modeling, design, and implementation of DC-DC converters was presented in Ref. [15]. DC-DC converters controlled through the MPPT algorithm and neuronal networks have also been used on electrical vehicles with combustion cells [16]. The remote diagnosis and control of a DC-DC converter used for photovoltaic systems were presented in [17], while the use of the control algorithm MPPT for DC-DC converters under partial conditions of shadowing on the photovoltaic panels is presented in Ref. [18].

1.1. Literature Review

In Ref. [19], a comparative study was presented for following up the maximum power point by two methods: Perturb and Observe (P&O) and incremental conduction. Two programs were issued in the MATLAB-Simulink programming environment, and the results were compared for a photovoltaic system that supplied a resistive consumer by means of a buck-type DC-DC converter. Better results were obtained for various values of the solar radiation intensity and temperature in the case of using the incremental conduction method. Nineteen methods of following the maximum power point taken over from the specialty literature were analyzed in Ref. [20], and the advantages and disadvantages of each method were presented in the shape of a table. The photovoltaic system supplied an AC motor through a DC-DC Boost converter and a three-phase invertor. Another study on the usage of the methods to follow-up the maximum power point (Perturb and Observe and the incremental conductance) for controlling a photovoltaic system with two types of converters, namely a DC-DC buck converter and DC-DC boost converter, were presented in Ref. [21].
The current trends are based on the use of artificial intelligence (AI) to extract a high quantity of power from photovoltaic systems. A study on the use of conventional MPPT methods and intelligent MPPT methods was presented in Ref. [22], where a high efficiency of photovoltaic system usage was obtained in the case of the intelligent MPPT methods such as FLC (fuzzy logic controller), ANN (artificial neural network), and ANFIS (artificial neural-fuzzy inference system) algorithm. The disadvantages of these methods are the complexity of implementation, longer response times, and higher manufacture costs, and the article also mentions that hybrid MPPT methods are more efficient.

1.2. Contributions to the Work Achievement

This work presents a comparative study of a step-down converter controlled through the MPPT algorithm Perturb and Observe (P&O) with or without a fuzzy logic controller, supplied from a photovoltaic panel. This study aimed at increasing the energy quantity taken over from the photovoltaic panels by the load through the DC-DC converter. The authors chose the simplest variant for the MPPT algorithm—Perturb and Observe—and made a comparison to the intelligent MPPT algorithm with a fuzzy logic controller. A better efficiency of the use of photovoltaic systems will be obtained, as per this study, in the case of using the MPPT algorithm with a fuzzy logic controller. At the beginning of Section 2, the design elements of the buck-type step-down DC-DC converter are presented. At the maximum power point, the transfer is conducted from the photovoltaic system to the load at maximum power. In order to follow up the maximum power point where the maximum power is transferred from the photovoltaic panel to the load, the Perturb and Observe (P&O) method was used. In MATLAB-Simulink, two programs were elaborated to implement and simulate the P&O algorithm with or without a fuzzy logic controller. A prototype was also built for the buck-type DC-DC converter at the Electrical Machinery and Drives Laboratory of the Engineering Faculty in Bacău. To implement the Perturb and Observe MPPT algorithm, a program was issued in the programming environment Arduino IDE. The parameters of the DC-DC converter elements were determined based of the relations presented in the next paragraph.

2. Materials and Methods

2.1. Design Elements of the Step-Down Converter

The electric diagram of a step-down converter is presented in Figure 1. The design data imposed for the design of a step-down converter were as follows: input voltage U e n t = 36.97 V D.C., output voltage U o u t = 24 V D.C., intensity of the load current   I n = 3 A, switching frequency F S W = 100 KHz, power P = 400 W, and yield η = 0.95 . The duty factor D for the PWM control signal of the power transistor in the buck converter circuit was determined with the relation:
D = U o u t U e n t = 24 36.97 = 0.65 = 65 %

2.1.1. Calculation of the Filtering Inductance

To calculate the value of the inductance L, a real value of the ripple current Δ I L must be chosen. If a very low value is chosen for Δ I L , the value of inductance L will be relatively high, and this will require the use of a large coil; if a very high value is chosen for Δ I L , then the blocking current of the transistor power will be great. To avoid these unwanted effects, the value of the ripple current equal to 30% of the load current was chosen.
  Δ I L   = 0.3   I o u t = 0.3 · 3 = 0.90   A
The value of the filtering inductance is given by:
L = U e n t U o u t Δ I L D 1 F S W = ( 36.97 24 ) 0.90 · 0.65 · 1 100,000 = 93.6   μ H

2.1.2. Condenser Calculation

To calculate the capacity of the output capacitor C, the following quantities were defined as follows: the ripple voltage Δ U = 50   mV and E S R = 0.03   Ω . Δ T will be given by the ratio between D and the switching frequency F S W .
Δ T = D F S W = 0.65 100 , 000 = 6.5 · 10 6   s
The capacitance of the output capacitor C is determined with the relation:
C = Δ I L Δ T Δ U ( Δ I L E S R ) = 0.9 6.5 10 6 0.05 ( 0.9 0.03 ) = 254.34   μ F

2.1.3. Calculation of Load Resistance

The load resistance is determined with the relationship:
R = U o u t I o u t = 24 3 = 8   Ω
For the practical implementation of the DC-DC buck converter from Section 4, the following elements were used: inductance = 93.6 μH, capacitor C = 330   μF, and load resistance R = 8   Ω .

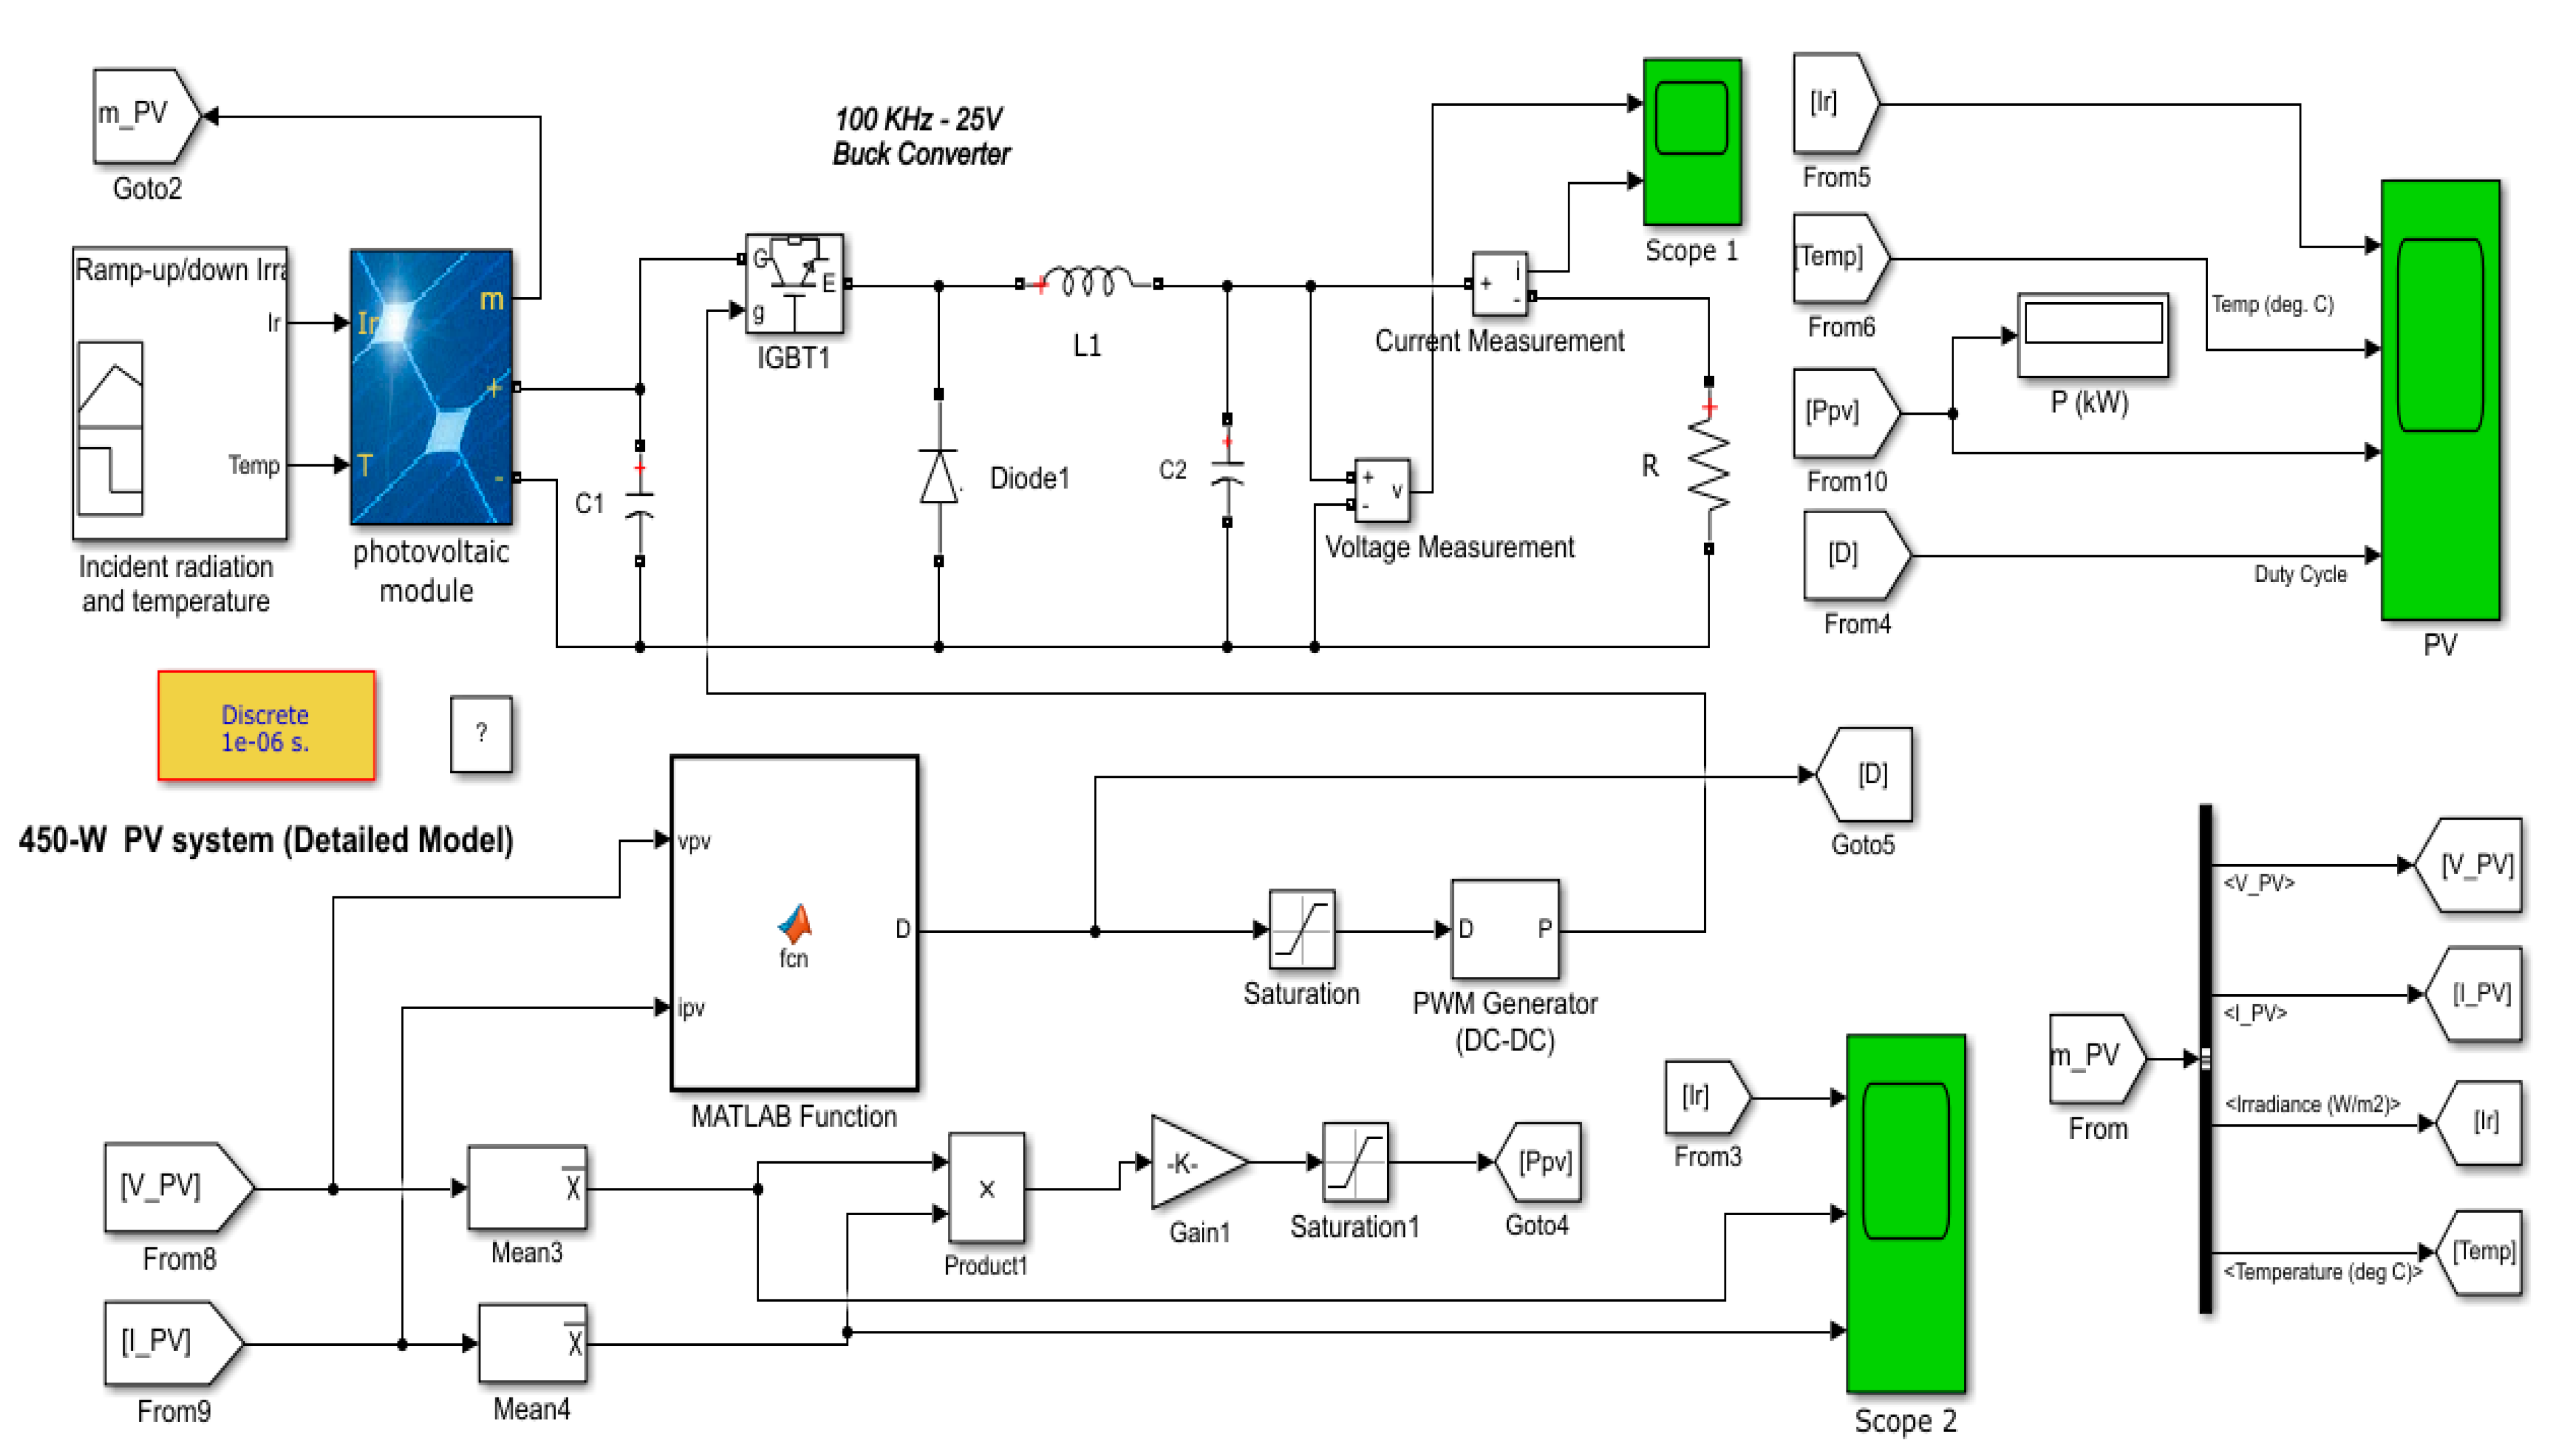
2.2. Elaborating the Models in MATLAB-Simulink DC-DC Buck Converter

2.2.1. Control Algorithms of the DC-DC Converters for Following Up the Maximum Power Point

Photovoltaic systems can provide a maximum power to a load or into an electrical network at a unique running point, named the MPP—maximum power point. The geometric location of this point has a nonlinear variation with the solar radiation incident on the photovoltaic cell and its temperature. Thus, for the photovoltaic system to run at the MPP, a follow-up regulator will be needed for the MPPT. When the ratio between the power derivate and the derivate of the voltage of the photovoltaic system ( d P F V / d V F V ) is equal to zero, the maximum power point (MPP) will be reached. Practically, to reach the maximum power point while running, the voltage of the photovoltaic system V F V has to be adjusted so that it increases when the slope   ( d P F V / d V F V )   is positive, and decreases when the slope ( d P F V / d V F V ) is negative. The adjustment law of a regulator that follows up the continuous extraction of the maximum power is given by the relation [23]:
V o p t = k G d P F V d V F V   d t   k G Δ P F V Δ V F V   d t  
where V o p t is the optimal voltage at maximum power, k G is a proportionality constant of amplification, and d P F V and d V F V are the power and voltage variations between two running points. The block diagram of the implementation of the control algorithm MPPT including the adjustment of the voltage V F V   is presented in Figure 2 [23].
The MPPT algorithm may be implemented on a DC-DC converter connected between a photovoltaic system and a consumer (load or electric network), as shown in Figure 3, to adjust the voltage (or current intensity) on the output of the photovoltaic system, so that the maximum power available is extracted.
Most frequently, the MPPT algorithms Perturb and Observe (P&O) and incremental conductance (IncCond) are used. In the case of these two algorithms, the voltage of the photovoltaic system is adjusted in order to follow up the maximum power point being established, which represents the voltage on the maximum power point (MPP) by moving the current running point of the photovoltaic system along the P–V diagram as follows: on the left side of the maximum power point MPP if d P / d V > 0 , and on the right side of the maximum power point MPP if d P / d V < 0 . The coordinates of the maximum power point for the photovoltaic system result from the P = f(U) diagram are as follows: P m a x = 448.7 W, V m a x = 29.6 V (Figure 4).

2.2.2. Perturb and Observe (P&O) Algorithm

The P&O algorithm was used on a wide scale on the MPPT regulators of the photovoltaic systems due to its simple structure and the low number of measured parameters required. The diagram of the P&O algorithm is shown in Figure 5. The P&O algorithm was based on following up the output power of the photovoltaic system FV and its perturbations through the variation in the running voltage or current intensity of the photovoltaic system FV. According to the algorithm, the reference voltage or current intensity will be continuously incremented or decremented, respectively, based on the previous value of the power until the maximum power point MPP is reached.
If the output power increases, the perturbation is performed in the correct direction. If not, the next perturbation will be in the opposite direction. Usually, the operation voltage used by the DC-DC converter will oscillate around the MPP (maximum power point) value. The power variation is compared to the voltage or current intensity variation between two sequent samplings in order to observe the closeness to the maximum power point MPP:
  • d P / d V = 0   ( d P / d I = 0 ), at the maximum power point MPP;
  • d P / d V > 0 ( d P / d I < 0 ), on the left side of the maximum power point MPP;
  • d P / d V < 0 ( d P / d I > 0 ), on the right side of the maximum power point MPP.
Another method of tracking the maximum power point is the incremental conductance method. A comparison between the performances obtained by the two methods will be presented in another paper.

2.2.3. Incremental Conductance Algorithm

The incremental conductance algorithm is directly based on the power variations. The output voltage and current of the photovoltaic system FV are used in order to calculate the conductance and incremental conductance. The ratio between the power derivate and the voltage derivate is given by the relation [19,23]:
d P d V = d ( V I ) d V = I d V d V + V d I d V = I + V d I d V
To find the maximum power point (MPP), the following conditions need to be fulfilled [19,23]:
d P d V = 0 I + V d I d V = 0 I V = d I d V
where the instant conductance is given by the ratio I / V , and the incremental conductance (instantaneous change in conductance) is given by the ratio d I / d V . The comparison of these two amounts shows on which side of the maximum power point MPP the photovoltaic system FV is currently running. The analysis of the derivates presented below will allow us to determine whether the photovoltaic system FV is running at the maximum power point MPP or far away from this [19].
d I d V > 0   f o r   V < V m p p d I d V = 0   f o r   V = V m p p d I d V < 0   f o r   V > V m p p
The diagram in Figure 6 presents the running principle of the incremental conductance algorithm. This algorithm is simple, easy to implement, and features a very high follow-up efficiency. In the case of several ideal conditions, it is able to establish whether the current running point is on the maximum power point MPP or not, but when measured, the running point might oscillate around the maximum power point MPP. The incremental conductance algorithm provides a better guidance on the direction of the maximum power point motion, and lower oscillations result than in the case of the Perturb and Observe (P&O) algorithm; instead, it requires more intense calculations. Nevertheless, a micro-controller such as the Atmega 328 was included on the development board. Arduino Uno can easily provide the needed calculations for a photovoltaic system FV by using the incremental conductance algorithm and may supply the synchronizing signals for the high resolution pulse-width modulation (PWM) needed to control the DC-DC converter.

2.3. Design of the Fuzzy Logic Controller

The structure of the fuzzy logic controller is shown in Figure 7. The input variables are the error signal and the error derivate. The error signal is the signal at the output of the algorithm that follows up the maximum power point MPP. The basis of rules used in the case of this controller is shown at Table 1.
The rule base for the fuzzy logic regulator was made according to Table 1. To create the rule base, the following operators were used: if, and, and then. NB—high negative, NM—medium negative, NS—small negative, ZE—zero, PS—small positive, PM—medium positive, PB—large positive. Examples of rules are:
(1)
If (E(K) is NM) and (dE(k) is NB), then (u(k) is ZE);
(2)
If (E(K) is PB) and (dE(k) is NS), then (u(k) is PB).
For the design of the fuzzy logic controller, the max–min inference method was used for the input variables [24]. To determine the output variable from the logical fuzzy controller, the center of gravity method was used for defuzzification [24].

2.4. Model in MATLAB-Simulink of the Buck DC-DC Converter Controlled through the Perturb and Observe (P&O) Algorithm without a Fuzzy Logic Controller

The block diagram of the model elaborated in MATLAB–Simulink for the photovoltaic system connected to a resistive load by means of the step-down converter is presented in Figure 8. The main components of the model are: (a) photovoltaic module, (b) source of solar radiation incident on the solar panels and the ambient temperature, (c) DC-DC buck converter, (d) resistive load, (e) measurement blocks, and (f) control subsystem of the P&O algorithm. The photovoltaic system was composed of two photovoltaic panels in parallel connection. The running point at the maximum power of the photovoltaic system was determined as shown at Figure 4 and had the following coordinates: P m a x = 448.7 : W, U m a x = 29.6   V. For the source of solar radiation incident on the solar panels and ambient temperature, the variation characteristics were imposed for a simulation time equal to 2 s. To implement the Perturb and Observe algorithm, the MATLAB function and function were used, for which a program was issued in the programming environment C++. The Perturb and Observe (P&O) algorithm is an MPPT conventional algorithm.

2.5. Model in MATLAB-Simulink of the Buck DC-DC Converter Controlled through the Perturb and Observe (P&O) Algorithm with a Fuzzy Logic Controller

The model shown in Figure 9 has received the fuzzy logic controller between the implementing block of the P&O algorithm and the pulse generating block PWM to control the power transistor in the structure of the buck-type step-down converter. The input data in this controller are the error and error derivate. The basis of rules was elaborated within the Simulink program. For de-fuzzying, the method of the gravity center was used. The Perturb and Observe algorithm with a fuzzy logic controller is an intelligent hybrid MPPT algorithm.

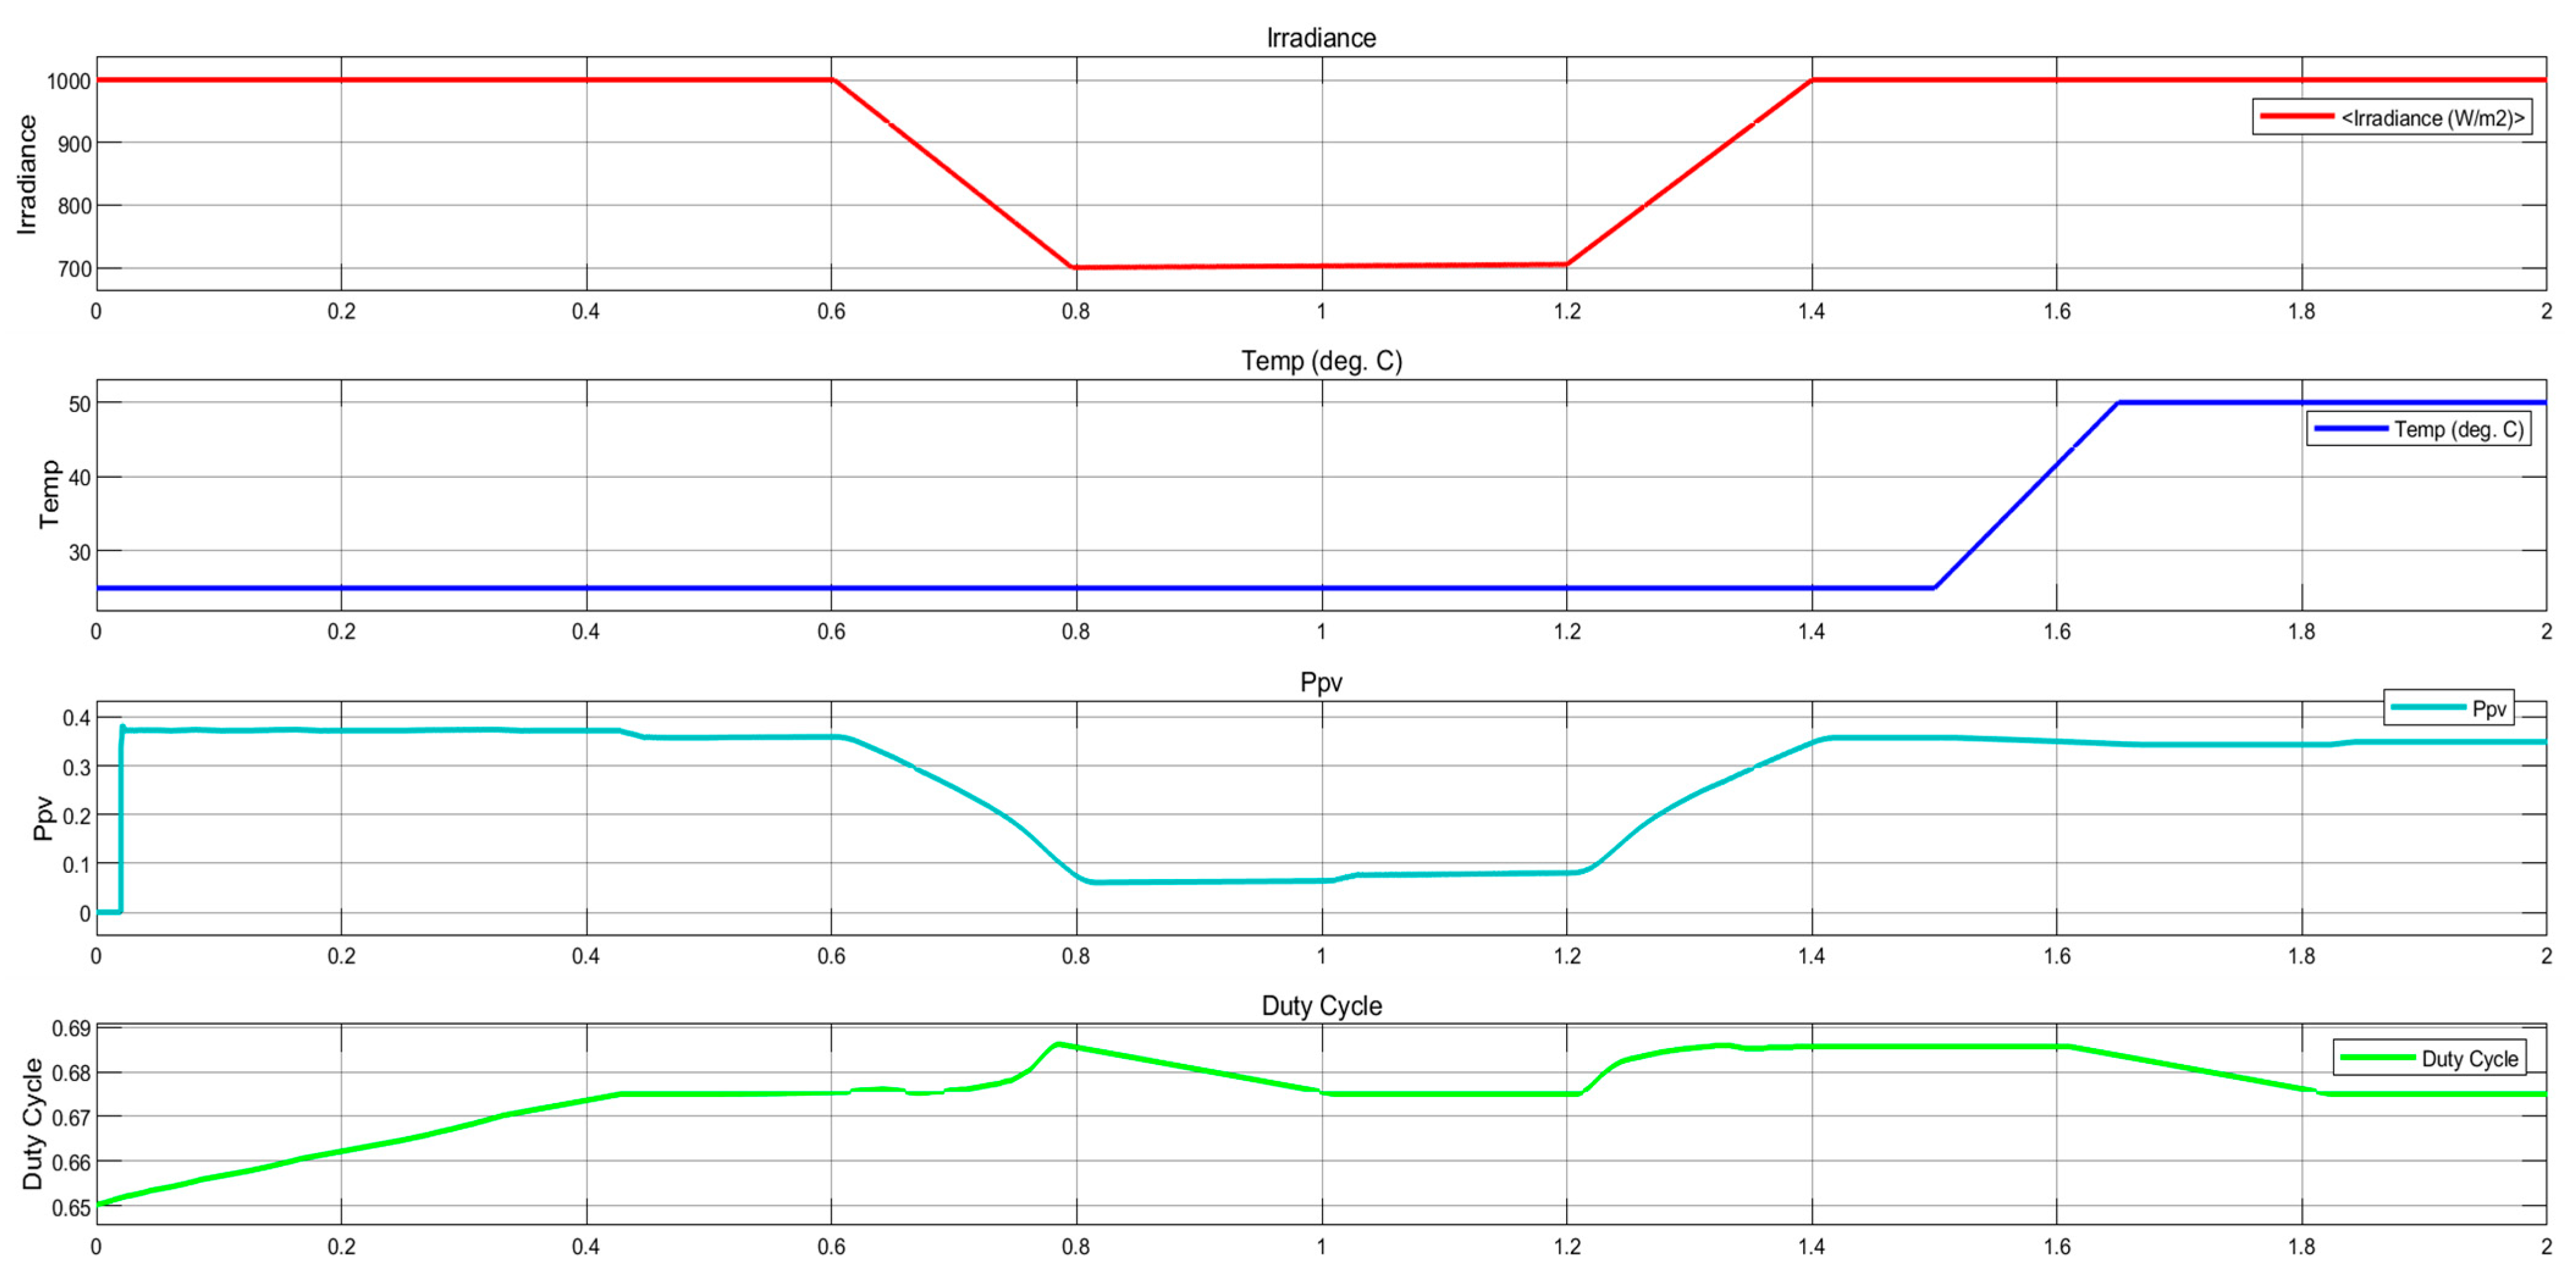
3. Simulation Results

Figure 10 shows the results of the simulation for the buck DC-DC converter controlled through the P&O algorithm without a fuzzy logic controller.
Figure 11 shows the results of the simulation for the buck DC-DC converter controlled through the P&O algorithm with a fuzzy logic controller.

Comparative Study between the Simulation Results Obtained through the Two Methods

The analysis of the power variation diagrams produced by the photovoltaic panels in the case of the two models provides the following values in function of the intensity of the incident solar radiation and ambient temperature, as shown in Table 2.
From the results of the analysis, it may be seen that better results were obtained in the case of the DC-DC converter controlled through the P&O algorithm with a fuzzy logic controller. Thus, the hypothesis as per Ref. [22], stating that a high efficiency will be obtained on photovoltaic systems when they are controlled through the MPPT intelligent hybrid algorithm, was confirmed.

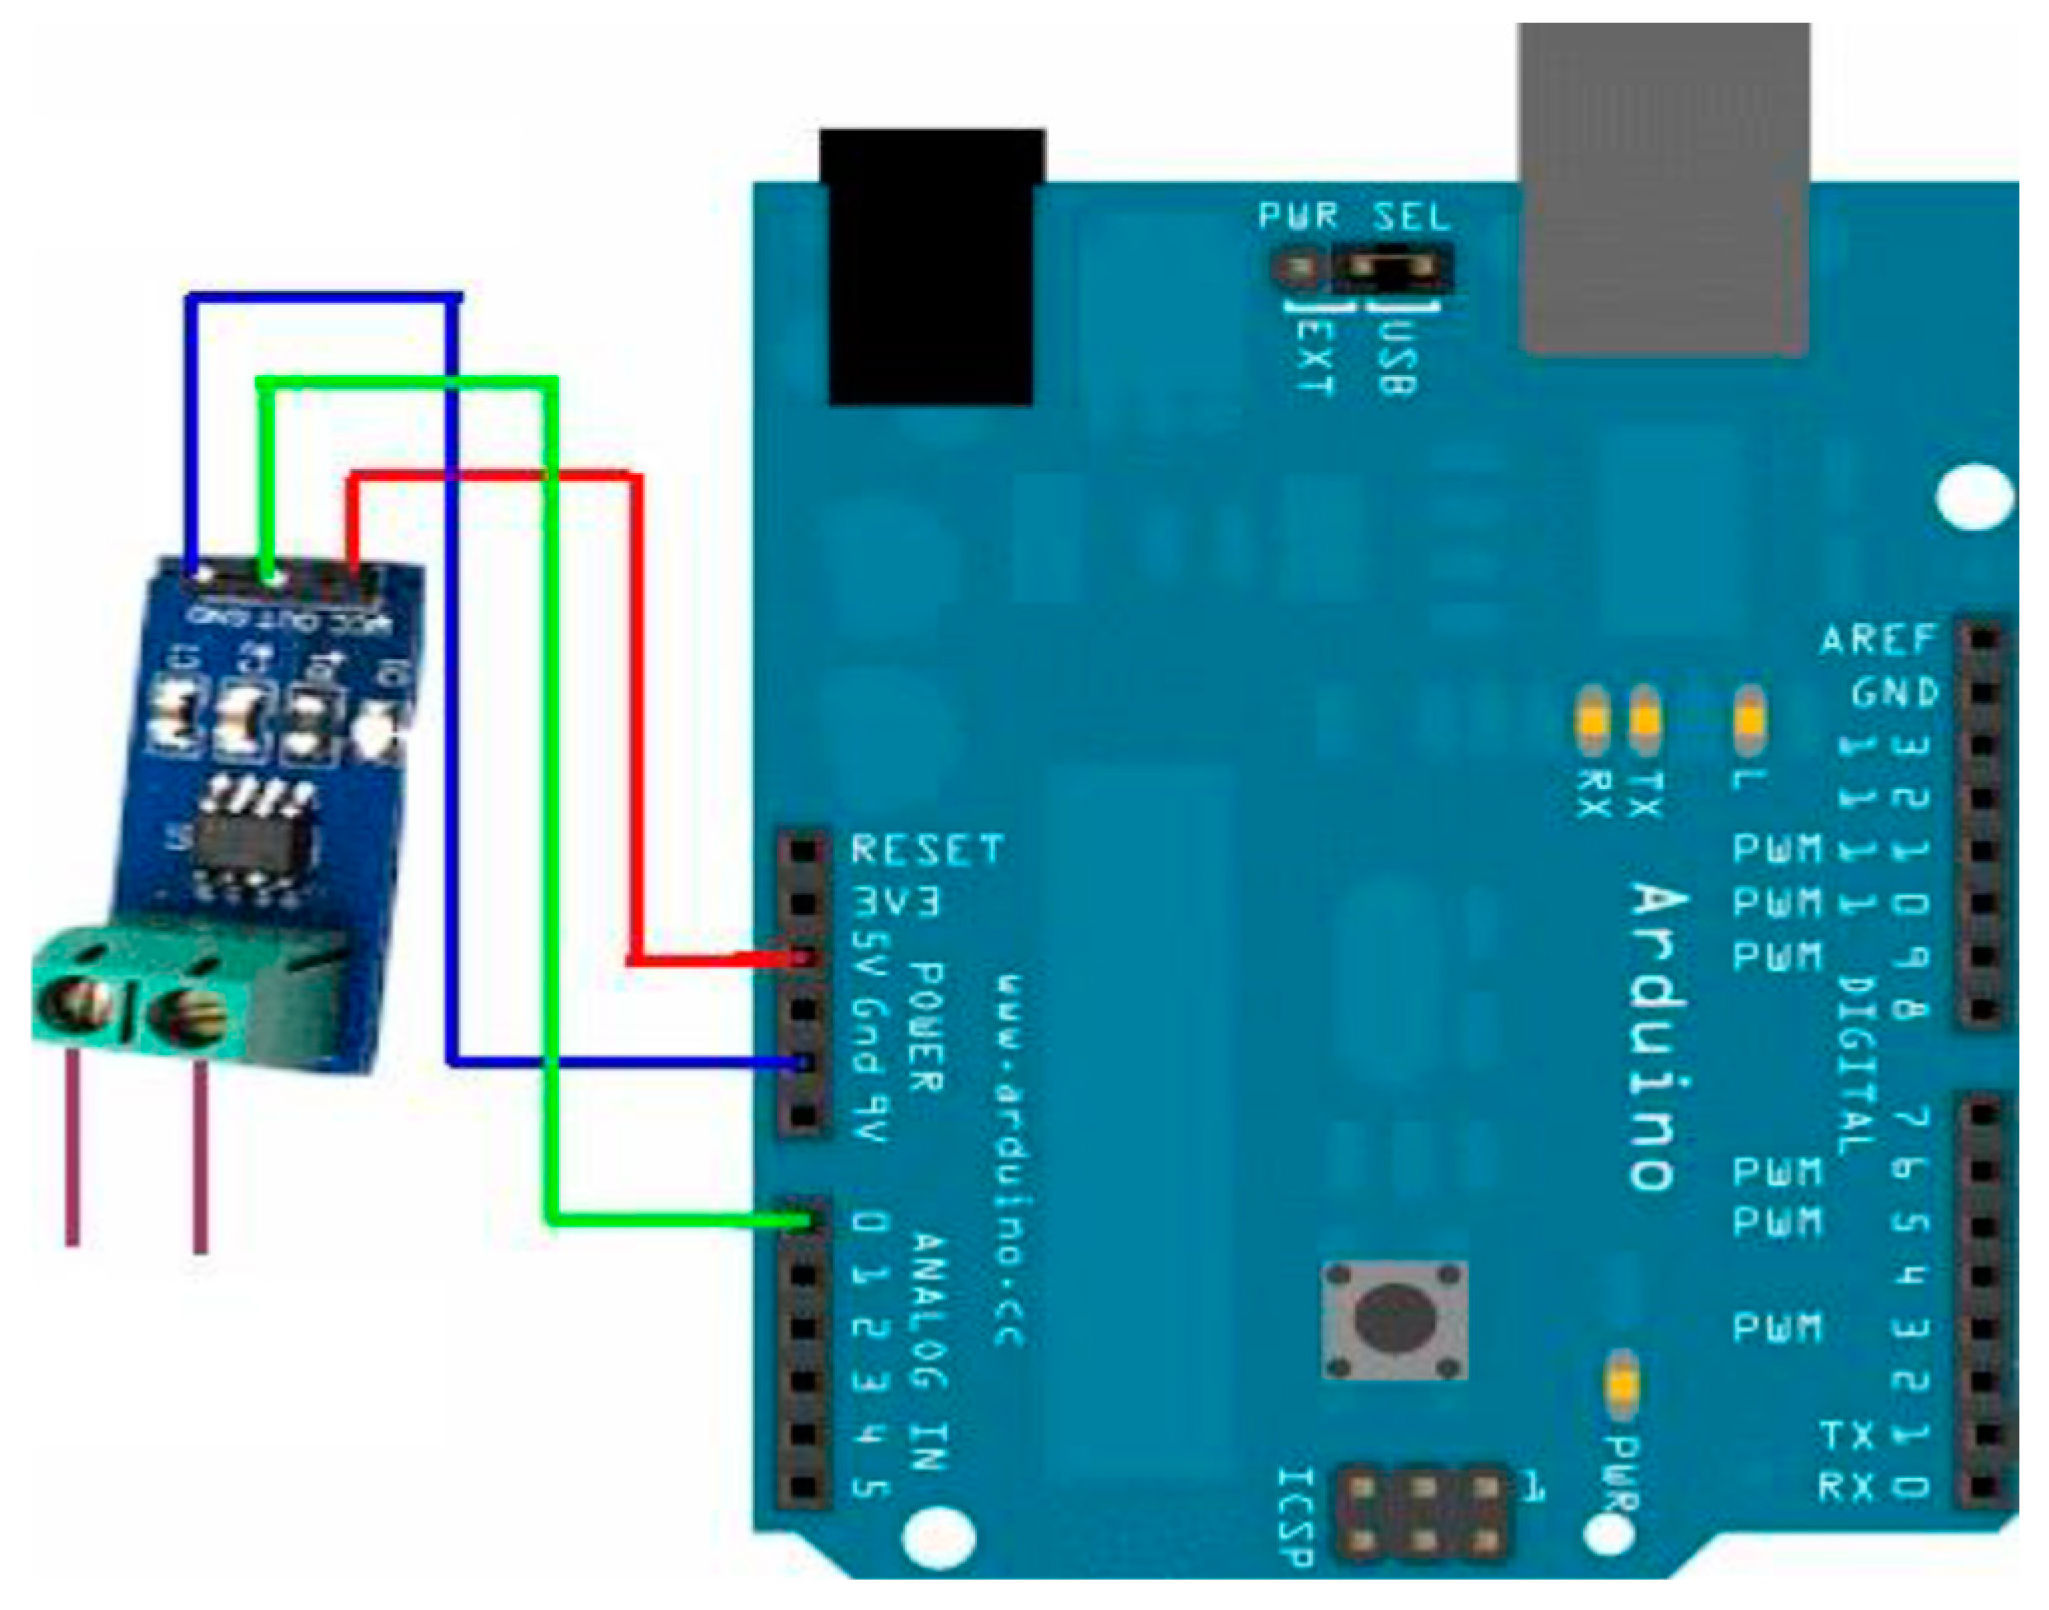
4. Construction of the DC-DC Buck-Type Converter Controlled through the Development Board Arduino Uno

The DC-DC buck-type converter, controlled through the Perturb and Observe algorithm (P&O) with the help of the development board Arduino Uno, was built at the Laboratory of Electrical Machinery and Drives of the Engineering Faculty in Bacau. Its electric diagram is shown in Figure 12. To control the buck DC-DC converter through the MPPT (P&O) algorithm with a fuzzy logic controller, the development board Compact Rio was used, and the related results will be presented in another work. This work presents the experimental results obtained through the implementation of the MPPT–P&O algorithm by means of a program issued in the Arduino-IDE programming environment. The experimental results were then compared to the results obtained through simulation. Further to the related analysis, the following conclusions can be made. The components of the buck-type converter such as power transistor, inductance L, condenser C etc. have been well-established. As such, the buck-type DC-DC converter being designed may be used within photovoltaic systems, be it to control the charging of the accumulator batteries or to control the supply with the electricity of various consumers. A picture of the DC-DC converter is shown in Figure 13.
The current encoder presented in Figure 14 has the following characteristics.
The supply pins GND and Vcc of the sensor are connected to the corresponding Arduino pins. The pin Out is connected to the analog pin A0. The sensor will be connected in series to the circuit whose current intensity needs to be measured. The current can be calculated with the help of a certain formula that is presented below. The analog–digital converter will supply the value VAL that is equal to:
VAL = 1024 V CC V in ,
where V i n = V c c 2 + S I ,
S is the sensibility, which is 0.1 A/V for the sensor ASC712-20A,
VAL = 1024 V CC ( V c c 2 + S I )         = >           VAL = 1024 5 ( 5 2 + 0.1 I ) ,
where I = 0.0488 (VAL-512).
The voltage encoder/sensor shown in Figure 15 has the following characteristics:
Based on the Ohm law, the input current will be:
  I in = U ent R 1 + R 2 = U out R 1
Out of this formula, the ratio between R1 and R2 has to be determined, so that Uent and Uout have concrete values.
  R 2 = R 1 U ent U out U out
In this case, we used a voltage divider instead of a voltage sensor of 25 V. The Arduino can only measure the voltage rates within the interval 0–5 V, thus Uin = 25 V and Uout = 5 V (maximum). The ratio between resistors can be calculated from the above formula, and the result will be:
R 2 = 4 R 1   and   U ent = U out R 1 + R 2 R 1
Instead of two suitable resistors (not available), one resistor of 100 kOhm was used as R1, and two resistors, series connected, one of 100 kOhm and one of 300 kOhm, whose sum, equal to 400 kOhm, corresponded to R2. The voltage on the panel was equal to 5 multiplied by the voltage read on the Arduino, Uent = 5 ∗ Uout. Figure 16 shows the diagram of the voltage divider connected to the Arduino.
To the Arduino, the resistor R1 was parallel connected through the pins GND and the analog pin A1. The characteristics of the development board Arduino Uno are presented in Refs. [25,26]. A program was issued in the programming environment Arduino IDE to control the buck DC-DC converter through the P&O algorithm. Monitoring of the voltage at the output of the buck DC-DC converter as well as the power delivered to the receptor circuit was conducted. Figure 17 presents an image of the use of the buck-type DC-DC converter for supplying a resistive load from a DC source of adjustable voltage controlled through the current intensity instead of the photovoltaic system controlled through the development board Arduino Uno. The program for the development board Arduino Uno was saved in the flash memory of the microcontroller Atmega 328. The related results are presented in Table 3. The power increase in the photovoltaic system was carried out by increasing the voltage of the DC source through adjustable voltage controlled through the current intensity. The value of the filling factor PWM (duty-cycles) was read via the computer screen by accessing the option “serial monitor”.
The components of the experimental stand were as follows: 1—DC source of adjustable voltage controlled through the current intensity, 2—DC-DC buck converter, 3—Arduino Uno development board, 4—current sensor, 5—breadboard, 6—load resistance, 7—ammeter, 8—digital multimeter. The direct voltage source was of the DC-Power Supply HY 3005D type, voltage (0–30) Vdc, current (0–5) A. The load resistance was a variable power resistance in the range (0–30) Ω at a current I = 5 A. The ammeter measured a maximum current of 5 A. The multimeter was used to measure the voltage in the range (0–200) Vdc.
The values for the voltage Usource and current intensity Isource were read off the display of the voltage source and the values for the Uload and current intensity for Iload were read off the multimeter and ammeter. It was noticed that with an increase in the power supplied by the photovoltaic system, there will be an increase in the filling factor of the PWM signal used to control the power transistor in the structure of the buck DC-DC converter. Power values can be determined with the relationships:
P s o u r c e = U s o u r c e · I s o u r c e
P l o a d = U l o a d · I l o a d  

5. Conclusions and Perspectives

This work presented a study concerning the control of a buck-type DC-DC converter by using the MPPT Perturb and Observe (P&O) algorithm without a fuzzy logic controller and with a fuzzy logic controller. The innovation in this work consists of introducing a fuzzy logic controller to the model issued in Simulink for the Perturb and Observe algorithm with the help of a function from the MATLAB program. Two programs in MATLAB-Simulink were created to control the buck converter through the P&O algorithm without and with a fuzzy logic controller. The analysis of the experimental results led to the conclusion that a higher quantity of energy is transferred from the source to the receptor circuit in the case of the buck DC-DC controller controlled through the P&O algorithm with a fuzzy logic controller. The Perturb and Observe (P&O) algorithm was implemented on an experimental stand built at the Laboratory of Electrical Machinery and Drives of the Engineering Faculty in Bacau, with the help of a program issued in the programming environment Arduino IDE. The analysis of the results showed that upon an increase in the power transmitted to the receptor circuit by the photovoltaic system, there was an increase in the filling factor of the PWM signal that controlled the power transistor that equips the DC-DC convertor. The P&O algorithm with a fuzzy logic controller can also be implemented on DC-DC converters in the structure of the driving systems of electric vehicles.

Author Contributions

Conceptualization, P.L.; Methodology, P.L.; Software, I.V.B.; Validation, P.L.; Formal analysis, I.V.B.; Investigation, P.L.; Resources, G.C.; Data curation, G.C.; Writing—original draft, P.L.; Writing—review & editing, P.L.; Visualization, S.G.V.; Supervision, P.L.; Project administration, G.C.; Funding acquisition, S.G.V. All authors have read and agreed to the published version of the manuscript.

Funding

This paper is financed by the University “Vasile Alecsandri” of Bacau from the funds allocated for research.

Institutional Review Board Statement

Not applicable.

Informed Consent Statement

Not applicable.

Data Availability Statement

The original contributions presented in the study are included in the article, further inquiries can be directed to the corresponding author.

Conflicts of Interest

The authors declare no conflict of interest.

References

  1. Rebhi, M.; Benatillah, A.; Sellam, M.; Kadri, B. Comparative Study of MPPT Controllers for PV System Implemented in the South-west of Algeria. Energy Procedia 2013, 36, 142–153. [Google Scholar] [CrossRef]
  2. Boubii, C.; El Kafazi, I.; Bannari, R.; El Bhiri, B. A comparative study between optimization algorithms of MPPT algorithms (P&O and incremental conductance method). In Proceedings of the International Conference on Digital Technologies and Applications 2023, Fez, Morocco, 29 April 2023. [Google Scholar] [CrossRef]
  3. Ba, A.; Ehssein, C.O.; Mahmoud, M.E.M.O.M.; Hamdoun, O.; Elhassen, A. Comparative Study of Different DC/DC Power Converter for Optimal PV System Using MPPT (P&O) Method. Appl. Sol. Energy 2018, 54, 235–245. [Google Scholar] [CrossRef]
  4. Meryem, B.; Ahmed, N.; Ahmed, F. Photovoltaic Power Control Using Fuzzy Logic and Fuzzy Logic Type 2 MPPT Algorithms and Buck Converter. Available online: https://core.ac.uk/download/pdf/228834734.pdf (accessed on 17 July 2024).
  5. Balta, G.; Altin, N.; Nasiri, A. Interval Type-2 Fuzzy-Logic-Based Constant Switching Frequency Control of a Sliding-Mode-Controlled DC–DC Boost Converter. Appl. Sci. 2023, 13, 3239. [Google Scholar] [CrossRef]
  6. Agoub, R.A.A.; Hançerlioğullari, A.; Rahebi, J.; Lopez-Guede, J.M. Battery Charge Control in Solar Photovoltaic Systems Based on Fuzzy Logic and Jellyfish Optimization Algorithm. Appl. Sci. 2023, 13, 11409. [Google Scholar] [CrossRef]
  7. Baždarić, R.; Ćelić, J.; Vončina, D. Compensation of the Current Imbalance of an Interleaved DC–DC Buck Converter, Sensorless Online Solution Based on Offline Fuzzy Identification and Post-Linearization. Energies 2023, 16, 4836. [Google Scholar] [CrossRef]
  8. Narwat, L.K.; Dhillon, J. Design and Operation of Fuzzy Logic Based MPPT Controller under Uncertain Condition. J. Phys. Conf. Ser. 2021, 1854, 012035. [Google Scholar] [CrossRef]
  9. Tatar, K.; Chudzik, P.; Leśniewski, P. Sliding Mode Control of Buck DC–DC Converter with LC Input Filter. Energies 2023, 16, 6983. [Google Scholar] [CrossRef]
  10. Monsalve-Rueda, M.; Candelo-Becerra, J.E.; Hoyos, F.E. A Comparative Study between MPC Algorithm and P&O and IncCond the Optimization Algorithms of MPPT Algorithms. Energies 2024, 17, 2701. [Google Scholar] [CrossRef]
  11. Li, X.; He, Y.; Li, M. Research on Photovoltaic Maximum Power Point Tracking Control Based on Improved Tuna Swarm Algorithm and Adaptive Perturbation Observation Method. Energies 2024, 17, 2985. [Google Scholar] [CrossRef]
  12. Cai, Z.; Tang, Y.; Guo, W.; Chen, T.; Zheng, H.; Qin, T. Energy Management Strategy for Distributed Photovoltaic 5G Base Station DC Microgrid Integrated with the CF-P&O-INC MPPT Algorithm. Energies 2024, 17, 3258. [Google Scholar] [CrossRef]
  13. Almousa, M.T.; Gomaa, M.R.; Ghasemi, M.; Louzazni, M. Single-Sensor Global MPPT for PV System Interconnected with DC Link Using Recent Red-Tailed Hawk Algorithm. Energies 2024, 17, 3391. [Google Scholar] [CrossRef]
  14. Rezk, H.; Aly, M.; Ghoniem, R.M. Robust Fuzzy Logic MPPT Using Gradient-Based Optimization for PEMFC Power System. Sustainability 2023, 15, 13368. [Google Scholar] [CrossRef]
  15. Khan, M.U.; Murtaza, A.F.; Noman, A.M.; Sher, H.A.; Zafar, M. State-Space Modeling, Design, and Analysis of the dc-dc Converters for PV Application: A Review. Sustainability 2024, 16, 202. [Google Scholar] [CrossRef]
  16. Subbulakshmy, R.; Palanisamy, R.; Alshahrani, S.; Saleel, C.A. Implementation of Non-Isolated High Gain Interleaved DC-DC Converter for Fuel Cell Electric Vehicle Using ANN-Based MPPT Controller. Sustainability 2024, 16, 1335. [Google Scholar] [CrossRef]
  17. El Abbadi, R.; Aatabe, M.; Bouzid, A.E.M. Wireless Diagnosis and Control of DC–DC Converter for Off-Grid Photovoltaic Systems. Sustainability 2024, 16, 3252. [Google Scholar] [CrossRef]
  18. Yilmaz, M. Comparative Analysis of Hybrid Maximum Power Point Tracking Algorithms Using Voltage Scanning and Perturb and Observe Methods for Photovoltaic Systems under Partial Shading Conditions. Sustainability 2024, 16, 4199. [Google Scholar] [CrossRef]
  19. Banu, I.V.; Beniugă, R.; Istrate, M. Comparative Analysis of the Perturb-and-Observe and Incremental Conductance MPPT Methods. In Proceedings of the 8th International Symposium on Advanced Topics in Electrical Engineering, Bucharest, Romania, 23–25 May 2013. [Google Scholar] [CrossRef]
  20. Esram, T.; Chapman, P.L. Comparison of Photovoltaic Array Maximum Power Point Tracking Techniques. IEEE Trans. Energy Convers. 2007, 22, 439–449. [Google Scholar] [CrossRef]
  21. Yadav, A.P.; Thirumaliah, S.; Haritha, G.; Scholar, P.G. Comparison of MPPT Algorithms for DC-DC Converters Based PV Systems. Int. J. Adv. Res. Electr. Electron. Instrum. Eng. 2012, 1, 18–23. [Google Scholar]
  22. Boubaker, O. MPPT techniques for photovoltaic systems: A systematic review in current trends and recent advances in artificial intelligence. Discov. Energy 2023, 3, 9. [Google Scholar] [CrossRef]
  23. Rekioua, D.; Matagne, E. Optimization of Photovoltaic Power Systems, Modelization, Simulation and Control; Springer: Berlin/Heidelberg, Germany, 2012. [Google Scholar]
  24. Sofron, E.; Bizon, N.; Ionita, S.; Raducu, R. Sisteme de Control Fuzzy—Modelare si Proiectare Asistate de Calculator. Available online: https://igsbiera.ebibliophil.ro/mon/sisteme-de-control-fuzzy-modelare-si-proiectare-asistate-de-calculator-tehnologii-avansate-h29yrjz4 (accessed on 26 February 2021).
  25. Available online: https://www.wardsci.com/store/product/23748699/arduino-uno-development-board (accessed on 17 July 2024).
  26. Ismailov, A.S.; Jo‘Rayev, Z.B. Study of arduino microcontroller board. Sci. Educ. Sci. J. 2022, 3, 172–179. [Google Scholar]
Figure 1. Electric diagram of the DC-CD buck converter.
Applsci 14 07628 g001
Figure 2. Control diagram of the MPPT and voltage adjustment V F V .
Applsci 14 07628 g002
Figure 3. Block diagram of the connection of a photovoltaic system to the consumer.
Applsci 14 07628 g003
Figure 4. The coordinates of the maximum power point for the photovoltaic.
Applsci 14 07628 g004
Figure 5. Organigram of Perturb and Observe (P&O MPPT algorithm).
Applsci 14 07628 g005
Figure 6. Organigram of the incremental conductance algorithm.
Applsci 14 07628 g006
Figure 7. Structure of the fuzzy logic controller.
Applsci 14 07628 g007
Figure 8. Block diagram of the model for the P&O algorithm.
Applsci 14 07628 g008
Figure 9. Block diagram of the model for the P&O algorithm with a fuzzy logic controller.
Applsci 14 07628 g009
Figure 10. Simulation results for the DC-DC converter controlled through the P&O algorithm without a fuzzy logic controller.
Applsci 14 07628 g010
Figure 11. Simulation results for the DC-DC converter controlled through the P&O algorithm with a fuzzy logic controller.
Applsci 14 07628 g011
Figure 12. Electrical diagram of the buck-type DC-DC converter.
Applsci 14 07628 g012
Figure 13. Picture of the buck-type DC-DC converter.
Applsci 14 07628 g013
Figure 14. Current encoder/sensor ACS 712.
Applsci 14 07628 g014
Figure 15. Voltage encoder/sensor.
Applsci 14 07628 g015
Figure 16. Diagram of the voltage divider connected to the Arduino.
Applsci 14 07628 g016
Figure 17. Experimental stand for the DC-DC converter.
Applsci 14 07628 g017
Table 1. Basis of rules for the fuzzy logic controller.
dE(k)
NBNMNSZEPSPMPB
E(k)NBZEZEZENBNBNBNB
NMZEZEZENMNMNMNM
NSNSZEZENSNSNSNS
ZENMNSZEZEZEPSPM
PSPMPSPSPSZEZEZE
PMPMPMPMZEZEZEZE
PBPBPBPBZEZEZEZE
Table 2. Results obtained through the simulation.
Solar radiation variation (W/m2)100070010001000
Temperature variation (°C)25254050
Ppv power variation for the P&O model (Kw)0.380.080.350.33
Ppv power variation for the P&O with fuzzy logic controller (Kw)0.470.250.450.43
Table 3. Experimental results obtained for the buck-type DC-DC converter.
Usource (V)25.4026.4027.5028.5029.50
Isource (A)2.092.182.302.422.45
Psource (W)53.0857.5563.2568.9772.27
Uload (V)16.9717.6019.2019.6019.80
Iload (A)2.352.502.602.802.85
Pload (W)39.8844.0049.9254.8856.43
Duty-cycles
(0–255)
121131139143145
Disclaimer/Publisher’s Note: The statements, opinions and data contained in all publications are solely those of the individual author(s) and contributor(s) and not of MDPI and/or the editor(s). MDPI and/or the editor(s) disclaim responsibility for any injury to people or property resulting from any ideas, methods, instructions or products referred to in the content.

