Featured Application
Ice hockey is a very fast and complex team sport. Consequently, it is necessary to develop performance diagnostics further, considering complexity and quality criteria (validity, reliability, practicability). The introduced ice hockey-specific complex test (IHCT) is one of the few tests that meet all criteria. In particular, the continually growing reference database gives the test a unique selling point. The high number of reference data helps coaches and sports scientists in ice hockey practice to interpret and discuss all data quickly and consistently.
Abstract
This real-life data collection aimed to expand an existing reference database regarding an extensively evaluated ice hockey-specific complex test (IHCT). One hundred and thirty-eight third-league professional ice hockey field players (mean ± SD; age: 26.4 ± 5.24 years; forwards: n = 94, defenders: n = 44) were investigated. IHCT data were collected over eight seasons from three third-league teams. The IHCT included parameters for the load (e.g., 10 m and 30 m sprint times, transition and weave agility times with and without a puck, slap and wrist shots on goal) and stress (e.g., lactate, heart rate). The only relevant (p < 0.002, ηp2 ≥ 0.10) difference between forwards and defenders for performance was found for 30 m backward sprint without a puck (p < 0.001, ηp2 = 0.10, d = 0.74). As expected, in this regard, defenders performed better than forwards. Significant differences were also found in 10 m backward sprint without a puck (p = 0.005), weave agility with a puck (p = 0.014), heart rate recovery minute 10 (p = 0.057), and goals after the test (p = 0.041). This study provides expanded position-specific third-league reference data for the IHCT. On this basis, coaches are able to evaluate players’ performance (forwards vs. defenders) and the effect of the training periods. Further research is necessary to extend this database to first- and second-league players in order to enhance the scope of the IHCT.
1. Introduction
Ice hockey is a demanding team sport that is characterized by various athletic and technical components (e.g., linear speed, change of direction (COD), aerobic and anaerobic capacity, strength). The intensive body contact with the opponent is typical for ice hockey, comparable to rugby or football, and underlines the importance of core stability for ice hockey players.
In relation to the entire match duration (3 × 20 min), the player’s effective operational time is 15–25 min [1,2]. The players perform in intervals determined by 30–60 s stints on ice, with different recovery phases between these intensive intermittent actions [3,4]. The number of high-intensity actions (95–100% maximum heart rate) is 25% [5]. In relation to the maximal oxygen uptake from 55 and 60 mL*kg−1*min−1 [6], it is obvious that aerobic capacity is a very important precondition for professional ice hockey players. Montgomery et al. [7] reported position-specific differences in demand and load. Defenders, for example, spent significantly more time skating backwards than forwards (19% vs. 5–6%).
Unfortunately, the complexity of ice hockey is not adequately reflected in performance diagnostics (particularly on ice). Most studies preferred isolated measurements of physical performance parameters [8,9,10,11] or the sole use of off-ice testing. This implicates a major limitation because off-ice testing does not allow for replication of specific biomechanical aspects of on-ice skating [12]. Consequently, on-ice testing is indispensable for a valid evaluation of players, especially in a complex manner. Czeck et al. [11] described the effects of body composition on on-ice performance in male and female players. They used parkours, consisting of sprints, CODs and linear skating, arranged in a complex way (total distance: 148 m). Regrettably, data regarding puck handling or shot performance were not reported in this study, so relations to the body composition could not be quantified.
Numerous other authors [4,6,12] also pointed out the need for on-ice skating tests in order to assess important factors such as speed, agility, and repeated sprint ability as crucial preconditions for a successful match performance. In line with recommendations from Vigh-Larsen et al. [12] and Pelletier et al. [13], the IHCT also implemented the above-mentioned relevant skills and actions (e.g., sprinting and shooting performance, COD). In accordance with Hajek et al. [4], the authors referred to the importance of “specific” ice hockey skills such as shooting and stick handling. Hajek et al. [4] explicitly pointed out the contradiction between the complexity of the sport and the one-dimensionality of performance testing (e.g., straight skating speed as an indicator of overall skating performance). At this point, they also emphasized the relation between test and match performance. Schwesig et al. [14,15] considered this aspect and already proved the validity of IHCT using match performance.
Position-based training is able to provide a competitive advantage that coaches can exploit in a demanding team sport with specific requirements for different positions. However, underlying reference data for the respective player positions is necessary to exploit this. Such reference data can then be used to identify any deficits during the preparation phase and to adapt the training to the individual requirements from an athletic point of view.
Schulze et al. [16] already provided reference data for the IHCT [17,18] based on a first sample of 104 third-league professional ice hockey field players.
The first aim of the study was to significantly extend the reference data to enhance their meaningfulness by player position. The second aim was to provide a valid, practical, and self-explanatory analysis matrix for coaches to enable easier data handling. We hypothesized that the standard deviation of all parameters would decrease. That would be advantageous for the significance of all results and derived findings.
2. Materials and Methods
2.1. Subjects
A total of 347 data sets from third-league players were used for the reevaluation (second evaluation; Figure 1). A large number of players (n = 199) were tested twice or more (range of data sets per player: 1 to 10). In line with Schulze et al. [16], a median analysis was conducted to avoid correlated observations. Consequently, 138 professional (forwards: n = 94; defenders: n = 44) male ice hockey players (mean ± SD; age: 26.4 ± 5.24 years, height: 1.82 ± 0.06 m, body mass: 85.9 ± 8.55 kg) were selected for the statistical analysis.
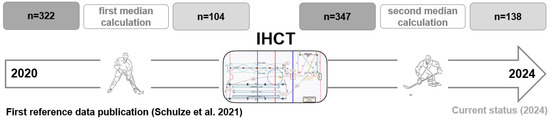
Figure 1.
Reevaluation of the IHCT regarding reference data based on a second median calculation [16].
All players knew that they could withdraw from the project at any time without mentioning reasons. Before the test, all contents, risks as well as advantages were described in detail. Written consent was necessary to participate in the study. For players younger than 18.0 years (n = 1; age range: 17.2–42.1 years), parental/guardian consent was obtained.
The study was approved by the local Ethics Committee of the Martin Luther University Halle-Wittenberg (Reference Number: 2013-13) and conformed to the Declaration of Helsinki [19].
2.2. Study Design and Methodology
The second cross-sectional data collection utilized data from the IHCT over ten seasons (2015–2024) in third-league German ice hockey players (three teams). Solely male field players (forwards and defenders) were investigated. Before the conduction of the IHCT, all players were carefully familiarized with the test-specific details of the IHCT [15]. The following possibilities were used in this context: sketch, instructional video, demonstration on ice. Additionally, we organized the testing process so that players who were familiar with the test were the first to be tested. Moreover, the investigator (R.S.) gave further instructions during the short test breaks (5–10 s) when necessary.
To secure a high level of reliability, all athletes were judged at the same time and they were given the same standardized preparation (nutrition, warm-up, instructions) [14,17]. Schwesig et al. [17] investigated the interrater reliability of the tasks and parameters. They detected no differences for the last skating tasks (weave agility without and with the puck). Only the 10 m backward sprint without a puck displayed a markedly reduced reliability (ICC = 0.54, CV = 9.2%). There was decreased reliability for slap shot 3 before the test, slap shot 1 after the test, and the 10 m sprint with a puck (ICC: 0.60–0.73; CV: 5.0–8.3%) [17].
The purpose of the IHCT is to mimic essential and complex match-related ice hockey-specific requirements and activities in order to reduce the gap between test and match performance [14,16]. Vital information (e.g., used assessments and parameters, detailed description) regarding the IHCT has been previously published elsewhere [14,17].
To guarantee strong interrater reliability, the same investigators (R.S.; S.S.) carried out all test procedures in the same manner. This reliability was additionally ensured using instruments for the measurement of the objective, physical variables (time, speed, heart rate, lactate), and the clear definition of the results (goal or no goal).
2.3. Statistics
All data were checked before the statistical analysis (descriptive presentation and inference tests) to avoid correlated observations. The median analysis was indicated if there was more than one data set per player. One data set was created for each player using the mean (even number of tests) or median (odd number of tests). We used the median instead of the mean (exception: even number of tests), because the mean can be strongly influenced by outliers. This is especially true when there is a small number of measured values.
Results were presented for the total group and only for the field players. Goalies were excluded based on their clearly different demands. Descriptive statistics contained mean, standard deviation (SD), and percentiles (10, 25, 50 (median), 75, 90) for all test variables.
The Shapiro–Wilk test for normal distribution and the Levene test for equality of variance (assuming homogeneity of variance) were used for all variables prior to statistical analysis. A one-factorial univariate general linear model was used to compare the mean differences between defenders and forwards.
In order to assess the practical relevance and quantify the differences in performance between playing positions, effect sizes (partial eta squared, ηp2; [20]; d; [21]) were calculated for the ANOVA main effects (ηp) resulting from the number of playing positions and the number of players in each playing position. The effect size d was calculated as a quotient of the mean differences divided by the pooled SD [21].
To judge d or ηp2, the following classifications were used: d ≥ 0.2, d ≥ 0.5, d ≥ 0.8, or ηp2 ≥ 0.01, ηp2 ≥ 0.06, ηp2 ≥ 0.14, indicating small, medium, or large effects, respectively [22].
To avoid an overestimation of mean differences, the level of significance was reduced using Bonferroni correction at p ≤ 0.002 (p < 0.05/33) or for ηp2 ≥ 0.10. In this context, partial eta squared (ηp2) was used to indicate clinical relevance [16,20].
Pearson’s product–moment correlations were used to calculate the interactions between anthropometric and physical performance parameters. A determination coefficient of at least r2 > 0.5 was defined as relevant and only reported [22]. The critical value for the product–moment correlation, based on a two-tailed t-test and alpha = 5%, is r ≈ 0.160 for the sample size of n = 148 used [23].
All statistical analyses were realized using SPSS version 28.0 for Windows (IBM, Armonk, NY, USA).
3. Results
3.1. Normal Distribution and Variance Homogeneity
The parameters of resting lactate (p < 0.001), 10 m sprint without puck (p = 0.033), 10 m backward sprint without puck (p < 0.001), 30 m backward sprint without puck (p = 0.039), transition without puck (p < 0.001), transition with puck (p < 0.001), and both goals before (p < 0.001) and following testing (p < 0.001) were not normally distributed.
Concerning the results for the Levene test for equality of variances (variance homogeneity), the p-values for the variables of 10 m backward sprint without puck (p = 0.031), goals after test (p < 0.001), and recovery heart rate (relative; p = 0.043) were less than 0.05. The p-value was greater than 0.055 (lactate recovery minute 2) for all variables, indicating that the variances of all variables for the playing positions (forwards, defenders) were significantly different.
3.2. Anthropometric Data
Descriptive data (Table 1) did not show any relevant (p ≤ 0.002 and ηp2 ≥ 0.10) position-specific differences. Defenders showed a higher average body mass (87.1 ± 8.48 kg) than forwards (85.3 ± 8.56 kg; Table 1). The largest difference (p = 0.004, ηp2 = 0.060) between defenders and forwards was detected in height (significant, but not relevant).

Table 1.
Anthropometric parameters and age of the investigated sample (n = 138) in relation to playing positions (mean ± standard deviation). Maxima are marked in bold.
Resting lactate moved in a very small range of between 1.05 mmol/L (forwards) and 1.07 mmol/L (defenders). Resting heart rate was very similar for both positions (64 and 65 min−1).
3.3. Performance Data
The results for speed skating (forward, backward) show that the forwards performed slightly (but not significantly) faster than the defenders in four of the six parameters (Table 2). Regarding backward sprinting, a typical defensive action, defenders showed a markedly higher performance level than forwards. These were also the largest differences over all parameters (10 m: d = 0.57; 30 m: d = 0.74).
Table 2.
Speed skating percentile by playing position. Performance peaks are highlighted in bold based on the 50th percentile (P50 = MEDIAN).
The agility performance tests (Table 3) displayed the largest differences between forwards and defenders for weave agility with the puck (p = 0.014; ηp2 = 0.043; d = 0.46). Both position groups moved on almost the same performance level for the transition parameters.
Table 3.
Agility percentile by playing position. Performance peaks are highlighted in bold based on the 50th percentile (P50 = MEDIAN).
Shot performance data (Table 4 and Table 5) displayed small advantages for the defenders. A total of 79% (11/14) of all maxima were found for defenders. The largest difference (d = 0.41) between positions was calculated for shot accuracy with preload (after finishing the sprints and agility runs); defenders: 4.86 ± 0.74 vs. forwards: 4.49 ± 1.06, Table 5).
Table 4.
Shot performance without preload percentile by playing position. Performance peaks are highlighted in bold based on the 50th percentile (P50 = MEDIAN).
Table 5.
Shot performance with preload percentile by playing position. Performance peaks are highlighted in bold based on the 50th percentile (P50 = MEDIAN).
No relevant position-specific differences existed between the measured stress parameters of lactate and heart rate (Table 6 and Table 7). All maxima were captured for defenders. The ability to recover was slightly higher for the forwards, especially for the cardiac recovery (41.1 ± 5.04% vs. 42.6 ± 4.04%; d = 0.33).
Table 6.
Stress parameters (heart rate, lactate) percentile by playing position. Performance peaks are highlighted in bold based on the 50th percentile (P50 = MEDIAN); recovery minute = rm.
Table 7.
Differences in load and stress parameters (mean ± SD) by playing position. Bold fonts indicate performance maximums and significant differences (p ≤ 0.002); recovery minute = rm.
We did not find any relevant (r > 0.7) interactions between anthropometric parameters or age on one side and the IHCT performance (load and stress parameters) on the other side.
4. Discussion
This study aimed to provide position-specific (defenders vs. forwards) reference data for the IHCT. The comparison of the field players revealed only one relevant difference in the 30 m backward sprint without a puck (p < 0.001, ηp2 = 0.097, d = 0.74) in favor of the defenders (5.37 ± 0.21 s vs. 5.55 ± 0.28 s). Clear (d > 0.4) but not relevant differences were also found in 10 m backward sprint without a puck (d = 0.57), weave agility with a puck (d = 0.46), heart rate recovery minute 10 (d = 0.42), and goals after test (d = 0.41). In general, forwards seem to have advantages regarding speed, agility parameters, and the ability to recover. In contrast, defenders showed more frequently higher slap shot velocities. For the anthropometric parameters, there was only a weak group difference (p = 0.004, ηp2 = 0.060) in height. Forwards (1.81 ± 0.05 m) displayed a lower height compared to defenders (1.84 ± 0.06 m). The same is valid for body mass (85.3 ± 8.56 kg vs. 87.1 ± 8.48 kg).
At the start of the discussion, it should be mentioned that this is an update from the already published reference data for the ice hockey-specific complex test [16]. Previous studies examined individual player position-specific load parameters [2,3,5,24,25,26,27,28,29]. However, their results are difficult to compare due to differences in study methodology (e.g., sample size, length of career, class of competition, location of tests, definition of performance). Most importantly, however, the validation of these tests based on the match performance during prospective data collection has been missing so far.
Legerlotz et al. [29] supported the need for implementing the technical aspect [13,30] in a complex on-ice diagnostic. The authors postulated that the specific technique (skating vs. running) and the specific environment (off-ice vs. on-ice) are critical [29] but necessary [30] factors for the functionality and validity of the test results.
The results from this real-life data collection underline the findings from different studies [11,12] that show that the differences between field positions are minor. Defenders only showed advantages for backward skating and shot velocity, especially concerning the slap shot. Vigh-Larsen et al. [12] investigated the largest sample with 145 elite and 111 sub-elite male ice hockey players from the Danish ice hockey division. From a practical point of view, that means that there is no need to strictly distinguish forwards and defenders within the physical on-ice workout.
Kniffin et al. [31] recruited a comparable sample (n = 120 vs. n = 138) of male ice hockey players (National Collegiate Athletic Association (NCAA) Division 1). Our data showed a similar position distribution (62% defenders vs. 66% forwards) to previous studies [31]. Goalkeepers were also excluded from their study. However, it should be noted that our results differ significantly from the previously mentioned results of the study by Kniffin et al. [31]. This may be due to the fact that this study group only measured performance data (such as vertical jump or bench press) off-ice and used it as a substitute parameter for lower/upper body strength in ice hockey. This is in line with the study of Nightingale et al. [24], who pointed out that classically used performance tests such as the Wingate 30 s test (anaerobic performance), cycle ergometer test (aerobic performance; VO2max), or push-ups, sit-ups, grip strength, bench press, standing long jump, and vertical jump (strength performance) have only a low predictive value in ice hockey, although they are regularly performed. The authors pointed out that there is an urgent need to develop and establish hockey-specific tests with a higher predictive value and relevance.
Roczniok et al. [1,2] also conducted complex off-ice performance diagnostics, which consisted of tests to determine aerobic and anaerobic capacity, anaerobic threshold, and specific strength. The authors’ findings were that the best predictor of success for elite hockey players was relative peak power (OR = 1.82, 95% CI: 0.98–3.36) and relative VO2max (OR = 2.12, 95% CI: 1.11–4.05). It is critical to note that the authors did not use the match performance as an objective, and unfortunately there is no alternative, gold standard for the validation process in order to differentiate between successful and unsuccessful but an expert ranking based on the opinion of coaches. Presumably, this methodological weakness could be the surprising reason for detecting off-ice parameters as the best predictors of success. The development of a match performance score [14,15] based on the match performance over a season could be a sufficient solution within the validation process.
Hajek et al. [4] stated that for better standardization of specific tests, skating with the puck should be excluded (confounding factor). At the same time and in contradiction to the used approach, the authors pointed out that puck handling is essential for the ice-hockey match performance [4]. To our knowledge, this should also be regarded as critical. The highest degree of standardization is relatively useless if validity suffers disproportionately as a result. Both test requirements should be well balanced, but with priority given to validity.
Lignell et al. [3] also examined the skating performance during a top-class ice hockey match (n = 36) comparable with Roczniok et al. [1,2]. They assessed physical capacity using a submaximal Yo-Yo Intermittent Recovery Ice hockey test (level 1) in contrast to our results and those of other authors [11,12,16]. In contrast to our findings, Lignell et al. [3] described performance differences between forwards and defenders. Accordingly, forwards performed more intense skating and repeatedly higher-intensity exercises than defenders. The largest position-dependent difference regarding the necessary skills and abilities is how much more defenders skate backwards compared to forwards. Consequently, this was the only significant difference found (30 m backward sprint without puck: p < 0.001, ηp2 = 0.74). Therefore, coaches should consider the position-specific and tactical roles within training sessions [3]. The test design from Lignell et al. [3] emphasizes the concept of the IHCT, which includes seven high-intensity actions [16].
Czeck et al. [11] analyzed male and female college players’ anthropometric parameters and body composition. With respect to on-ice performance, they observed relationships between body fat and performance in COD demands and total test time in a complex test design. In line with the present study results, the authors did not report any relationship between anthropometric parameters and on-ice performance results.
The correlations between off-ice tests (e.g., Wingate test, jumping performance, beep test), changes in body composition (e.g., body fat, lean mass), and match performance (e.g., shift length, playing time) have been analyzed by previous study groups [27]. According to Nightingale et al. [24], the exclusive use of off-ice tests, however, is not preferable. Therefore, we preferred in our study the approach of complex performance diagnostics [14,15], in which off-ice tests were always combined with on-ice tests (e.g., IHCT).
The most important methodological limitation of the current study was that only players from the third-league German ice hockey were included in the study, which limits the significance to a comparable level of performance. Based on the currently very large sample size (n = 138), the meaningfulness of the data is very high. Nevertheless, the database should be expanded to the first and second leagues as well as male players from different countries and female players in order to reduce the selection bias. As such, there is limited generalizability of our data and findings. At the same time, our data did have high power for the judgement of third-league ice hockey players in Germany. Consequently, it would be possible to compare players of different performance and skill levels [16]. However, the IHCT can also be used in all professional divisions due to similar requirement profiles.
Another statistical limitation was the large position-specific difference (nDiff = 50; forwards: n = 94; defenders n = 44). Such a large difference between groups is disadvantageous for the power of the variance analysis. This could be a reason for the small number of relevant position differences (Table 7). Conversely, this distribution is justified by the ice hockey team structure (two defenders and three forwards per line). That means a ratio of 60% forwards and 40% defenders is close to real life [16].
From a practical point of view, the reference data presented in this study offer a matrix for intraindividual, interindividual, and team comparison depending on position (Figure 2). Consequently, coaches can get an overview summarized on one page regarding all necessary information for evaluating every player and the whole team based on a comprehensive position-specific reference database.
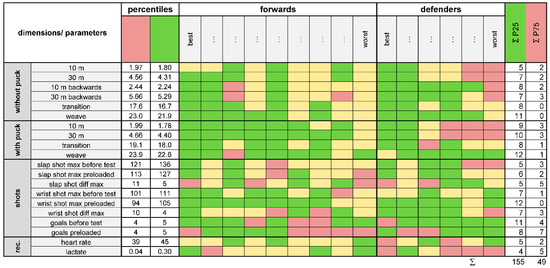
Figure 2.
Example of an analysis matrix to judge players and teams. max = maximal, diff = difference, rec = recovery, heart rate = recovery heart rate (relative), rm 0 to rm 10 [%], lactate = lactate degradation rate per minute, rm 6 to rm 10 [mmol*L−1/min], red = P75 = percentile 75 = underperformance, green = P25 = percentile 25 = excellent performance, yellow = interquartile range = normal performance.
5. Conclusions
The updated results provide valuable information for specific workouts related to on-ice positions. It seems that the position-specific differences were smaller than expected. Only for backward sprinting without a puck were relevant differences between defenders and forwards observed. In combination with our practical experience, we recommend sufficient aerobic endurance training combined with core stability and strength endurance workouts for the physical preparation of ice hockey players.
Finally, it should be emphasized that the IHCT is a reliability-proofed assessment that has been validated two times, and is now also equipped with a large reference database for third-league field players. Based on the updated comparable scientific literature, the IHCT is the only scientifically evaluated (validity, reliability, reference data) on-ice test for professional ice hockey players.
The IHCT is useful for scouting (e.g., talent identification) and evaluating the effectiveness of longitudinal interventions. The introduced analysis matrix offers a valuable possibility for sufficient intra- and interindividual player and team judgement.
Further research is needed to expand the validity and scope (second- and first-league players, teams from different countries, female players) of the IHCT.
Author Contributions
Conceptualization, S.S. and R.S.; methodology, S.S., R.S. and T.B.; formal analysis, K.-S.D., R.S. and K.G.L.; investigation, S.S. and R.S.; resources, R.S.; data curation, R.S.; writing—original draft preparation, S.S., R.S., T.B. and K.G.L.; writing—review and editing, S.S., R.S., R.P.M., K.G.L. and K.-S.D.; visualization, S.S.; supervision, S.S., T.B. and R.S.; project administration, S.S., K.-S.D. and R.S. All authors have read and agreed to the published version of the manuscript.
Funding
This research received no external funding.
Institutional Review Board Statement
The study was conducted in accordance with the Declaration of Helsinki, and approved by the local Ethics Committee of the Martin-Luther-University (reference number: 2013-13; date of approval: 6 June 2017).
Informed Consent Statement
Informed consent was obtained from all subjects involved in the study.
Data Availability Statement
The data presented in this study are available on request from the corresponding author due to privacy.
Acknowledgments
The authors would like to thank the ice hockey players of all teams used in this study (Saale Bulls, Blue Devils Weiden, Selber Wölfe), as well as their coaches for their cooperation and outstanding efforts.
Conflicts of Interest
Author Thomas Bartels was employed by the company MVZ Sports Clinic Halle (Saale) GmbH, Center of Joint Surgery. Author Robert Percy Marshall was employed by the company RasenBallsport Leipzig GmbH. The remaining authors declare that the research was conducted in the absence of any commercial or financial relationships that could be construed as a potential conflict of interest.
References
- Roczniok, R.; Stanula, A.; Gabryś, T.; Szmatlan-Gabryś, U.; Gołaś, A.; Stastny, P. Physical fitness and performance of polish ice-hockey players competing at different sports levels. J. Hum. Kinet. 2016, 51, 201–208. [Google Scholar] [CrossRef] [PubMed]
- Roczniok, R.; Stanula, A.; Maszczyk, A.; Mostowik, A.; Kowalczyk, M.; Fidos-Czuba, O.; Zajac, A. Physiological, physical and on-ice performance criteria for selection of elite ice hockey teams. Biol. Sport. 2016, 33, 43–48. [Google Scholar] [CrossRef]
- Lignell, E.; Fransson, D.; Krustrup, P.; Mohr, M. Analysis of high-intensity skating in top-class ice hockey match-play in relation to training status and muscle damage. J. Strength Cond. Res. 2018, 32, 1303–1310. [Google Scholar] [CrossRef] [PubMed]
- Hajek, F.; Keller, M.; Taube, W.; von Duvillard, S.P.; Bell, J.W.; Wagner, H. Testing-Specific Skating Performance in Ice Hockey. J. Strength Cond. Res. 2021, 35, S70–S75. [Google Scholar] [CrossRef]
- Stanula, A.; Roczniok, R.; Maszczyk, A.; Pietraszewski, P.; Zajac, A. The role of aerobic capacity in high-intensity intermittent efforts in ice-hockey. Biol. Sport 2014, 31, 193–199. [Google Scholar] [CrossRef]
- Peterson, B.J.; Fitzgerald, J.S.; Dietz, C.C.; Ziegler, K.S.; Ingraham, S.; Baker, S.E.; Snyder, E.M. Division I Hockey Players Generate More Power Than Division III Players During on- and Off-Ice Performance Tests. J. Strength Cond. Res. 2015, 29, 1191–1196. [Google Scholar] [CrossRef]
- Montgomery, D.L. Physiological profile of professional hockey players—A longitudinal comparison. Appl. Physiol. Nutr. Metab. 2006, 31, 181–185. [Google Scholar] [CrossRef] [PubMed]
- Peterson, B.J.; Fitzgerald, J.S.; Dietz, C.C.; Ziegler, K.S.; Baker, S.E.; Snyder, E.M. Off-ice anaerobic power does not predict on-ice repeated shift performance in hockey. J. Strength Cond. Res. 2016, 30, 2375–2381. [Google Scholar] [CrossRef] [PubMed]
- Dæhlin, T.E.; Haugen, O.C.; Haugerud, S.; Hollan, I.; Raastad, T.; Rønnestad, B.R. Improvement of ice hockey players’ on-ice sprint with combined plyometric and strength training. Int. J. Sports Physiol. Perform. 2017, 12, 893–900. [Google Scholar] [CrossRef]
- Bond, C.W.; Bennett, T.W.; Noonan, B.C. Evaluation of skating top speed, acceleration, and multiple repeated sprint speed ice hockey performance tests. J. Strength Cond. Res. 2018, 32, 2273–2283. [Google Scholar] [CrossRef]
- Czeck, M.A.; Roelofs, E.J.; Dietz, C.; Bosch, T.A.; Dengel, D.R. Body Composition and On-Ice Skate Times for National Collegiate Athletic Association Division I Collegiate Male and Female Ice Hockey Athletes. J. Strength Cond. Res. 2022, 36, 187–192. [Google Scholar] [CrossRef] [PubMed]
- Vigh-Larsen, J.P.; Beck, J.H.; Daasbjerg, A.; Knudsen, C.B.; Kvorning, T.; Overgaard, K.; Andersen, T.B.; Mohr, M. Fitness Characteristics of Elite and Subelite Male Ice Hockey Players: A Cross-Sectional Study. J. Strength Cond. Res. 2019, 33, 2352–2360. [Google Scholar] [CrossRef]
- Pelletier, V.H.; Glaude-Roy, J.; Daigle, A.P.; Brunelle, J.F.; Bissonnette, A.; Lemoyne, J. Associations between Testing and Game Performance in Ice Hockey: A Scoping Review. Sports 2021, 9, 117. [Google Scholar] [CrossRef] [PubMed]
- Schwesig, R.; Hermassi, S.; Edelmann, S.; Thorhauer, U.; Schulze, S.; Fieseler, G.; Delank, K.S.; Shephard, R.J.; Chelly, M.S. Relationship between ice hockey-specific complex test and maximal strength, aerobic capacity and postural regulation in professional players. J. Sports Med. Phys. Fitness 2017, 57, 1415–1423. [Google Scholar] [CrossRef]
- Schwesig, R.; Laudner, K.G.; Delank, K.S.; Brill, R.; Schulze, S. Relationship between Ice Hockey Specific Complex Test (IHCT) and match performance. Appl. Sci. 2021, 11, 3080. [Google Scholar] [CrossRef]
- Schulze, S.; Laudner, K.G.; Delank, K.S.; Brill, R.; Schwesig, R. Reference data by player position for an ice hockey-specific complex test. Appl. Sci. 2021, 11, 280. [Google Scholar] [CrossRef]
- Schwesig, R.; Lauenroth, A.; Schulze, S.; Laudner, K.G.; Bartels, T.; Delank, K.S.; Reinhardt, L.; Kurz, E.; Hermassi, S. Reliability of an ice hockey-specific complex test. Sportverletz. Sportschaden 2018, 32, 196–203. [Google Scholar] [CrossRef]
- Kurz, E.; Schulze, S.; Panian, M.; Brill, R.; Delank, K.S.; Schwesig, R. Responsiveness and Relationships of Shooting Performance to On-Ice Physical Performance Tests. Appl. Sci. 2021, 11, 10218. [Google Scholar] [CrossRef]
- Millum, J.; Wendler, D.; Emanuel, E.J. The 50th Anniversary of the Declaration of Helsinki. JAMA 2013, 310, 2143. [Google Scholar] [CrossRef]
- Richardson, J.T.E. Eta squared and partial eta squared as measures of effect size in educational research. Educ. Res. Rev. 2011, 6, 135–147. [Google Scholar] [CrossRef]
- Hartmann, A.; Herzog, T.; Drinkmann, A. Psychotherapy of bulimia nervosa: What is effective? A meta-analysis. J. Psychosom. Res. 1992, 36, 159–167. [Google Scholar] [CrossRef] [PubMed]
- Cohen, J. Statistical Power Analysis for the Behavioural Sciences; Lawrence Earlbaum Associates: Hillside, NJ, USA, 1988; pp. 77–83, 278–280. [Google Scholar] [CrossRef]
- Willimczik, K. Statistik im Sport: Grundlagen, Verfahren, Anwendungen; Czwalina: Hamburg, Germany, 1997; p. 259. [Google Scholar]
- Nightingale, S.C.; Miller, S.; Turner, A. The usefulness and reliability of fitness testing protocols for ice hockey players: A literature review. J. Strength Cond. Res. 2013, 27, 1742–1748. [Google Scholar] [CrossRef]
- Ransdell, L.B.; Murray, T.M.; Gao, Y. Off-ice fitness of elite female ice hockey players by team success, age, and player position. J. Strength Con. Res. 2013, 27, 875–884. [Google Scholar] [CrossRef]
- Boucher, V.G.; Parent, A.-A.; St-Jean Miron, F.; Leone, M.; Comtois, A.S. Comparison between power off-ice test and performance on-ice anaerobic testing. J. Strength Cond. Res. 2017, 34, 3498–3505. [Google Scholar] [CrossRef]
- Delisle-Houde, P.; Chiarlitti, N.A.; Reid, R.E.R.; Andersen, R.E. Relationship between physiologic tests, body composition changes, and on-ice playing time in canadian collegiate hockey players. J. Strength Cond. Res. 2018, 32, 1297–1302. [Google Scholar] [CrossRef] [PubMed]
- Lamoureux, N.R.; Tomkinson, G.R.; Peterson, B.J.; Fitzgerald, J.S. Relationship between skating economy and performance during a repeated-shift test in elite and subelite ice hockey players. J. Strength Cond. Res. 2018, 32, 1109–1113. [Google Scholar] [CrossRef] [PubMed]
- Legerlotz, K.; Kittelmann, J.; Dietzel, M.; Wolfarth, B.; Böhlke, N. Ice hockey-specific repeated shuttle sprint test performed on ice should not be replaced by off-ice testing. J. Strength Cond. Res. 2020, 36, 1071–1076. [Google Scholar] [CrossRef]
- Budarick, A.R.; Shell, J.R.; Robbins, S.M.K.; Wu, T.; Renaud, P.J.; Pearsall, D.J. Ice hockey skating sprints: Run to glide mechanics of high caliber male and female athletes. Sports Biomech. 2020, 19, 601–617. [Google Scholar] [CrossRef]
- Kniffin, K.M.; Howley, T.; Bardreau, C. Putting muscle into sports analytics: Strength, conditioning, and ice hockey performance. J. Strength Cond. Res. 2017, 31, 3253–3259. [Google Scholar] [CrossRef]


Disclaimer/Publisher’s Note: The statements, opinions and data contained in all publications are solely those of the individual author(s) and contributor(s) and not of MDPI and/or the editor(s). MDPI and/or the editor(s) disclaim responsibility for any injury to people or property resulting from any ideas, methods, instructions or products referred to in the content. |
© 2024 by the authors. Licensee MDPI, Basel, Switzerland. This article is an open access article distributed under the terms and conditions of the Creative Commons Attribution (CC BY) license (https://creativecommons.org/licenses/by/4.0/).