
Experimental Investigation on Failure Characteristics of Pre-Holed Jointed Rock Mass Assisted with AE and DIC


Abstract
:1. Introduction
2. Deformation Measurement via the Geotechnical DIC System: PhotoInfor
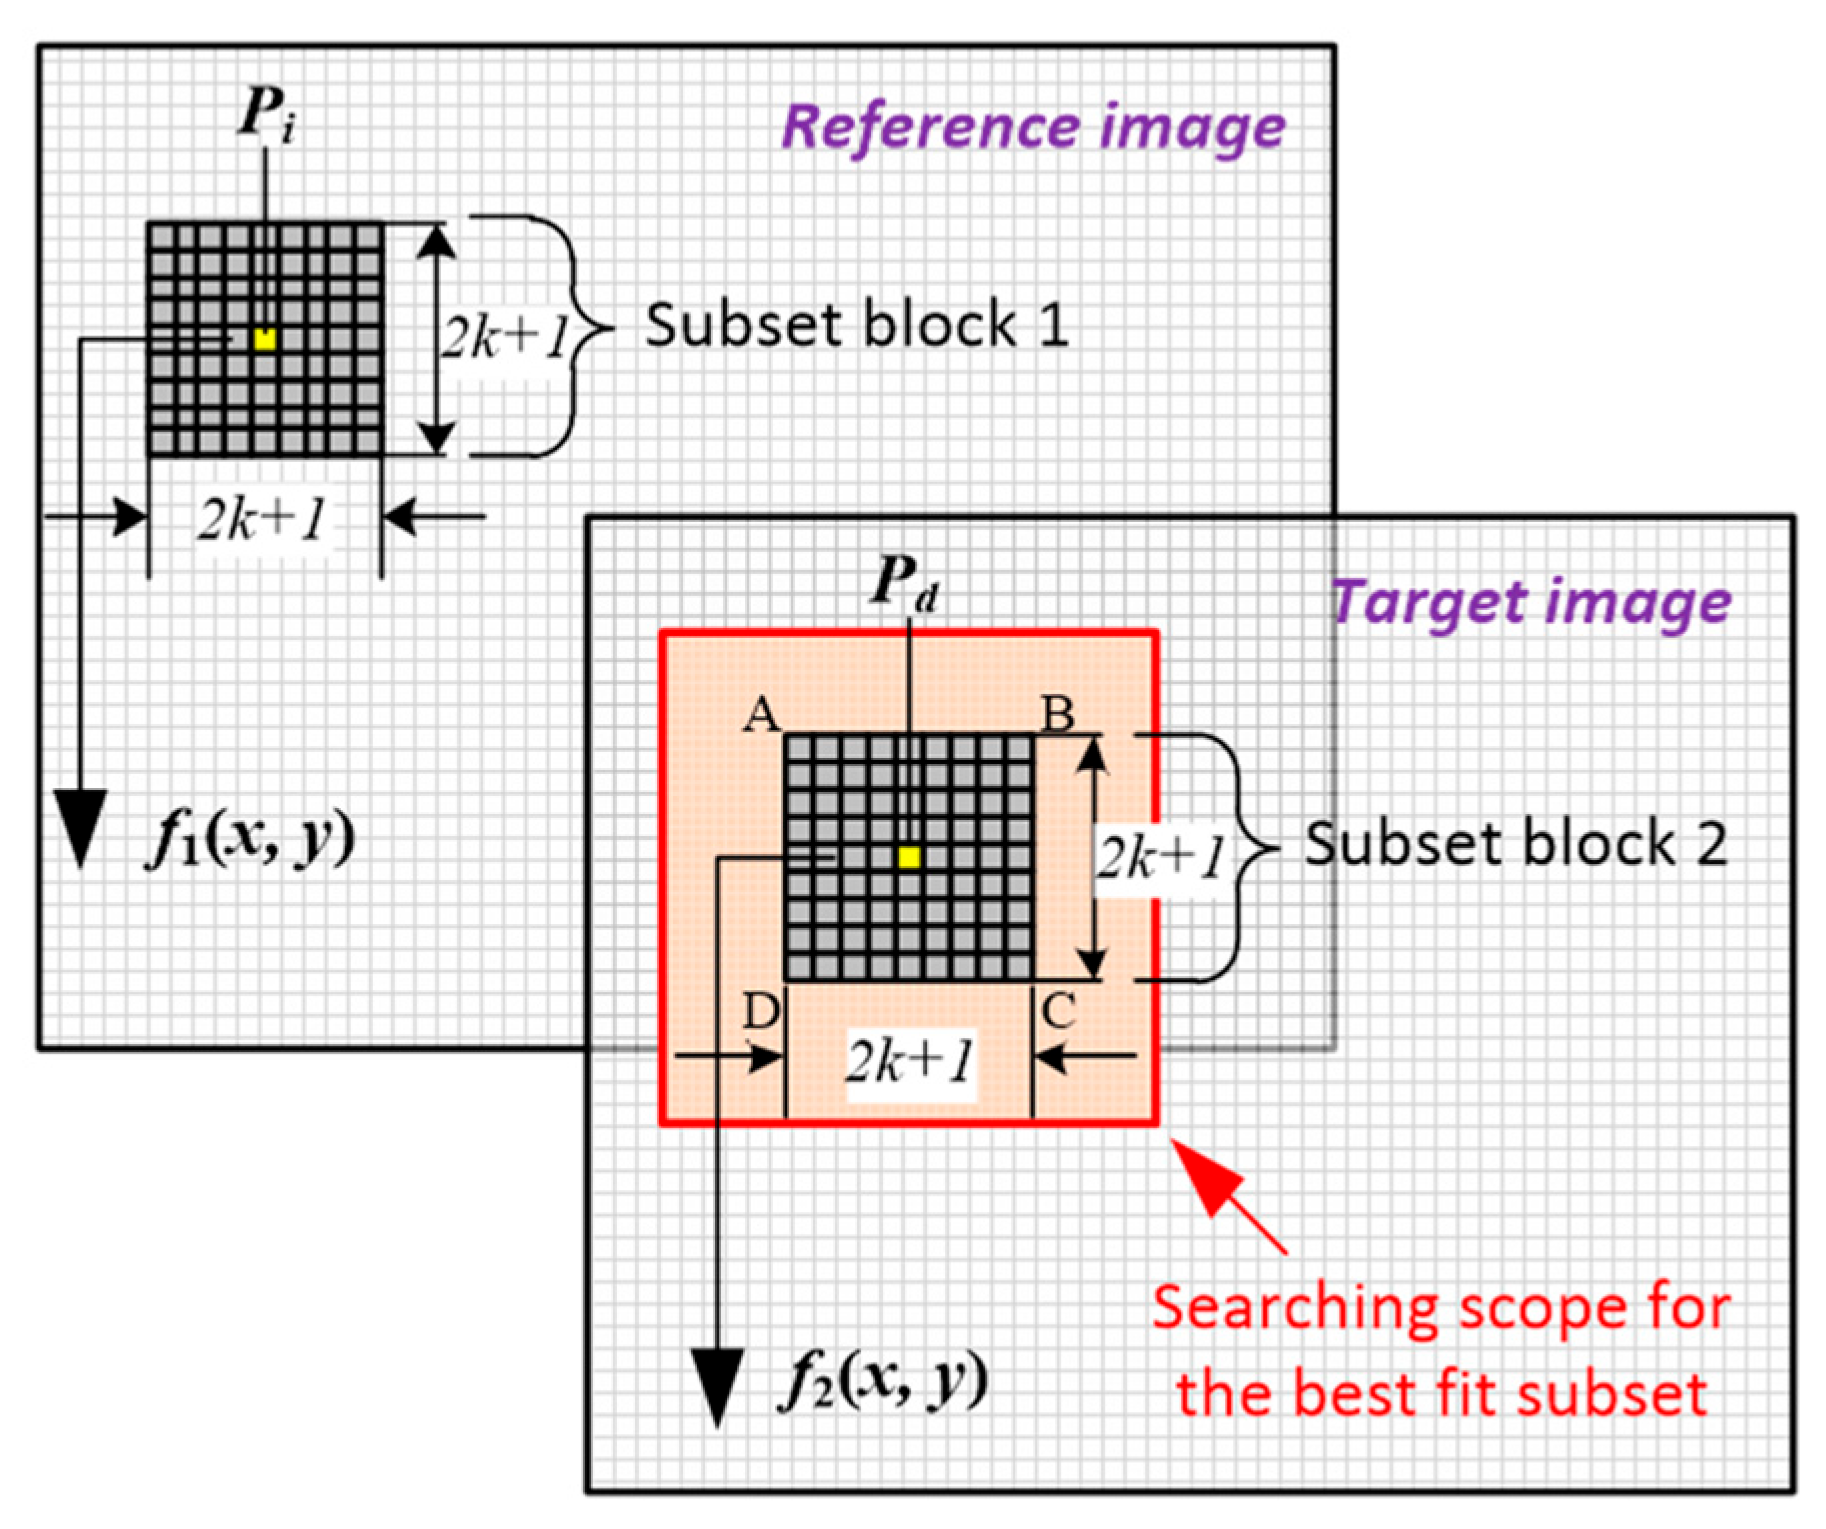
2.1. Principle of the Digital Image Correlation
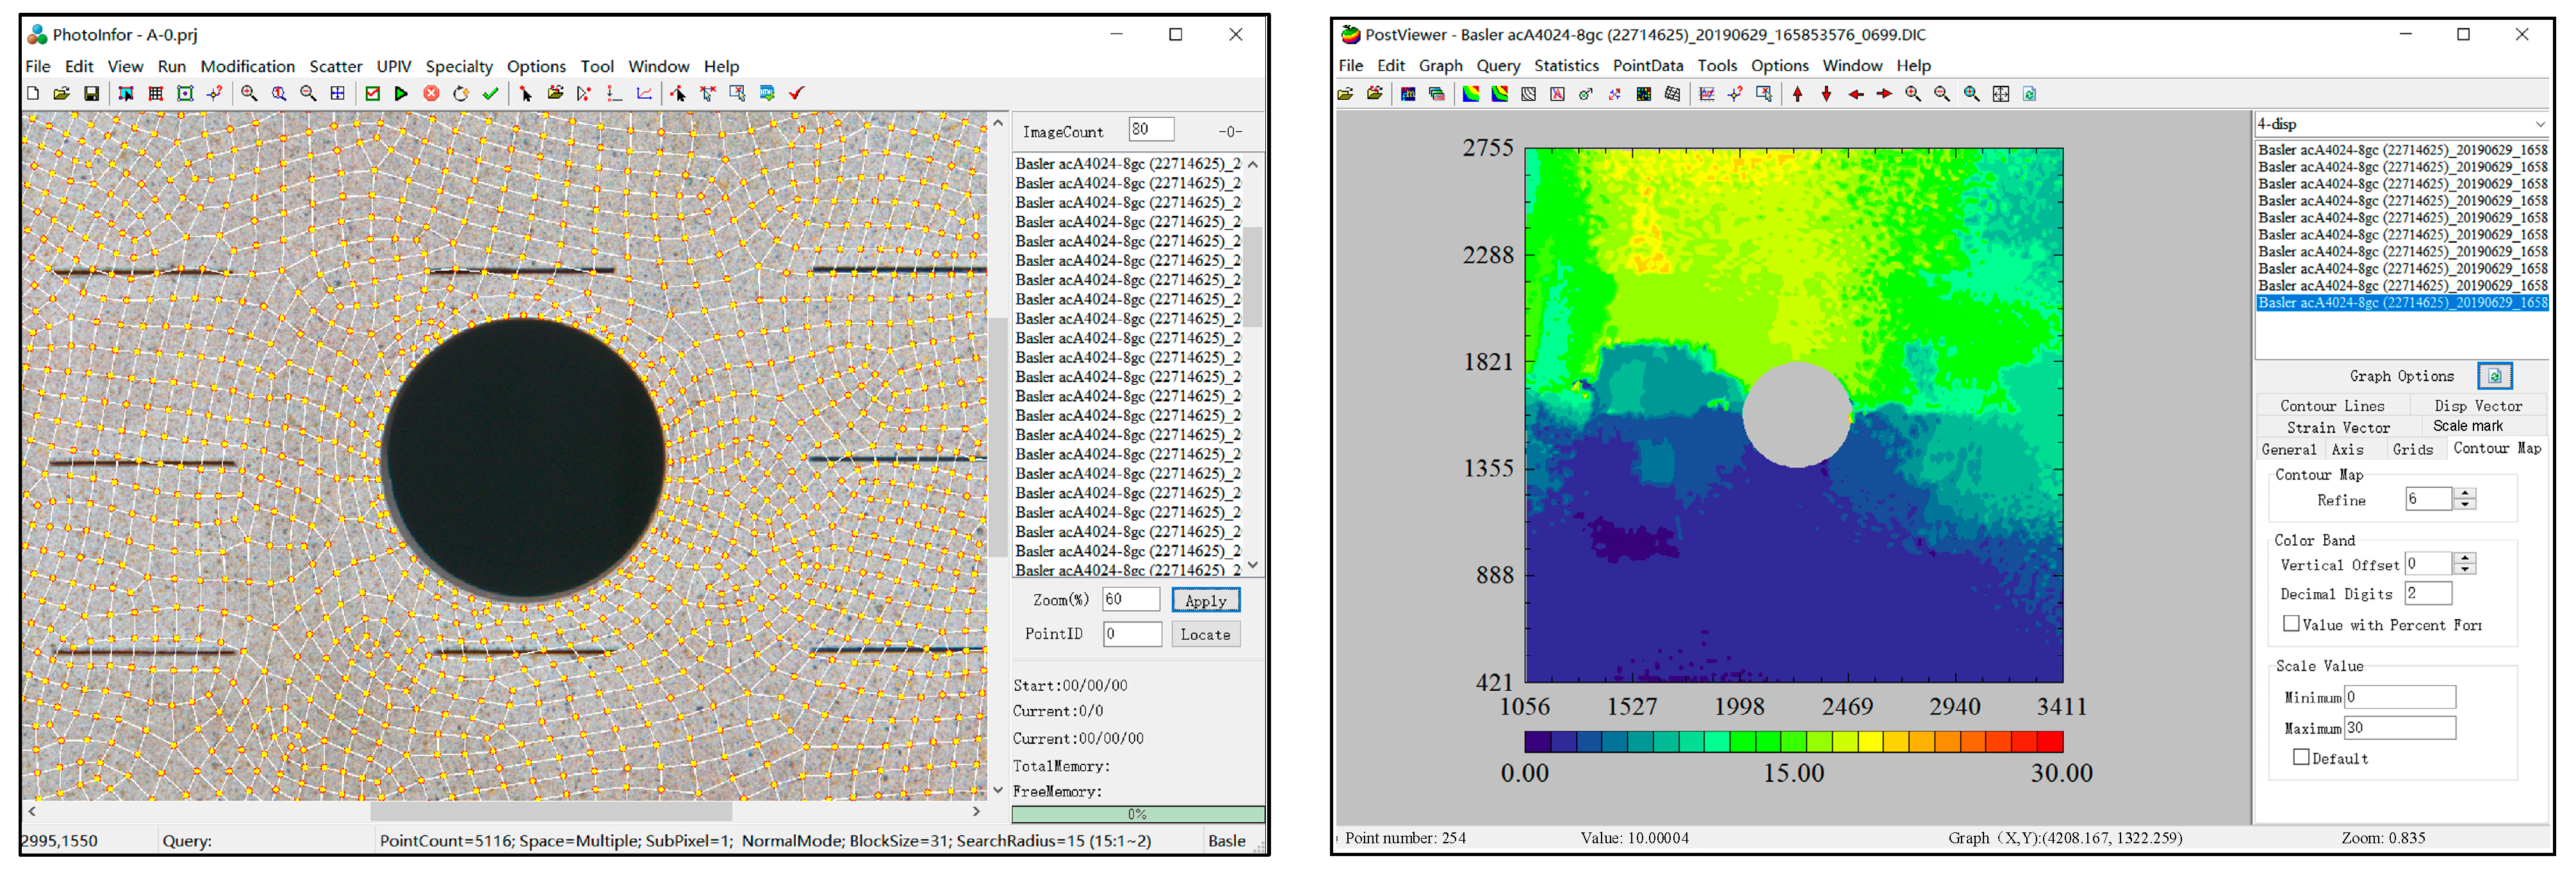
2.2. DIC Software PhotoInfor: Designed for Geotechnical DIC-Analysis
2.3. Specialized Algorithm Equipped in PhotoInfor Regarding Discontinuity
3. Experimental Work
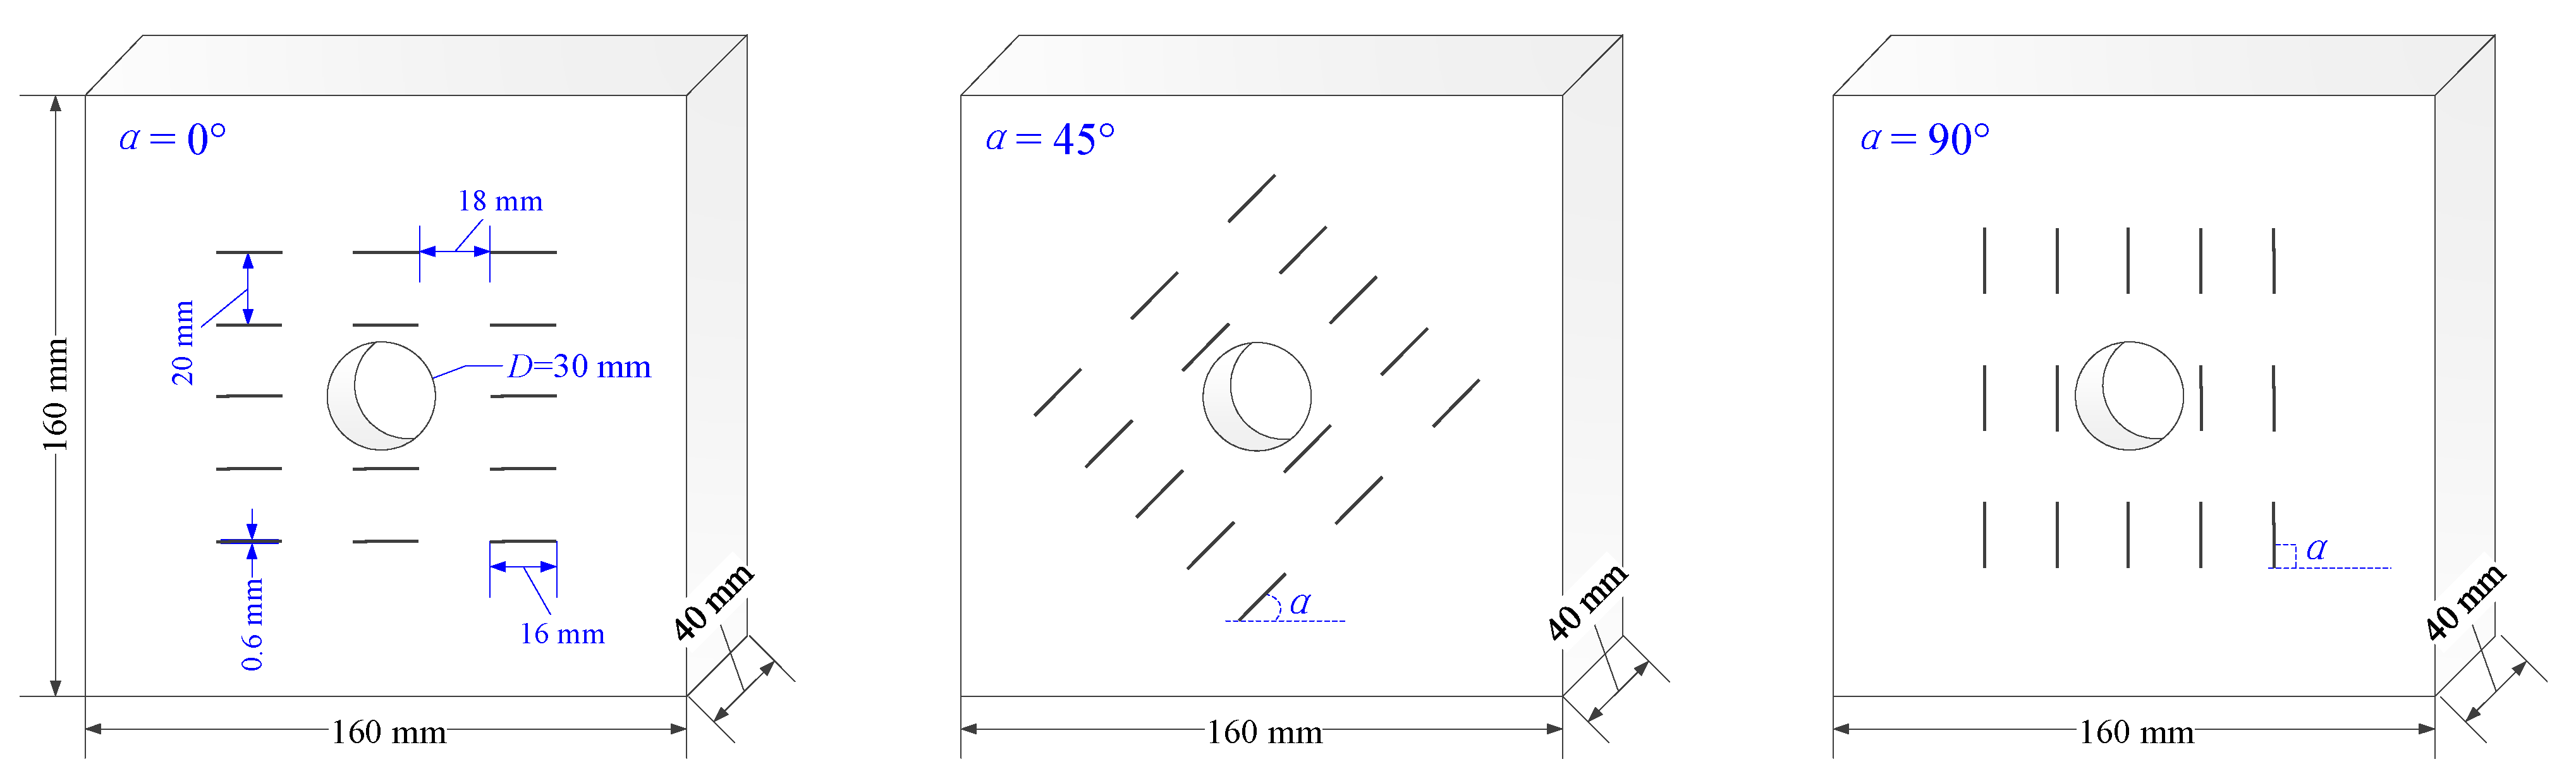
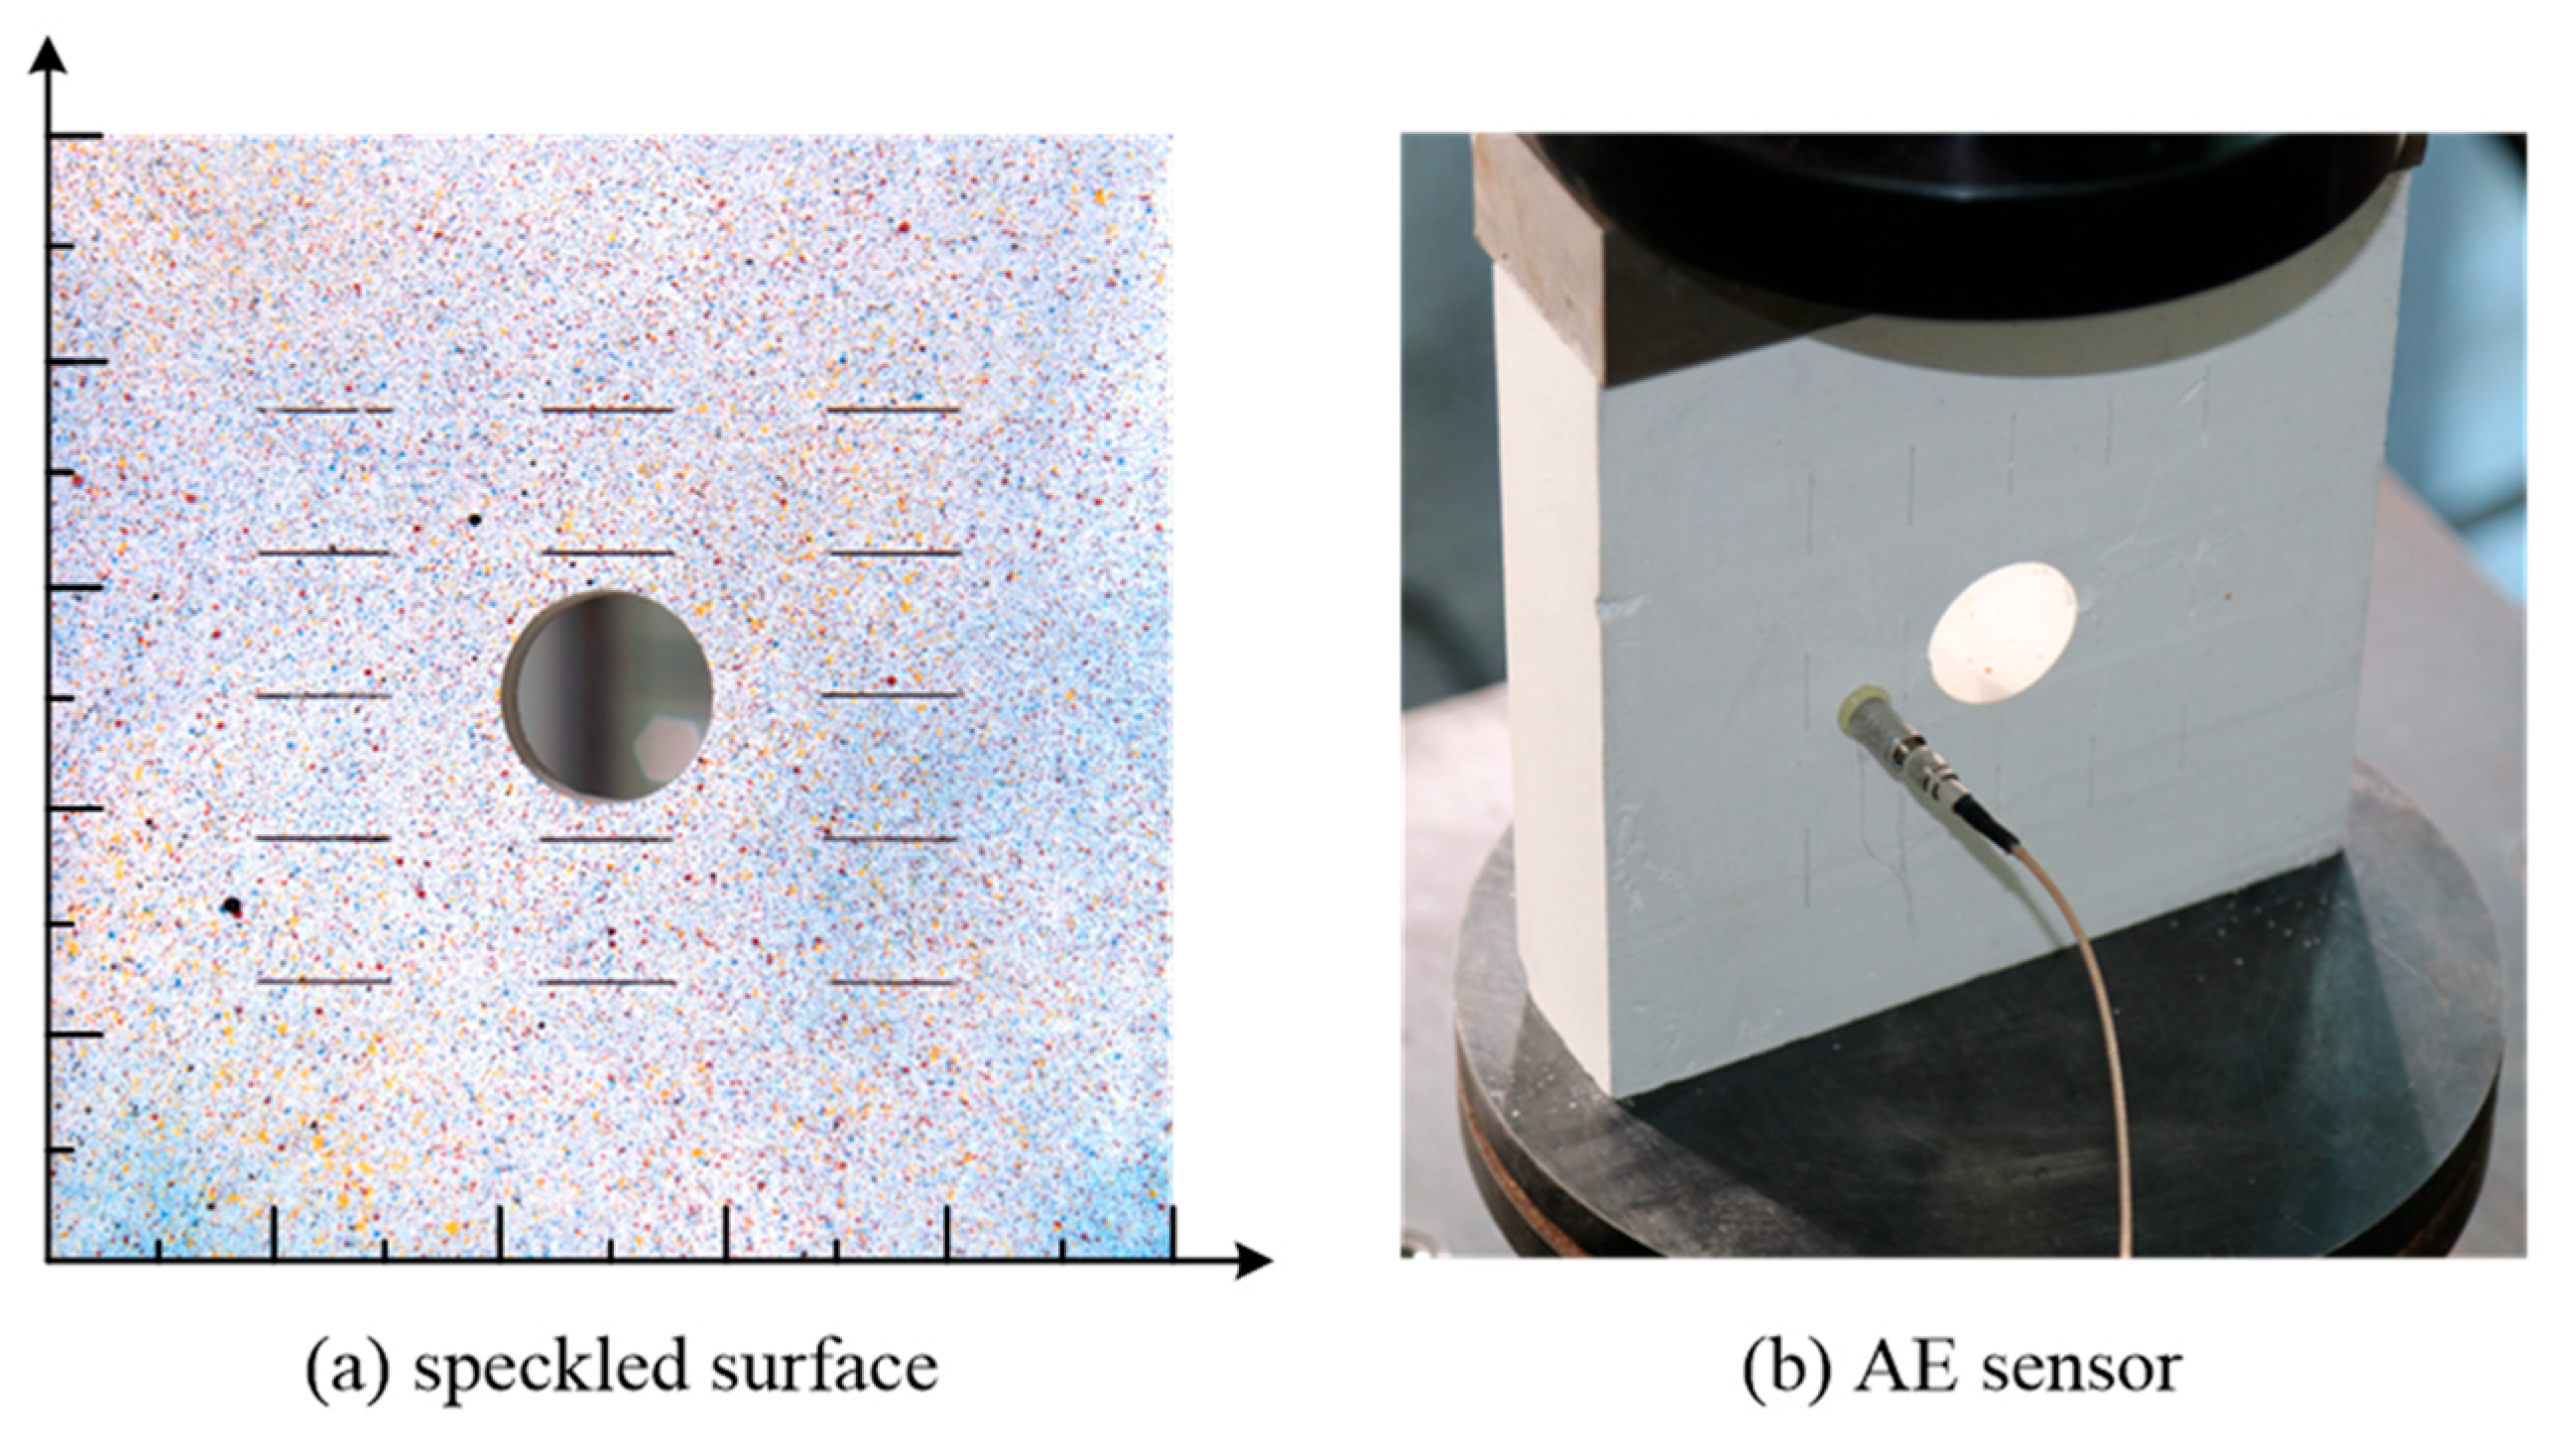
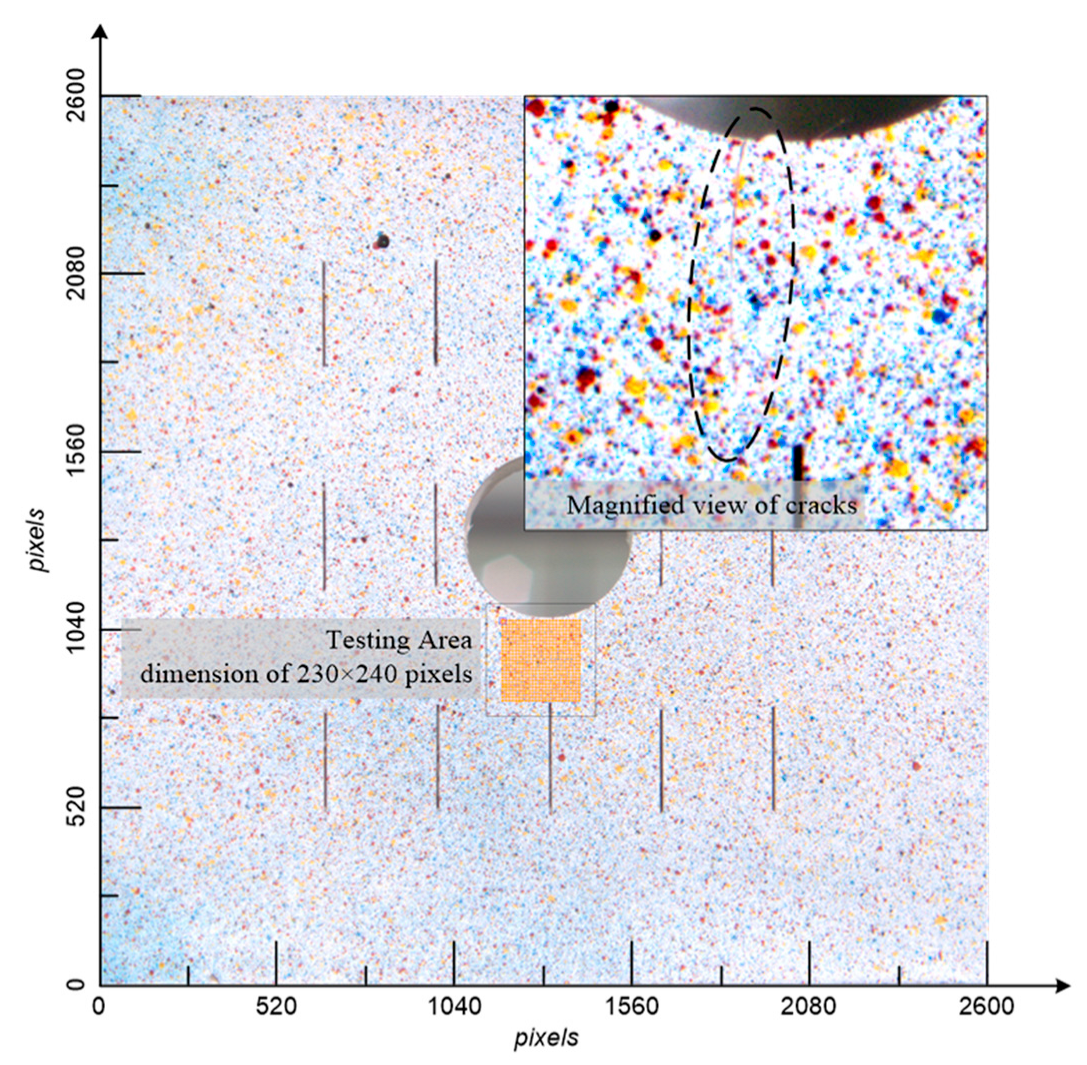
3.1. Material and Samples
3.2. Experimental Setup
3.3. Procedures
4. Confirmation of Conventional Parameters in the DIC for an Optimized Measurement
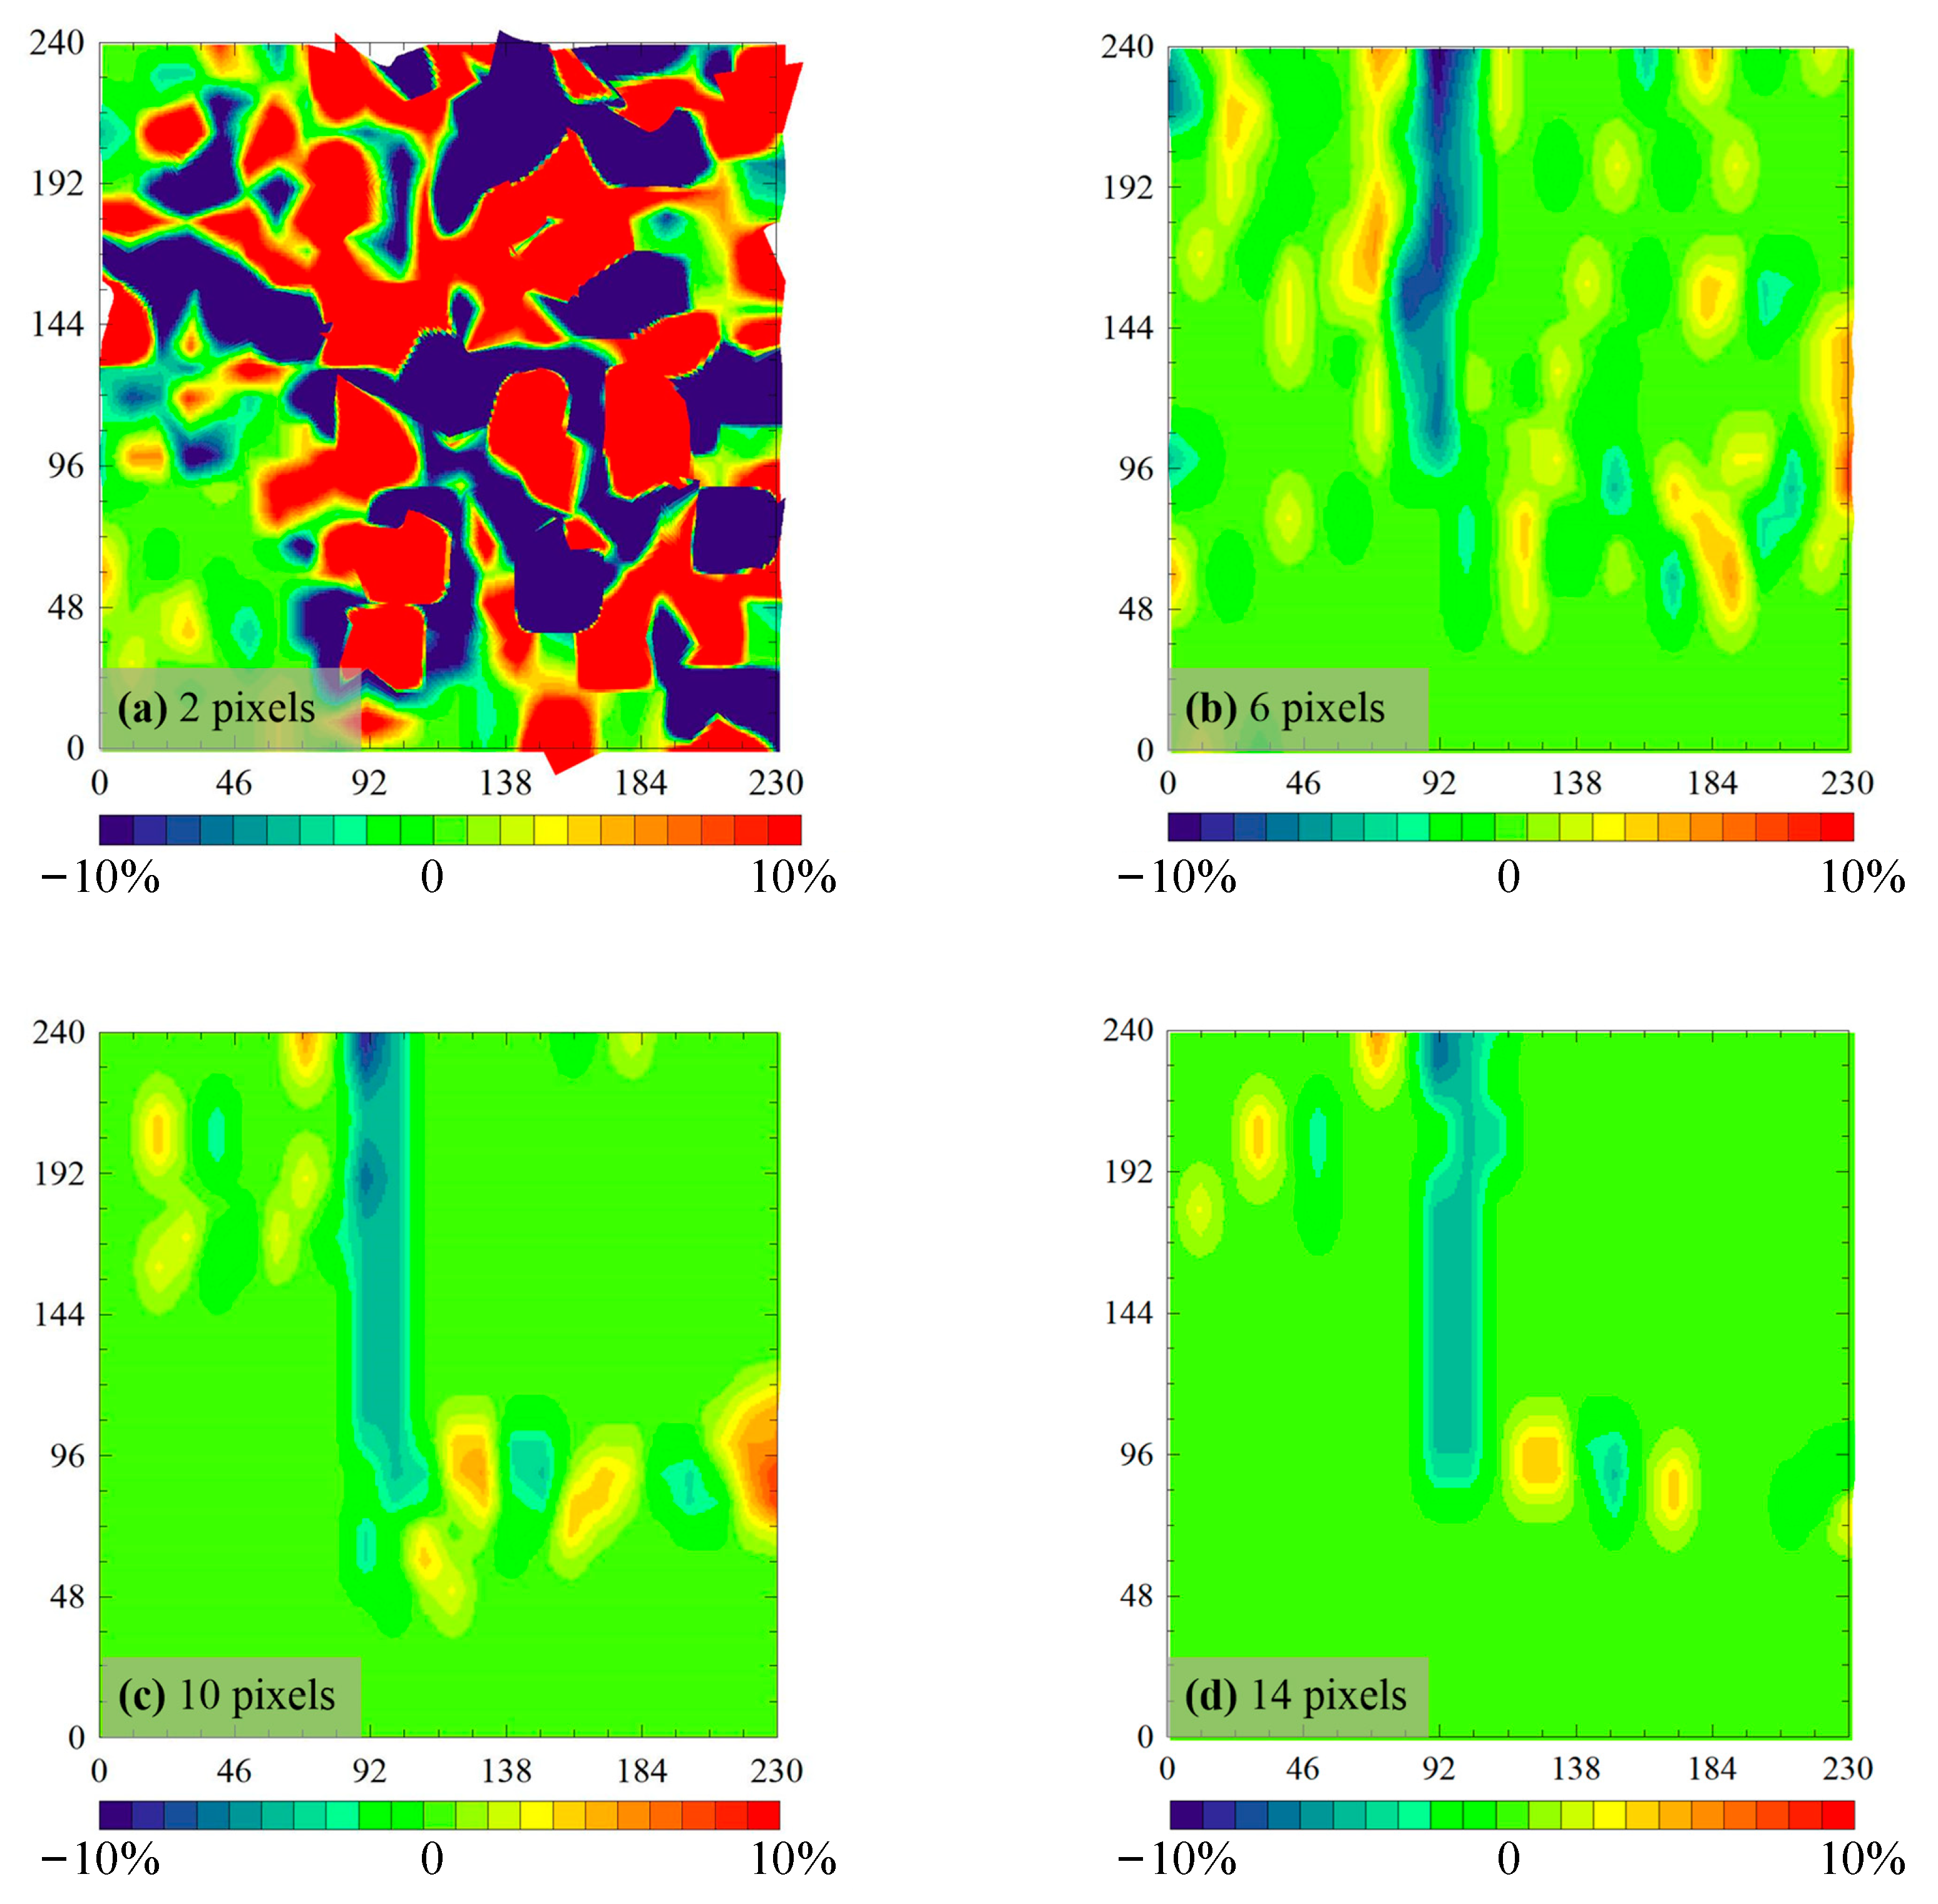
4.1. Subset Radius
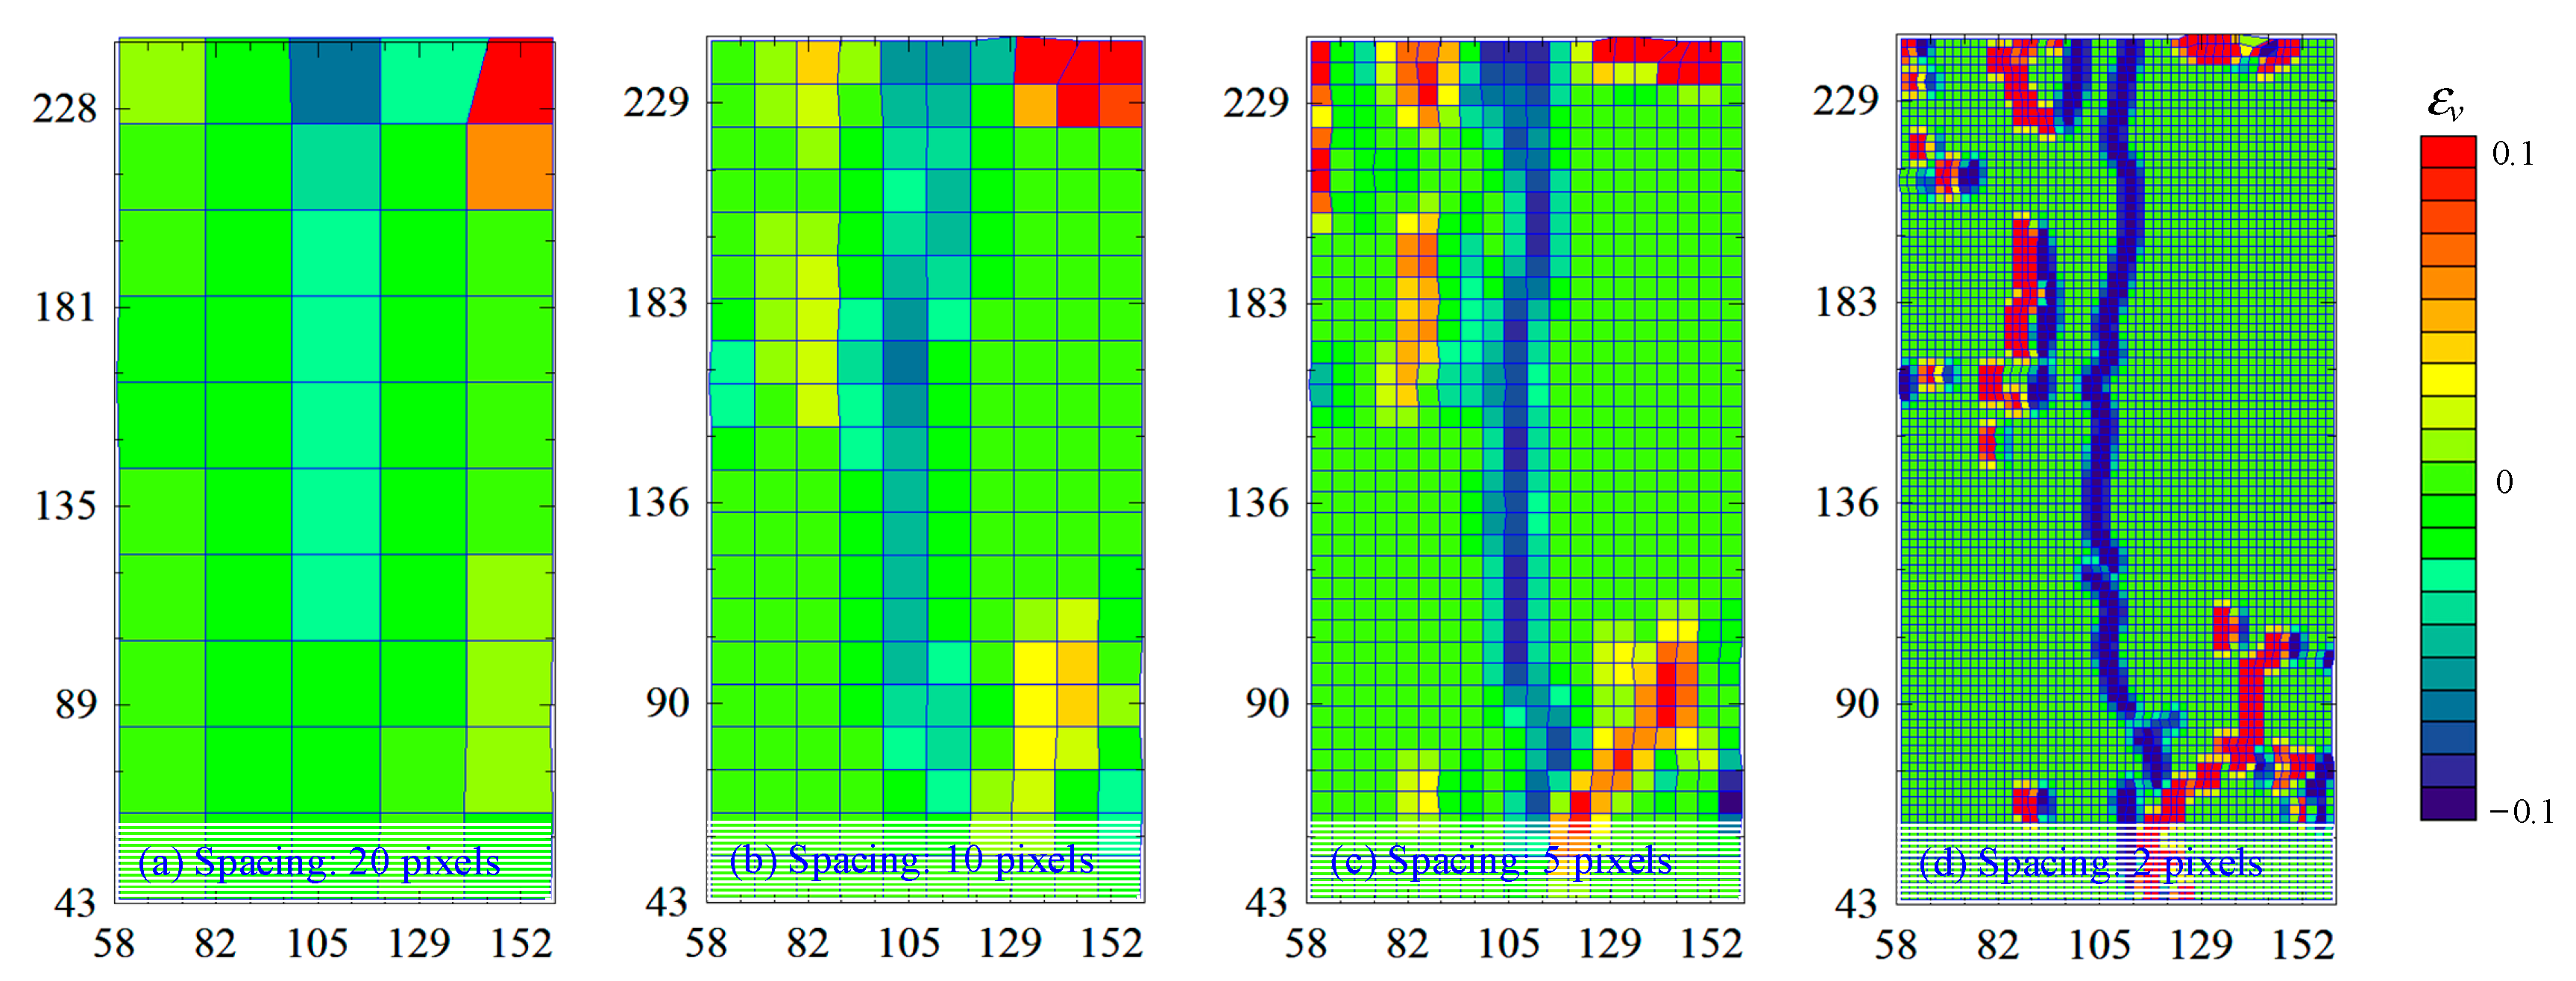
4.2. Mesh Density
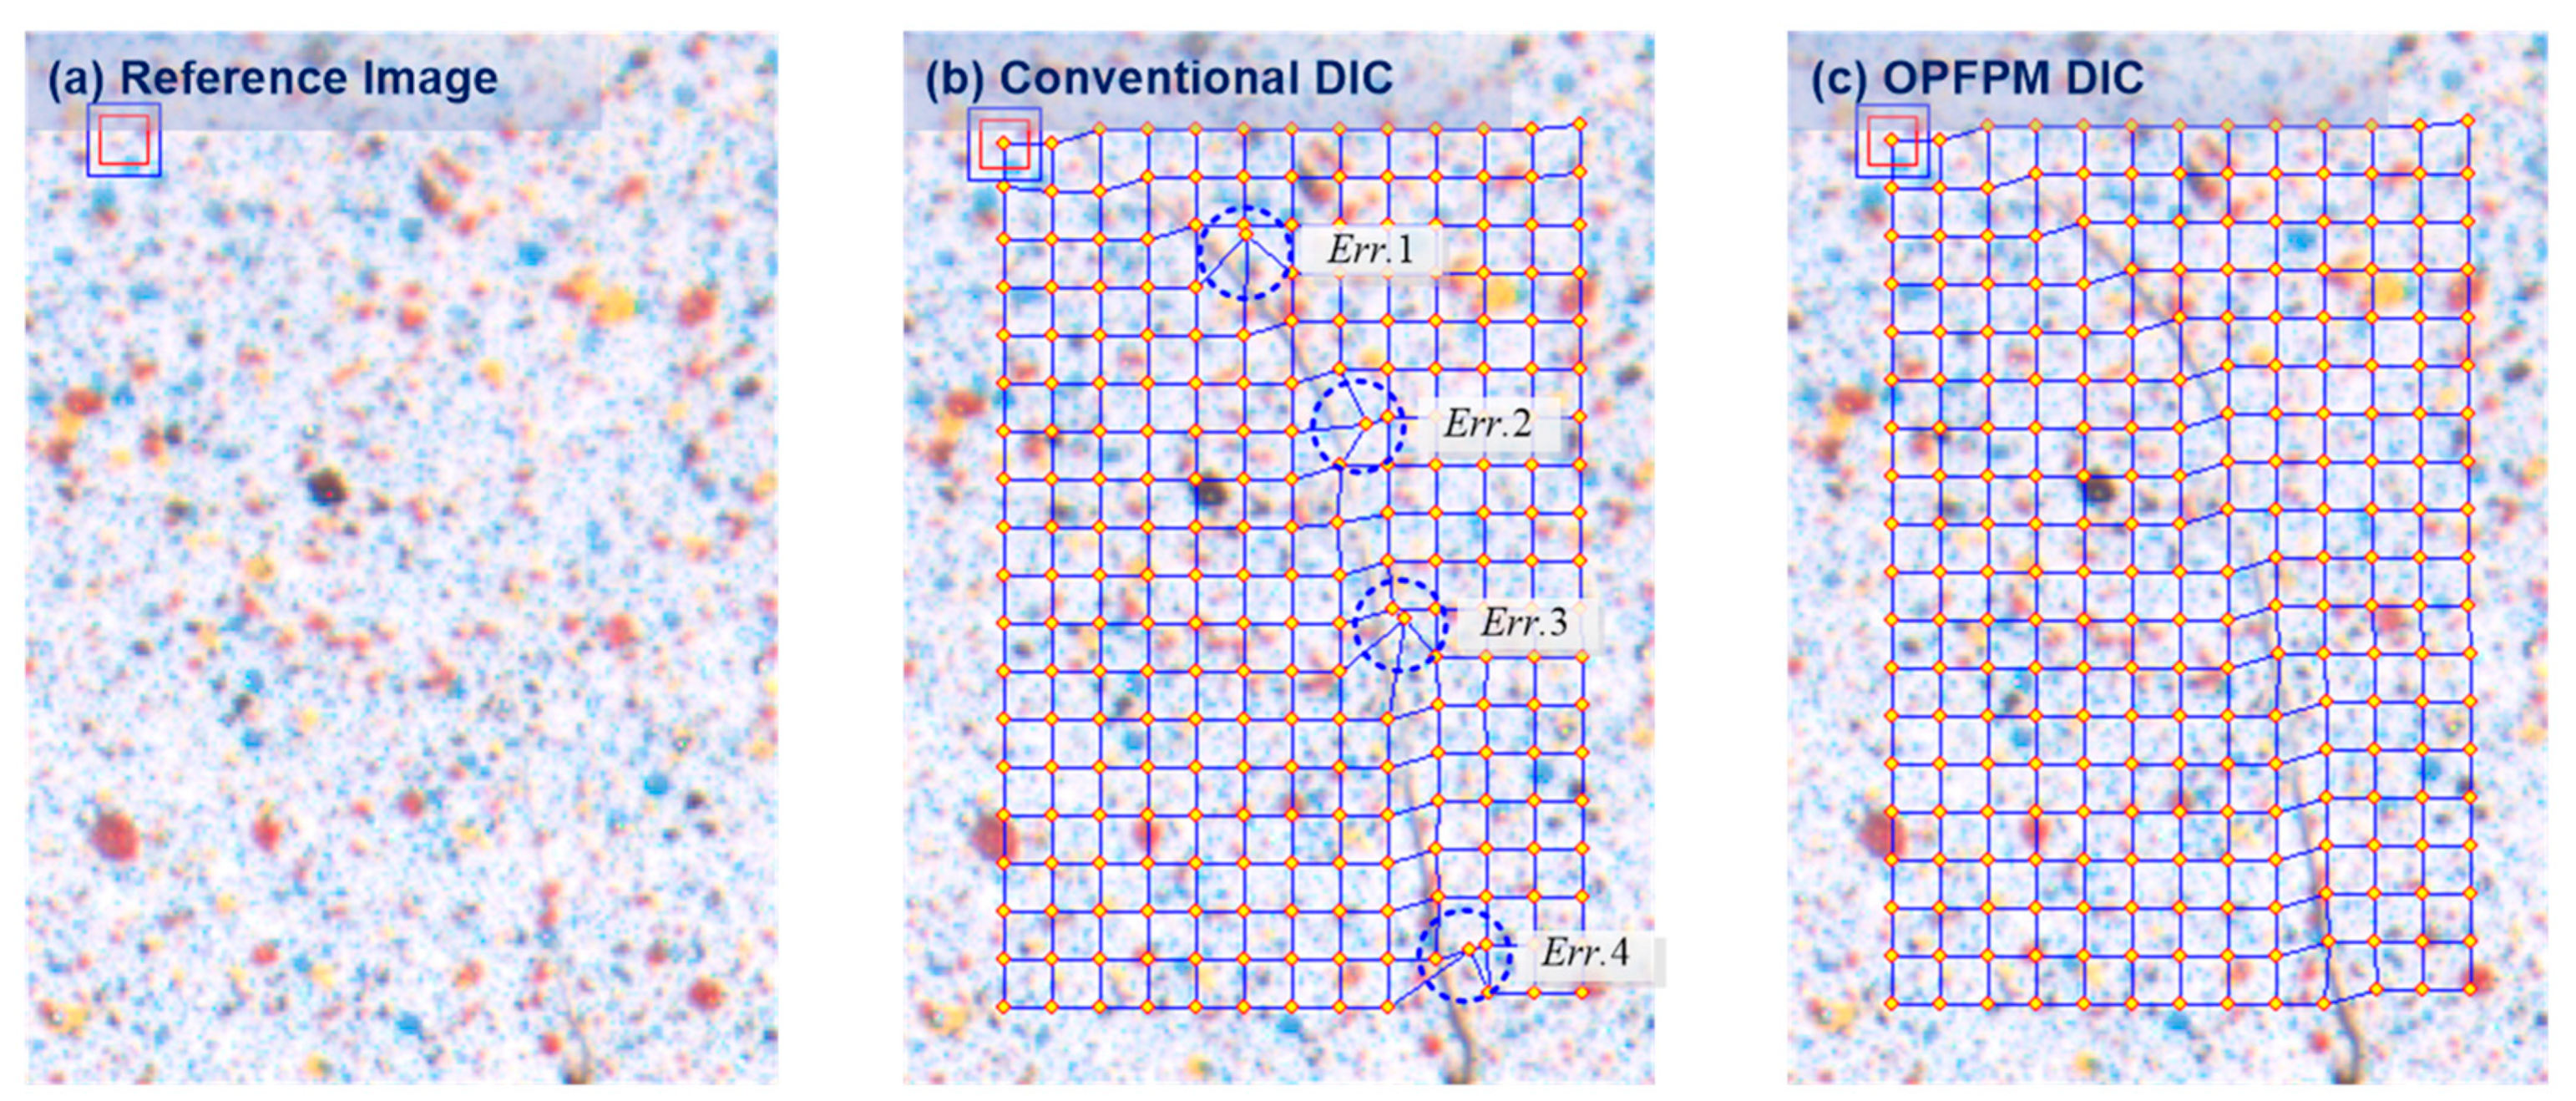
4.3. OPFPM Mode (Advanced Function in DIC)
5. Results
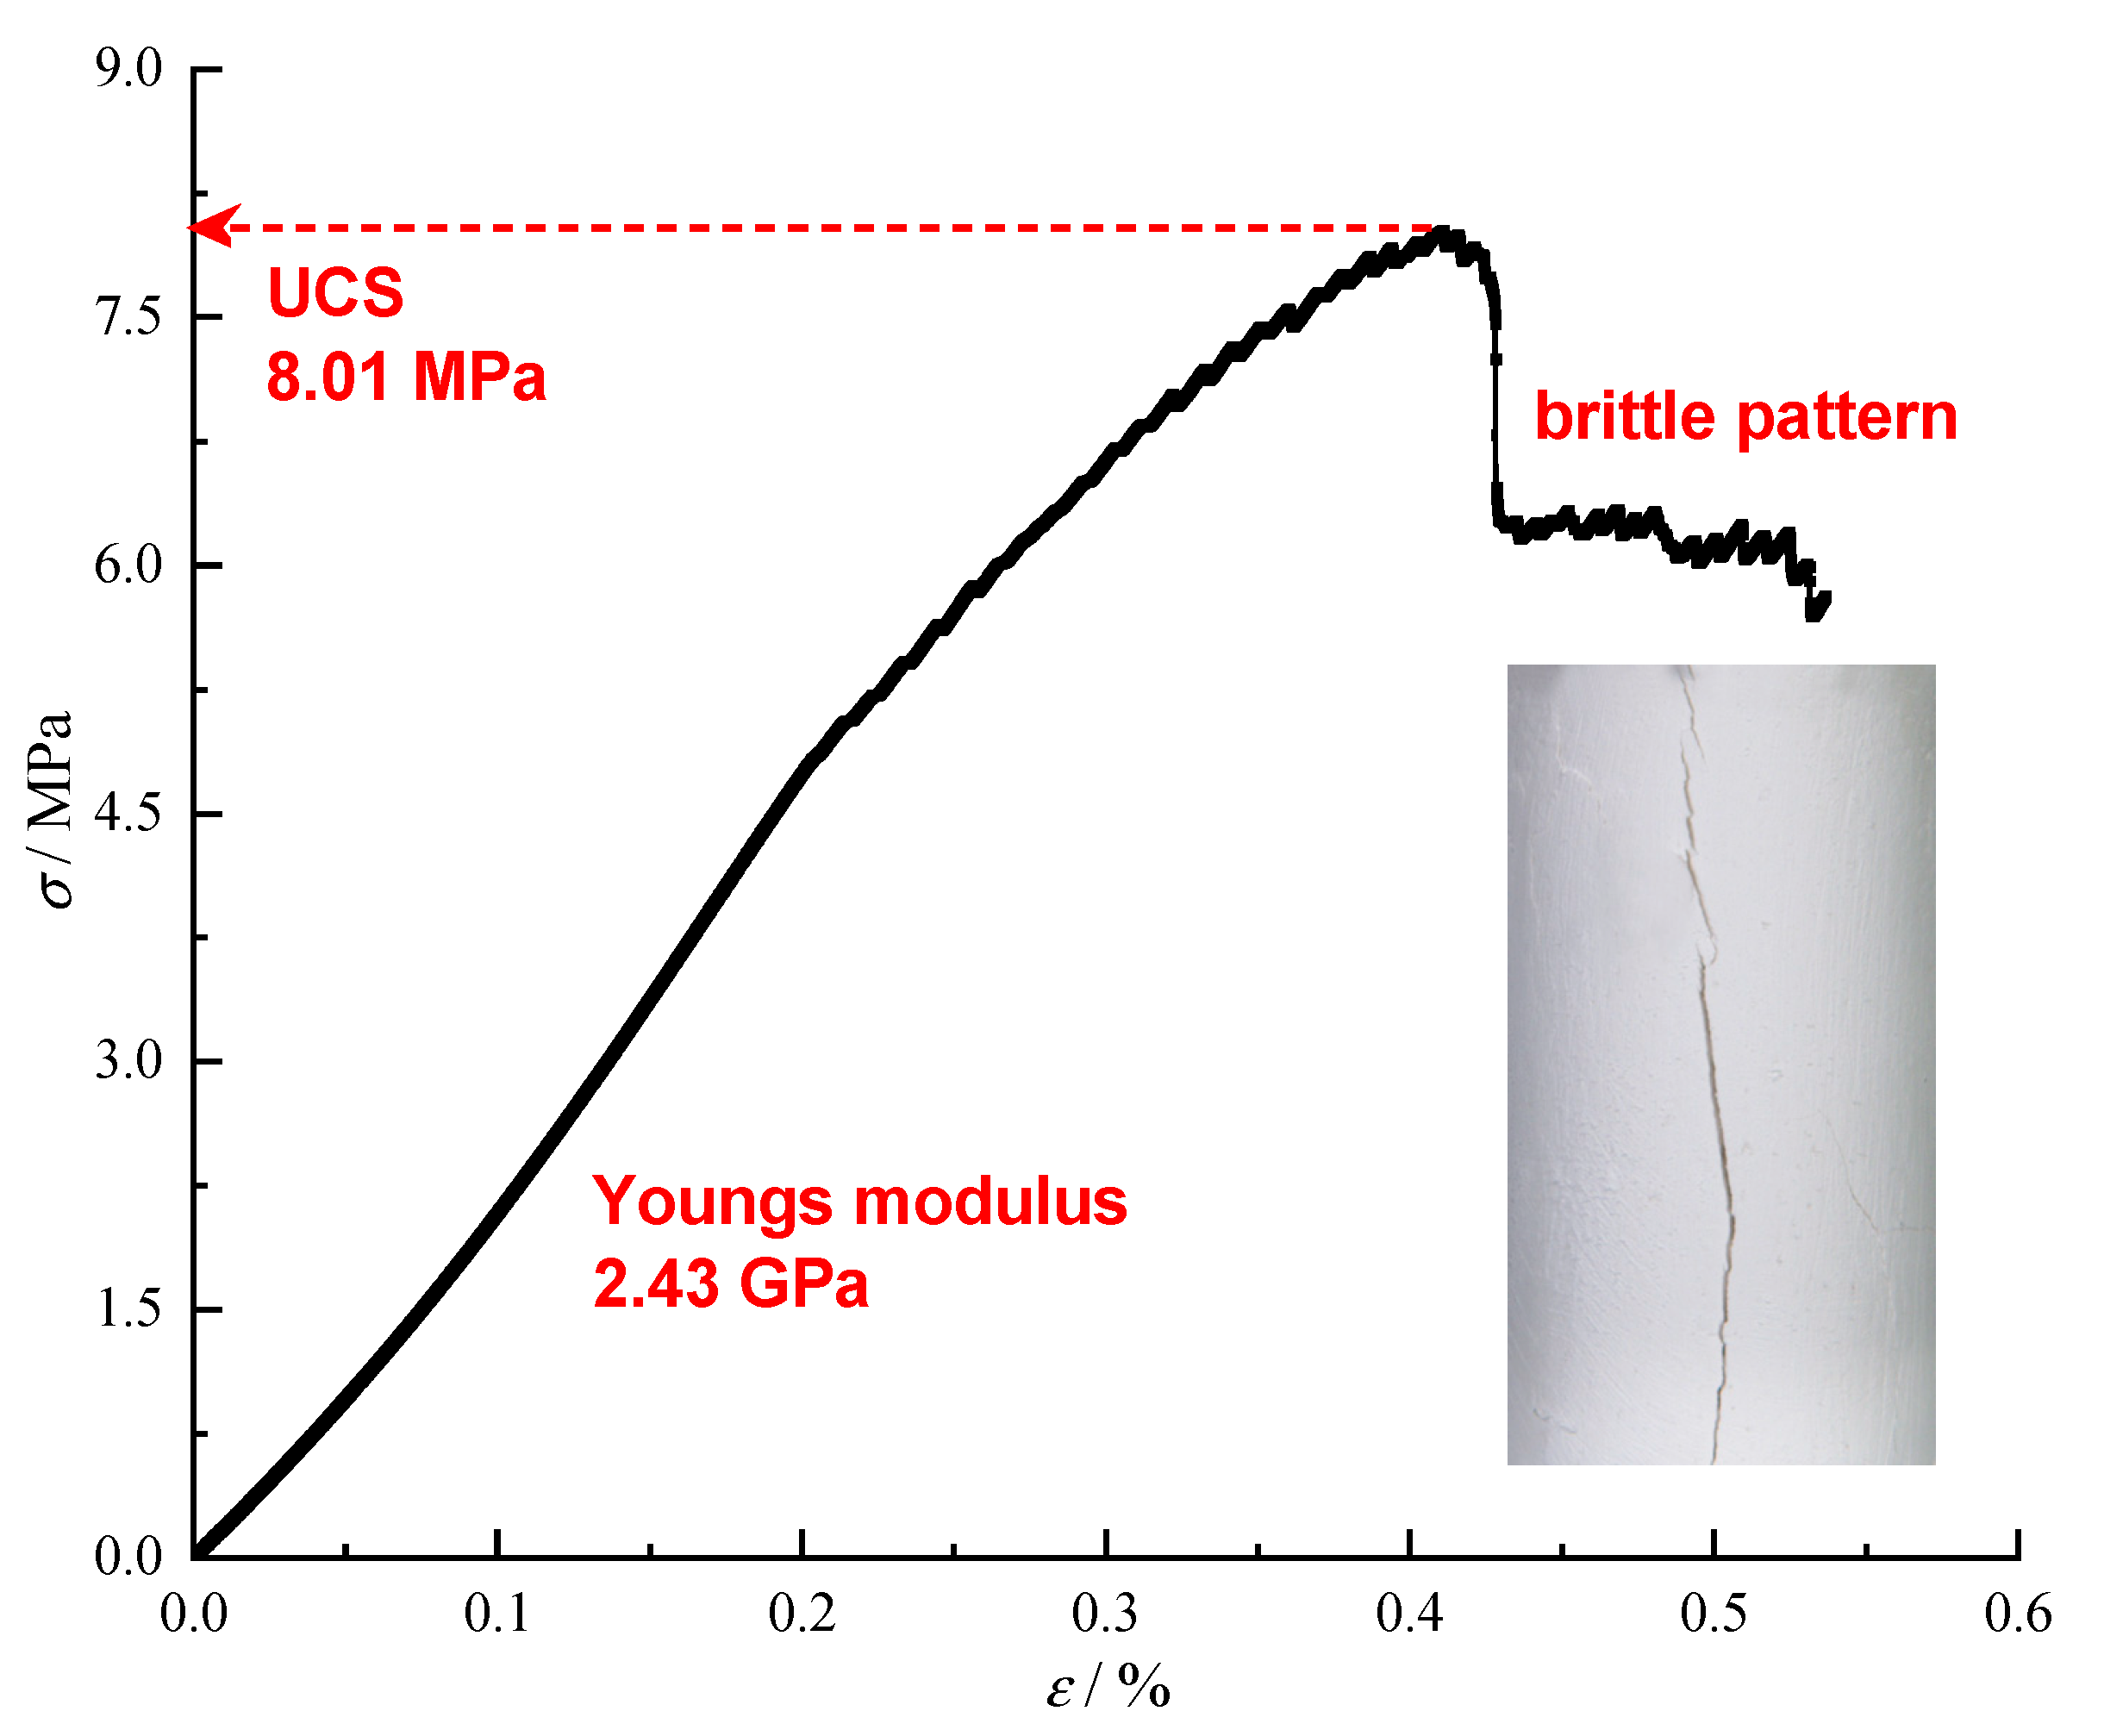
5.1. Mechanical Properties
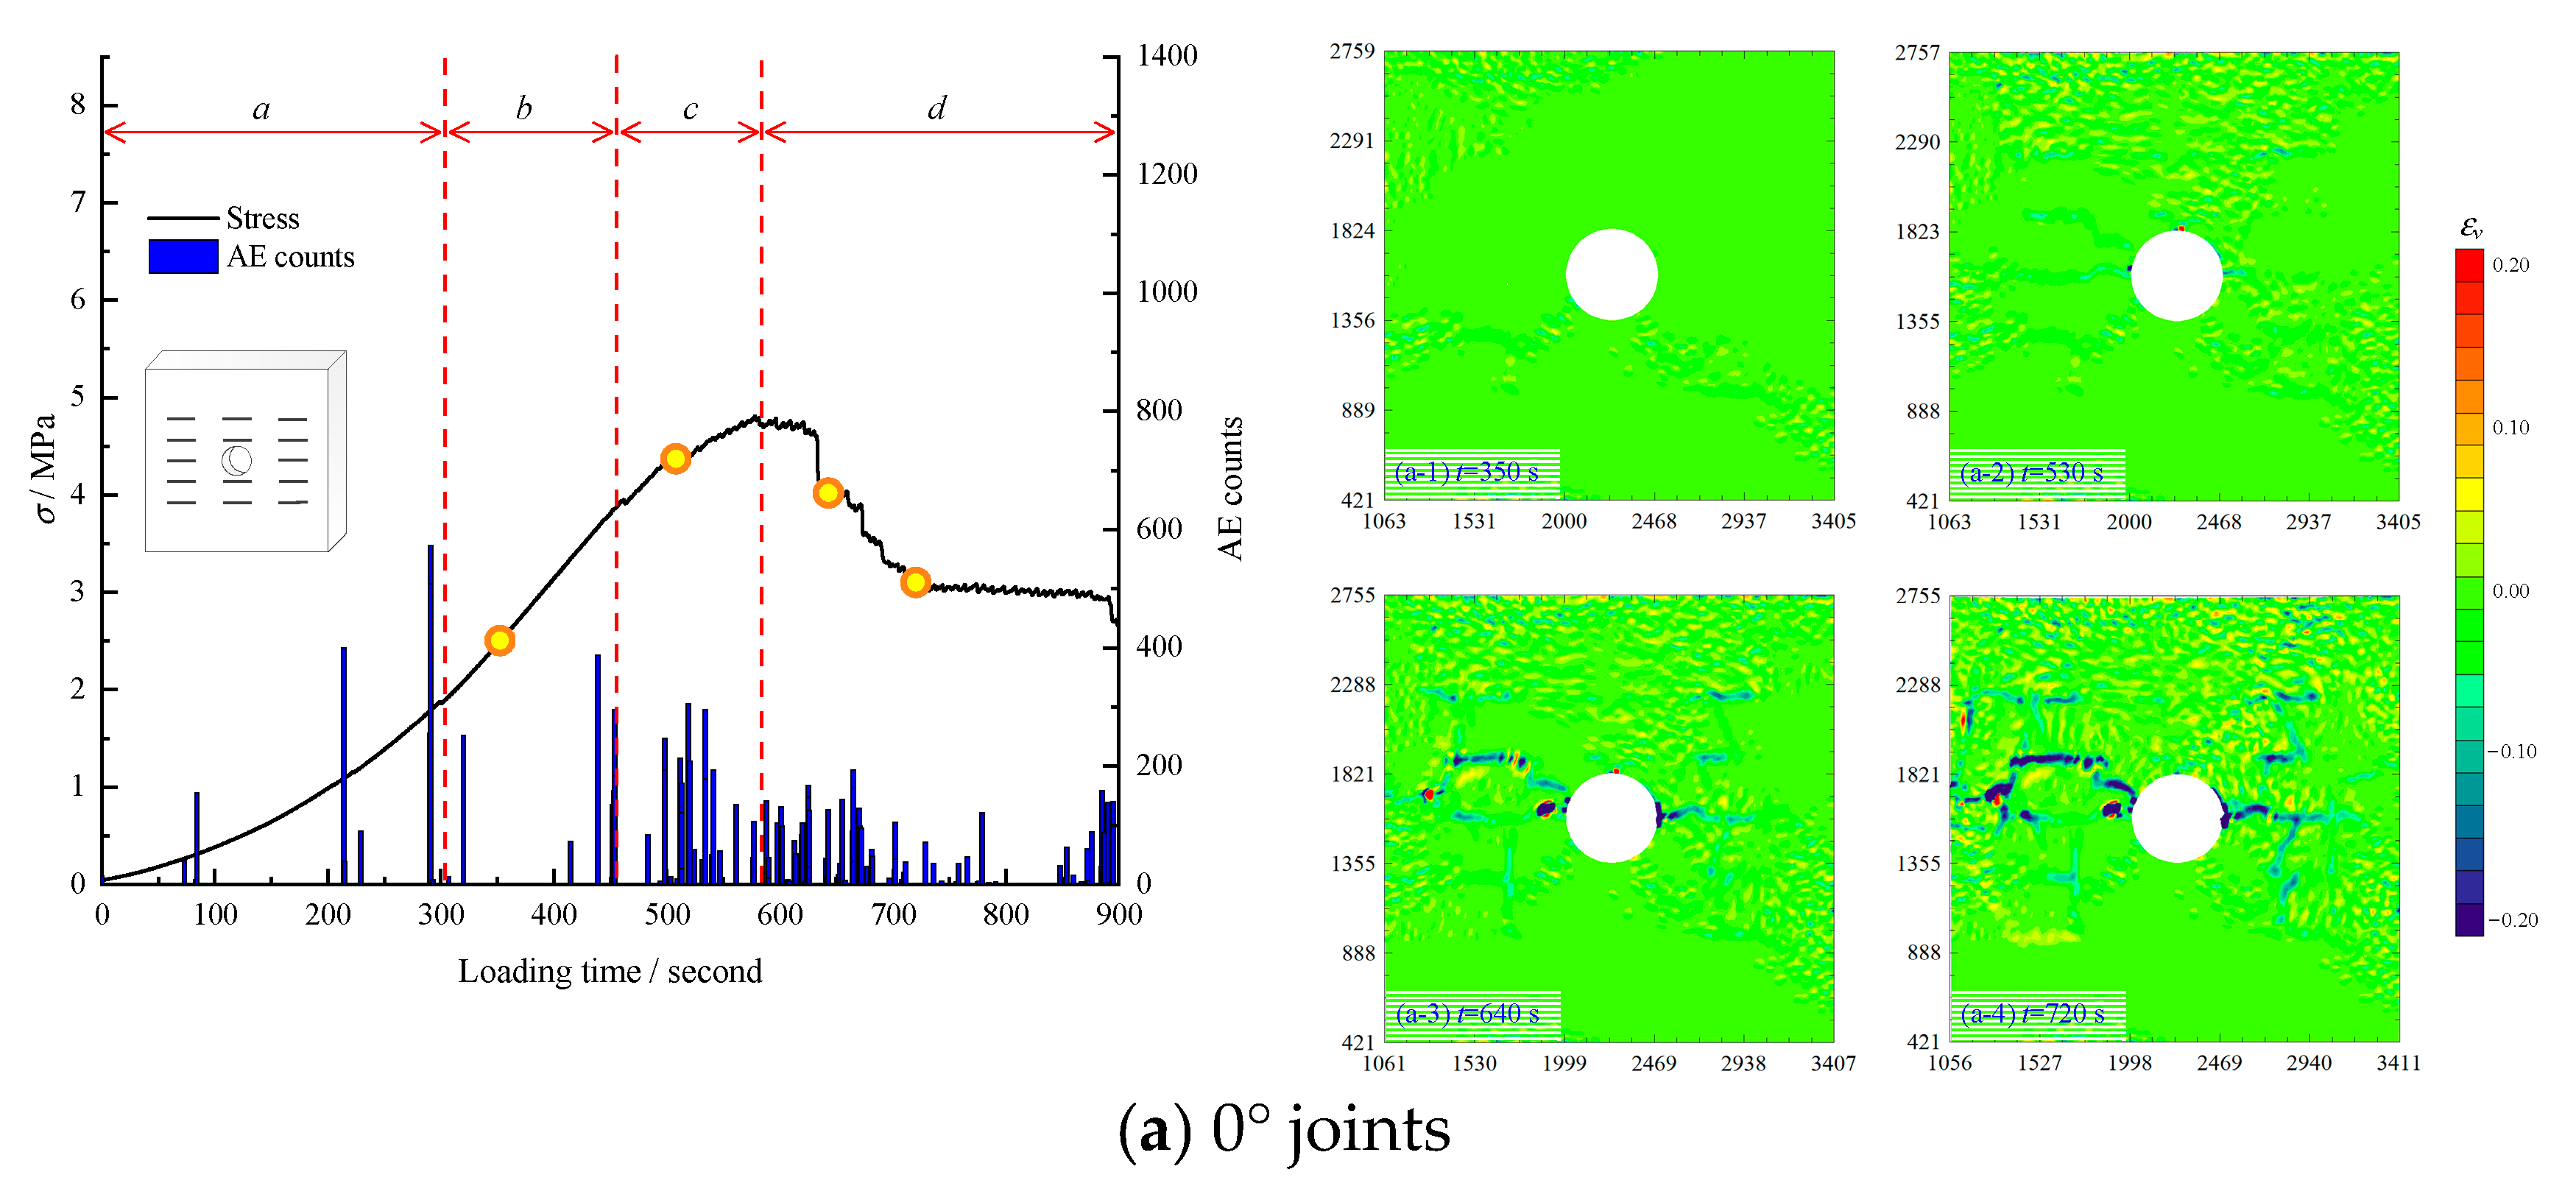
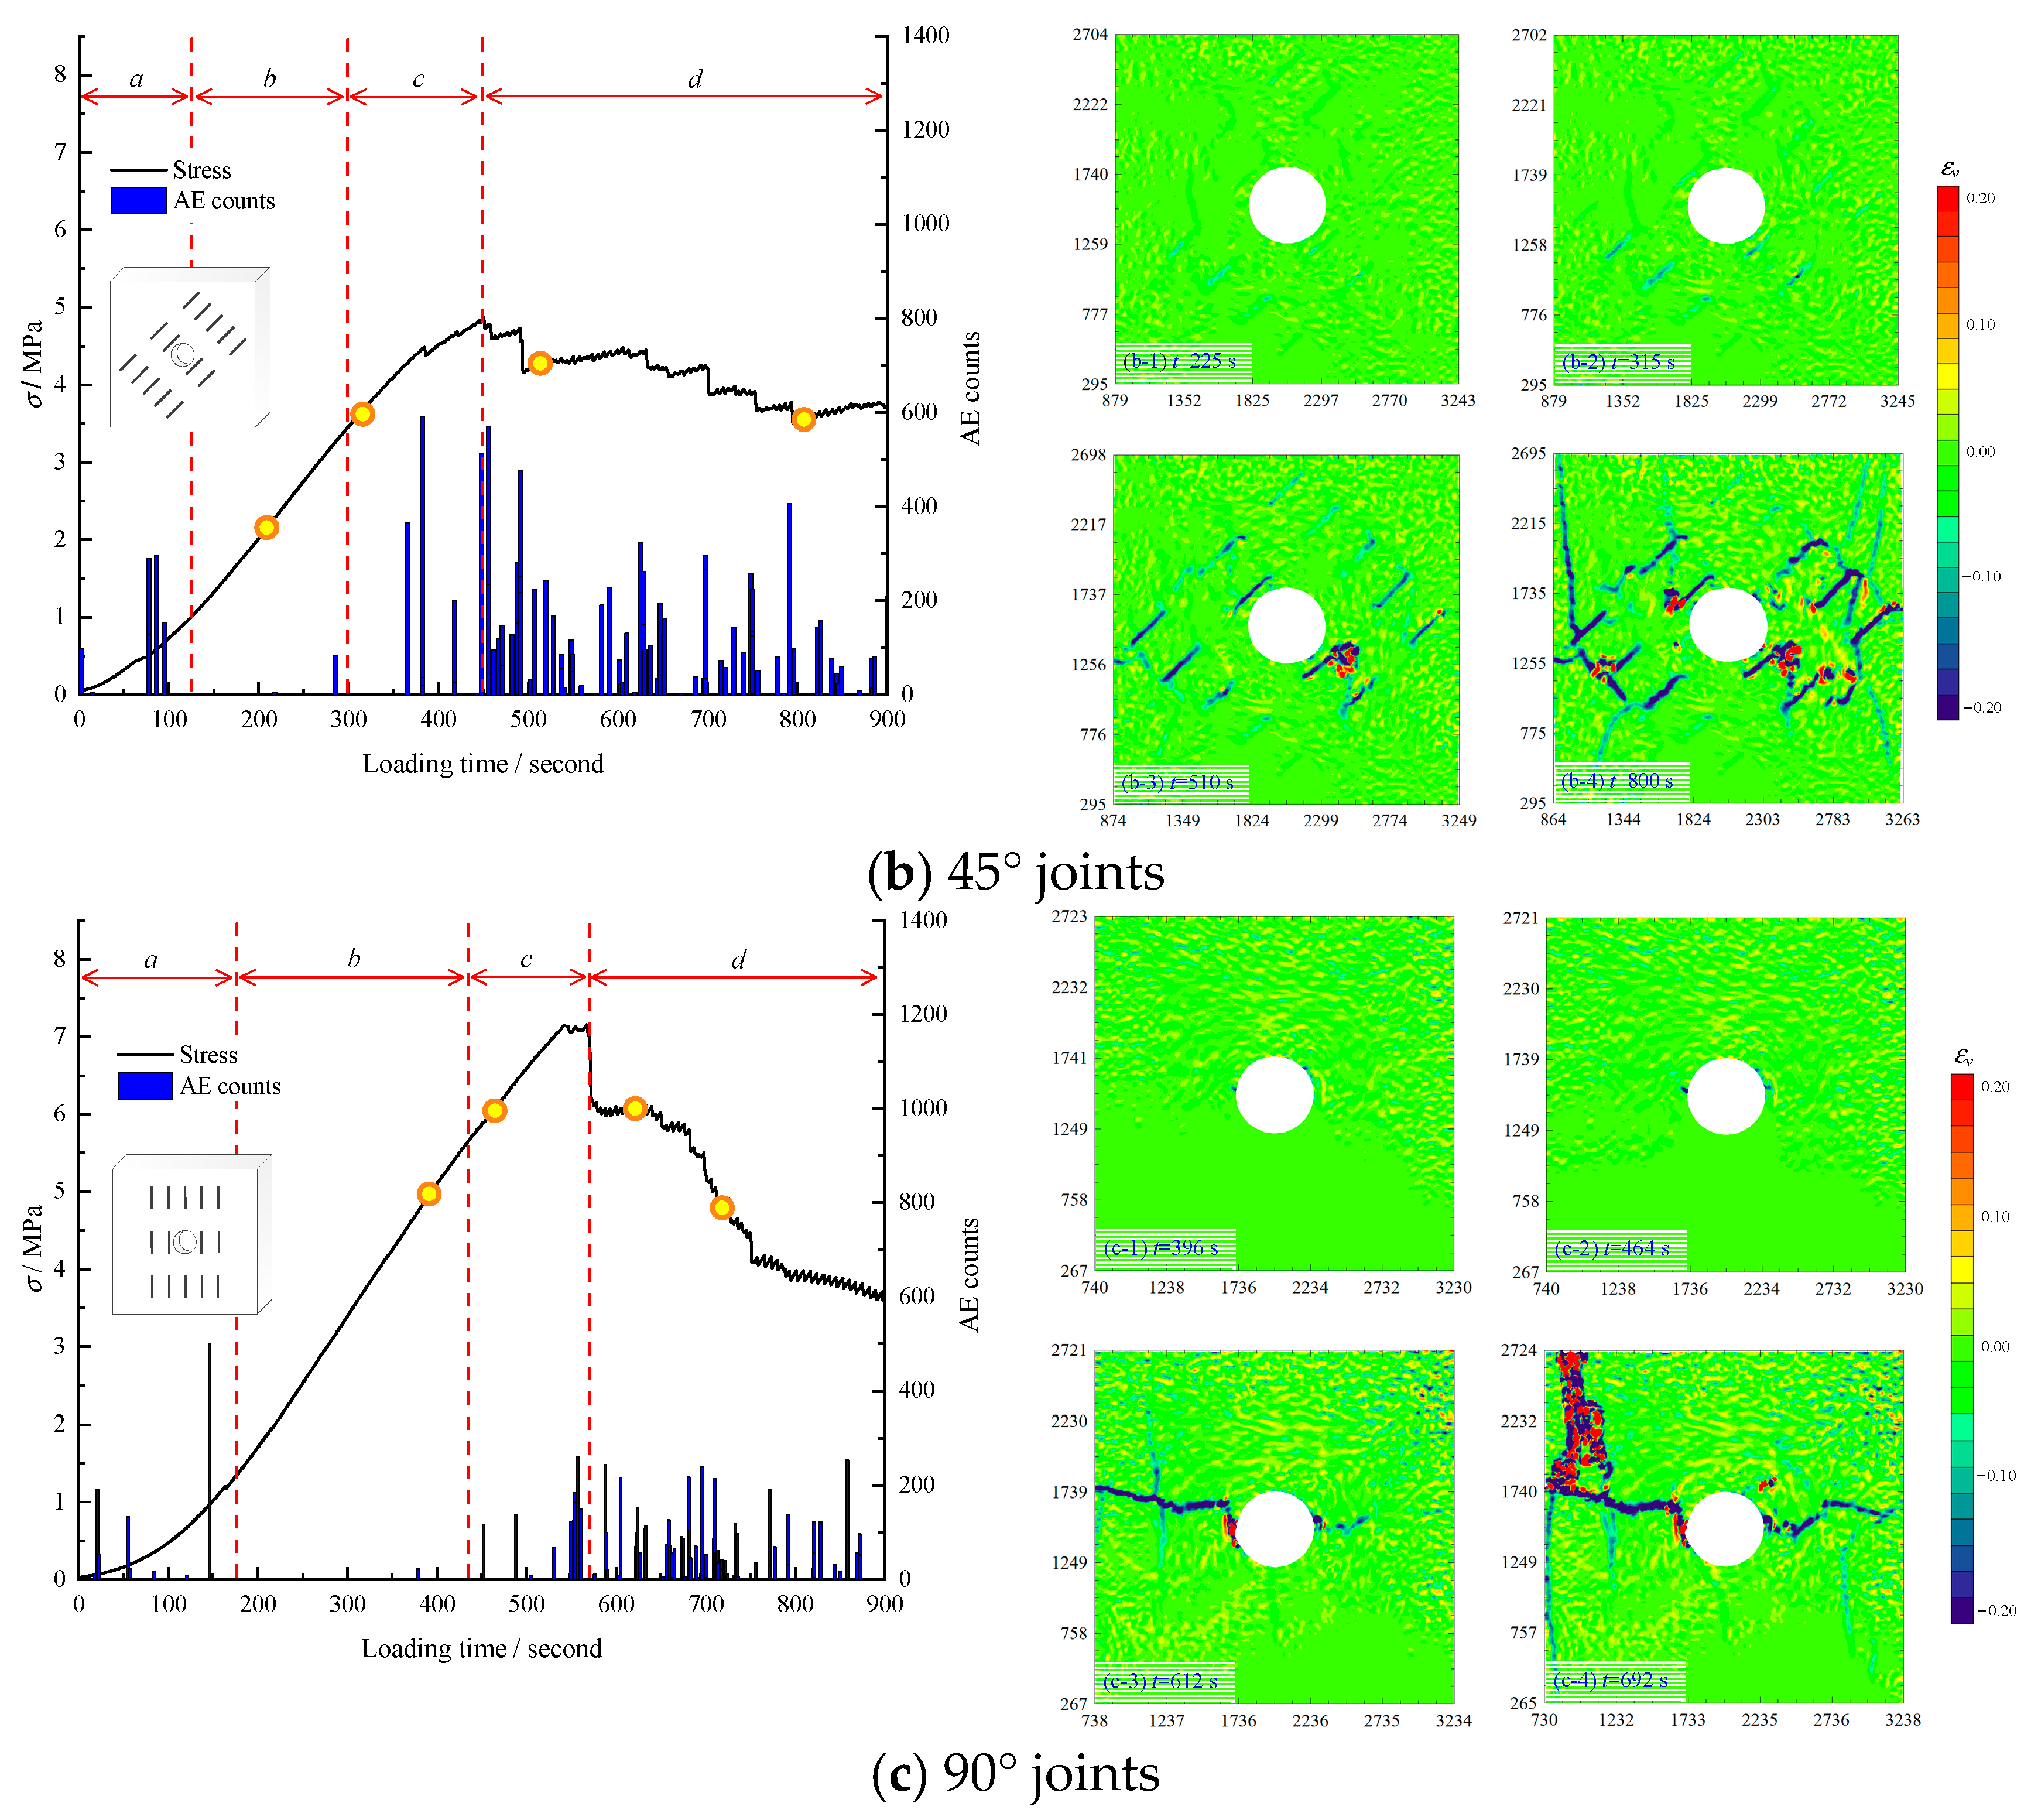
5.2. Failure Behaviour
6. Conclusions
Author Contributions
Funding
Institutional Review Board Statement
Informed Consent Statement
Data Availability Statement
Conflicts of Interest
References
- Einstein, H.H. Risk and risk analysis in rock engineering. Tunn. Undergr. Space Technol. 1996, 11, 141–155. [Google Scholar] [CrossRef]
- Qian, Q.; Lin, P. Safety risk management of underground engineering in China: Progress, challenges and strategies. J. Rock Mech. Geotech. Eng. 2016, 8, 423–442. [Google Scholar] [CrossRef]
- Singh, M.; Rao, K.S.; Ramamurthy, T. Strength and deformational behaviour of a jointed rock mass. Rock Mech. Rock Eng. 2002, 35, 45–64. [Google Scholar] [CrossRef]
- Singh, M.; Rao, K.S. Empirical methods to estimate the strength of jointed rock masses. Eng. Geol. 2005, 77, 127–137. [Google Scholar] [CrossRef]
- Justo, J.L.; Justo, E.; Azañón, J.M.; Durand, P.; Morales, A. The use of rock mass classification systems to estimate the modulus and strength of jointed rock. Rock Mech. Rock Eng. 2010, 43, 287–304. [Google Scholar] [CrossRef]
- Zhang, L.; Chao, W.; Liu, Z.; Cong, Y.; Wang, Z. Crack propagation characteristics during progressive failure of circular tunnels and the early warning thereof based on multi-sensor data fusion. Geomech. Geophys. Geo-Energy Geo-Resour. 2022, 8, 172. [Google Scholar] [CrossRef]
- Yang, X.X.; Jing, H.W.; Tang, C.A.; Yang, S.Q. Effect of parallel joint interaction on mechanical behavior of jointed rock mass models. Int. J. Rock Mech. Min. Sci. 2017, 92, 40–53. [Google Scholar] [CrossRef]
- Goodman, R.E.; Taylor, R.L.; Brekke, T.L. A model for the mechanics of jointed rock. J. Soil Mech. Found. Div. 1968, 94, 637–659. [Google Scholar] [CrossRef]
- Shen, W.Q.; Shao, J.F. An elastic—Plastic model for porous rocks with two populations of voids. Comput. Geotech. 2016, 76, 194–200. [Google Scholar] [CrossRef]
- Zhou, H.; Jia, Y.; Shao, J.F. A unified elastic—Plastic and viscoplastic damage model for quasi-brittle rocks. Int. J. Rock Mech. Min. Sci. 2008, 45, 1237–1251. [Google Scholar] [CrossRef]
- Prudencio, M.; Jan, M.V.S. Strength and failure modes of rock mass models with non-persistent joints. Int. J. Rock Mech. Min. Sci. 2007, 44, 890–902. [Google Scholar] [CrossRef]
- Bobet, A.; Einstein, H.H. Fracture coalescence in rock-type materials under uniaxial and biaxial compression. Int. J. Rock Mech. Min. Sci. 1998, 35, 863–888. [Google Scholar] [CrossRef]
- Bahaaddini, M.; Sharrock, G.; Hebblewhite, B.K. Numerical investigation of the effect of joint geometrical parameters on the mechanical properties of a non-persistent jointed rock mass under uniaxial compression. Comput. Geotech. 2013, 49, 206–225. [Google Scholar] [CrossRef]
- Chen, M.; Zang, C.W.; Ding, Z.W.; Zhou, G.L.; Jiang, B.Y.; Zhang, G.C.; Zhang, C.P. Effects of confining pressure on deformation failure behavior of jointed rock. J. Cent. S. Univ. 2022, 29, 1305–1319. [Google Scholar] [CrossRef]
- Lajtai, E.Z.; Carter, B.J.; Duncan, E.J.S. Mapping the state of fracture around cavities. Eng. Geol. 1991, 31, 277–289. [Google Scholar] [CrossRef]
- Martin, C.D. Seventeenth Canadian Geotechnical Colloquium: The effect of cohesion loss and stress path on brittle rock. Can. Geotech. J. 1997, 34, 698–725. [Google Scholar] [CrossRef]
- Lin, Q.; Cao, P.; Cao, R.; Lin, H.; Meng, J. Mechanical behavior around double circular openings in a jointed rock mass under uniaxial compression. Arch. Civ. Mech. Eng. 2020, 20, 19. [Google Scholar] [CrossRef]
- Liu, S.; Liu, H.; Liu, H.; Xia, Z.; Zhao, Y.; Zhai, J. Numerical simulation of mesomechanical properties of limestone containing dissolved hole and persistent joint. Theor. Appl. Fract. Mech. 2022, 122, 103572. [Google Scholar] [CrossRef]
- Zhang, K.; Liu, X.; Liu, W.; Zhang, S. Influence of weak inclusions on the fracturing and fractal behavior of a jointed rock mass containing an opening: Experimental and numerical studies. Comput. Geotech. 2021, 132, 104011. [Google Scholar] [CrossRef]
- Chen, M.; Yang, S.; Pathegama Gamage, R.; Yang, W.; Yin, P.; Zhang, Y.; Zhang, Q. Fracture processes of rock-like specimens containing nonpersistent fissures under uniaxial compression. Energies 2018, 12, 79. [Google Scholar] [CrossRef]
- Carroll, J.D.; Abuzaid, W.; Lambros, J.; Sehitoglu, H. High resolution digital image correlation measurements of strain accumulation in fatigue crack growth. Int. J. Fatigue 2013, 57, 140–150. [Google Scholar] [CrossRef]
- Yang, L.; Hou, C.; Zhu, W.; Liu, X.; Yan, B.; Li, L. Monitoring the failure process of cemented paste backfill at different curing times by using a digital image correlation technique. Constr. Build. Mater. 2022, 346, 128487. [Google Scholar] [CrossRef]
- Li, D.; Zhu, Q.; Zhou, Z.; Li, X.; Ranjith, P.G. Fracture analysis of marble specimens with a hole under uniaxial compression by digital image correlation. Eng. Fract. Mech. 2017, 183, 109–124. [Google Scholar] [CrossRef]
- Chen, M.; Zhang, Y.L.; Zhang, G.C.; Wang, X.S.; Yang, S.Q.; Liu, Z.H.; Yang, S. Study on the mechanical response and failure behavior of the rock-like material with hole-bolt composite structure. Constr. Build. Mater. 2024, 428, 136257. [Google Scholar] [CrossRef]
- Li, B.Q.; Einstein, H.H. Comparison of visual and acoustic emission observations in a four point bending experiment on barre granite. Rock Mech. Rock Eng. 2017, 50, 2277–2296. [Google Scholar] [CrossRef]
- Li, Y.H.; Tang, X.J.; Zhu, H.H. Optimization of the digital image correlation method for deformation measurement of geomaterials. Acta Geotech. 2022, 17, 5721–5737. [Google Scholar] [CrossRef]


Disclaimer/Publisher’s Note: The statements, opinions and data contained in all publications are solely those of the individual author(s) and contributor(s) and not of MDPI and/or the editor(s). MDPI and/or the editor(s) disclaim responsibility for any injury to people or property resulting from any ideas, methods, instructions or products referred to in the content. |
© 2024 by the authors. Licensee MDPI, Basel, Switzerland. This article is an open access article distributed under the terms and conditions of the Creative Commons Attribution (CC BY) license (https://creativecommons.org/licenses/by/4.0/).
Share and Cite
Yan, X.; Liu, Y.; Yang, S.; Jin, Y.; Chen, M. Experimental Investigation on Failure Characteristics of Pre-Holed Jointed Rock Mass Assisted with AE and DIC. Appl. Sci. 2024, 14, 7655. https://doi.org/10.3390/app14177655
Yan X, Liu Y, Yang S, Jin Y, Chen M. Experimental Investigation on Failure Characteristics of Pre-Holed Jointed Rock Mass Assisted with AE and DIC. Applied Sciences. 2024; 14(17):7655. https://doi.org/10.3390/app14177655
Chicago/Turabian StyleYan, Xiaoming, Yixing Liu, Shuo Yang, Yuhao Jin, and Miao Chen. 2024. "Experimental Investigation on Failure Characteristics of Pre-Holed Jointed Rock Mass Assisted with AE and DIC" Applied Sciences 14, no. 17: 7655. https://doi.org/10.3390/app14177655