Article

The Effect of Diagenetic Modifications on Porosity Development in the Upper Ordovician to Lower Silurian Wufeng and Longmaxi Formations, Southeast Sichuan Basin, China

1
State Key Laboratory of Shale Oil and Gas Enrichment Mechanisms and Efficient Development, Beijing 102206, China
2
SINOPEC Key Laboratory of Geology and Resources in Deep Stratum, Beijing 102206, China
3
School of Earth Resources, China University of Geosciences, Wuhan 430074, China
*
Authors to whom correspondence should be addressed.
Appl. Sci. 2024, 14(17), 7661; https://doi.org/10.3390/app14177661 (registering DOI)
Submission received: 9 July 2024 / Revised: 26 August 2024 / Accepted: 27 August 2024 / Published: 30 August 2024

Abstract

:
Diagenesis has been demonstrated to significantly affect porosity development in shale reservoirs, however, the effect of diagenetic modifications on shale pore structures is still unclear. For clarifying this issue, this paper focuses on the Upper Ordovician to Lower Silurian Wufeng and Longmaxi shales, which are the only commercially gas-produced shale plays in China. This study aims to reveal the influence of diagenetic alterations on the WF-LMX shale reservoir quality by integrating total organic carbon (TOC) content, X-ray diffraction (XRD), low-temperature gas (N2) and carbon dioxide (CO2) adsorption experiments, field-emission scanning electron microscopy (FE-SEM), energy dispersive X-ray (EDS), and cathodoluminescence (CL) analyses. Three major shale lithofacies were identified, mainly including siliceous, siliceous–argillaceous mixed, and argillaceous shale; the siliceous shale has a relatively high TOC content. The organic pores, intergranular pores, intragranular pores, and fractures are generally developed in the WF-LMX shales. The pore volume (PV) and specific surface area (SSA) of micropores, mesopores, and macropores of siliceous shales are higher than those of mixed shales and argillaceous shales. The TOC content has a strongly positive correlation with PV and SSA for micropores and mesopores. After combustion, the PV and SSA of micropores and mesopores were decreased, whereas the PV and SSA of macropore were significantly increased. In the siliceous shale, organic pore is the dominant pore type due to the fact that a large amount of authigenic microcrystalline quartz aggregates can protect organic pores from compaction. The argillaceous shale has high clay and low TOC content, and the dominant pore type is pores between clay flakes. The siliceous shale has a relatively high TOC content, large PV and SSA, and so are the dessert lithofacies for shale gas exploration.

1. Introduction

In the past decades, unconventional resources, especially shale oil and gas, have played an increasing role in the world’s fossil fuel demand market. In China, annual shale gas production exceeded 200 × 108 m3 in 2020, and most of the shale gas was produced from the Silurian–Ordovician Wufeng–Longmaxi (WF-LMX) formations in the Sichuan Basin and adjacent areas, southwest China [1]. The WF-LMX formations are a set of high-quality shale gas-producing layers with huge hydrocarbon generation and storage capacity [2,3], and these successions were characterized by high TOC content, high thermal maturity, and varying mineral compositions [4,5], leading to complicated diagenetic pathways and pore structure systems.
The shale reservoir pore systems have been fairly characterized by many studies [6,7,8], and four major types of pores were identified, including organic matter pores, interparticle pores, intraparticle pores and microfractures [8,9]. In shale reservoirs, diagenesis including mechanical and chemical modifications after deposition greatly affects porosity development either by destroying primary porosity or generating secondary porosity [10,11,12,13]. During the burial process, with the change in temperature, pressure, and other conditions, the reservoir was modified by compaction, cementation, types of clay mineral, clay mineral transformation, thermal maturation of organic matter, and dissolution, and the porosity of shale and coal beds could be affected [7,14,15,16,17,18,19]. Due to the different primary TOC and mineral composition, diagenesis has different effects on the pore structure, and it is necessary to build the relationship between shale lithofacies and diagenetic pathways that control pore development.
The aims of this study are twofold. First, the pore structure and controlling factors were characterized by applying a suite of analytical techniques, including low-pressure gas adsorption and high-resolution scanning electron microscope (SEM). Second, with the application of SEM, energy dispersive spectroscopy (EDS), and cathodoluminescence (CL) technique, the major diagenetic reactions were identified, and the effect of diagenetic alterations on porosity development was discussed. Moreover, this study suggests the application of the combustion method to completely remove organic matter, and then calculate the pore volume (PV) and specific surface area (SSA) that the organic matter can contribute by comparing pore structure parameters between pre-combustion and after-combustion samples. This study is of great significance to understand porosity evolution mechanisms in different shale lithofacies.

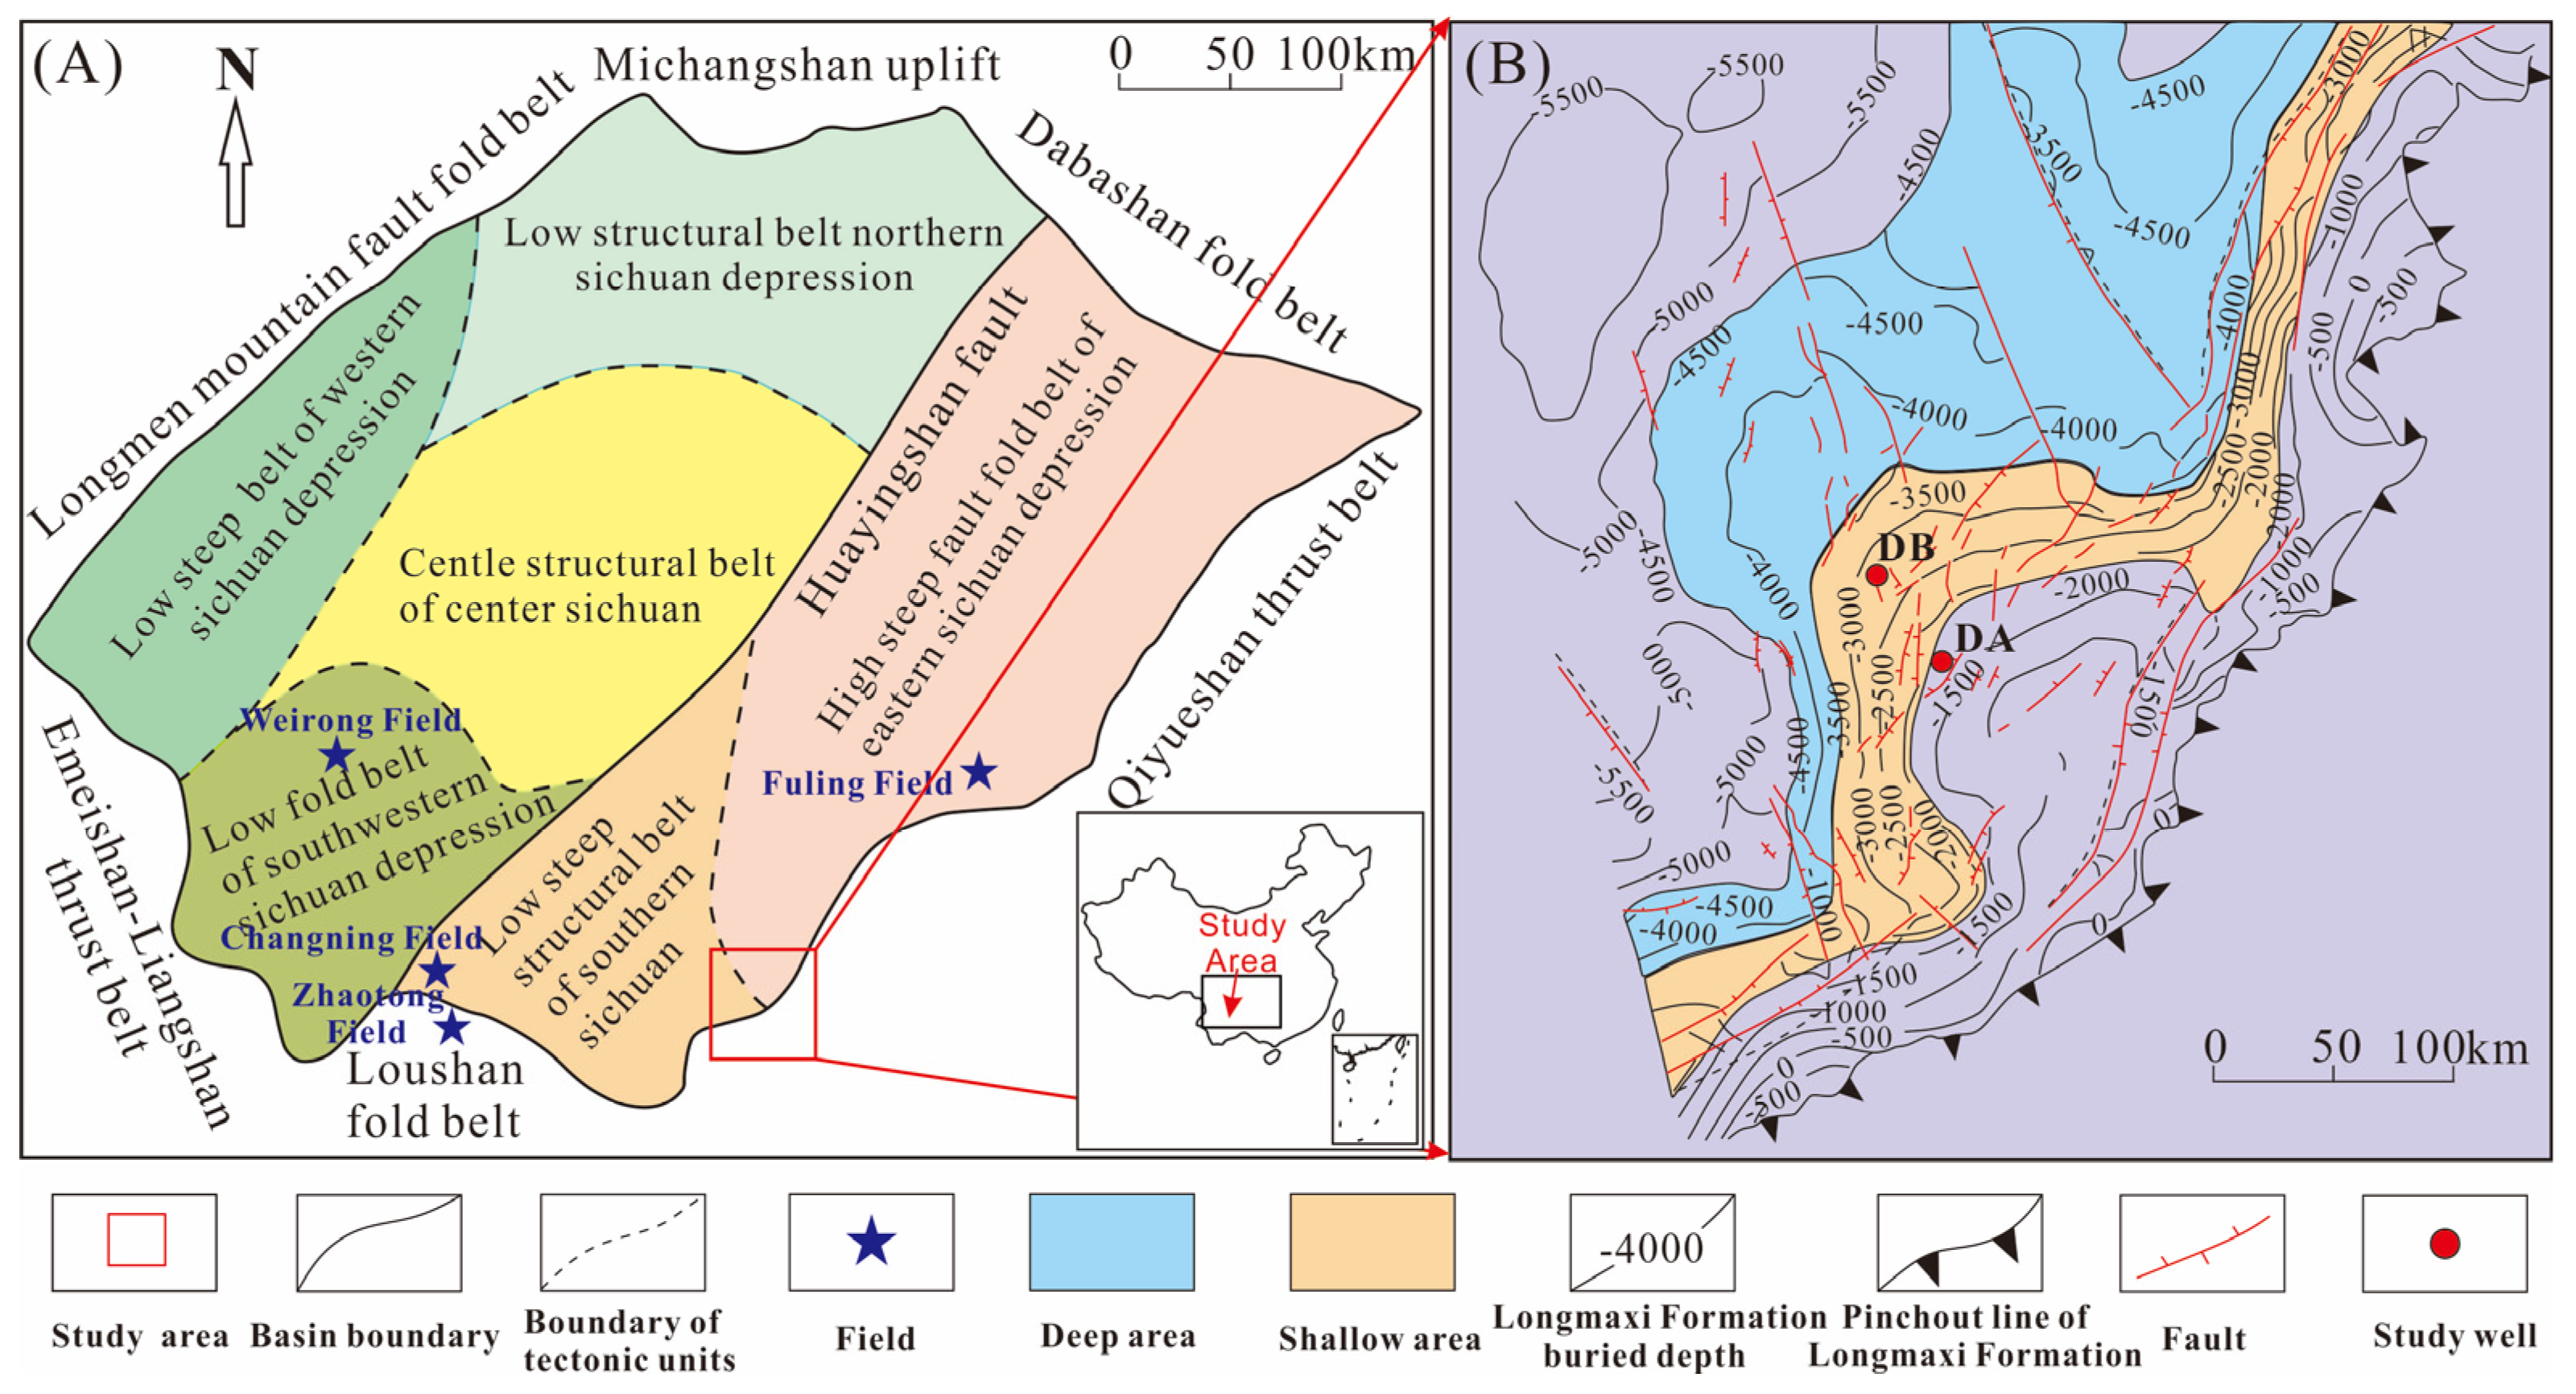
2. Geological Setting

The Sichuan Basin in southwest China is bounded on the northeast by the Dabashan fold belt, on the southeast by the Qiyueshan thrust fault, on the northwest by the Longmenshan thrust belt, and on the southwest by the Emeishan–Liangshan thrust belt (Figure 1A) [20]. This basin has experienced the Caledonian, Hercynian, Indosinian, Yanshanian, and Himalayan tectonic movements, and can be divided into several tectonic units [16]. The Dingshan area is located in the southeast of the Sichuan Basin, and this area has developed a high steep anticlinal zone and a fault zone [21,22,23] (Figure 1B).
From the Late Ordovician to the Early Silurian period, the Sichuan Basin experienced multi-stage tectonic movements, forming the Xuefeng, Qianzhong, and Central Sichuan paleo-uplifts. Two global transgressions led to sea level rise, resulting in the formation of widely distributed organic-rich shales, namely as the WF Formation and the LMX Formation (Figure 2A,B) [24,25]. The upper Ordovician WF Formation mainly developed siliceous shales and calcareous shales with abundant graptolites [26]. Overlying the WF Formation, the Guanyinqiao Formation generally developed a thin shell-rich marl and lime mudstone due to the Hirnantian glaciation [27]. Overlying the Guanyinqiao Formation, the Lower Member of the LMX Formation is characterized by black organic-rich shales with numerous graptolites, whereas the Upper Member is dominated by siltstones, silty mudstones, and argillaceous mudstones. From the bottom to the top of the LMX Formation, TOC content decreases and silty materials increases gradually, suggesting a decreased depositional water depth [28]. Characterized by high TOC content, quartz content, high thermal maturity, and large thickness and area, the WF Formation and the Lower LMX Formation are the primary targets for shale gas development in south China [2].

3. Samples and Analytical Methods

In this study, a total of 54 WF-LMX shale samples were collected from two drilling wells, well DA and well DB (Figure 1B). All the 54 samples were first used to measure TOC content. Samples were crushed into powder (~200 mesh), and approximately 0.1~0.3 g was selected to react with 12.5% HCL in order to remove the inorganic carbon, and finally the residual samples were dried at 60–80 ℃ for ~12 h. Then, the powder samples were placed in the Elemental Rapid CS analytical instrument and burned with oxygen with a purity of 99.9% at a flow rate of 800 mL/min (± 25). The generated CO2 volume was used to calculate the TOC content. Thirty representative samples were selected for X-ray diffraction (XRD) bulk mineral composition analysis using the Bruker AXS D8 Advance X-ray diffraction instrument produced by the German company Bruker (Berlin, German). X’Pert Pro DY2198 X-ray diffraction instrument. Samples were crushed into 200 mesh powder, and then placed in the groove of glass sheets. The flatted glass sheet was scanned from 5° to 80° (2θ) at a rate of 2°/min. The mineral content was semi-quantitatively determined by the difference in the intensity of characteristic diffraction peaks in the X-ray diffraction patterns.
Pore structure parameters, including PV, SSA, and pore size distribution, were calculated from low-temperature nitrogen and carbon dioxide gas adsorption experiments that were performed on the Quantachrome Autosorb-iQ3 instrument. Samples were crushed into small particles (60~80 mesh) and then degassed at 110 ℃ for 8 h to remove the water and volatile substances. For the low-temperature carbon dioxide adsorption experiments, the temperature was kept at 273.15 k, and the relative pressure was set in the range of 0.0004 to 0.03. For the low-temperature nitrogen adsorption experiments, the temperature was kept at 77.3 k, and the relative pressure was from 0.001 to 0.998. The CO2 adsorption–desorption isotherms were used to calculate pore volume and pore size distribution using the density functional theory (DFT) model [29]. The N2 adsorption–desorption isotherms were used to calculate pore volume, pore size distribution, and SSA using the BJH model and BET equation, respectively [30].
The shale sample required for high-resolution field emission scanning electron microscope (FE-SEM) observation was first cut into a plug with the size of 1 cm × 1 cm × 0.5 cm, and then polished by argon ion-milling techniques to reduce the surface roughness that was created during mechanical polish. Then, the polished samples were carbon-coated and placed under the Zeiss Gemini SEM 500 field emission scanning electron microscope instrument for observation with an accelerating voltage of 2–15 kV and a working distance of 5–10 mm. The Back-scattered electron (BSE) and secondary electron (SE) images were used to describe pores and minerals. The energy dispersive X-ray (EDS) was used to identify minerals, and the cathodoluminescence (CL) technique was used to differentiate detrital quartz from quartz cements.
In this study, the combustion method combined with low-temperature gas adsorption experiments were used to characterize organic pores and inorganic pore, respectively. The samples of 60~80 mesh were combusted in a muffle furnace to remove organic matter. After the removal of organic matter, we assumed that organic pores were removed from the samples, and the remaining pores were mostly inorganic pores. The combustion temperature and time were set to 350 °C and 30 h, respectively. The sample particles after combustion were analyzed by low-temperature gas adsorption experiments in order to calculate pore structure parameters that were mainly contributed by inorganic pores. In addition, the particle samples after combustion were consolidated into a plug by epoxy resin, and then the sample plug was polished by the argon ion technique and observed by an SEM instrument.

4. Results

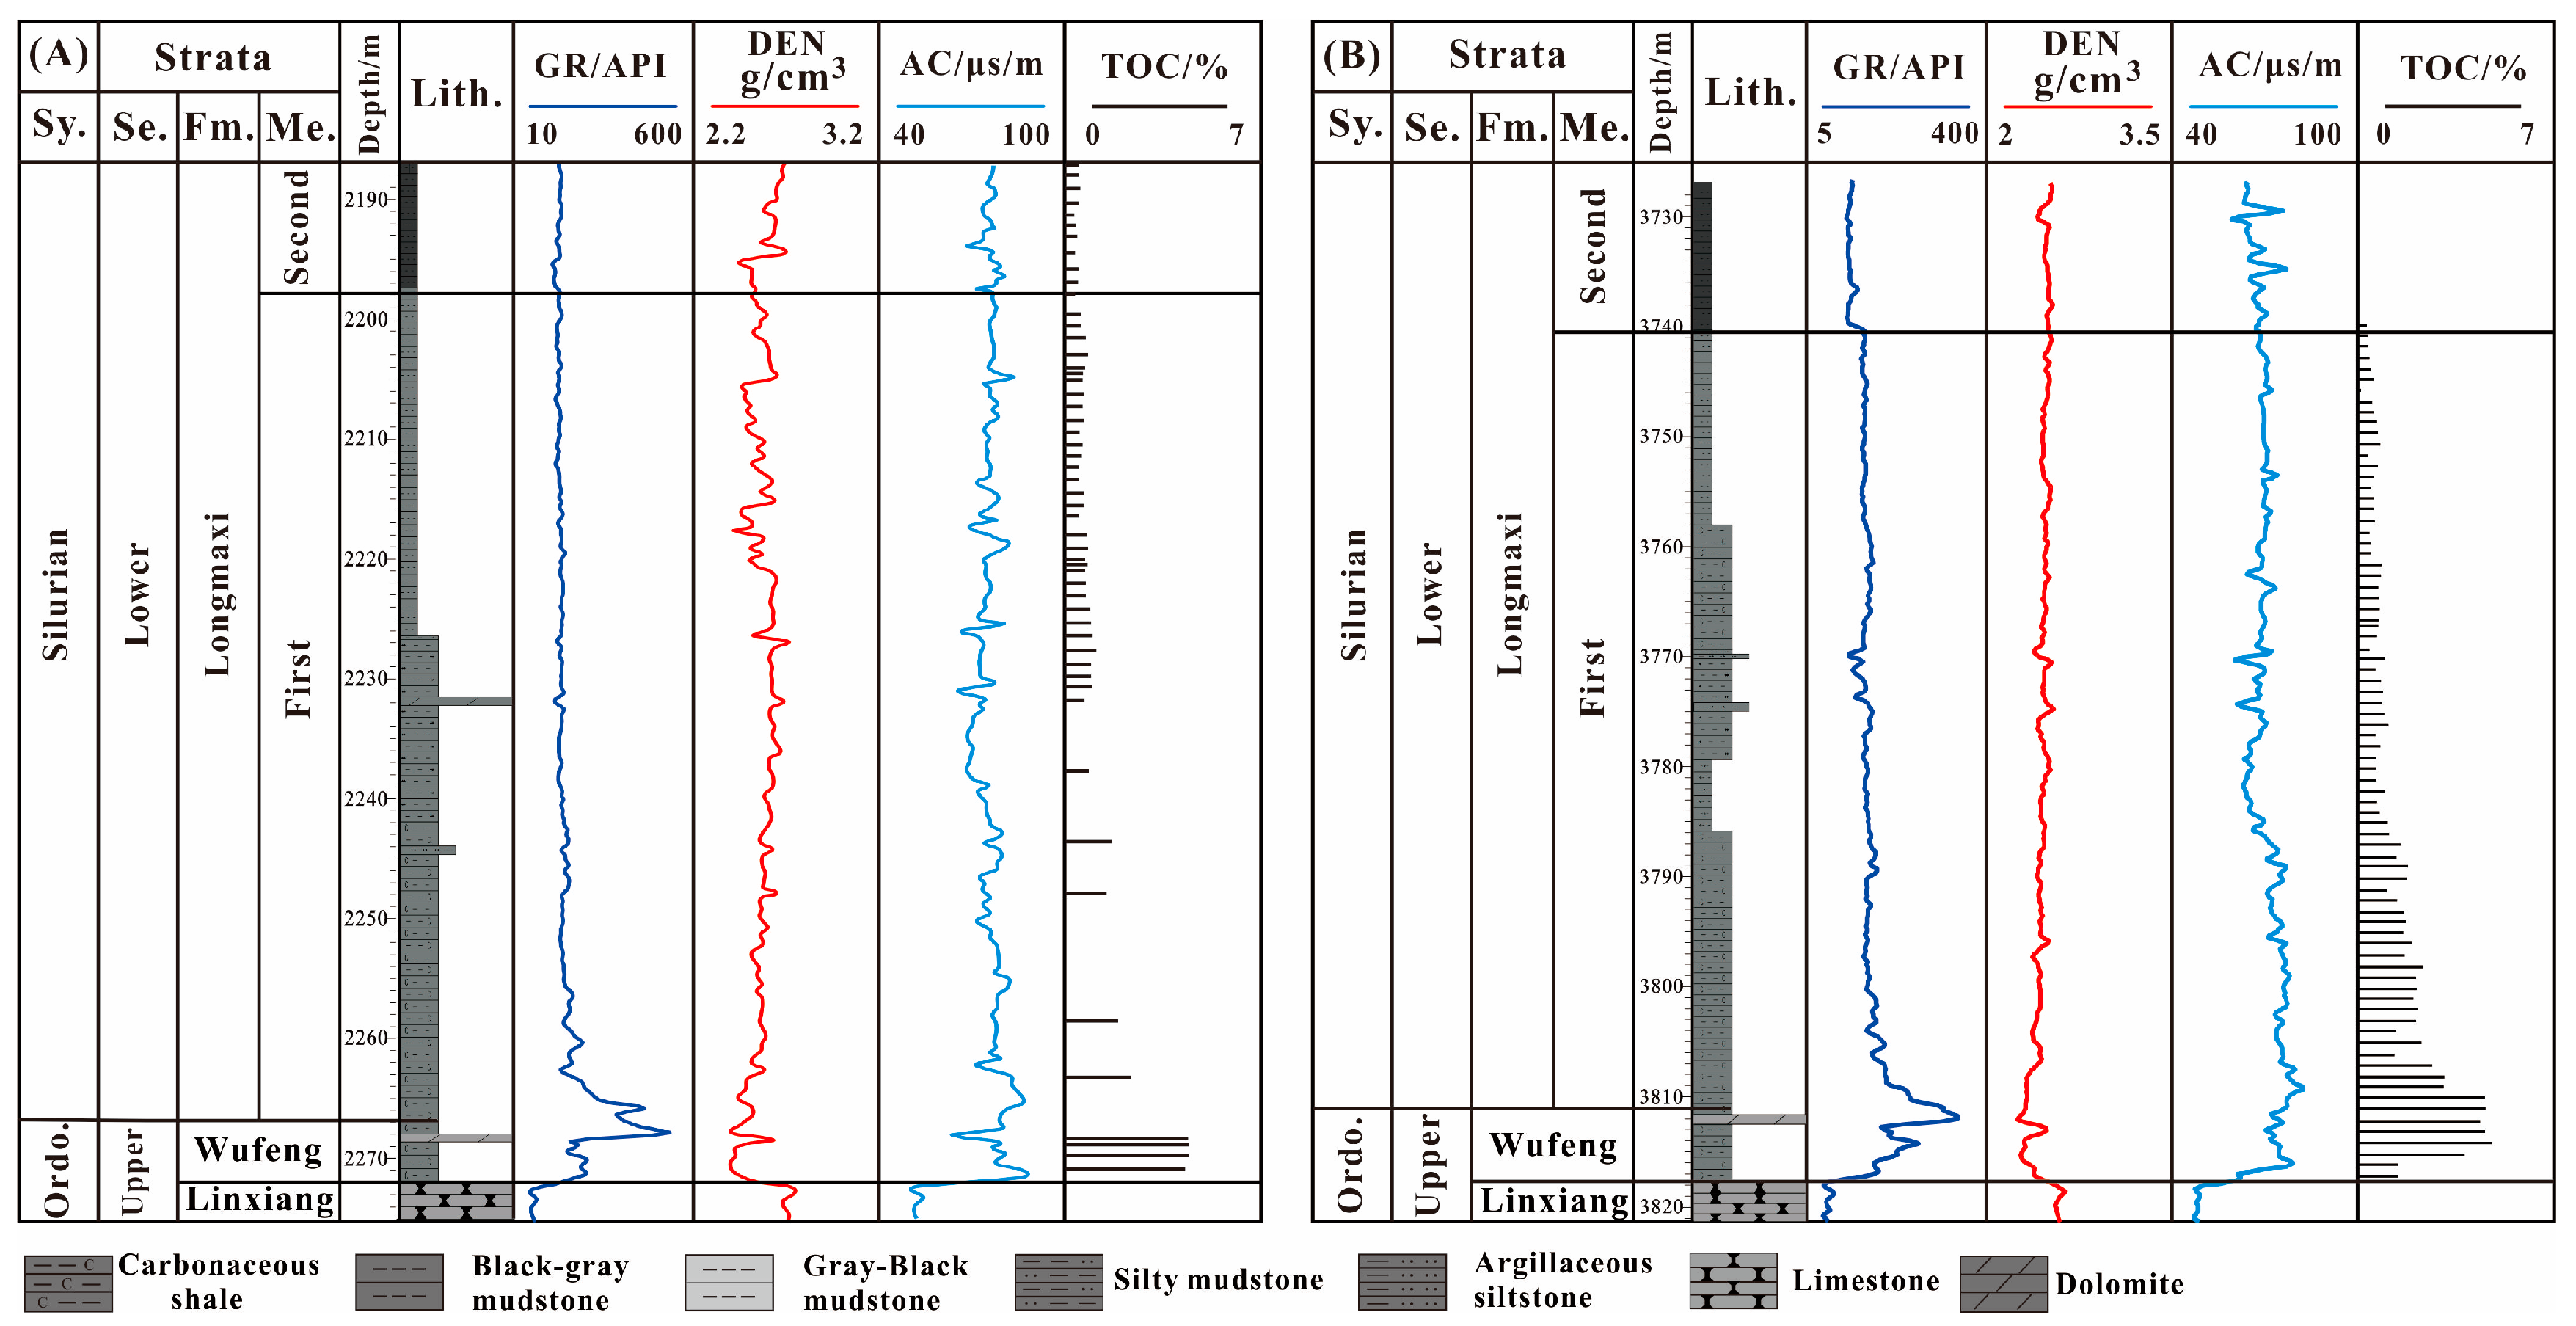
4.1. TOC Content and Ro

The TOC content of well DA ranged from 0.70 to 5.53% (average = 1.84%). The TOC content of well DB ranged from 0.74 to 5.37% (average = 2.04%) (Table 1). TOC contents of the WF and lower LMX shales were much higher than that of the upper section. The TOC content of samples after combustion ranged from 0.07 to 0.09% (average = 0.08%) (Table 2), indicative of the complete removal of organic matter. The bitumen reflectance (Rb) values were measured, and the equivalent vitrinite reflectance values (Ro*) were calculated using the conversion formula: Ro* = (Rb + 0.2443)/1.0495 [31]. The Ro* of well DA ranged from 2.0% to 3.1% (average = 2.5%), and the Ro* of well DB ranged from 2.10 to 3.5% (average = 3.0%), indicating that the WF-LMX shales are currently over-mature.

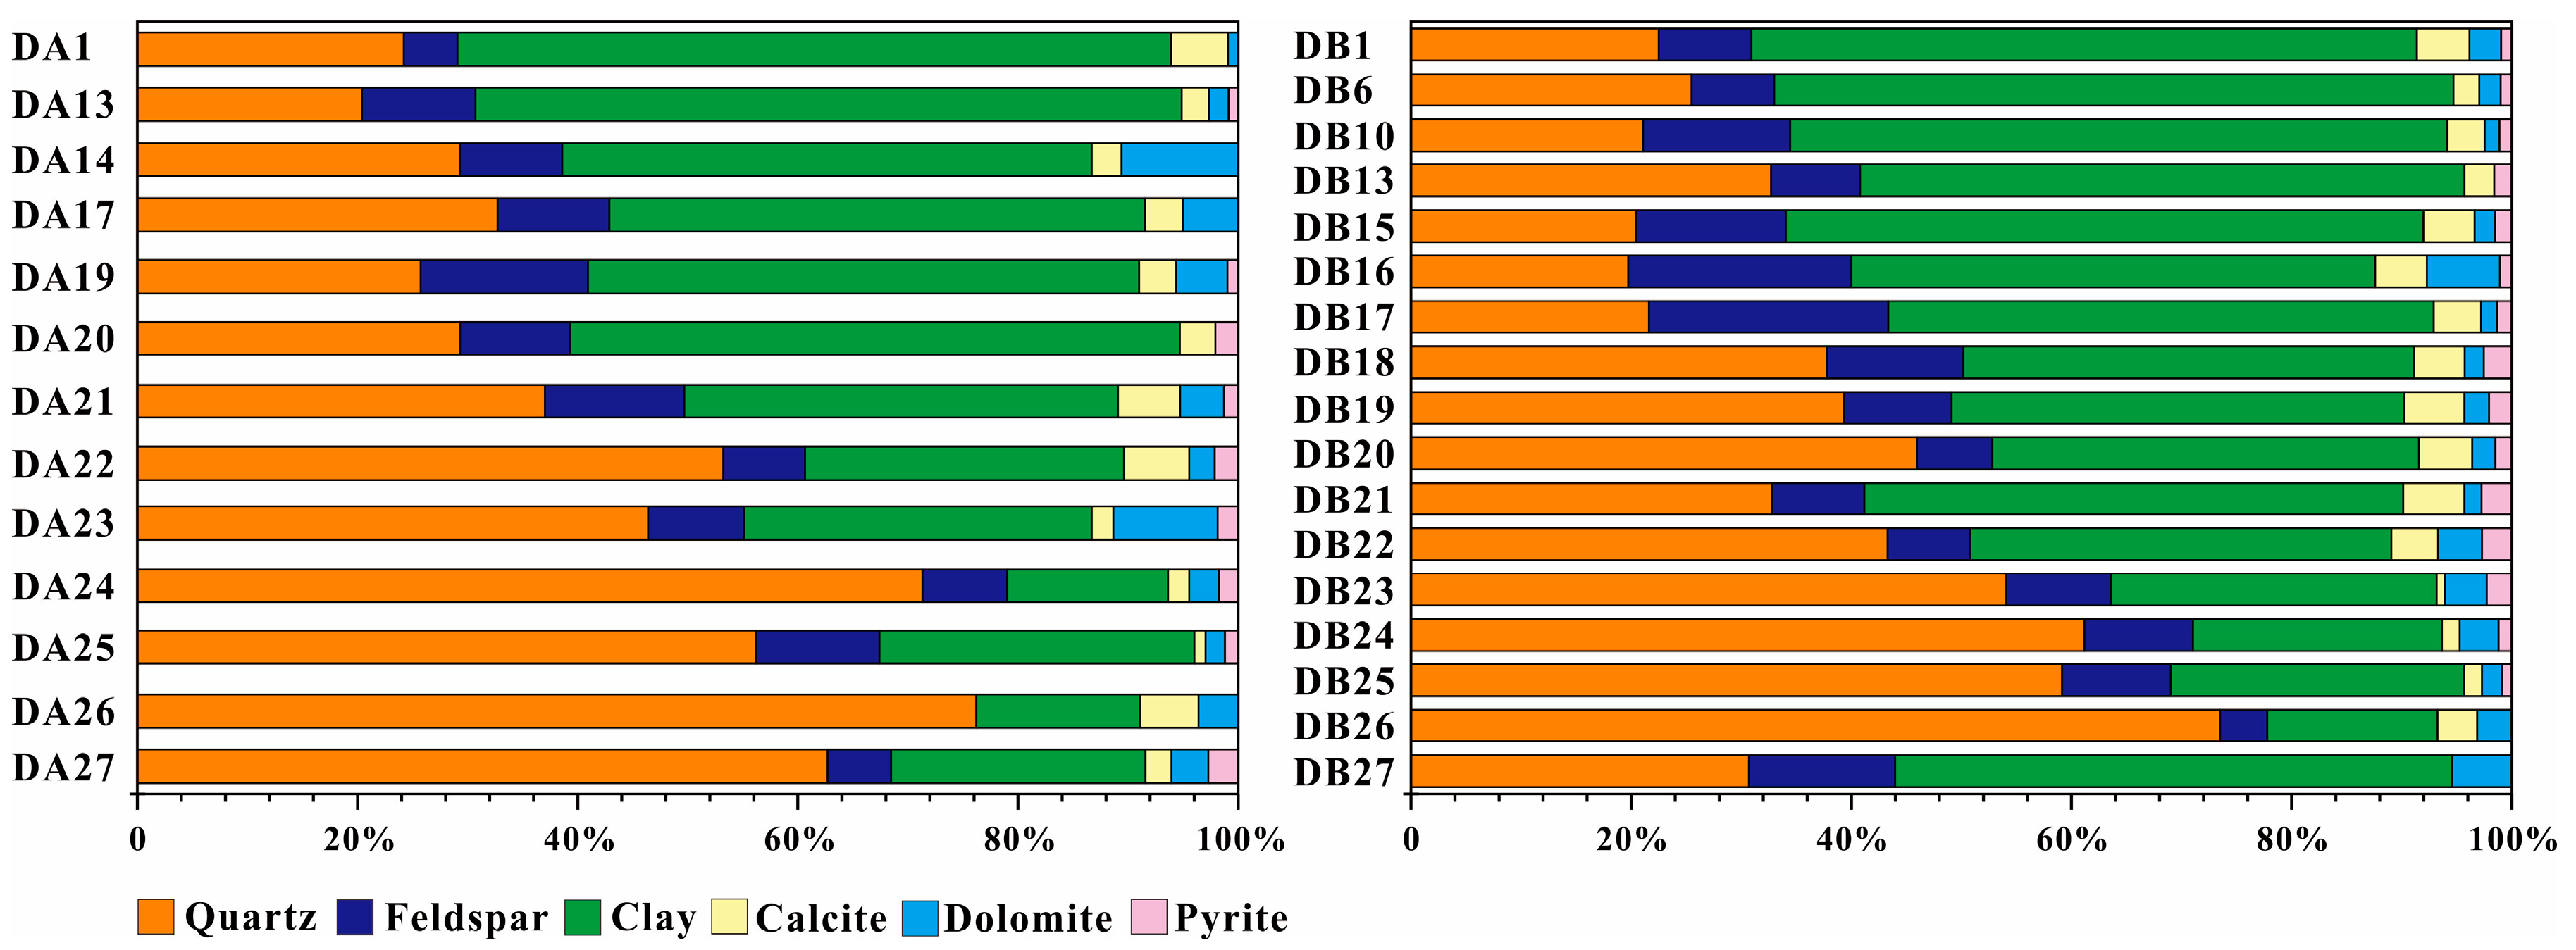
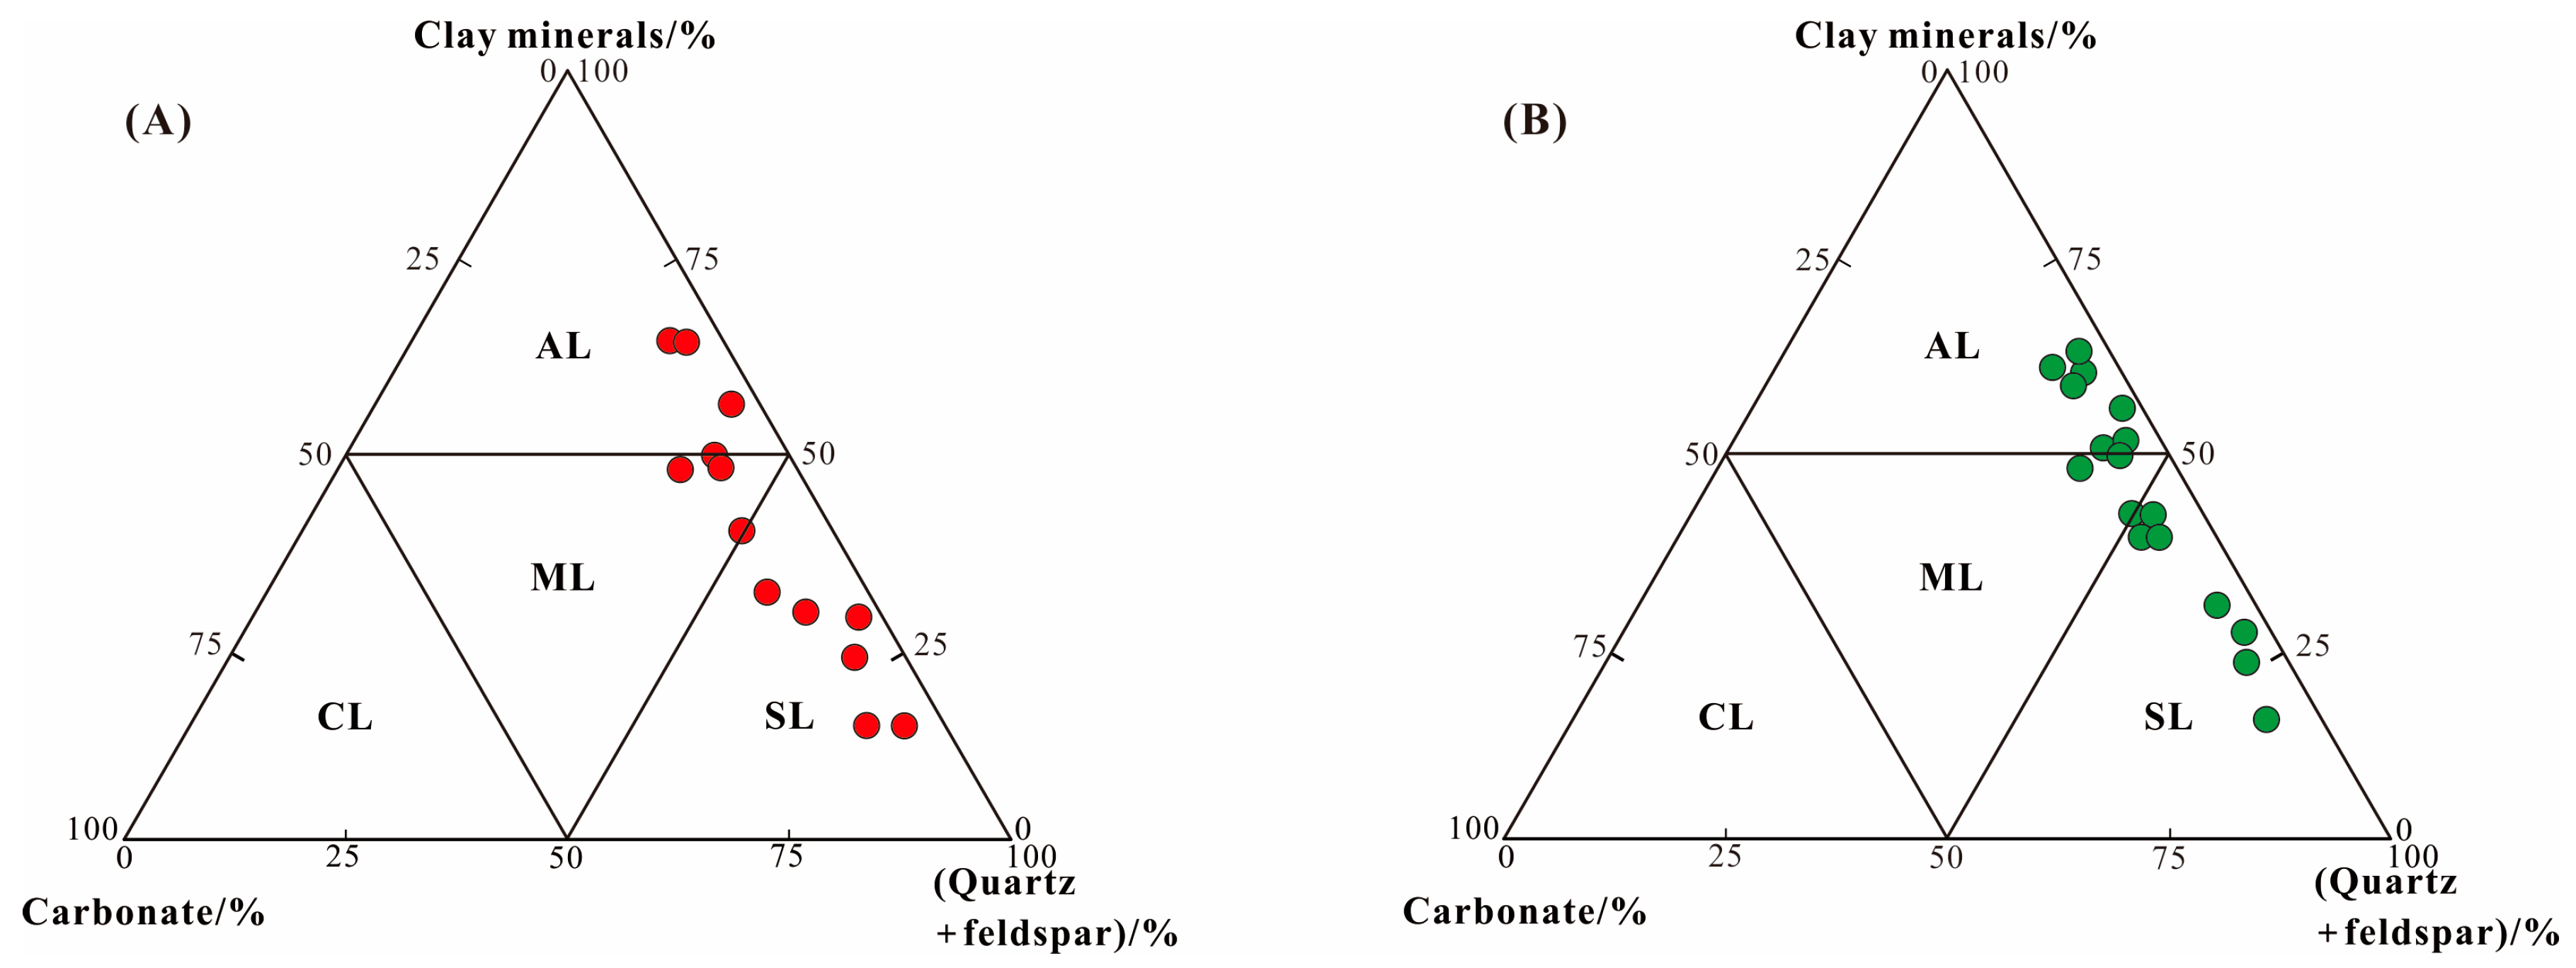
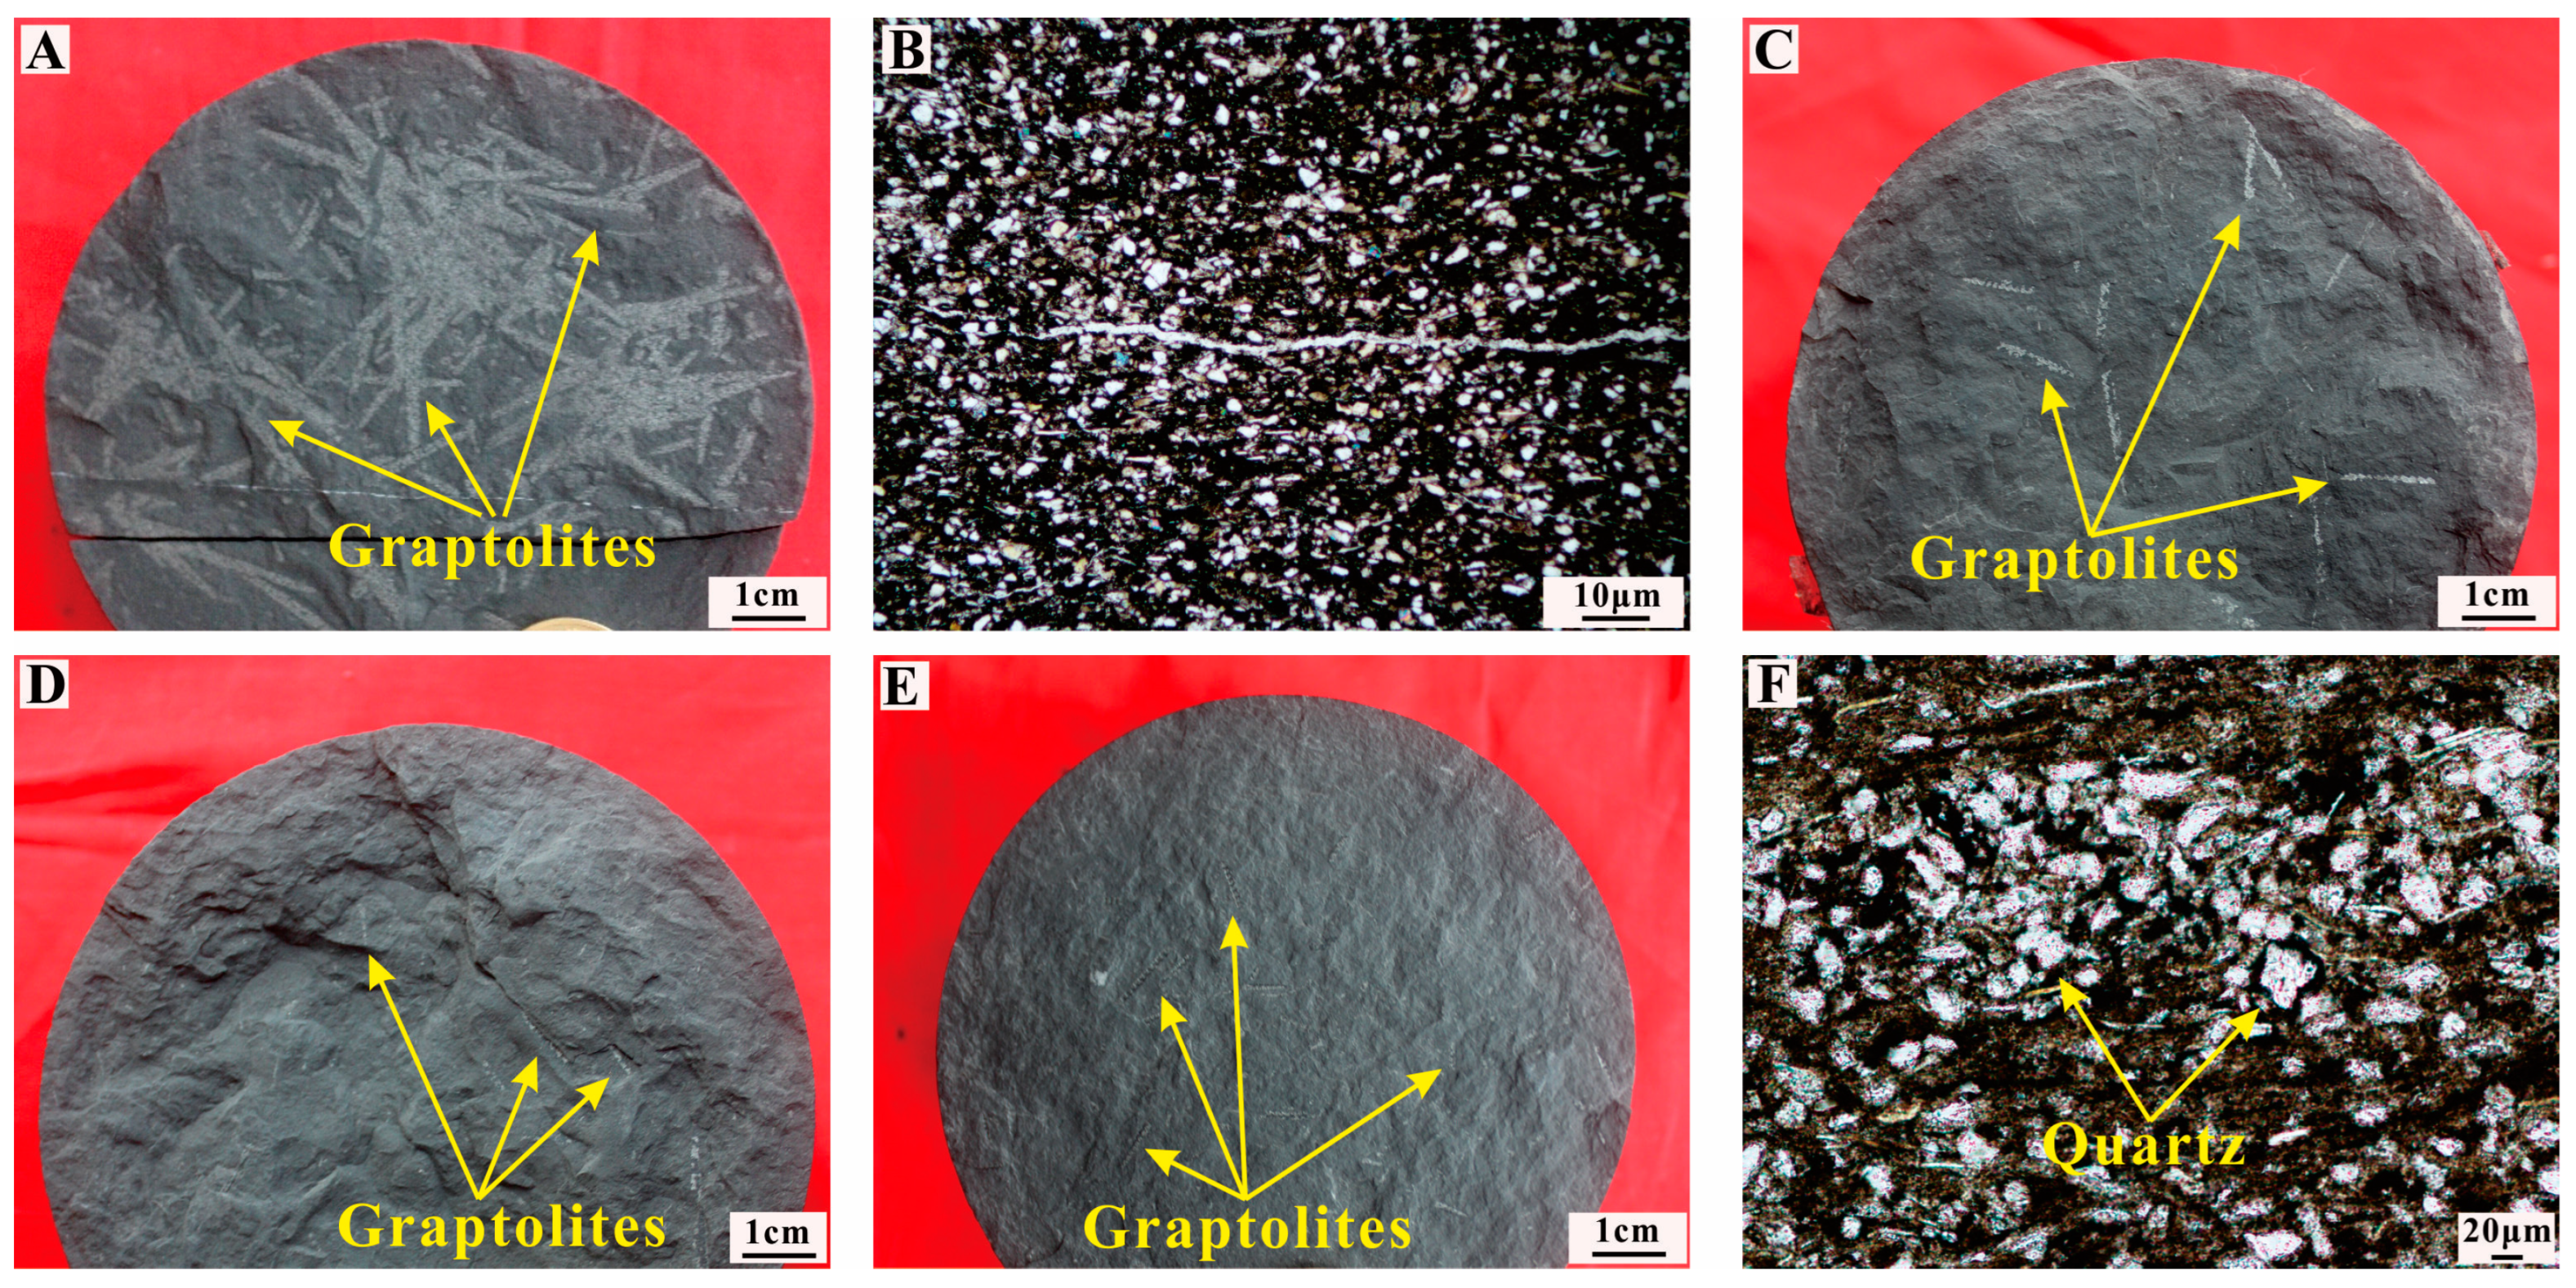
4.2. Mineralogy and Lithofacies

The X-ray diffraction (XRD) results suggest that the WF-LMX shales primarily comprise quartz and clay, followed by calcite, dolomite, feldspar, and pyrite (Figure 3). For well DA, quartz contents range from 20.4 to 76.2% (average = 43.3%), and clay contents range from 14.6 to 64.8% (average = 39.3%). For well DB, quartz contents range from 19.7 to 73.5% (average = 37.7%), and clay contents range from 15.5 to 61.7% (average = 43.8%). Based on the lithofacies classification ternary diagram of clay–carbonate–quartz + feldspar [32,33,34,35], the WF-LMX shale lithofacies in this study are mainly siliceous shale, siliceous–argillaceous mixed shale, and argillaceous shale (Figure 4).

4.2.1. Siliceous Shale

As the dominant shale lithofacies in the WF and lower LMX formations, siliceous shale has high quartz and feldspar contents in the range of 50.8 to 79.0% (average = 65.8%), low clay content in the range of 14.6 to 38.3% (average = 26.0%), and low carbonate content in the range of 4.0 to 13.1% (average = 7.9%). The TOC content is the highest among all the lithofacies, ranging from 2.41 to 5.53% (average = 4.42%). Petrographic observations suggest that the siliceous shale is characterized by black color and abundant graptolites at the core images (Figure 5A) and a large amount of clay- to silt-sized quartz grains (Figure 5B).

4.2.2. Siliceous–Argillaceous Mixed Shale

Siliceous–argillaceous mixed shale is the predominant lithofacies within the middle LMX shale interval. This lithofacies is greyish-black at the core, and a moderate amount of graptolites can be observed (Figure 5C,D). Compared with the siliceous shale, this lithofacies has a relatively low quartz content in the range of 37.8~49.7% (average = 42.8%) and a relatively high clay content in the range of 39.4~49.6% (average = 45.5%). The TOC content of this lithofacies ranges from 1.01 to 2.76% (average = 1.69%), which is lower than that in the siliceous shale.

4.2.3. Argillaceous Shale
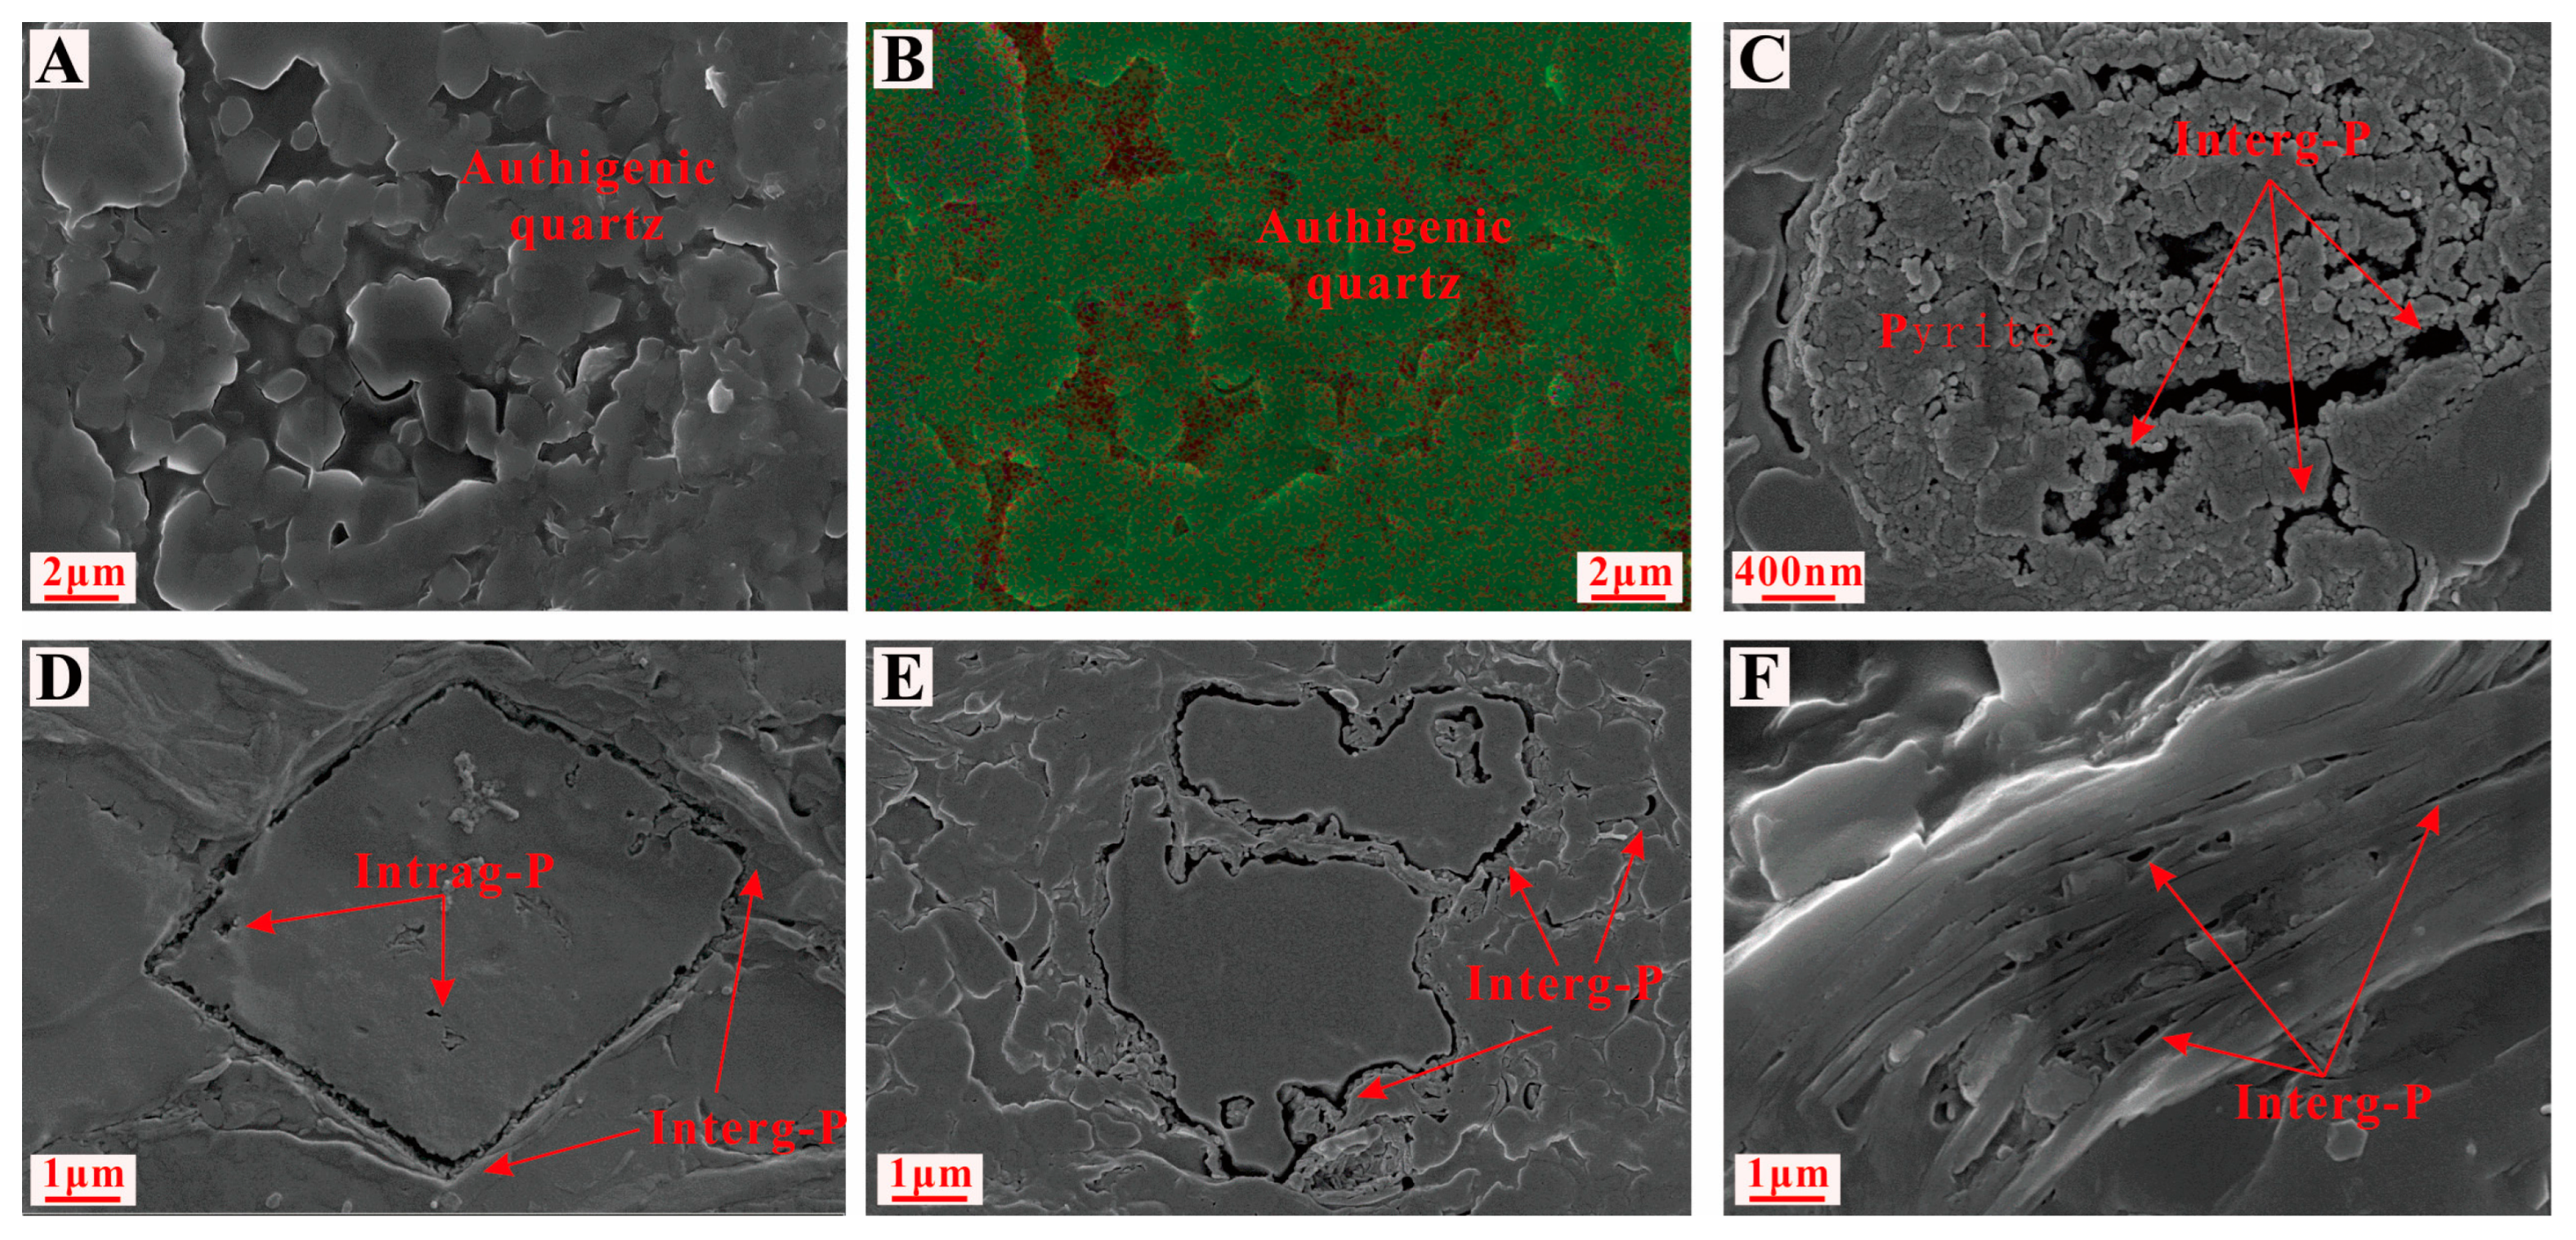
Argillaceous shale is the predominant lithofacies within the upper LMX shale interval. This shale succession is characterized by high clay content in the range of 50.1 to 64.8% (average = 58.0%). The average silicate mineral content is 35.7% and the average carbonate content is 8.1%. The TOC content is the lowest among all the lithofacies, ranging from 0.74 to 5.03% (average = 1.63%). Core images suggest that the argillaceous shale is characterized by greyish-black color and a few graptolites (Figure 5E). Thin section observations suggest a large amount of silt-sized detrital quartz grains (Figure 5F).

4.3. Pore Types

As proposed by Loucks et al. (2012) [8], there are generally four types of pores developed in shale reservoirs, including organic matter pores, interparticle pores (inter-P), intraparticle pores (intra-P), and micro-fractures. The latter three types are collectively referred to as inorganic pores.
Organic matter (OM) pores are a significant component of pore systems in overmature shales [7,36]. The OM pores, the predominant pore type in the WF-LMX shale reservoirs, are commonly found and widely developed (Figure 6). Both sponge-like and bubble-like OM pores were observed, and these pores are sub-rounded to rounded in shape with diameters ranging from approximately 5 nm to 300 nm. In addition, a large number of OM pores were observed between the framboidal pyrite crystals (Figure 6F). Generally, siliceous shale has abundant OM pores due to high TOC content.
Compared to organic pores, the amount of inorganic pores is much lesser in the WF-LMX shales. Inorganic pores are usually distributed dispersedly and differ significantly from organic pores (Figure 7). Intergranular pores refer to pore space formed between different mineral particles and crystals, such as clay minerals, quartz, calcite, and other rigid minerals. Intergranular pores mostly appear as polygons with flat edges and have large pore sizes mainly ranging from tens of nanometers to several microns (Figure 7A–C).
Intraparticle pores exhibit elliptical and irregular shape, and generally occur as dissolved pores within feldspar, calcite, and dolomite grains (Figure 7D–F). Micro-fractures that are associated with clay minerals and organic matter were frequently observed (Figure 7G–I). The micro-fractures are characterized by a slit shape and several microns in length (Figure 7H). The micro-fractures developed between organic matter and mineral grains are probably due to the shrinkage of organic matter (Figure 7I).

4.4. Pore Structure Characteristics

According to the International Union of Pure and Applied Chemistry, the pores can be classified into three categories: macropores (>50 nm), mesopores (2~50 nm), and micropores (<2 nm) [37,38,39]. The PV and SSA of different lithofacies are given in Table 3. The siliceous shale has the highest PV (2.37~3.3 cm3/100 g), and the highest SSA (33.94~48.56 m2/g), with average values of 2.88 cm3/100 g and 42.6 m2/g, respectively. The siliceous–argillaceous mixed shale has an average PV of 2.07 cm3/100 g and an average SSA of 27.1 m2/g. The argillaceous shale has a PV in the range of 1.42~2.65 cm3/100 g (average = 1.86 cm3/100 g) and an SSA in the range of 19.82~50.06 m2/g (average = 28.63 m2/g). The PV and SSA in siliceous shales are higher than that of mixed and argillaceous shale.
The pore diameter range measured by CO2 adsorption is typically 0.3~1.0 nm, and the pore diameter range measured by N2 adsorption is typically 1.8~300 nm [30]. The pore size distribution calculated from N2 and CO2 adsorption isotherms suggests a dominant pore size of <100 nm for the WF-LMX shales regardless of shale lithofacies (Figure 8).

4.5. Pore System after Combustion

4.5.1. Pore Types

Figure 9 shows the SEM images after combustion. Prior to combustion, abundant organic pores were observed within authigenic micro-quartz aggregates; however, inorganic pores appeared between the authigenic quartz aggregates after combustion (Figure 9A,B). Similarly, organic matter within pyrite framboids disappeared, and some inorganic pores and fractures were observed after combustion (Figure 9C). The intergranular pores that may have been filled with organic matter were observed clearly (Figure 9D–F), displaying either irregular shape or elongated fractures. Based on the detailed examinations of samples after combustion, it can be found that most of the organic matter was removed, and inorganic pore was the dominant pore type in the combusted samples.

4.5.2. Pore Volume and Specific Surface Area

The PV and SSA of micropore, mesopore, and macropore show great difference between pre-combustion and post-combustion samples (Figure 10 and Table 4). For samples after combustion, the PV of micropore ranges from 0.09 to 0.13 cm3/100 g (average = 0.1 cm3/100 g) and the PV of mesopore ranges from 0.78 to 1.31 cm3/100 g (average = 1.09 cm3/100 g). The PV of macropore ranges from 0.32 to 0.87 cm3/100 g (average = 0.54 cm3/100 g). The SSA of micropore ranges from 3.19 to 4.83 m2/g (average = 3.79 m2/g), and the SSA of mesopore ranges from 3.47 to 5.63 m2/g (average = 4.46 m2/g). The SSA of macropore ranges from 0.13 to 0.35 m2/g (average = 0.22 m2/g) (Table 4). Compared to pre-combustion samples, the average PV of micropore and mesopore were decreased by 77.8% and 14.2% after combustion, respectively, whereas the average PV of macropore was increased by 86.2%. Compared to pre-combustion samples, the average SSAs of micropore and mesopore were decreased by 73.2% and 42.2% after combustion, respectively, whereas the average SSA of macropore was increased by 100%.

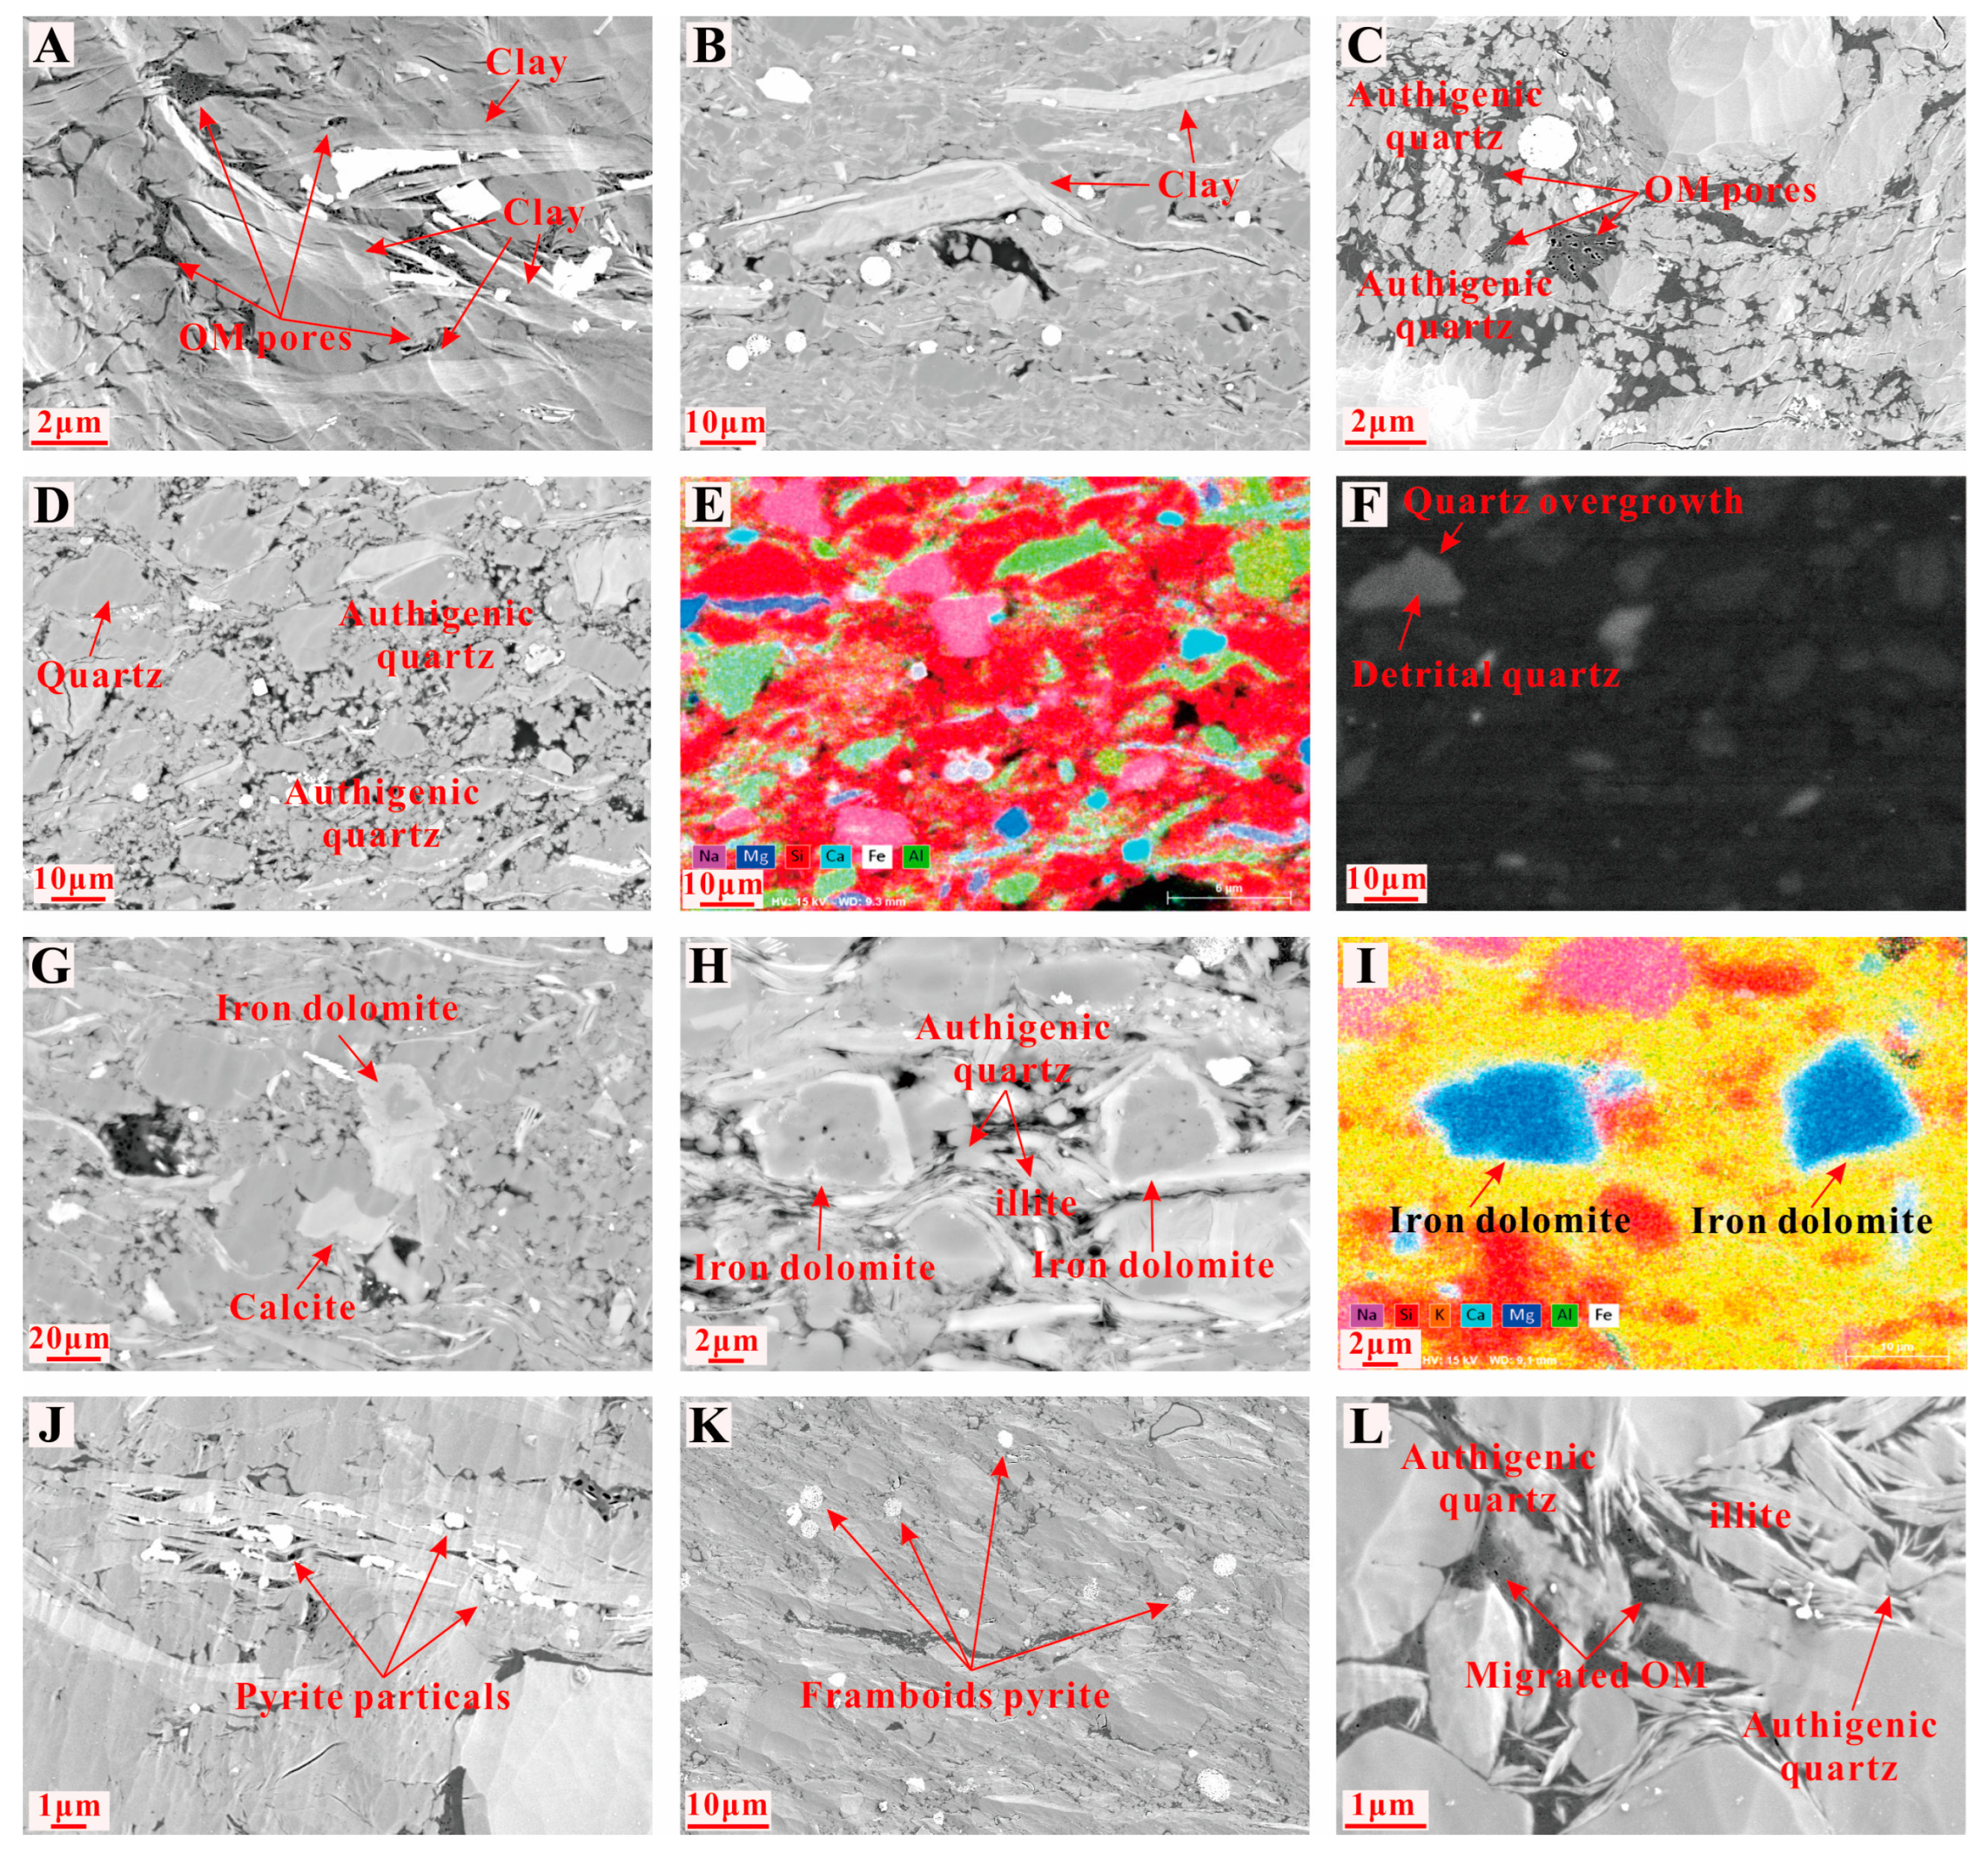
4.6. Diagenetic Events

4.6.1. Compaction and Cementation

During the early burial stage, due to the mechanical compaction, the primary porosity is significantly decreased, suggested by the twisted clay flakes (Figure 11A,B). The SEM images suggest that clay flakes were frequently banded and oriented under the compaction process.
Cementation refers to the formation of authigenic minerals in the pores and fractures. By examining the WF-LMX shale reservoirs using high-resolution SEM-EDS-CL techniques, it was found that there are mainly two types of silica cements, namely quartz overgrowth and microcrystalline quartz (called microquartz). Most of the microquartz filled in primary intergranular pores and coexisted either in the form of a single crystal closely associated with clay flakes or in the form of aggregates (Figure 11C,D). Migrated organic matter were frequently observed to coexist with microquartz aggregates (Figure 11C). The quartz overgrowth is mainly distributed around detrital quartz that is bright in the luminescence (Figure 11D–F). As suggested by Milliken et al. (2016) [40], the detrital quartz displays bright luminescence and authigenic quartz is essentially non-luminescent.
Carbonate cements mainly include calcite, dolomite, and iron-rich dolomite. The silt-sized calcite grains are generally distributed with the shale matrix (Figure 7D,E). The silt-sized dolomite grains are characterized by a rhombic shape (Figure 7F). The edge of dolomite grains is usually replaced by iron-rich dolomite as revealed by SEM and EDS images (Figure 7F and Figure 11H,I).
Pyrite cement was commonly observed within shale samples, which are generally characterized by granular, framboidal, and irregular shapes. The average size of granular and irregular shape pyrite is usually less than 1 µm (Figure 6B and Figure 11J). The average diameter of pyrite framboids is generally less than 5 µm (Figure 6F and Figure 11K).

4.6.2. Dissolution and Clay Mineral Transformation

Dissolution is most commonly observed in carbonate minerals, such as calcite and dolomite [8,41]. Under the reaction of acidic fluid formed by organic matter decarboxylation during thermal evolution [8,42], carbonate minerals can be dissolved and generate dissolution pores, which can increase the porosity and permeability of shales. SEM observations also show that some dissolution pores are developed in calcite and dolomite grains (Figure 7D–F). However, feldspar dissolution was rarely observed in WF-LMX shales.
The transformation of smectite to illite is one of the diagenetic events commonly experienced in the burial process of shales. With the addition of K, under the temperature range of between 60 and 100 ℃, smectite can be transformed into illite and excess silica that can be locally precipitated as quartz [43,44]. Aluminum and K are typically a result of the dissolution of K-rich feldspar [43,45,46]. Meanwhile, the Si released by the transformation of smectite to illite provides a partial Si source for the precipitation of authigenic quartz [40,44]. Most of the clay minerals identified in the WF-LMX shales are illite and smectite–illite mixed layers, which is consistent with the current over-mature stage (Figure 11L).

4.6.3. Thermal Evolution of Organic Matter

The diagenesis of organic matter is closely related to hydrocarbon generation by thermal evolution of organic matter. The maturity of shale samples in the study area is generally greater than 2.0%, indicating that it has entered into the over-mature stage. In this studied shale, the bitumen migrates into adjacent pore spaces to form migrating OM [47] (Curtis et al., 2012), and the migrated OM was observed to fill in the interparticle pores (quartz and calcite) as well as the intraparticle pores within clay flakes (Figure 6B), pyrite framboids (Figure 6F), and microfractures (Figure 7G). Meanwhile, the acidic fluid formed from organic matter maturation can dissolve some unstable minerals (e.g., carbonate mineral and feldspar; Figure 7D–F). In the dry gas window (Ro > 2.0%), the pore-filling organic matter was further cracked to form dry gas. At this stage, a large number of secondary organic matter pores were formed (Figure 6A–E).

5. Discussion

5.1. Factors Controlling Pore Development in Different Lithofacies
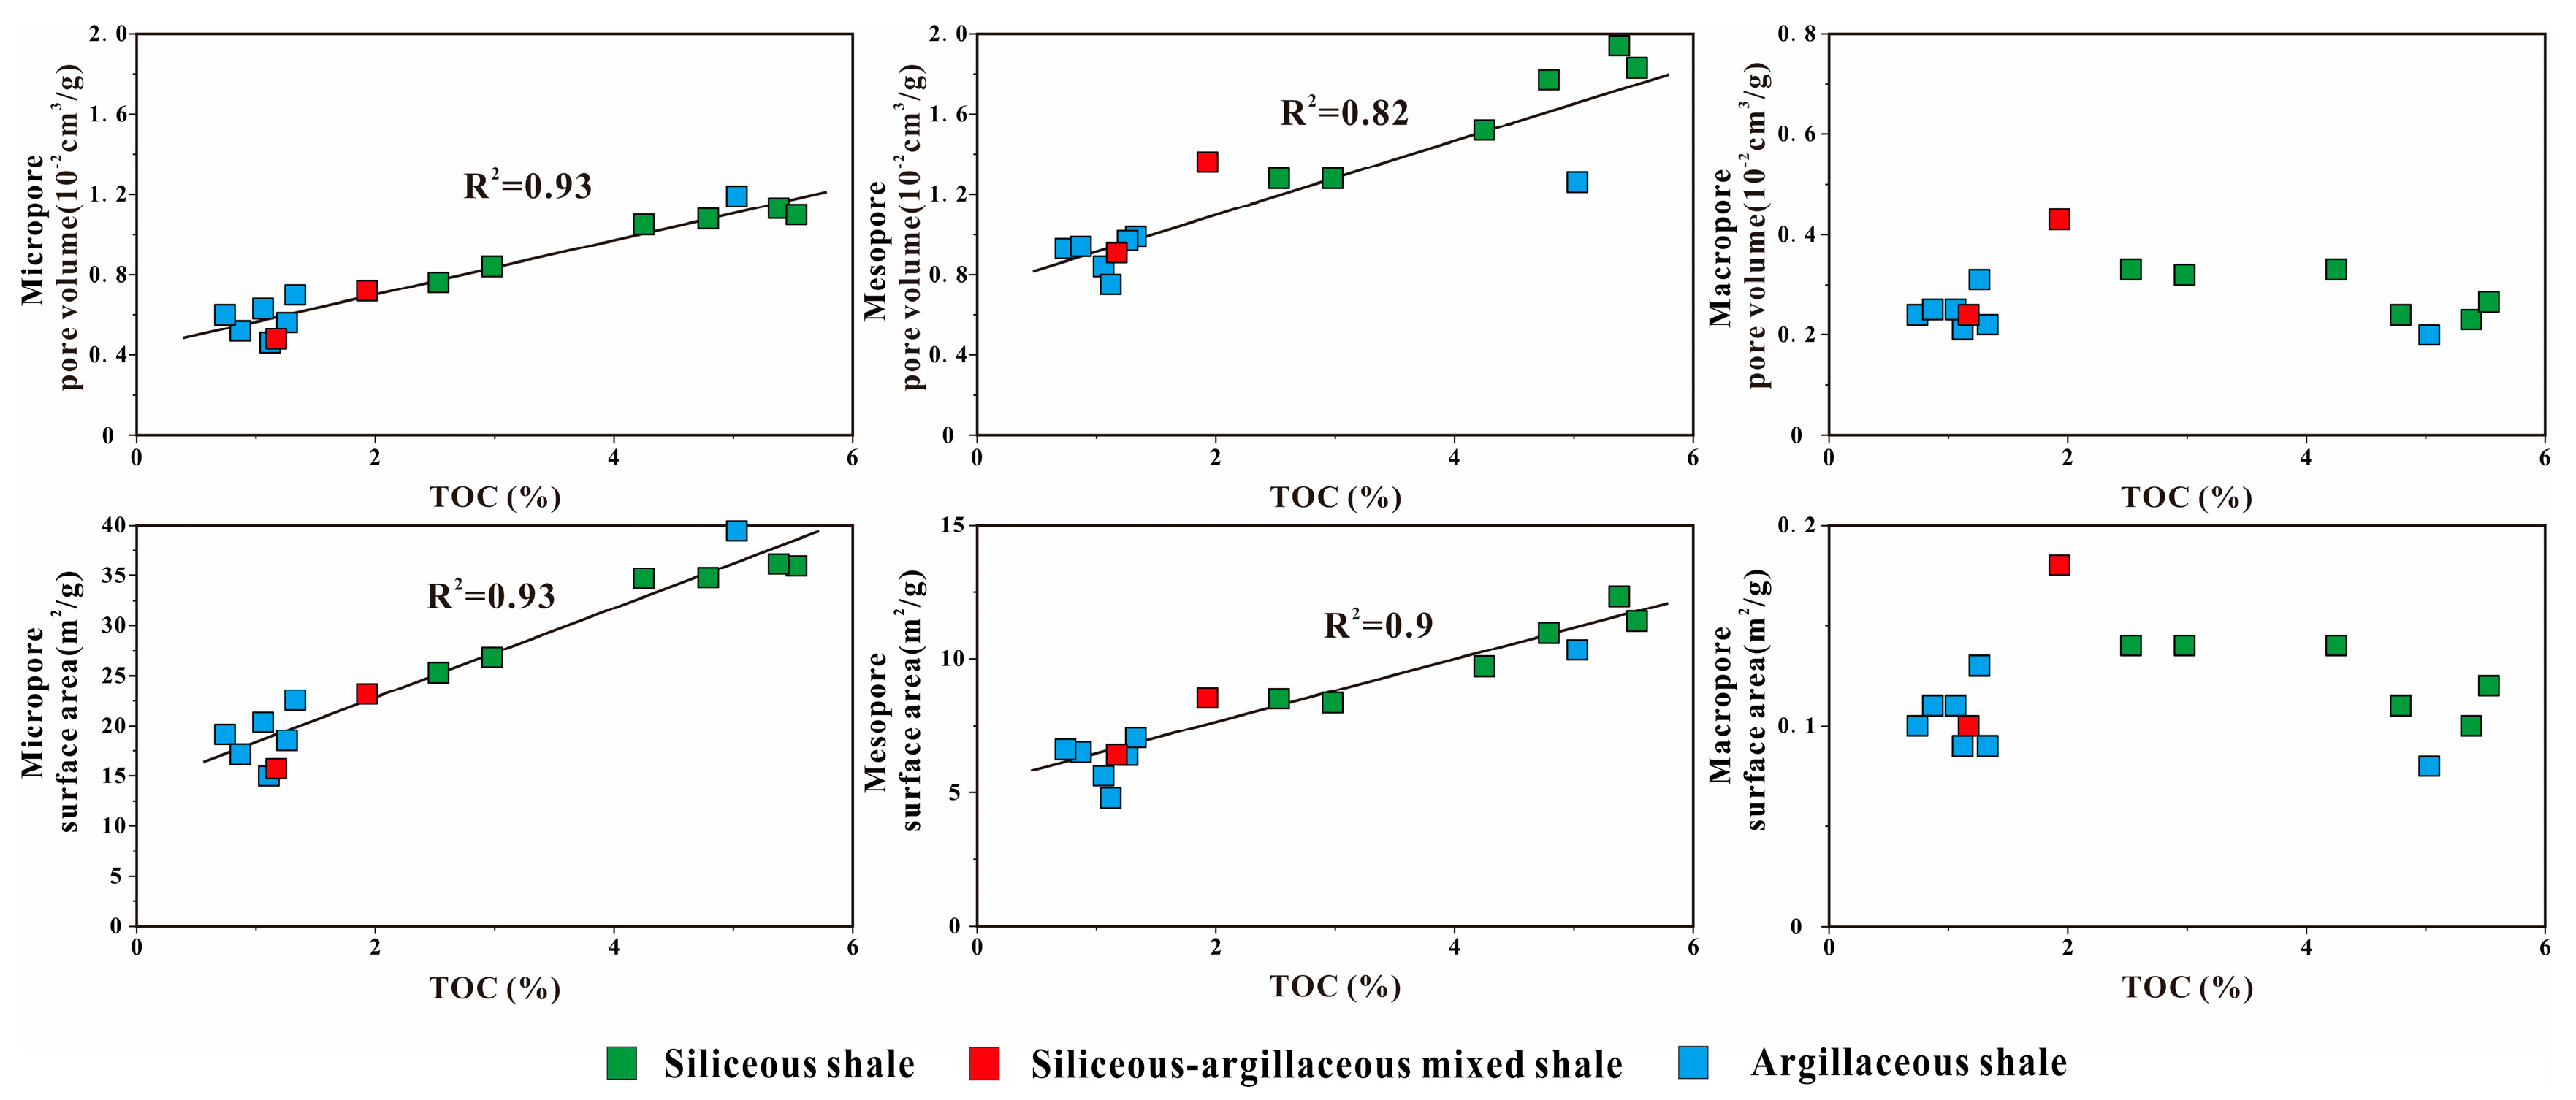
5.1.1. TOC Content

The WF-LMX shales are currently in the overmature stage, and the SEM observations suggest abundant organic pores that were developed within organic matter, probably bitumen and pyrobitumen [48,49,50] (Figure 6). The TOC content displays positive correlations with the PV and SSA of micropores and mesopores, whereas there is no correlation between TOC content and the PV and SSA of macropores, indicating that the TOC content is the main factor increasing the abundance of micropores and mesopores (Figure 12). In addition, the PV and SSA of micropores and mesopores were greatly reduced after organic matter was combusted (Figure 10), implying that micropores and mesopores mainly consist of organic pores, whereas organic pores contribute little to macropores. Furthermore, the PV and SSA of siliceous–argillaceous mixed shales and argillaceous shales are lower than those of siliceous shales, indicating that the abundance of organic pores in siliceous shales is higher than that of the siliceous–argillaceous mixed shales and argillaceous shales.

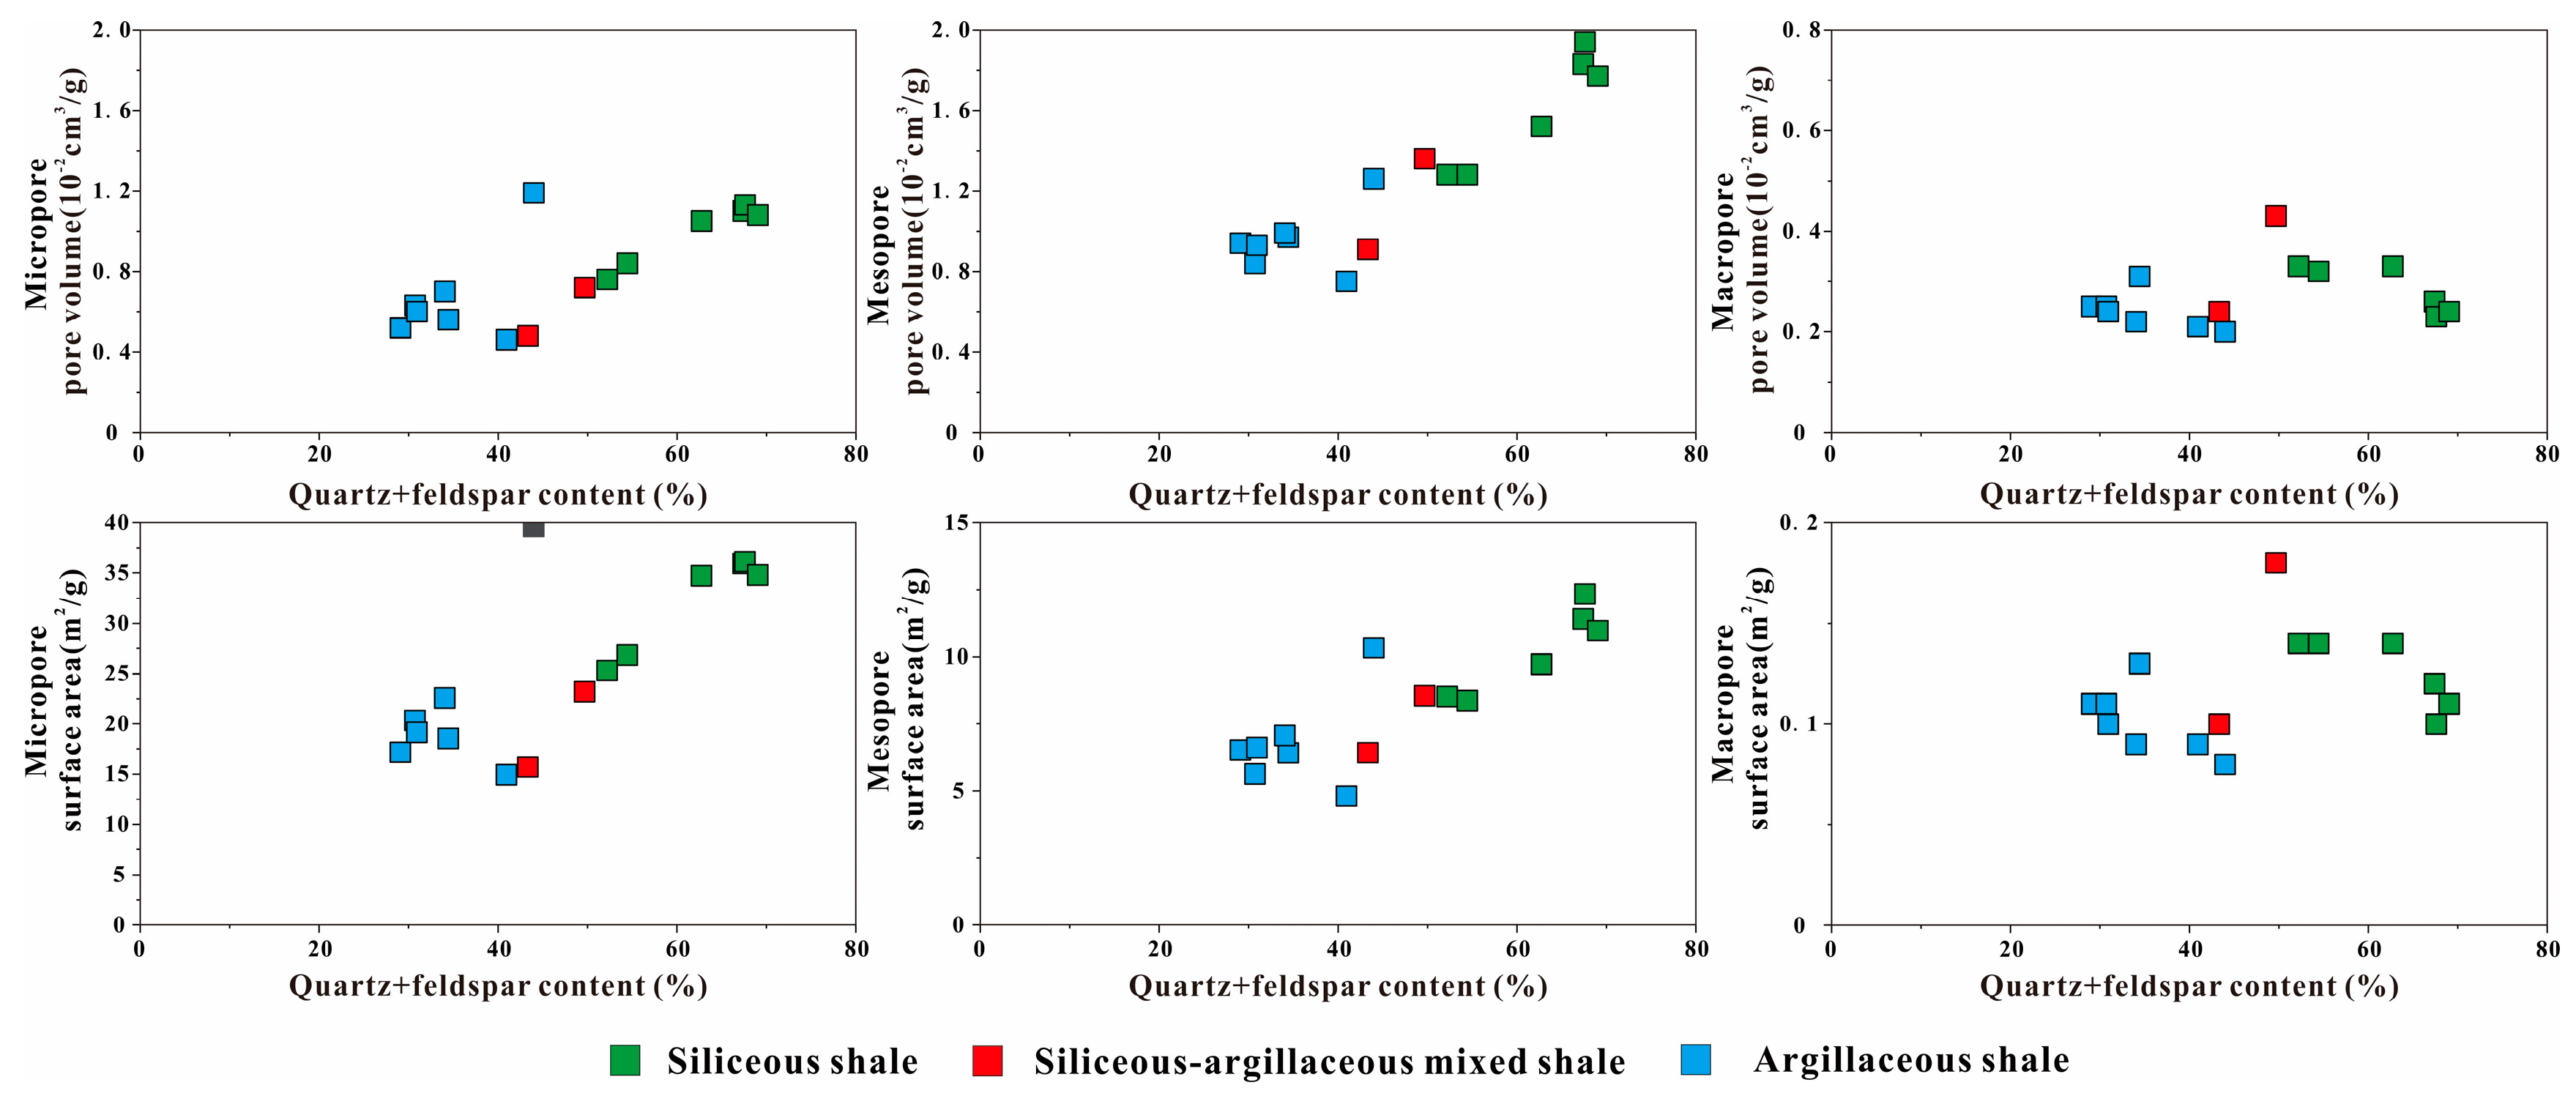
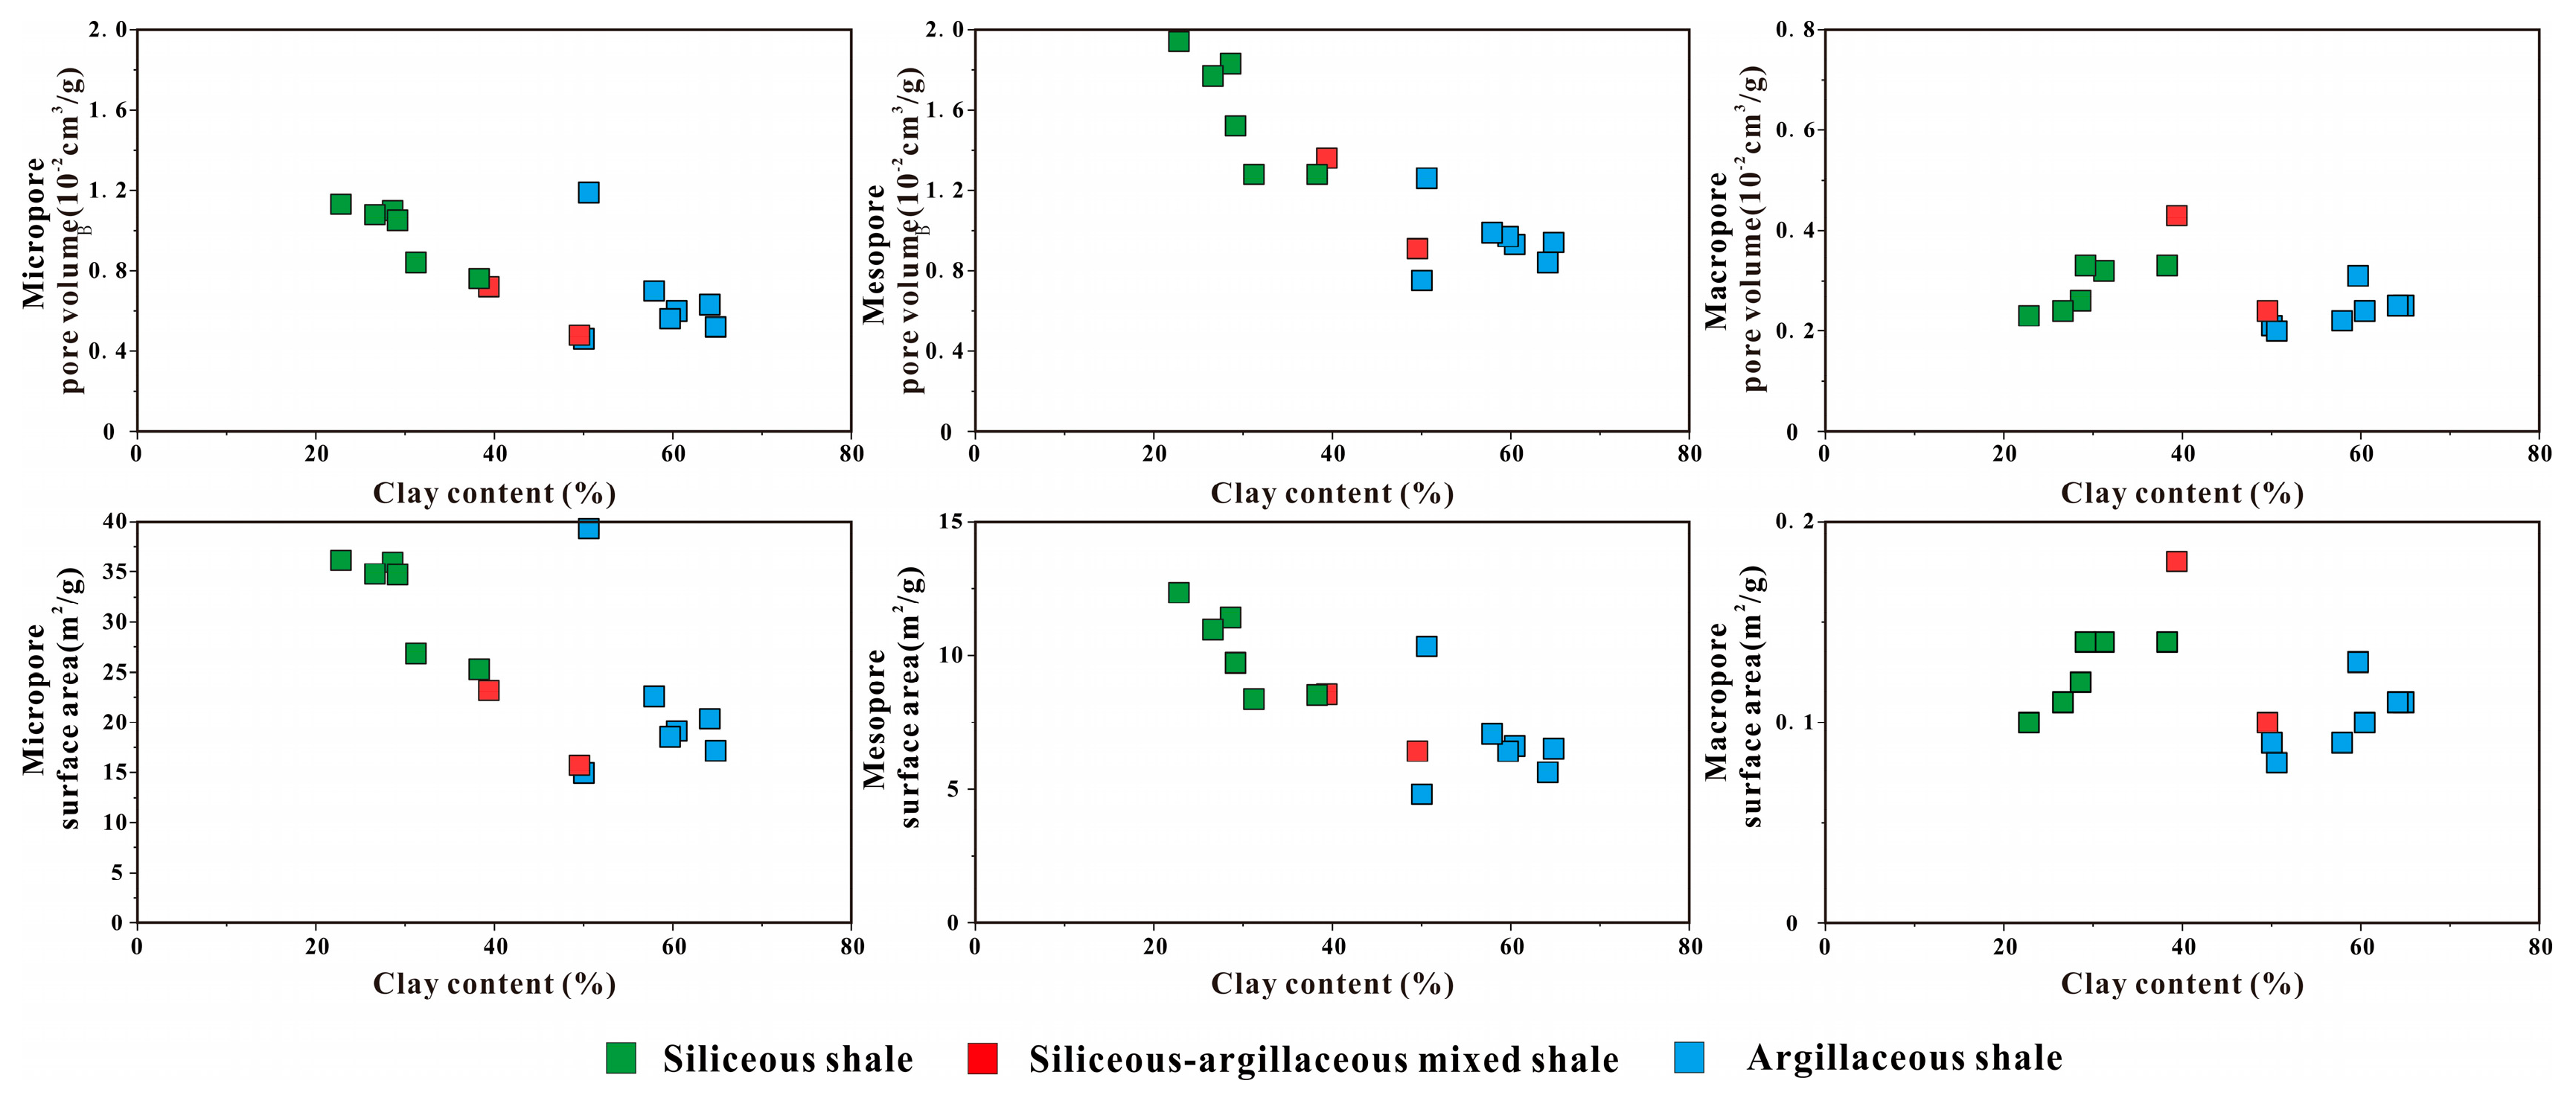
5.1.2. Mineral Composition

The degree of pore development in shales is controlled not only by the TOC content but also by mineral composition [51,52,53]. The silicate mineral (e.g., quartz and feldspar) content displays a positive correlation with the PV and SSA of microscopes and mesopores and a negative correlation with the PV and SSA of macropores (Figure 13). Compared with other lithofacies, the PV and SSA of siliceous shales with high quartz content are relatively high. Previous studies suggested that the precipitation of abundant microcrystalline quartz sourced either from biogenic silica or clay conversion can form a rigid framework that is resistant to overlying mechanical compaction [40,44]. Dong et al. (2019) [5] and Guan et al. (2021) [54] showed that authigenic microcrystalline quartz aggregates are very common in WF-LMX shales and are mainly of biological origin. A large number of authigenic quartz aggregates can be found in SEM and CL images (Figure 11C–F). Organic matter can be observed to coexist with authigenic quartz in the WF-LMX shales, forming an organic matter network. Abundant sponge-like materials, rounded to sub-rounded pores, were developed within the organic matter (Figure 6). A rigid quartz framework provided by quartz cementation has the potential to preserve pores (both organic pores and interparticle pores) during the compaction process [55].
The PV and SSA of micropores and mesopores display negative correlations with the clay mineral contents in siliceous and argillaceous lithofacies (Figure 14), and the PV and SSA of macropores have no correlations with clay mineral contents (Figure 14). The above-mentioned correlations indicate that the abundance of micropores and mesopores decreases with increased clay mineral contents. This may be due to the fact that shale samples with high clay mineral content typically have low TOC content and low silicate minerals. Therefore, the abundance of organic pores is low simply due to the low TOC content. In addition, without the support of rigid quartz framework, some primary interparticle pores and organic matter pores are difficult to preserve due to mechanical compaction. Although SEM images show the development of some shrinkage fractures associated with clay minerals (Figure 7H), their contribution to porosity is limited or still questionable because some micro-fractures associated with clay minerals may be generated during the processes of sample preparation and experiments. Meanwhile, due to the release of pressure from the in situ reservoir conditions to the surface, the clay minerals in the shale samples dehydrate and form some artificial shrinkage cracks.

5.2. Diagenetic Sequences

Porosity of shale reservoirs is the combined effect of primary porosity and secondary porosity that were significantly influenced by diagenetic processes. During the burial process with increased temperature and pressure, both mechanical compaction and chemical reactions control the preservation of primary pores and the development of secondary pores. Previous studies have shown that the diagenetic process can usually be divided into early diagenetic stage (Ro < 0.5%), middle diagenetic stage (0.5% < Ro < 2.0%), and late diagenetic stage (Ro > 2.0%) [56].

5.2.1. The Early Diagenetic Stages

At the very early diagenetic stage, the WF-LMX sediments were relatively loose and not completely consolidated, and the primary porosity was high. Framboidal pyrite can easily form in anoxic and sulfidic water columns [57]. Pyrite framboids precipitate when both pyrite and iron monosulfides are supersaturated in pore waters [58]. Therefore, framboidal pyrite generally formed during the very early diagenetic stage.
For siliceous shale (Figure 15), with the continuous increase in burial depth and temperature, skeletal fragments of siliceous zooplanktons were dissolved and reprecipitated, converting opal-A into opal-CT, and then forming microcrystalline authigenic quartz [55,59]. The rigid framework formed by recrystallized quartz can protect primary intergranular pores from collapsing due to increased mechanical compaction. In addition, numerous inter-crystalline pores were generated between microcrystalline quartz crystals. At this stage, organic matter is immature, and no secondary organic matter pores were developed.

5.2.2. The Middle Diagenetic Stages

At the middle diagenetic stages, the residual primary intergranular pores are further reduced under the influence of mechanical compaction. The conversion of smectite to illite and the release of excess Si could provide the Si source for the precipitation of authigenic quartz [44]. The quartz cement occupies part of the pore space, further reducing the primary intergranular pores. At the oil window stage, solid bitumen or liquid hydrocarbons from the thermal evolution of organic matter fill the remaining matrix mineral pores. Within the condensate and wet gas window, solid bitumen or liquid hydrocarbon were thermally cracked into gaseous hydrocarbons, resulting in the development of many pores in the secondary organic matter. During the middle diagenetic stage, with the generation of oil and gas, a large amount of carboxylate ions was released into the pore fluid and chemically reacted with unstable mineral components (such as feldspar and carbonate), generating dissolution pores [8,42].

5.2.3. The Late Diagenetic Stages

At the late diagenetic stages, the mechanical compaction has a limited influence on the pore network. The shale rock was extremely dense, showing the characteristics of low porosity and ultra-low permeability [19,31,60]. Most of the organic matter was in the dry gas window. The residual organic matter is further pyrolyzed to generate gaseous hydrocarbons, and many bubble-like pores were developed within the secondary organic matter [5,61,62].

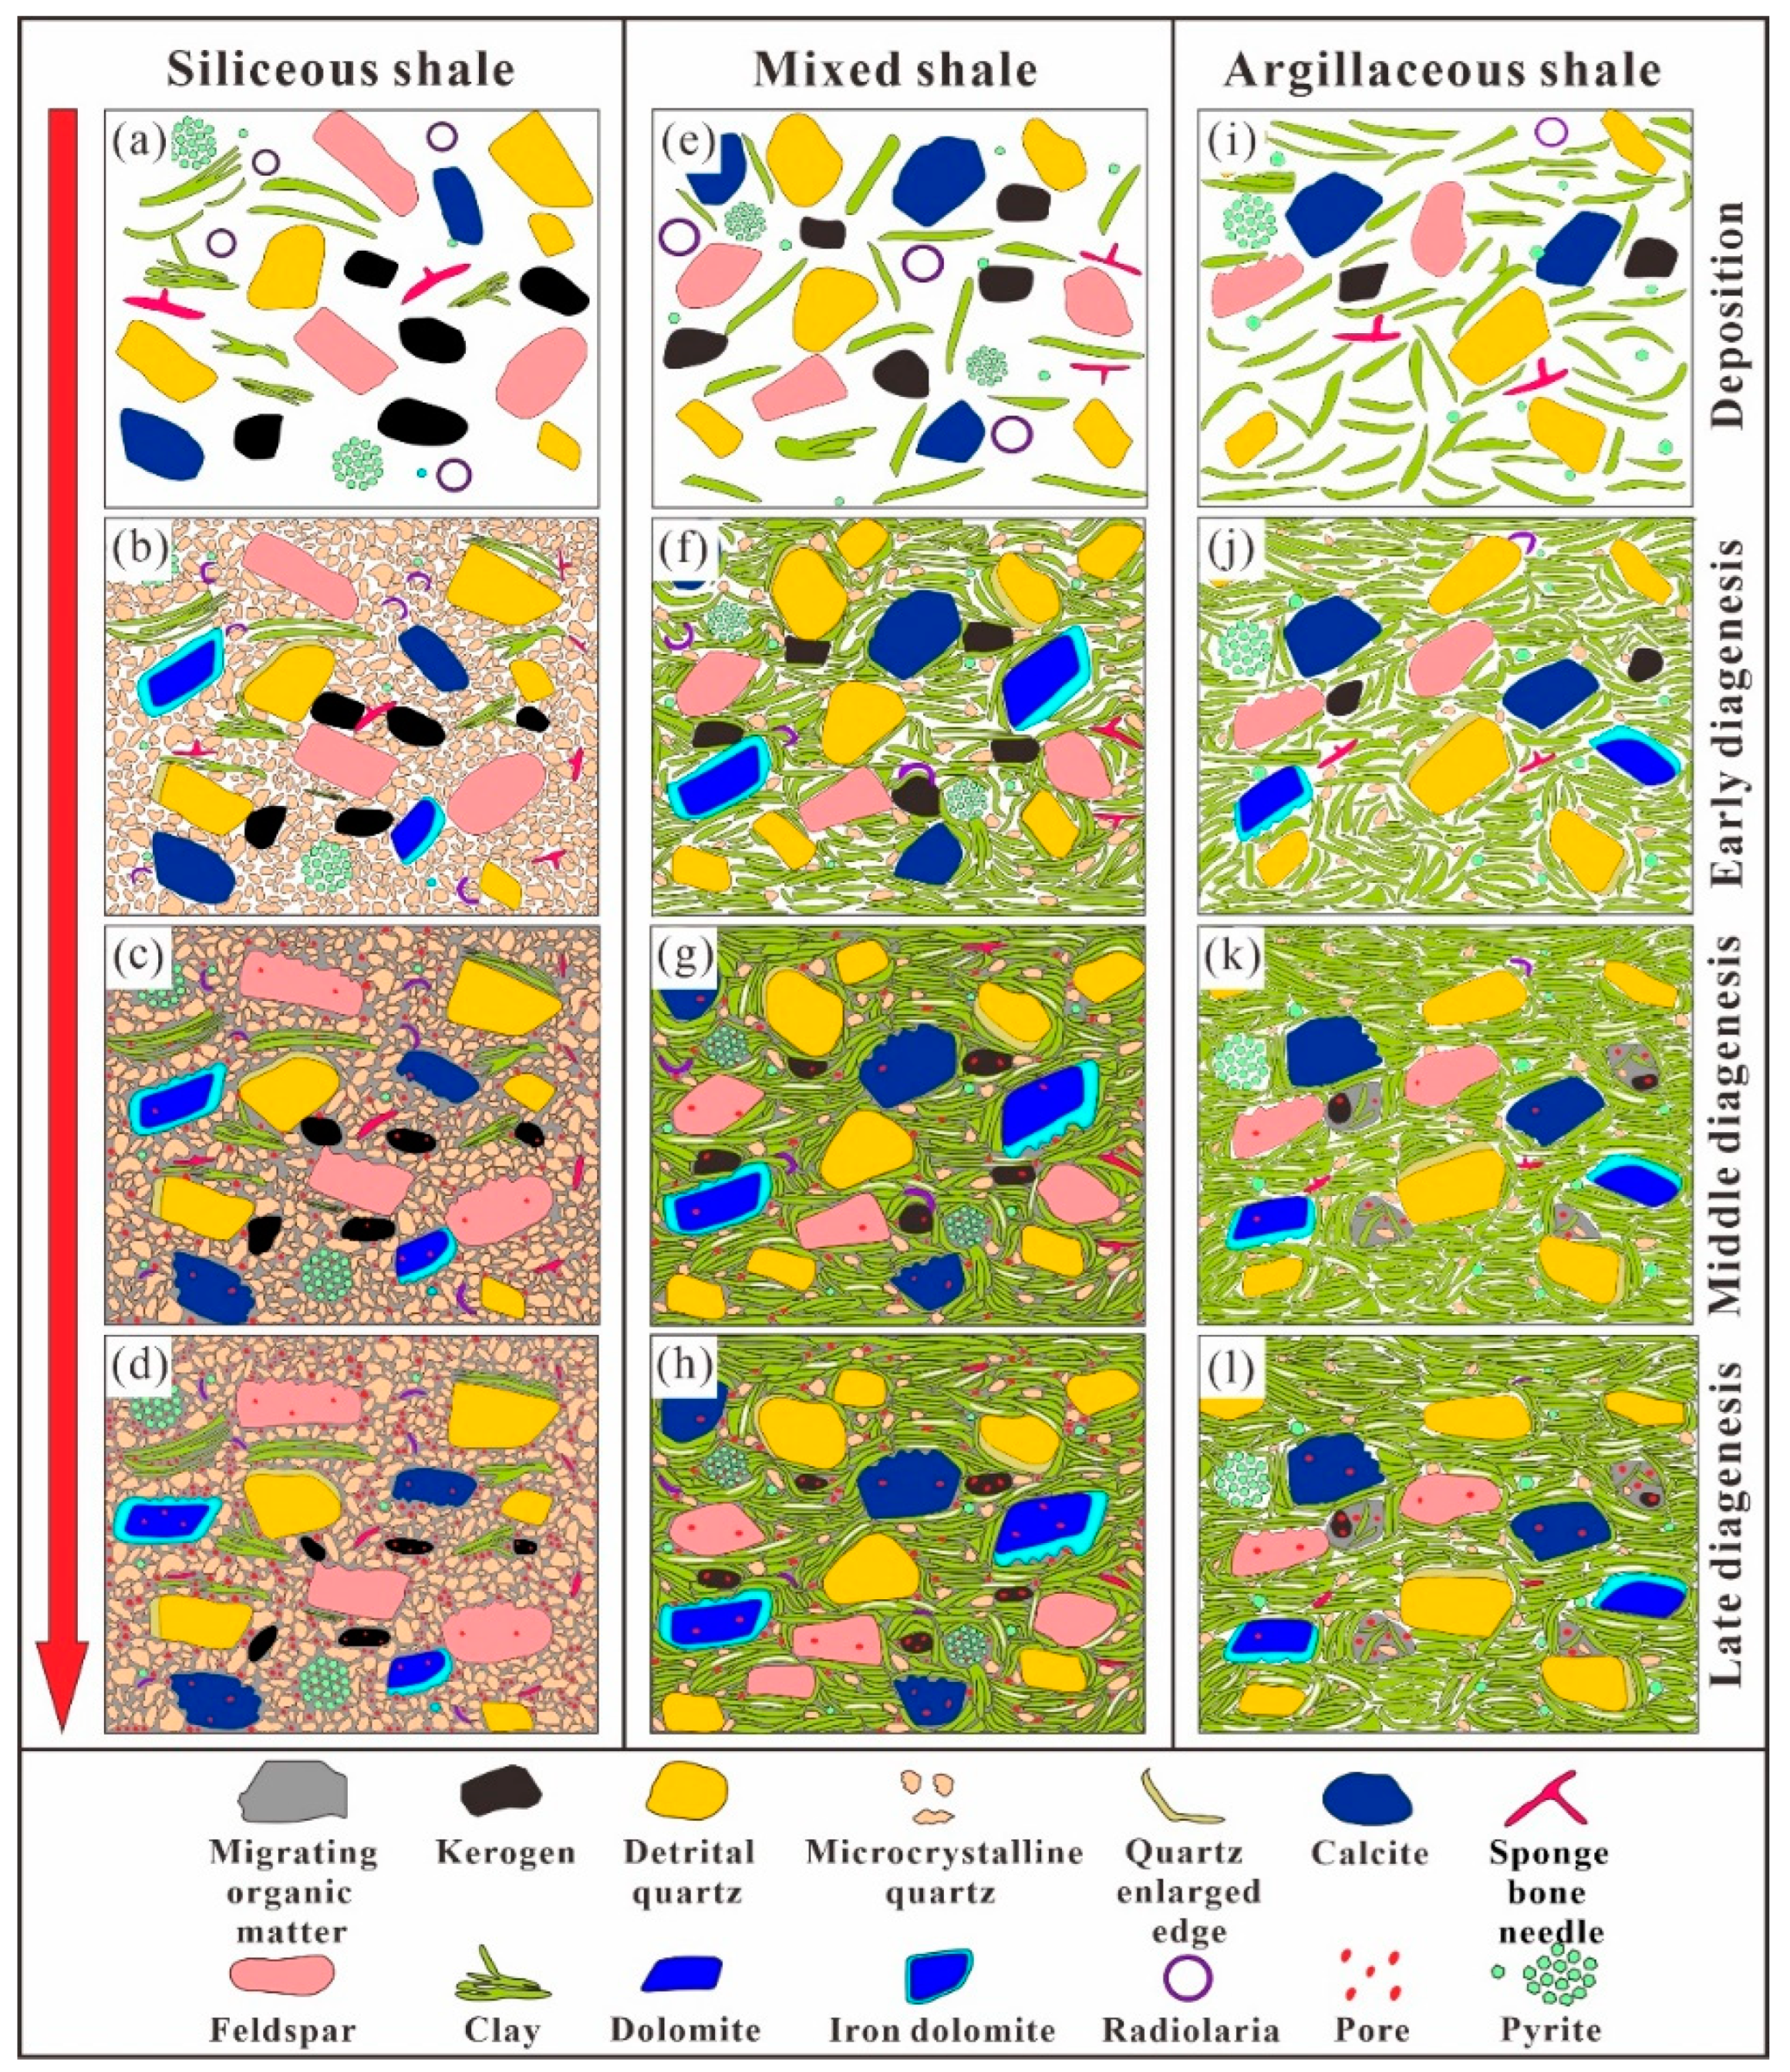
5.3. Pore Evolution Models of Different Lithofacies

Different shale lithofacies have different rock compositions and textures; therefore, the diagenetic pathways are different, thus causing different porosity evolution models.

5.3.1. Siliceous Shale

Siliceous shales with high quartz and TOC contents were usually developed in the WF Formation and the lower part of the LMX Formation. Previous studies showed that siliceous shale lithofacies were generally deposited in anoxic water columns with high paleoproductivity, resulting in relatively high TOC content [28,63,64]; moreover, a large number of siliceous organisms were preserved in the siliceous shales (Figure 15a).
In the early diagenetic stage, through microbial action, pyrite, calcite, and dolomite were gradually formed (Figure 15b). Combined with the Fe3+ supplied by clay reactions, the Fe-rich dolomite was developed around the dolomite. The primary pores were destroyed under the mechanical compaction, resulting in decreased porosity. Siliceous shales contain abundant microcrystalline; therefore, the large number of authigenic quartz formed a rigid framework and an effective stress support system, which protected the intergranular pores from collapsing and weakened the further destruction of the reservoir pore system caused by compaction (Figure 15b). Siliceous shale generally exhibited relatively weak compaction. Therefore, the preservation degree of primary pores in siliceous shales is relatively higher than that of argillaceous shales and siliceous–argillaceous mixed shales. In the middle diagenetic stage (Figure 15c), the organic matter entered into the oil window, and a large amount of liquid hydrocarbon was generated and filled into intergranular pores. At this stage, carbonate and feldspar may be partially dissolved with the organic acids that generated from organic matter maturation, forming intraparticle pores. With increased temperature, smectite was gradually transformed into illite and smectite–illite mixed layers. In the late diagenetic stage (Figure 15d), the organic matter entered into the dry gas window, and abundant organic pores were produced with further thermal cracking of oil and solid bitumen into pyrobitumen. Organic pore is the dominant pore type in siliceous shale that is characterized by high authigenic quartz content.

5.3.2. Siliceous–Argillaceous Mixed Shale

Compared with siliceous shale, mixed shale has relatively low organic matter and quartz content, but a relatively high clay content (Figure 15e). The mixed shale was formed under suboxic and anoxic water columns with moderate paleoproductivity [63,64]. At the early diagenetic stage (Figure 15f), the primary intergranular pores were rapidly reduced due to the compaction of the overlying strata evidenced by the clay minerals that were distributed along the edge of brittle minerals. During the middle diagenetic stage (Figure 15g), some bitumen was observed to fill in intergranular pores, and organic pores were developed in these pore-filling bitumen. Due to dissolution by organic acids, a few intraparticle pores were formed within carbonate and feldspar minerals. At the late diagenetic stage, the OM pores in the bitumen were further developed with increased maturity (Figure 15h). Compared to siliceous shale, the siliceous–argillaceous mixed shale has a lesser abundance of organic pores, probably due to the fact that this lithofacies has moderate TOC and quartz content.

5.3.3. Argillaceous Shale

Argillaceous shale is characterized by low quartz, low TOC content, and high clay mineral content. At deposition (Figure 15i), the argillaceous shale was formed in oxic to suboxic water columns low paleoproductivity [63,64], resulting in a relatively low TOC content.
In the early diagenetic stage, plastic clay minerals were extruded and deformed, and their morphology was arranged in layers or bent along the edge of brittle minerals (Figure 15j). Overall, argillaceous shale is more affected by mechanical compaction. Due to the high content of plastic minerals, especially clays, the primary inorganic pores were easily destroyed due to mechanical compaction. During the middle diagenetic stage (Figure 15k), with increased maturity, a few OM pores were gradually developed, and a certain number of inorganic pores were developed due to dissolution. In the late diagenetic stage (Figure 15l), the number of OM pores was increased due to further thermal cracking of few oils and bitumen into gas. Compared to siliceous and siliceous–argillaceous mixed shales, the argillaceous shale has a relatively low porosity simply due to low TOC content and high clay content that can be easily compacted.

6. Conclusions

Multiple major conclusions can be drawn:
(1).
Three major lithofacies were identified in the WF-LMX formations, including siliceous shales, siliceous–argillaceous mixed shales, and argillaceous shales. Compared to other lithofacies, siliceous shales have relatively high TOC and quartz contents.
(2).
Four types of pores can be identified in the WF-LMX shales, mainly including organic pores, interparticle pores, and intraparticle pores and fractures; the organic pore is dominant pore type. There are significant differences in pore development among different lithofacies. The pore volume and surface area of micropores, mesopores, and macropores of siliceous shales are larger than those of siliceous–argillaceous mixed and argillaceous shales. Organic matter combustion experiments showed that micropores and mesopores are largely contributed by organic pores, while macropores may be contributed by both organic and inorganic pores.
(3).
Early diagenesis was characterized by compaction, pyrite precipitation, and authigenic quartz cementation. Compaction was the main factor driving declined porosity. The thermal degradation of organic matter, transformation of clay minerals, and dissolution of carbonate minerals were the dominant processes in middle diagenesis. The secondary cracking of residual organic matter was the main diagenetic event in late diagenesis. They together controlled the collapse of primary pores and generation of secondary pores, leading to shale reservoir quality.
(4).
The siliceous shale is characterized by high TOC and biogenic silica contents. During the early and middle diagenetic stages, recrystallization of biogenic silica can form a rigid framework that is resistant to overlying mechanical compaction. The generated oil and bitumen from organic matter maturation filled into pore spaces between microcrystalline quartz crystals can produce numerous organic pores through thermal cracking at the gas window. Thus, the porosity of siliceous shale is well developed, which is also of great significance for later development. On the contrary, the argillaceous shale is characterized by low TOC and high clay content. The primary pore space of argillaceous shales is greatly reduced under mechanical compaction simply due to the plastic behavior of clays.

Author Contributions

Methodology, T.D.; Software, K.H.; Validation, K.H.; Formal analysis, T.D. and C.W.; Resources, Z.H. and S.L.; Data curation, T.D. and C.W.; Writing—original draft, T.D.; Writing—review & editing, T.D.; Visualization, T.D.; Supervision, T.D., Z.H., J.G. and S.L.; Project administration, Z.H., J.G. and S.L.; Funding acquisition, J.G. and S.L. All authors have read and agreed to the published version of the manuscript.

Funding

This study was financially supported by the SINOPEC Key Laboratory of Geology and Resources in Deep Stratum Foundation (No. 33550000-22-ZC0613-0252), and jointly funded by the National Natural Science Foundation (Nos. U19B6003, U20B6001 and 42002137).

Institutional Review Board Statement

Not applicable.

Informed Consent Statement

Not applicable.

Data Availability Statement

The original contributions presented in the study are included in the article, further inquiries can be directed to the corresponding author.

Conflicts of Interest

The authors declare that they have no known competing financial interests or personal relationships that might have influenced the work presented in this article.

References

  1. Nie, H.; Li, P.; Dang, W.; Ding, J.; Sun, X.; Liu, M.; Wang, J.; Du, W.; Zhang, P.; Li, D.; et al. Enrichment characteristics and exploration directions of deep shale gas of Ordovician Silurian in the Sichuan Basin and its surrounding areas, China. Petrol. Explor. Dev. 2022, 49, 648–659. [Google Scholar] [CrossRef]
  2. Zou, C.; Dong, D.; Wang, S.; Li, J.; Li, X.; Wang, Y.; Li, D.; Cheng, K. Geological characteristics and resource potential of shale gas in China. Petrol. Explor. Dev. 2010, 37, 641–653. [Google Scholar] [CrossRef]
  3. Guo, X.; Teng, G.; Wei, X.; Yu, L.; Lu, X.; Sun, L.; Wei, F. Occurrence mechanism and exploration potential of deep marine shale gas in Sichuan Basin. Acta Pet. Sin. 2022, 43, 453–468. [Google Scholar]
  4. Zhao, J.; Jin, Z.; Jin, Z.; Hu, Q.; Hu, Z.; Du, W.; Yan, C.; Geng, Y. Mineral types and organic matters of the Ordovician-Silurian Wufeng and Longmaxi Shale in the Sichuan Basin, China: Implications for pore systems, diagenetic pathways, and reservoir quality in fine-grained sedimentary rocks. Mar. Pet. Geol. 2017, 86, 655–674. [Google Scholar] [CrossRef]
  5. Dong, T.; He, S.; Chen, M.; Hou, Y.; Guo, X.; Wei, C.; Han, Y.; Yang, R. Quartz types and origins in the paleozoic Wufeng-Longmaxi Formations, Eastern Sichuan Basin, China: Implications for porosity preservation in shale reservoirs. Mar. Petrol. Geol. 2019, 106, 62–73. [Google Scholar] [CrossRef]
  6. Chalmers, G.R.L.; Bustin, R.M.; Power, I.M. Characterization of gas shale pore systems by porosimetry, pycnometry, surface area, and field emission scanning electron microscopy/transmission electron microscopy image analyses: Examples from the Barnett, Woodford, Haynesville, Marcellus, and Doig units. AAPG Bull. 2012, 96, 1099–1119. [Google Scholar]
  7. Loucks, R.G.; Reed, R.M.; Ruppel, S.C.; Jarvie, D.M. Morphology, genesis, and distribution of nanometer-scale pores in siliceous mudstones of the Mississippian Barnett Shale. J. Sediment. Res. 2009, 79, 848–861. [Google Scholar] [CrossRef]
  8. Loucks, R.G.; Reed, R.M.; Ruppel, S.C.; Hammes, U. Spectrum of pore types and networks in mudrocks and a descriptive classification for matrix-related mudrock pores. AAPG (Am. Assoc. Pet. Geol.) Bull. 2012, 96, 1071–1098. [Google Scholar] [CrossRef]
  9. Katz, B.J.; Arango, I. Organic porosity: A geochemist’s view of the current state of understanding. Org. Geochem. 2018, 123, 1–16. [Google Scholar] [CrossRef]
  10. Fishman, N.S.; Hackley, P.C.; Lowers, H.A.; Hill, R.J.; Egenhoff, S.O.; Eberl, D.D.; Blum, A.E. The nature of porosity in organic-rich mudstones of the Upper Jurassic Kimmeridge Clay Formation, North Sea, offshore United Kingdom. Int. J. Coal Geol. 2012, 103, 32–50. [Google Scholar] [CrossRef]
  11. Milliken, K.L.; Esch, W.L.; Reed, R.M.; Zhang, T. Grain assemblages and strong diagenetic overprinting in siliceous mudrocks, Barnett Shale (Mississippian), Fort Worth Basin, Texas. AAPG Bull. 2012, 96, 1553–1578. [Google Scholar] [CrossRef]
  12. Milliken, K.L.; Rudnicki, M.; Awwiller, D.N.; Zhang, T. Organic matter-hosted pore system, Marcellus Formation (Devonian), Pennsylvania. AAPG Bull. 2013, 97, 177–200. [Google Scholar] [CrossRef]
  13. Pommer, M.; Milliken, K.L. Pore types and pore-size distributions across thermal maturity, Eagle Ford Formation, southern Texas. AAPG Bull. 2015, 99, 1713–1744. [Google Scholar] [CrossRef]
  14. Dewhurst, D.N.; Aplin, A.C.; Sarda, J.P.; Yang, Y. Compaction-driven evolution of porosity and permeability in natural mudstones: An experimental study. J. Geophys. Res. 1998, 103, 651–661. [Google Scholar] [CrossRef]
  15. Mastalerz, M.; Hampton, L.; Drobniak, A.; Loope, H. Significance of analytical particle size in low-pressure N2 and CO2 adsorption of coal and shale. Int. J. Coal Geol. 2017, 178, 122–131. [Google Scholar] [CrossRef]
  16. Liu, S.; Yang, Y.; Deng, B.; Zhong, Y.; Wen, L.; Sun, W.; Li, Z.; Jansa, L.; Li, j.; Song, J.; et al. Tectonic evolution of the Sichuan Basin, Southwest China. Earth Sci. Rev. 2021, 213, 1–18. [Google Scholar] [CrossRef]
  17. Wang, Q.; Wang, T.; Liu, W.; Zhang, J.; Feng, Q.; Lu, H.; Peng, P.A. Relationships among composition, porosity and permeability of Longmaxi Shale reservoir in the Weiyuan Block, Sichuan Basin, China. Mar. Pet. Geol. 2019, 102, 33–47. [Google Scholar] [CrossRef]
  18. Karayigit, A.I.; Oskay, R.G.; Bulut, Y.; Mastalerz, M. Meso- and microporosity characteristics of Miocene lignite and subbituminous coals in the Kınık coalfield (Soma Basin, W. Turkey). Int. J. Coal Geol. 2020, 232, 103624. [Google Scholar] [CrossRef]
  19. Wang, R.; Hu, Z.; Bao, H.; Wu, J.; Du, W.; Wang, P.; Peng, Z.; Lu, T. Diagenetic evolution of key minerals and its controls on reservoir quality of Upper Ordovician Wufeng-Lower Silurian Longmaxi shale of Sichuan Basin. Petrol. Geol. Exper. 2021, 6, 996–1005. [Google Scholar]
  20. Dai, J.; Zou, C.; Liao, S.; Dong, D.; Ni, Y.; Huang, J.; Wu, W.; Gong, D.; Huang, S.; Hu, G. Geochemistry of the extremely high thermal maturity Longmaxi shale gas, southern Sichuan Basin. Org. Geochem. 2014, 74, 3–12. [Google Scholar] [CrossRef]
  21. Fan, C.; Li, H.; Zhong, C.; Qin, Q.; Hu, D.; Zhang, Y.; He, S.; Zhang, W. Tectonic fracture stages and evolution model of Longmaxi Formation shale, Dingshan structure, Southeast Sichuan. Acta Pet. Sin. 2018, 39, 379–390. [Google Scholar]
  22. Lu, Z.; He, Z.; Yu, C.; Ye, X.; Li, H.; Du, W.; Nie, H. The structural features are mainly composed of high steep anticlinal zone and fault zone, which are composed of barrier and preitetrough folds, and arranged in parallel. Oil Gas Geol. 2021, 42, 86–97. [Google Scholar]
  23. Zou, C.; Zhu, R.; Chen, Z.; Ogg, J.; Wu, S.; Dong, D.; Qiu, Z.; Wang, Y.; Wang, L.; Lin, S.; et al. Organic-matter-rich shales of China. Earth Sci. Rev. 2019, 189, 104134. [Google Scholar] [CrossRef]
  24. Liu, Z.; Algeo, T.J.; Guo, X.; Fan, J.; Du, X.; Lu, Y. Paleo-environmental cyclicity in the Early Silurian Yangtze Sea (South China): Tectonic or glacio-eustatic control? Palaeogeogr. Palaeoclimatol. Palaeoecol. 2017, 466, 59–76. [Google Scholar] [CrossRef]
  25. Lu, Y.; Jiang, S.; Lu, Y.; Xu, S.; Shu, Y.; Wang, Y. Productivity or preservation? The factors controlling the organic matter accumulation in the late Katian through Hirnantian Wufeng organic-rich shale, South China. Mar. Petrol. Geol. 2019, 109, 22–35. [Google Scholar] [CrossRef]
  26. Chen, X.; Fan, J.; Melchin, M.; Mitchell, C. Hirnantian (Latest Ordovician) graptolites from the upper Yangtze region, China. Palaeontology 2005, 48, 235–280. [Google Scholar]
  27. Chen, X.; Rong, J.; Fan, J.; Zhan, R.; Mitchell, C.; Harper, D.; Melchin, M.; Peng, P.; Finney, S.; Wang, X. The global boundary stratotype Section and point (GSSP) for the base of the Hirnantian Stage (the uppermost of the Ordovician System). Episodes 2006, 29, 183–196. [Google Scholar] [CrossRef]
  28. Li, Y.; Wang, X.; Wu, B.; Li, G.; Wang, D. Sedimentary facies of marine shale gas formations in Southern China: The Lower Silurian Longmaxi Formation in the southern Sichuan Basin. J. Earth Sci. 2016, 27, 807–822. [Google Scholar] [CrossRef]
  29. Ravikovitch, P.I.; Neimark, A.V. Density functional theory model of adsorption on amorphous and microporous silica materials. Langmuir 2006, 22, 10864–10868. [Google Scholar] [CrossRef]
  30. Barret, E.P.; Joyner, L.G.; Halenda, P.P. The determination of pore volume and area distribution in porous substances. I. Computations from nitrogen isotherms. J. Am. Chem. Soc. 1951, 73, 373–380. [Google Scholar] [CrossRef]
  31. Schieber, J. Common themes in the formation and preservation of intrinsic porosity in shales and mudstones-illustrated with examples across the Phanerozoic. In Proceedings of the SPE Unconventional Gas Conference, Pittsburgh, PA, USA, 23–25 February 2010. SPE 132370. [Google Scholar]
  32. Loucks, R.G.; Reed, R.M.; Ruppel, S.C. Mississippian Barnett Shale: Lithofacies and depositional setting of a deep-water shale-gas succession in the Fort Worth Basin, Texas. AAPG (Am. Assoc. Pet. Geol.) Bull. 2007, 91, 579–601. [Google Scholar] [CrossRef]
  33. Wang, G.C.; Carr, T.R. Methodology of organic-rich shale lithofacies identificationand prediction: A case study from Marcellus Shale in the Appalachian basin. Comput. Geosci. 2012, 49, 151–163. [Google Scholar] [CrossRef]
  34. Jia, A.; Hu, D.; He, S.; Guo, X.; Hou, Y.; Wang, T.; Yang, R. Variations of Pore Structure in Organic-Rich Shales with Different Lithofacies from the Jiangdong Block, Fuling Shale Gas Field, SW China: Insights into Gas Storage and Pore Evolution. Energy Fuels 2020, 34, 12457–12475. [Google Scholar] [CrossRef]
  35. Wang, C.; Dong, T.; Jiang, S.; Zhang, Y.; Yang, L.; Liang, X.; Wang, G. Vertical heterogeneity and the main controlling factors of the Upper Ordovician-Lower Silurian Wufeng-Longmaxi shales in the Middle Yangtze Region. Bull. Geol. Sci. Technol. 2022, 41, 108–121. [Google Scholar]
  36. Reed, R.M.; Loucks, R.G. Imaging nanoscale pores in the Mississippian Barnett Shale of the northern Fort Worth Basin (abs.). AAPG Annu. Conv. Abstr. 2007, 16, 115. [Google Scholar]
  37. Sing, K.S.W.; Everett, D.H.; Haul, R.A.W.; Moscou, L.; Pierotti, R.A.; Rouquérol, J.; Siemieniewska, T. Reporting physisorption data for gas/solid systems with special reference to the determination of surface area and porosity. Pure Appl. Chem. 1985, 57, 603–619. [Google Scholar] [CrossRef]
  38. Wang, Y.; Zhu, Y.M.; Chen, S.B. Characteristics of the nanoscale pore structure in Northwestern Hunan shale gas reserviors using filed emission scanning electron microscopy, high-pressure mercury intrusion, and gas adsorption. Energy Fuels 2014, 28, 945–955. [Google Scholar] [CrossRef]
  39. Thommes, M.; Kaneko, K.; Neimark, A.V.; Olivier, J.; Rodriguez-Reinoso, F.; Rouquerol, J.; Sing, K. Physisorption of gases, with special reference to the evaluation of surface area and pore size distribution (IUPAC Technical Report). Pure Appl. Chem. 2015, 87, 1051–1069. [Google Scholar] [CrossRef]
  40. Milliken, K.L.; Ergene, S.M.; Ozka, A. Quartz types, authigenic and detrital, in the upper cretaceous eagle ford formation, south Texas, USA. Sediment. Geol. 2016, 339, 273–288. [Google Scholar] [CrossRef]
  41. Ji, W.; Hao, F.; Schulz, H.M.; Song, Y.; Tian, J. The architecture of organic matter and its pores in highly mature gas shales of the lower Silurian Longmaxi Formation in the upper Yangtze platform, south China. AAPG Bull. 2019, 103, 2909–2942. [Google Scholar] [CrossRef]
  42. Löhr, S.C.; Baruch, E.T.; Hall, P.A.; Kennedy, M.J. Is organic pore development in gas shales influenced by the primary porosity and structure of thermally immature organic matter. Org. Geochem. 2015, 87, 119–132. [Google Scholar] [CrossRef]
  43. Hower, J.; Eslinger, E.V.; Hower, M.E. Mechanism of burial metamorphism of argillaceous sediment: 1. Mineralogical and chemical evidence. GSA Bull. 1976, 87, 725–737. [Google Scholar] [CrossRef]
  44. Peltonen, C.; Marcussen, Ø.; Bjørlykke, K.; Jahren, J. Clay mineral diagenesis and quartz cementation in mudstones: The effects of smectite to illite reaction on rock properties. Mar. Petrol. Geol. 2009, 26, 887–898. [Google Scholar] [CrossRef]
  45. Huang, S.; Huang, K.; Feng, W.; Tong, H.; Liu, L.; Zhang, X. Mass exchanges among feldspar, kaolinite and illite and their influences on secondary porosity formation in clastic diagenesis–A case study on the Upper Paleozoic, Ordos Basin and Xujiahe Formation, Western Sichuan Depression. Geochemical 2009, 38, 498–506. [Google Scholar]
  46. Stixrude, L.; Peacor, D.R. First-principles study of illite-smectite and implications for clay mineral systems. Nature 2002, 420, 165–168. [Google Scholar] [CrossRef] [PubMed]
  47. Curtis, M.E.; Cardott, B.J.; Sondergeld, C.H.; Rai, C.S. Development of organic porosity in the Woodford Shale with increasing thermal maturity. Int. J. Coal Geol. 2012, 103, 26–31. [Google Scholar] [CrossRef]
  48. Chen, Z.; Song, Y.; Jiang, Z.; Liu, S.; Li, Z.; Shi, D.; Yang, W.; Yang, Y.; Song, J.; Gao, F.; et al. Identification of organic matter components and organic pore characteristics of marine shale: A case study of Wufeng-Longmaxi shale in southern Sichuan Basin, China. Mar. Pet. Geol. 2019, 109, 56–69. [Google Scholar] [CrossRef]
  49. Piane, C.D.; Ansari, H.; Li, Z.; Mata, J.; Rickard, W.; Pini, R.; Dewhurst, D.N.; Sherwood, N. Influence of organic matter type on porosity development in the Wufeng-Longmaxi Shale: A combined microscopy, neutron scattering and physisorption approach. Int. J. Coal Geol. 2022, 249, 103880. [Google Scholar] [CrossRef]
  50. Teng, J.; Liu, B.; Mastalera, M.; Schieber, J. Origin of organic matter and organic pores in the overmature Ordovician-Silurian Wufeng-Longmaxi Shale of the Sichuan Basin, China. Int. J. Coal Geol. 2022, 253, 103970. [Google Scholar] [CrossRef]
  51. Ross, D.J.K.; Bustin, R.M. The importance of shale composition and pore structure upon gas storage potential of shale gas reservoirs. Mar. Pet. Geol. 2009, 26, 916–927. [Google Scholar] [CrossRef]
  52. Liang, C.; Jiang, Z.; Yang, Y.; Wei, X. Shale lithofacies and reservoir space of the Wufeng- Longmaxi formation, Sichuan Basin, China. Pet. Explor. Dev. 2012, 39, 736–743. [Google Scholar] [CrossRef]
  53. Xiong, J.; Liu, X.; Liang, L. Experimental study on the pore structure characteristics of the Upper Ordovician Wufeng Formation shale in the southwest portion of the Sichuan Basin, China. J. Nat. Gas. Sci. Eng. 2015, 22, 530–539. [Google Scholar] [CrossRef]
  54. Guan, Q.; Dong, D.; Zhang, H.; Sun, S.; Zhang, S.; Guo, W. Types of biogenic quartz and its coupling storage mechanism in organic-rich shales: A case study of the Upper Ordovician Wufeng Formation to Lower Silurian Longmaxi Formation in the Sichuan Basin, SW China. Petrol. Explor. Dev. 2021, 48, 813–823. [Google Scholar] [CrossRef]
  55. Zhao, J.; Jin, Z.; Jin, Z.; Wen, X.; Geng, Y. Origin of authigenic quartz in organic rich shales of the Wufeng and Longmaxi Formations in the Sichuan Basin, South China: Implications for pore evolution. J. Nat. Gas Sci. Eng. 2017, 38, 21–38. [Google Scholar] [CrossRef]
  56. Xu, E.; Li, Z.; Yang, Z. Thermal and hydrocarbon generation history of Wufeng and Longmaxi shales in Pengshui area, eastern Sichuan Basin: A well PY1 case study. Exp. Petrol. Geol. 2015, 37, 494–499. [Google Scholar]
  57. Wilkin, R.; Barnes, H. Formation processes of framboidal pyrite. Geochim. Cosmochim. Acta 1997, 61, 323–339. [Google Scholar] [CrossRef]
  58. Roberts, A.P.; Turner, G.M. Diagenetic formation of ferrimagnetic iron sulphide minerals in rapidly deposited marine sediments, South Island, New Zealand. Earth Planet. Sci. Lett. 1993, 115, 257–273. [Google Scholar] [CrossRef]
  59. Aplin, A.C.; Macquaker, J.H.S. Mudstone diversity: Origin and implications for source, seal, and reservoir properties in petroleum systems. AAPG Bull. 2012, 95, 2031–2059. [Google Scholar] [CrossRef]
  60. Bjørlykke, K. Clay Mineral Diagenesis in Sedimentary Basins: A Key to the Prediction of Rock Properties, Examples from the North Sea Basin. Clay Miner. 1998, 33, 15–34. [Google Scholar] [CrossRef]
  61. Camp, W.K. Diagenetic evolution of organic matter cements: Implications for unconventional shale reservoir quality prediction. In Mudstone Diagenesis: Research Perspectives for Shale Hydrocarbon Reservoirs, Seals, and Source Rocks; Camp, W., Milliken, K., Taylor, K., Fishman, N., Hackley, P., Macquaker, J., Eds.; AAPG Memoir: Tulsa, OK, USA, 2019; Volume 120, pp. 209–224. [Google Scholar]
  62. Misch, D.; Gross, D.; Hawranek, G.; Horsfield, B.; Klaver, J.; Mendez-Martin, F.; Urai, J.L. Solid bitumen in shales: Petrographic characteristics and implications for reservoir characterization. Int. J. Coal Geol. 2019, 205, 14–31. [Google Scholar] [CrossRef]
  63. Wei, C.; Dong, T.; He, Z.; He, S.; He, Q.; Yang, R.; Guo, X.; Hou, Y. Major, trace-elemental and sedimentological characterization of the upper Ordovician Wufeng-lower Silurian Longmaxi formations, Sichuan Basin, south China: Insights into the effect of relative sea-level fluctuations on organic matter accumulation in shales. Mar. Petrol. Geol. 2021, 126, 104905. [Google Scholar] [CrossRef]
  64. Feng, Y.; Xiao, X.; Gao, P.; Wang, E.; Hu, D.; Liu, R.; Li, G.; Lu, C. Restoration of sedimentary environment and geochemical features of deep marine Longmaxi shale and its significance for shale gas: A case study of the Dingshan area in the Sichuan Basin, South China. Mar. Petrol. Geol. 2023, 151, 106186. [Google Scholar] [CrossRef]
Figure 1. (A) Geological map showing study area in the Sichuan Basin, southwest China. (B) Structural map showing the studied Dingshan area (modified from [20]).
Applsci 14 07661 g001
Figure 2. Stratigraphic column of the Ordovician Wufeng–Lower Silurian Longmaxi formations showing lithology, gamma ray (GR) log, density (DEN) log, acoustic transit time (AC) log, and TOC content of wells (A) DA and (B) DB. Abbreviations: Ordo. = Ordovician, Sy. = System, Se. = Series, Fm. = Formation, Me. = Member, Lith. = Lithology.
Applsci 14 07661 g002
Figure 3. Percentage of bulk mineralogy of well DA (left) and DB (right) determined from X-ray diffraction analysis.
Applsci 14 07661 g003
Figure 4. Shale lithofacies classification of well DA (A) and DB (B). Siliceous lithofacies (SL), mixed lithofacies (ML) refers to mixed argillaceous–siliceous mixed shales, argillaceous lithofacies (AL), and calcareous lithofacies (CL).
Applsci 14 07661 g004
Figure 5. Characteristics of the three major lithofacies identified in the Wufeng–Longmaxi shales. (A) Core photograph of siliceous shale showing abundant graptolites, well DB, depth = 3812.4 m; (B) Thin section image of siliceous shale showing clay and silt-sized quartz, well DB, depth = 3812.4 m; (C) Core photograph of siliceous–argillaceous mixed shale showing a moderate amount of graptolites, well DA, depth = 2247.09 m; (D) Core photograph of siliceous–argillaceous mixed shale with less amount of graptolites, well DB, depth = 3792.44 m; (E) Core photograph of argillaceous shale showing a few graptolites, well DA, depth = 2220.08 m; (F) Thin section of argillaceous shale showing a large amount of silt-sized detrital quartz, well DB, depth = 3765.57 m.
Applsci 14 07661 g005
Figure 6. SEM images showing organic matter pores in the Wufeng–Longmaxi shales. (A,B) Oval-shaped organic pores, well DA, depth = 2247.09 m; (C) Round-shaped organic pores, well DB, depth = 3799.28 m; (D,E) Cellular organic pores, well DB, depth = 3809.24 m; (F) Organic pores developed between framboidal pyrite crystals, well DA, depth = 2247.09 m.
Applsci 14 07661 g006
Figure 7. SEM images showing inorganic pores in the Wufeng–Longmaxi shales. (A) Intergranular pores, well DA, depth = 2247.09 m; (B) Intergranular pores between clay and calcite particles, and dissolved intraparticle pores within calcite, well DA, depth = 2262.2 m; (C) Intergranular pores and fractures, well DB, depth = 2267.7 m; (D) Intraparticle pores within calcite particle, well DA, depth = 2247.09 m; (E) Intraparticle pores within calcite particle, well DB, depth = 3799.28 m; (F) Intraparticle pores within dolomite particle, well DA, depth = 2267.7 m; (G) Micro-fracture pores developed between organic matter and minerals, well DB, depth = 3817.27 m; (H) Micro-fractures between clay platelets, well DB, depth = 3765.57 m; (I) Micro-fracture pores developed between organic matter and minerals, well DA, depth = 2269.74 m.
Applsci 14 07661 g007
Figure 8. Pore size distribution calculated from CO2 and N2 adsorption isotherms for (A) argillaceous shales, (B) siliceous–argillaceous mixed shales, and (C) siliceous shales.
Applsci 14 07661 g008
Figure 9. SEM images showing pores after combustion in the Wufeng–Longmaxi shales. (A) Intergranular pores between authigenic quartz aggregates, well DB, depth = 3812.4 m; (B) EDS map confirming the identification of quartz minerals, the same area to A; (C) Intraparticle pores between framboidal pyrite crystals, well DA, depth = 2267.7 m; (D) Intergranular pores and intraparticle pores, well DA, depth = 2267.7 m; (E) Intergranular pores, well DA, depth = 2267.7 m; (F) Intergranular pores between clay platelets, well DB, depth = 3812.4 m.
Applsci 14 07661 g009
Figure 10. The comparison of pore volume (A,B) and surface area (C,D) between pre-combustion and after combustion samples. Pre: pre-combustion, Post: post-combustion.
Applsci 14 07661 g010
Figure 11. Mineral types and diagenetic modifications. (A) The plastic clay minerals were banded and oriented under mechanical compaction, well DA, depth = 2267.7 m; (B) The plastic clay minerals were banded and oriented under mechanical compaction, well DA, depth = 2247.09 m; (C) OM filled in the interparticle pores between authigenic quartz crystals, well DA, depth = 2267.7 m; (D) OM filled in the interparticle pores between authigenic quartz crystals, well DA, depth = 2267.7 m; (E) EDS images confirming the quartz identification (red color), the same area to D; (F) CL image showing quartz overgrowth and detrital quartz, the same area to D; (G) Calcite and iron-rich dolomite, well B, depth = 3799.28 m; (H) BSE image showing Fe-rich dolomite, well DB, depth = 3817.27 m; (I) EDS image confirming the identification of Fe-rich dolomite, well DB, depth = 3817.27 m; (J) Numerous pyrite crystals were developed between clay flakes, well DA, depth = 2262.2 m; (K) Abundant pyrite framboids, well DB, depth = 3817.27 m; (L) Lath-like illite within interparticle pores, well DB, depth = 3817.27 m.
Applsci 14 07661 g011
Figure 12. The correlation between TOC content and pore volume (micropore, mesopore, macropore), surface area (micropore, mesopore, macropore) in the Wufeng–Longmaxi shales.
Applsci 14 07661 g012
Figure 13. The correlation between silicate mineral (quartz + feldspar) content and pore volume (micropore, mesopore, macropore), surface area (micropore, mesopore, macropore) in the Wufeng–Longmaxi shales.
Applsci 14 07661 g013
Figure 14. The correlation between clay content and pore volume (micropore, mesopore, macropore), surface area (micropore, mesopore, macropore) in the Wufeng–Longmaxi shales.
Applsci 14 07661 g014
Figure 15. Diagenetic evolution model of siliceous shale, siliceous–argillaceous mixed shale, and argillaceous shale. (ad) the deposition stage, early diagenesis stage, middle diagenesis stage, and late diagenesis of siliceous shale, respectively. (eh) the deposition stage, early diagenesis stage, middle diagenesis stage, and late diagenesis of siliceous–argillaceous mixed shale, respectively. (il) the deposition stage, early diagenesis stage, middle diagenesis stage, and late diagenesis of argillaceous shale, respectively.
Applsci 14 07661 g015
Table 1. TOC contents of analyzed shale samples from the Wufeng–Longmaxi formations, Dingshan area, southeast Sichuan Basin.
Well
Name
Sample
No.
FormationDepth (m)TOC (wt.%)Well
Name
Sample
No.
FormationDepth (m)TOC (wt.%)
DADA1Longmaxi2204.430.87DBDB1Longmaxi3743.30.74
DADA2Longmaxi2209.110.73DBDB2Longmaxi3744.970.75
DADA3Longmaxi2210.150.87DBDB3Longmaxi3747.951.02
DADA4Longmaxi2211.030.82DBDB4Longmaxi3750.851.22
DADA5Longmaxi2211.960.71DBDB5Longmaxi3753.870.82
DADA6Longmaxi2212.980.7DBDB6Longmaxi3754.040.74
DADA7Longmaxi2214.090.92DBDB7Longmaxi3756.720.85
DADA8Longmaxi2215.120.94DBDB8Longmaxi3759.830.74
DADA9Longmaxi2215.960.71DBDB9Longmaxi3762.811.12
DADA10Longmaxi2217.541.04DBDB10Longmaxi3765.571.26
DADA11Longmaxi2218.671.1DBDB11Longmaxi3765.821.31
DADA12Longmaxi2219.540.97DBDB12Longmaxi3768.271.16
DADA13Longmaxi2220.081.06DBDB13Longmaxi3769.781.03
DADA14Longmaxi2221.491.01DBDB14Longmaxi3771.290.9
DADA15Longmaxi2223.611.21DBDB15Longmaxi3776.111.33
DADA16Longmaxi2224.741.22DBDB16Longmaxi3783.251.11
DADA17Longmaxi2230.021.26DBDB17Longmaxi3783.91.17
DADA18Longmaxi2231.270.92DBDB18Longmaxi3789.462.15
DADA19Longmaxi2237.061.12DBDB19Longmaxi3792.442.16
DADA20Longmaxi2242.842.13DBDB20Longmaxi3799.282.53
DADA21Longmaxi2247.091.93DBDB21Longmaxi3804.762.76
DADA22Longmaxi2257.572.41DBDB22Longmaxi3807.74.09
DADA23Longmaxi2262.22.98DBDB23Longmaxi3809.244.25
DADA24Longmaxi2267.195.52DBDB24Longmaxi3811.65.37
DADA25Longmaxi2267.75.53DBDB25Wufeng3812.44.79
DADA26Wufeng2268.615.53DBDB26Wufeng3815.264.71
DADA27Wufeng2269.745.38DBDB27Wufeng3817.275.03
Table 2. TOC content of the Wufeng–Longmaxi shale samples after combustion.
Well NameDepth (m)TOC (wt.%)
Pre-CombustionPost-Combustion
DA2247.091.930.07
DA2262.22.980.08
DA2267.75.530.08
DA2269.745.380.09
DB3743.30.740.08
DB3754.041.260.07
DB3776.111.330.07
DB3783.91.170.08
DB3799.282.530.08
DB3809.244.250.07
DB3812.44.790.08
DB3817.275.030.08
Table 3. Pore volume, surface area of micropore, mesopore, and macropore for the Wufeng–Longmaxi shales.
LithofaciesWell NameDepth (m)Pore Volume (10−2 cm3/g)Surface Area (m2/g)Pore Volume (10−2 cm3/g)Surface Area (m2/g)
MicroporeMesoporeMacroporeMicroporeMesoporeMacropore
Argillaceous shaleDA2204.431.7123.790.520.940.2517.166.520.11
DA2220.081.7226.070.630.840.2520.335.630.11
DA2237.061.4219.820.460.750.2114.934.80.09
DB3743.31.7725.870.60.930.2419.156.620.1
DB3754.041.8425.070.560.970.3118.536.410.13
DB3776.111.9129.70.70.990.2222.557.060.09
DB3817.272.6550.061.191.260.239.6410.340.08
Siliceous–argillaceous mixed shaleDB3783.91.6322.250.480.910.2415.736.420.1
DA2247.092.5131.910.721.360.4323.198.540.18
Siliceous shaleDA2262.22.4435.330.841.280.3226.838.360.14
DA2267.73.1947.461.11.830.2635.9311.410.12
DA2269.743.348.561.131.940.2336.1212.340.1
DB3799.282.3733.940.761.280.3325.298.510.14
DB3809.242.944.571.051.520.3334.719.720.14
DB3812.43.0945.871.081.770.2434.7910.970.11
Table 4. Pore volume and surface area of micropore, mesopore, and macropore between pre-combustion and after combustion samples. Abbreviation: micro = micropore, meso = mesopore, and macro = macropore.
Sample No.Well NameDepth (m)Pre-CombustionPost-Combustion
Pore Volume (10−2 cm3/g)Surface Area (m2/g)Pore Volume (10−2 cm3/g)Surface Area (m2/g)
Micro.Meso.Macro.Micro.Meso.Macro.Micro.Meso.Macro.Micro.Meso.Macro.
DB1DB3743.30.250.880.237.695.70.090.10.780.323.53.470.13
DB6DB3754.040.310.920.39.675.570.120.090.80.323.263.50.13
DB17DB3783.90.240.860.236.955.50.090.090.840.323.193.870.13
DB15DB3776.110.290.930.218.696.070.080.10.880.423.683.630.17
DA21DA2247.090.361.360.4211.37.480.170.121.210.454.45.110.19
DB20DB3799.280.431.210.3213.267.340.130.121.310.544.575.630.23
DA23DA2262.20.431.220.3113.57.320.130.131.270.594.835.050.24
DB23DB3809.240.571.450.3118.028.470.130.091.310.873.534.840.35
DB25DB3812.40.571.690.2317.869.630.10.090.990.663.143.860.25
DB27DB3817.270.71.170.1922.118.780.070.091.30.743.584.780.33
DA25DA2267.70.641.750.2520.099.960.110.11.110.673.94.360.27
DA27DA2269.740.651.850.2220.3310.820.090.11.280.563.855.390.24
Disclaimer/Publisher’s Note: The statements, opinions and data contained in all publications are solely those of the individual author(s) and contributor(s) and not of MDPI and/or the editor(s). MDPI and/or the editor(s) disclaim responsibility for any injury to people or property resulting from any ideas, methods, instructions or products referred to in the content.

