Article

Optimum System for Diagnosing Power Quality in Electrical Microgrids

by
Gabriel Gómez-Ruiz
*,
Reyes Sánchez-Herrera
,
Aránzazu D. Martin
and
José M. Andújar
Research Centre CITES, University of Huelva, 21007 Huelva, Spain
*
Author to whom correspondence should be addressed.
Appl. Sci. 2024, 14(17), 7666; https://doi.org/10.3390/app14177666
Submission received: 25 July 2024 / Revised: 23 August 2024 / Accepted: 27 August 2024 / Published: 30 August 2024
(This article belongs to the Special Issue Control Systems for Next Generation Electric Applications)

Abstract

:
An electrical measurement network designed for analyzing power quality within microgrids is presented in this paper. It is very portable and easy to install across various types of microgrids. Data collected by the system meet the standards for measuring electrical parameters, calculating waveforms spectra and comparing results from different microgrid nodes. The measurements provided by the network are useful for both utility and consumer sides. The system’s effectiveness is verified through two experimental setups, specifically built ad hoc: one for testing the accuracy of the measurements obtained and the other for assessing the suitability of these measurements for power quality analysis.

1. Introduction

In the last decades, global primary energy consumption has shown an increasing trend. The combustion of fossil fuels is the main source of energy production and is responsible for ¾ of global greenhouse gas emissions. On the path towards net-zero carbon emissions by 2050, the share of renewable energy sources (RESs) in primary energy consumption will be increased [1,2]. This new approach is known as distributed generation (DG), and it has promoted the transition from former grids to smart grids (SGs). However, DG notably affects the grid due to its variability, and numerous challenges such as effective forecasting, energy storage management, demand management systems, voltage control, and power system stability arise [3]. Specifically, the integration of DG, particularly with photovoltaic penetration, complicates voltages control in unbalanced distribution systems [4]. Advances in information and communications technologies (ICTs) allow researchers to overcome some of these challenges. In this sense, there are different electrical measurement devices to monitor the data about energy consumption and power quality (PQ), among other functions [5].
According to a European power quality survey [6], PQ issues cause a financial loss of more than EUR 150 billion per year in the 25 countries of the EU. These losses are due to devastating effects in loads and generation, transmission, and distribution systems, such as damage of sensitive loads, loss of efficiency of the power systems, and overheating of cables and equipment, among others [7]. The electronic devices (e.g., electric car chargers, rectifiers, ballasts, switch-mode power supplies, etc.) are one of the main producers of these PQ disturbances (PQDs). PQDs are classified into magnitude variations (voltage sags and swells), sudden transients (impulsive and oscillatory), and steady-state variations (harmonics, notch, and flicker) [8,9], and their definitions and compatibility levels are contained in the EN 50160:2022 [10] for low, medium, high and, extra-high voltage supply. Among them, harmonic distortion is one of the most common PQDs and has become increasingly important in recent years due to the rise of non-linear and time-varying loads in power systems [11]. The proliferation of RESs facilitated by DG exacerbates the issue of harmonics, as the power converters connecting these RESs to the power system generate harmonics during operation. In addition, the study of harmonics is crucial due to their inevitable propagation through other electrical microgrids and the broader power system. Identifying nodes that introduce harmonics in a microgrid is complex for two main reasons. First, the indices traditionally used to measure distortion only indicate the presence of distortion at different nodes, without revealing which nodes are responsible for injecting the distortion. Second, certain elements within microgrids, such as capacitors, do not inject harmonics but can amplify existing distortions at the point of common connection (PCC). Recognizing these elements as non-distorting is a significant challenge. In addition, identifying nodes that introduce harmonics is crucial because it allows for mitigating harmonics at their source, preventing their propagation throughout the grid.
Therefore, a standard to regulate harmonic distortion measurement is essential. In this sense, the IEC 61000-2-2 [12] establishes total harmonic distortion (THD) as the index for measuring harmonic distortion in both voltage and current, specifying the maximum THD values at any point in the grid. However, this standard is insufficient for understanding the harmonic flow between different nodes in a microgrid. To overcome the above-mentioned drawback, several procedures and algorithms have been published over the last decades to show that flow [11,13,14] and even the identification of imbalanced sources [15,16,17] are needed to measure the instantaneous voltages and currents at all microgrid nodes. Therefore, the monitoring of all the microgrid nodes is crucial.
There are many commercial PQ analyzers that provide the THD index at the PCC, [18,19,20]. However, to determine the harmonic flow, the THD index alone is insufficient; other procedures and algorithms, as mentioned above, are necessary. In addition, to allocate distortion and/or imbalance responsibilities, simultaneous voltage and current measurements at all microgrid nodes are required. In short, the origin of the harmonics, their flow, and the distortion and/or imbalance responsibilities of each node can only be assessed by comparing the measurements obtained simultaneously from the different nodes [21,22].
Based on the above, an electrical measurement network, consisting of two or more electrical measurement devices, and the hardware and software for processing the collected measurements, is needed. Regarding the electrical measurement devices, these can mainly be phasor measurement units (PMUs), advanced metering infrastructures (AMIs), or smart meters. With regards to PMUs and AMIs, these devices are mostly used at the transmission and distribution grids [23,24], but not specifically from a microgrid perspective, and thus, they are not intended for demand-side load monitoring, but for the supply-side. Moreover, their implementation costs are high [25], and consequently, there are many studies that aim their optimal location to minimize the number needed to monitor the power grid [26,27,28]. On the other hand, there are some smart meters in the literature [29,30,31,32,33], but most of them are individual devices that are not part of a network, so the requirements for studying PQDs in a microgrid with multiple nodes are not guaranteed.
In the technical literature on electrical measurement networks, [34] introduces a system utilizing self-developed smart meters with advanced communication capabilities, but it lacks synchronous measurements across multiple points. In [35], the authors develop a system for high-frequency, synchronous electromagnetic interference (EMI) measurements across multiple locations; however, it falls short of providing synchronous measurements across multiple points in a microgrid and relies on expensive commercial oscilloscopes to measure voltages and currents. Furthermore, [36] presents a measurement system designed for accurate and synchronized PQ monitoring in a real distribution grid. However, the system has several limitations, including a lack of focus on microgrids, an absence of node-specific harmonic identification, and limited scalability and portability. Finally, while electrical measurement networks designed for industrial sites, as discussed in [37,38], are effective, they do not delve deeply into PQ issues or the detection and classification of both stationary and non-stationary PQDs.
After analyzing the state of the art, it was concluded that no existing network integrates self-developed measurement devices (SDMDs) with a communication network that connects all devices and provides synchronous measurements, enabling the application of necessary procedures and algorithms for a comprehensive PQ analysis within a microgrid system. This analysis focuses on both stationary disturbances, such as harmonic source detection, and non-stationary disturbances, including voltage fluctuations, interharmonics, and fundamental frequency variations. Consequently, this gap motivated the work presented in this article.
This paper presents DiagElect, a complete electrical measurement network designed to overcome the limitations identified in the technical literature. DiagElect incorporates a robust communication network that maintains continuous connectivity among all SDMDs, facilitating synchronous measurements across multiple points in noisy environments. This network facilitates the acquisition and processing of measurements essential for PQ analysis. Designed for versatility, DiagElect supports a wide range of applications from energy monitoring to the detection and classification of both stationary and non-stationary PQDs. Its adaptable and scalable architecture is ideal for various microgrid configurations. Being built on low-cost, open-hardware platforms, it remains affordable and accessible.
Table 1 offers a comparative overview of the key features identified in the discussed literature, including the detection and classification of PQ disturbances, the capability for synchronous measurements across multiple points, the use of low-cost devices, and the scalability and portability of the systems. This table underscores the strengths and weaknesses of each system, clearly illustrating how DiagElect successfully achieves all these critical features.
Based on everything discussed in this section, this paper is novel for the following reasons:
  • Prior to DiagElect, there was no electrical measurement network suitable for collecting, processing, and analyzing data for comprehensive PQ analysis in microgrids, including the detection and classification of both stationary and non-stationary PQDs.
  • DiagElect is capable of accurately and instantaneously measuring voltage and current at all microgrid nodes and supports various PQ analyses, such as the identification of distortion sources.
  • To the author’s knowledge, there is no electrical measurement network specifically focused on the detection of harmonic sources that is based on free software, open hardware, and uses low-cost devices.
The rest of this paper is organized as follows: Section 2 explains the measurement requirements, methodologies, and experimental setups used in developing DiagElect. Section 3 delves into the architecture, characteristics, and operational capabilities of DiagElect. Section 4 presents the results from assessing the accuracy of the SDMD and the effectiveness of DiagElect as an electrical measurement network for identifying distortion sources within an experimental microgrid, using a use case. The paper concludes with Section 5 exploring the implications of the findings, and Section 6 summarizing the study’s contributions to PQ analysis in microgrids and outlining future research directions.

2. Materials and Methods

The materials and methods used in this study include the measurement requirements for development, as well as the assessment methodologies and experimental setups needed to validate the performance of the electrical measurement network, DiagElect. Since the core innovation is DiagElect, including the SDMDs and the communication network, their details are further elaborated in Section 3.

2.1. Measurement Requirements

DiagElect is designed for various PQ analyses, ranging from energy monitoring to the detection and classification of both stationary and non-stationary PQDs. To ensure DiagElect is suitable for these analyses, voltage and current measurements taken by the SDMD must comply with several standards [10,39,40]. These standards require sampling voltage and current at rates of 128, 256, or 512 samples per cycle across 10 cycles, using high-speed analog-to-digital converters (ADCs) with a minimum sample rate of 12.8 kSPS and a signal-to-noise ratio (SNR) exceeding 86 dB. In addition, simultaneous measurements from different nodes are essential to accurately assess and compare pseudo-stationary disturbances such as distortion and imbalance, which may fluctuate over time. Moreover, measurements at each node must be synchronized to facilitate precise calculations of power components. This synchronization is achieved using a network time protocol (NTP) server [41], ensuring that data collection is coordinated across multiple points.

2.2. Methodology for Harmonic Flow Assessment

After voltage and current measurements are properly collected, these data can be utilized for PQ analysis. Depending on the application, specific procedures and algorithms are implemented to achieve the desired objectives. In this study, the data are employed to identify distortion sources in an experimental microgrid, serving as the selected use case to demonstrate the effectiveness of the DiagElect system. To this end, a procedure that incorporates the fast Fourier transform (FFT) algorithm and the Harmonic Global Index (HGI) is used. The procedure for this study is described in detail below.
Each SDMD within the microgrid captures data spanning 10 cycles. For precise analysis, it is essential to compare these cycles and identify one that is unaffected by any transient disturbances. The data from the selected cycle are then used to compute the spectrum for each phase of voltage and current. The FFT is employed for this analysis, as it effectively decomposes the time-domain signal into its frequency components. Using FFT, the amplitudes and phases of each frequency component are extracted to determine the RMS values of harmonic voltage V h and current I h for each harmonic order h . The resulting spectrum enables the calculation of voltage and current THD using (1) and (2):
V T H D = h = 2 50 ( V h / V 1 ) 2
I T H D = h = 2 50 ( I h / I 1 ) 2
where V h and I h are the norms of the RMS values of the hth harmonic voltage and current, respectively, and V 1 and I 1 are the norms of the RMS value of fundamental voltage and current, respectively.
The total and fundamental components of active and reactive power are derived from (3) to (6):
P T = h = 1 50 V h × I h × cos φ V h φ I h
P 1 = V 1 × I 1 × cos ( φ V 1 φ I 1 )
Q T = h = 1 50 V h × I h × sen φ V h φ I h
Q 1 = V 1 × I 1 × sen ( φ V 1 φ I 1 )
where P T and P 1 are the total and fundamental components of active power, Q T and Q 1 are the total and fundamental components of reactive power, and φ represents the phase angle of the hth harmonic voltage and current.
To identify the nodes that inject harmonics into the microgrid, the HGI [42] is utilized, which is a widely adopted index over the past decades [13,43]. The calculation procedure, detailed in [42], involves classifying each harmonic current based on the sign of its corresponding active power. Specifically, if the active power of the hth harmonic is negative, the hth harmonic current I h flows from the load to the source, forming part of the load current component I l . Conversely, if the power is positive, the hth harmonic current I h flows from the source to the load, forming part of the source component I s . As in (7):
I l h = I h   i f   P h < 0 ;   otherwise   I l h = 0   I s h = I h   i f   P h > 0 ;   otherwise   I s h = 0
where I l h is the hth harmonic of the load current component and I s h is the hth harmonic of the source current component.
The HGI value is then calculated using (8):
H G I = h = 2 50 I l h 2 / h = 2 50 I s h 2
A node is considered a distortion source if the HGI value is significantly above zero. Conversely, if the HGI value is close to zero, the node does not significantly inject harmonics into the microgrid.

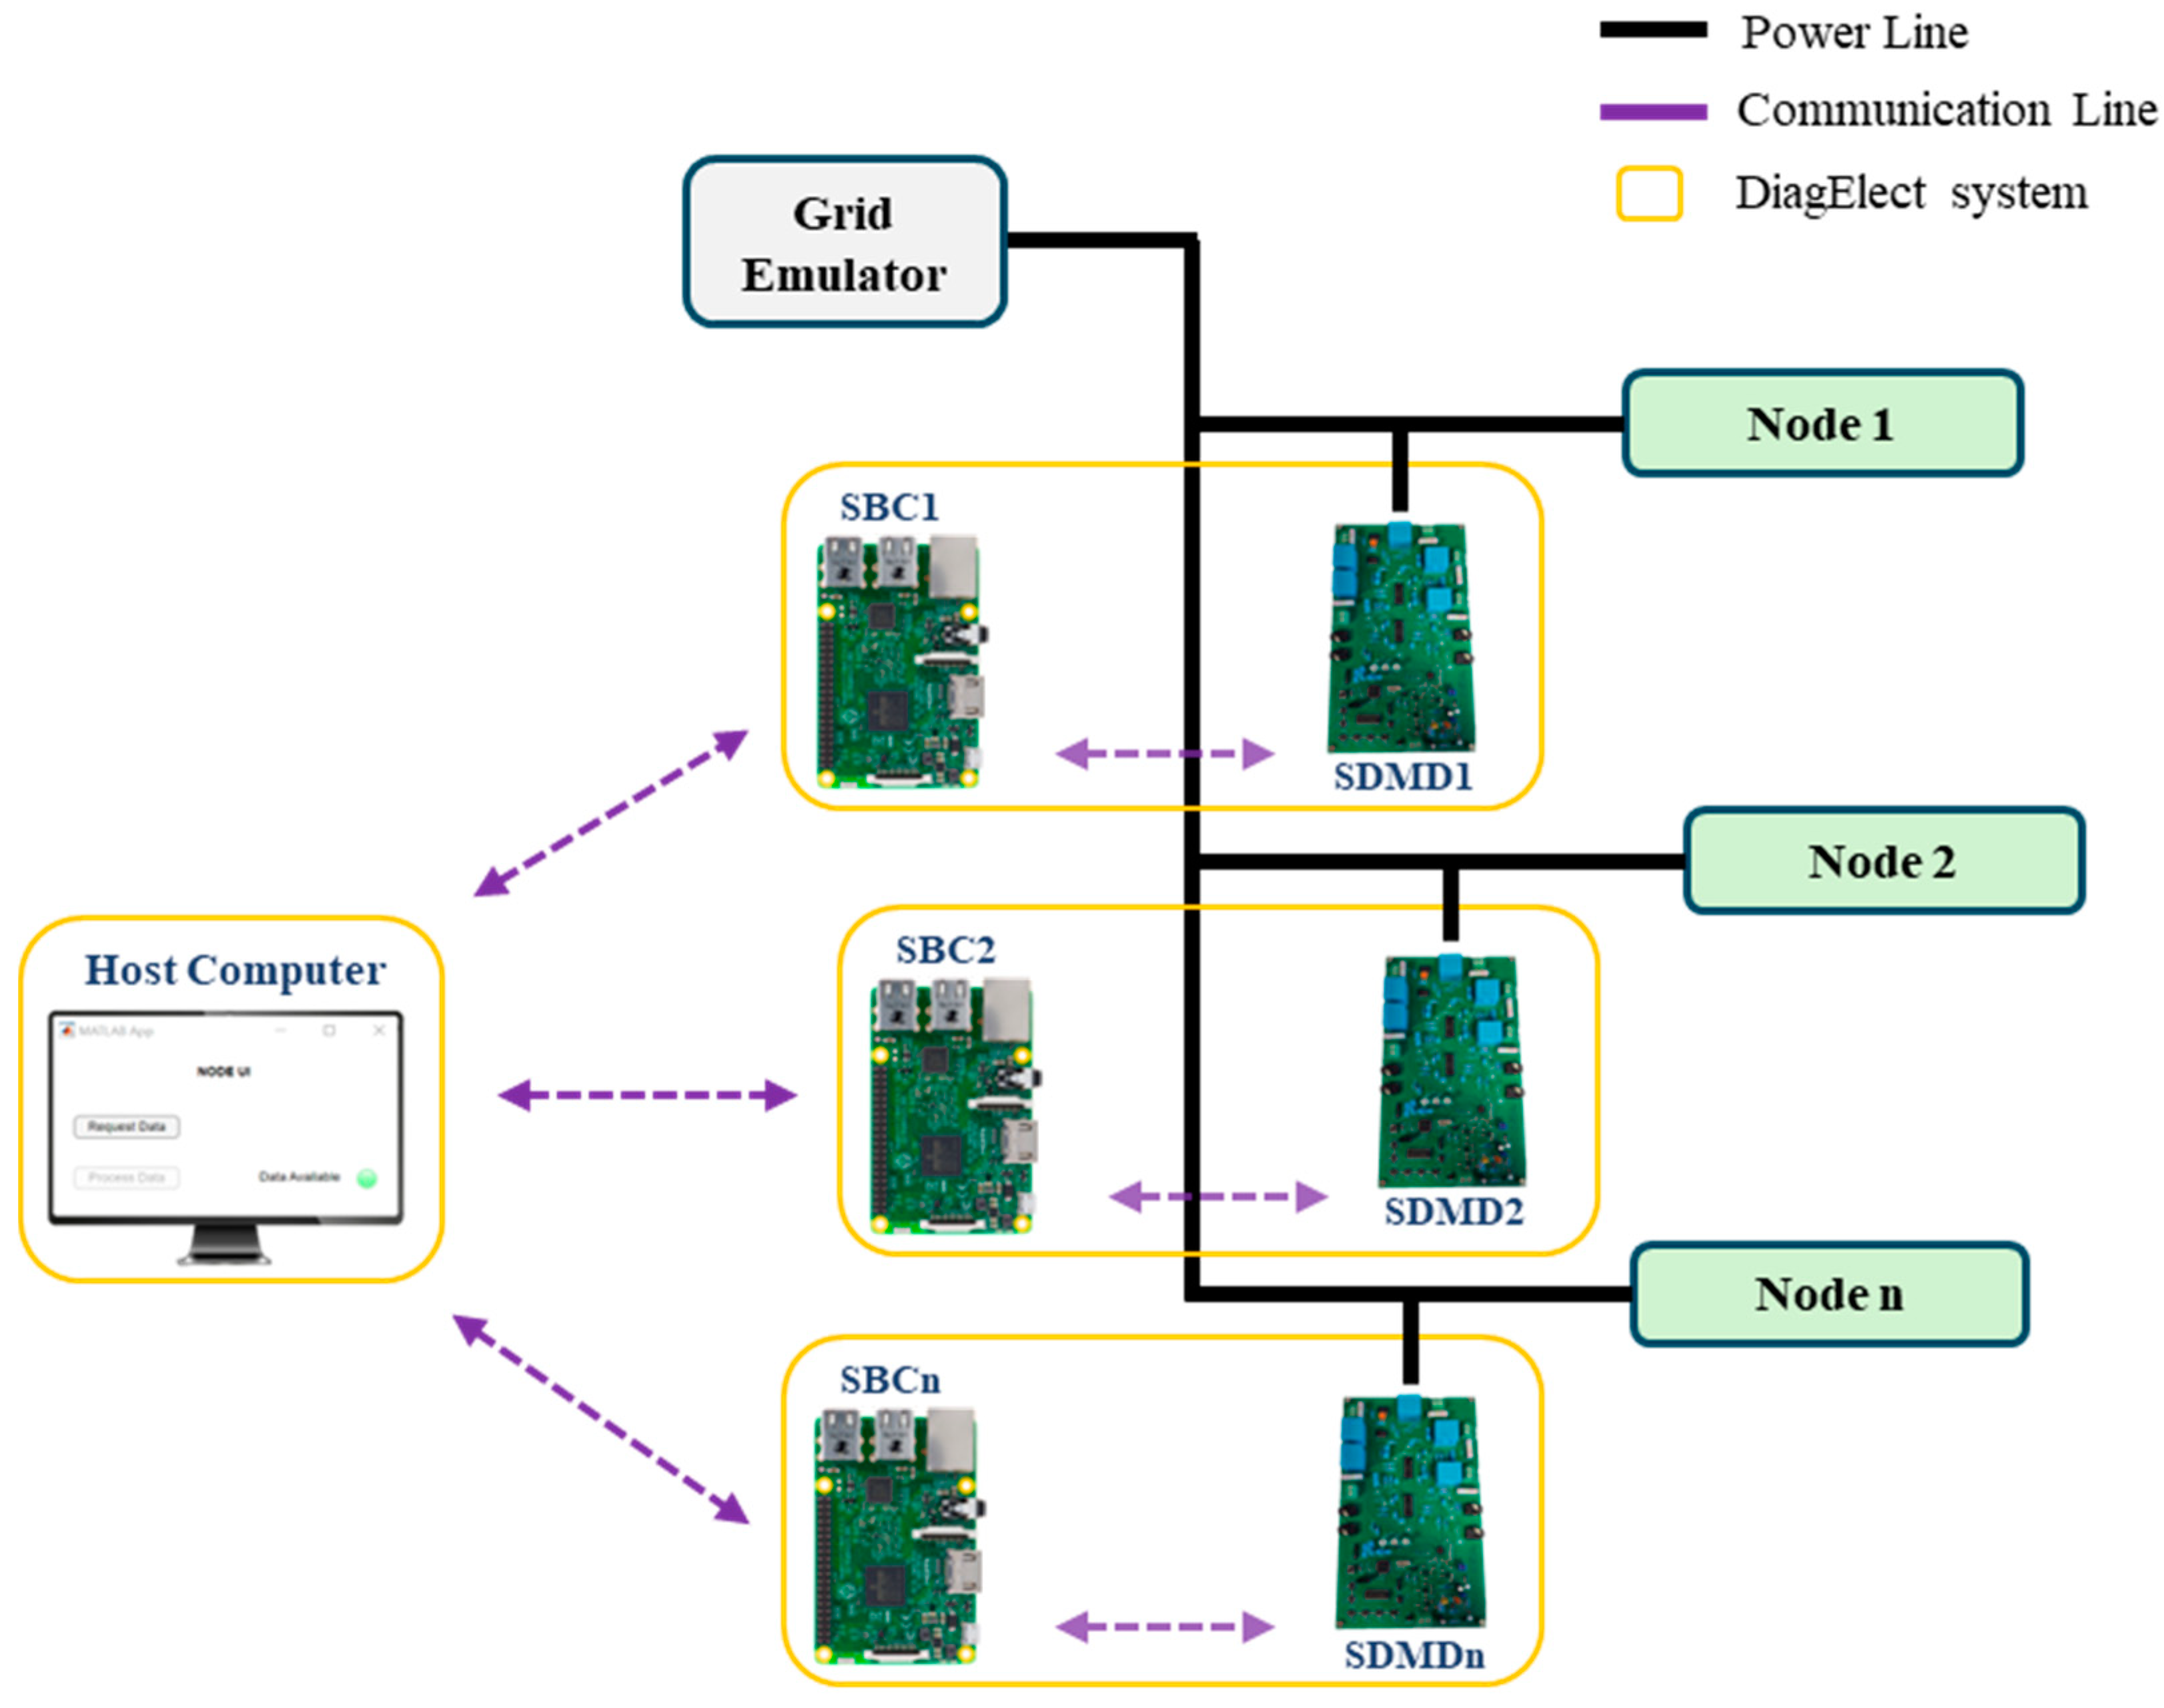
2.3. Experimental Setups for Evaluating DiagElect

To confirm that DiagElect is a suitable electrical measurement network for the PQ analyses mentioned, two experimental setups are necessary.
Firstly, a test bench is constructed to validate the voltage and current measurements from the SDMD, ensuring they meet the standards for accuracy. The test bench includes an NHR® 9410 Regenerative Grid Simulator (referred to here as the grid emulator), which is manufactured by NH Research, located in Irvine, CA, USA. It supplies well-calibrated sinusoidal voltages and currents to a purely resistive load. The grid emulator supplies voltages in stepped RMS amplitudes, increasing by 10 V increments from 90 V to 400 V, at a frequency of 50 Hz, to provide various measurement points for testing the SDMD. For each voltage level set by the grid emulator, the SDMD measures voltage and current. These measurements are then compared with those from a commercial measurement device, specifically a Circutor® (Circutor, Terrassa, Spain) [19]. Both measurement devices are evaluated based on reference values provided by the grid emulator, with their deviations from these values expressed as percentages.
Secondly, to identify nodes that inject harmonics―as proposed in this study―an experimental microgrid has been constructed. This experimental microgrid comprises the following elements:
  • A grid emulator that supplies a rated phase voltage of 230 V RMS at 50 Hz.
  • Four microgrid nodes representing linear, nonlinear, balanced, and unbalanced three-phase loads.
Details about the loads at each microgrid node are provided in Table 2, which shows the load type and the expected contribution to distortion or its absence. Each load represents a microgrid node, and the four loads are connected to the grid emulator.
For a comprehensive understanding of the setup and interconnections within the experimental microgrid, a schematic diagram of the proposed experimental microgrid is provided in Figure 1.
In addition, a host computer is essential for implementing DiagElect’s analysis procedures and algorithms. In the use case, this host computer is equipped with an Intel® Core i7 processor (Intel, Santa Clara, CA, USA), 1.10 GHz and 16 GB RAM, and runs MATLAB® R2024a software. Although MATLAB® was used for processing the voltage and current measurements because it is commonly used in our institution, other free software alternatives can also be utilized.
Figure 2 shows the experimental microgrid constructed in the laboratory, highlighting the system’s ease of installation, which requires minimal tools and technical expertise. In addition, DiagElect’s plug-and-play components significantly reduce setup time, ensuring rapid deployment and operation.

3. Developed Electrical Measurement Network

In this section, the proposed electrical measurement network, DiagElect, is introduced. DiagElect consists of two main components: the measurement device developed by the authors, SDMD, and the communication network, also created by the authors, which includes hardware and software elements for connecting all SDMDs, requesting and collecting measurements, and processing the collected data. Therefore, the description of DiagElect is divided into two distinct parts. The first part describes the SDMD, detailing its architecture and characteristics, and also presents the prototype. The second part focuses on the communication network, covering both hardware and software elements, as well as the employed communication protocols and synchronization mechanisms, which are crucial for reducing electromagnetic interference.

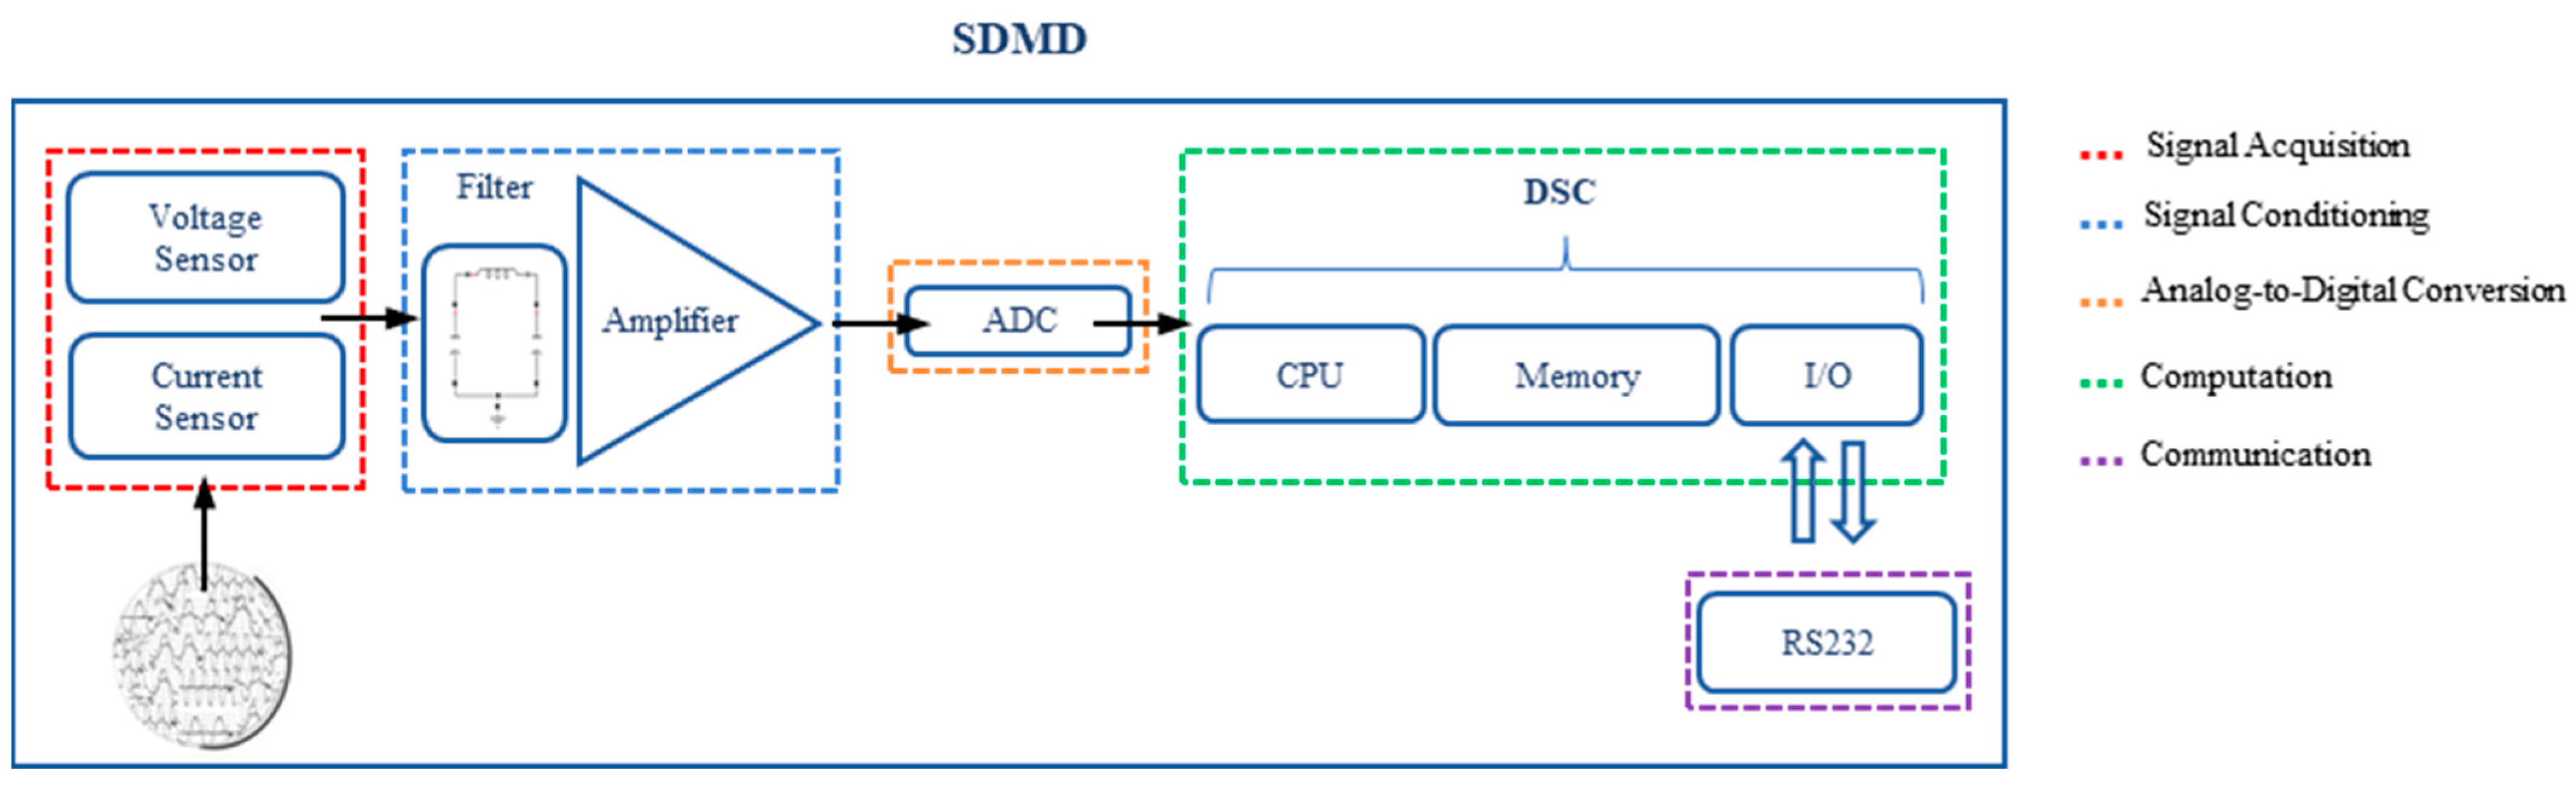
3.1. SDMD Prototype: Architecture and Characteristics

The architecture of the SDMD is depicted in Figure 3. The process of converting an analog signal into a digital value and enabling data communication with other peripherals involves several steps [44]. First, it is necessary to acquire the voltage and current signals. Next, these signals must be conditioned before being converted to digital form for further computation. Finally, the communication module establishes the data flow.
All elements of the SDMD adhere to the measurement requirements described in Section 2.1, including the voltage and current measurement, synchronization, and simultaneous measurement requirements. Moreover, the design addresses the susceptibility to electromagnetic interference commonly encountered in industrial environments.
Voltage and current sensors that provide high performance and ranges suitable for expected input signals are necessary. In the proposed SDMD, the voltage sensor ZMPT101B (Robotdyn, Shenzhen, China) and current sensor SCT-013 (YHDC, Shenzhen, China) are used. The ZMPT101B is a small size current transformer with a bandwidth of 1 MHz, and it provides stable measurements, notable electric isolation, and lower losses with respect to other voltage measurers [45]. On the other hand, the SCT-013 is a non-invasive current sensor based on the Hall effect. This makes it easy to connect to loads, as there is no need to open circuits. The most important features of the SCT-013 are its high linearity and fast response. In addition, it is very robust to external noise. Moreover, both sensors are low-cost and widely used for harmonic source detection [45,46,47,48], making them ideal for measurements in industrial applications due to their robust resistance to external noise. Analog signals from voltage and current sensors need to be conditioned before analog-to-digital conversion. For this, an analog front end (AFE) based on a filter composed of inductance and capacitor, and an operational amplifier is used. The digital signal controller (DSC) involved in the smart meter has an on-chip ADC which is used for all general-purpose applications. However, due to the requirements of voltage and current measurements, an external ADC is required: a 16-bit ADC ADAS3023 (Analog Devices, Norwood, MA, USA). Moreover, it is necessary to support the sampling of eight input channels simultaneously and the ADAS3023 needs 8 µs to the conversion in all the channels. Thus, it has a resolution of 156 µV with ±5.12 V of input range, which is more than the DSC on-chip ADC and it results in reduced quantitation error [49].
Boards based on microcontrollers (µCs) [29], digital signal processors (DSPs) [30], and FPGA hardware [50] are common approaches for electrical metering. In the case of the SDMD, the discrete signal from external ADC is processed by a dsPIC30F5011 (Microchip Technology, Chandler, AZ, USA) low-cost DSC. This DSC combines the significant features of both µC and DSP.
An SRAM memory in the DSC was used to temporarily save the collected voltage and current measurements. These measurements remain in the SRAM memory while the SDMD is powered and until the next voltage and current acquisition. This capability is essential because the data are collected in the SDMD and need to be stored there until the SDMD transmits them to the host computer for further processing.
The DSC features a central processing unit (CPU) with a novel Harvard architecture and includes input/output peripherals for general-purpose applications. Specifically, it provides a 25 MHz CPU and 12-bit ADC with a 200 kSPS conversion rate and 16 input channels. The DSC is also responsible for calculating the zero-crossing points.
The source code developed for voltage and current acquisition can be implemented on the hardware platforms mentioned above, such as µC, DSP, DSC, or FPGAs, many of which are open-hardware platforms. However, their capabilities must adhere to the requirements established by standards for voltage and current measurements, as detailed in Section 2.1. As mentioned earlier, in this work, a DSC was used to implement the source code, which was developed in the MPLAB® Integrated Development Environment (IDE) v6.20 using the C programming language. The source code was transferred to the DSC on the SDMD using the MPLAB® In-Circuit Debugger (ICD) 4. The selection of the DSC as a hardware component for implementing the source code was due to the free access to its IDE and the widespread use at the institution. Communication with other peripherals is enabled through the RS232 interface. In addition, a real-time clock (RTC) was used to keep track of the current time and date, which is necessary for the proper processing of collected data.
Therefore, from the SDMD perspective, three tasks need to be enabled:
  • Receiving the measurement configuration and data requests;
  • Performing and temporarily saving the measurements;
  • Transmitting the voltage and current measurements for further processing.
Before performing measurements, the SDMD receives information about the load connection (single-phase or three-phase) and measurement parameters, such as the numbers of cycles and points per cycle to measure. Data requests can be punctual or set for automated and continuous collection over time. The SDMD transmits and receives data in hexadecimal, which is unsuitable for further calculations. Therefore, the collected data need to be converted to decimals.
Figure 4 presents the prototype of the SDMD, which is highlighted by its portability, featuring compact and lightweight components. The sensors are designed to clip onto existing infrastructure, requiring minimal setup. The SDMD includes eight terminals for measuring four voltages and four currents, allowing it to monitor phase voltage, phase current, and the neutral line in a three-phase system. Voltage measurements are facilitated by screw terminals, while current measurements use jack connectors. The non-invasive current sensor is not integrated into the smart meter, allowing for installation without the need to open the circuit. In addition, a terminal for zero-crossing detection is provided. The wide range of voltage and current measurement capabilities makes the SDMD versatile in scenarios with diverse loads. Another key feature is the easy access to programming and communications pins, which simplifies these tasks. The SDMD prototype was designed using EAGLE® v.9.6.2 software and subsequently manufactured.
In summary, the selection of devices and their parameters for the SDMD prototype was guided by several key criteria: compatibility with established standards, the need for high measurement accuracy, and robustness in diverse industrial environments. Each parameter, such as voltage range, current range, and resolution, was chosen based on a comprehensive review of industry norms and the specific requirements of microgrid applications. The design of the SDMD is thoroughly justified and supported by both the technical literature [22,29] and established standards for PQ analysis, notably the IEC 62053-21 standard [39], which confirms the appropriateness of the ZMPT101B voltage sensor and the SCT-013 current sensor. These selections are further validated by their proven effectiveness in PQ monitoring and their ability to minimize quantization errors with the ADAS3023 external ADC’s high resolution and fast conversion rates, ensuring precise measurement of electrical parameters, especially in systems with multiple nodes requiring simultaneous data acquisition. In addition, the use of low-cost, open-source hardware platforms such as the DSC enhances scalability, cost-effectiveness, and integration into various microgrid configurations. The RS232 communication protocol was selected for its robustness in handling noise, making it particularly suitable for electrically noisy environments, such as industrial settings. Table 3 provides a detailed list of the technical specifications for the proposed SDMD.

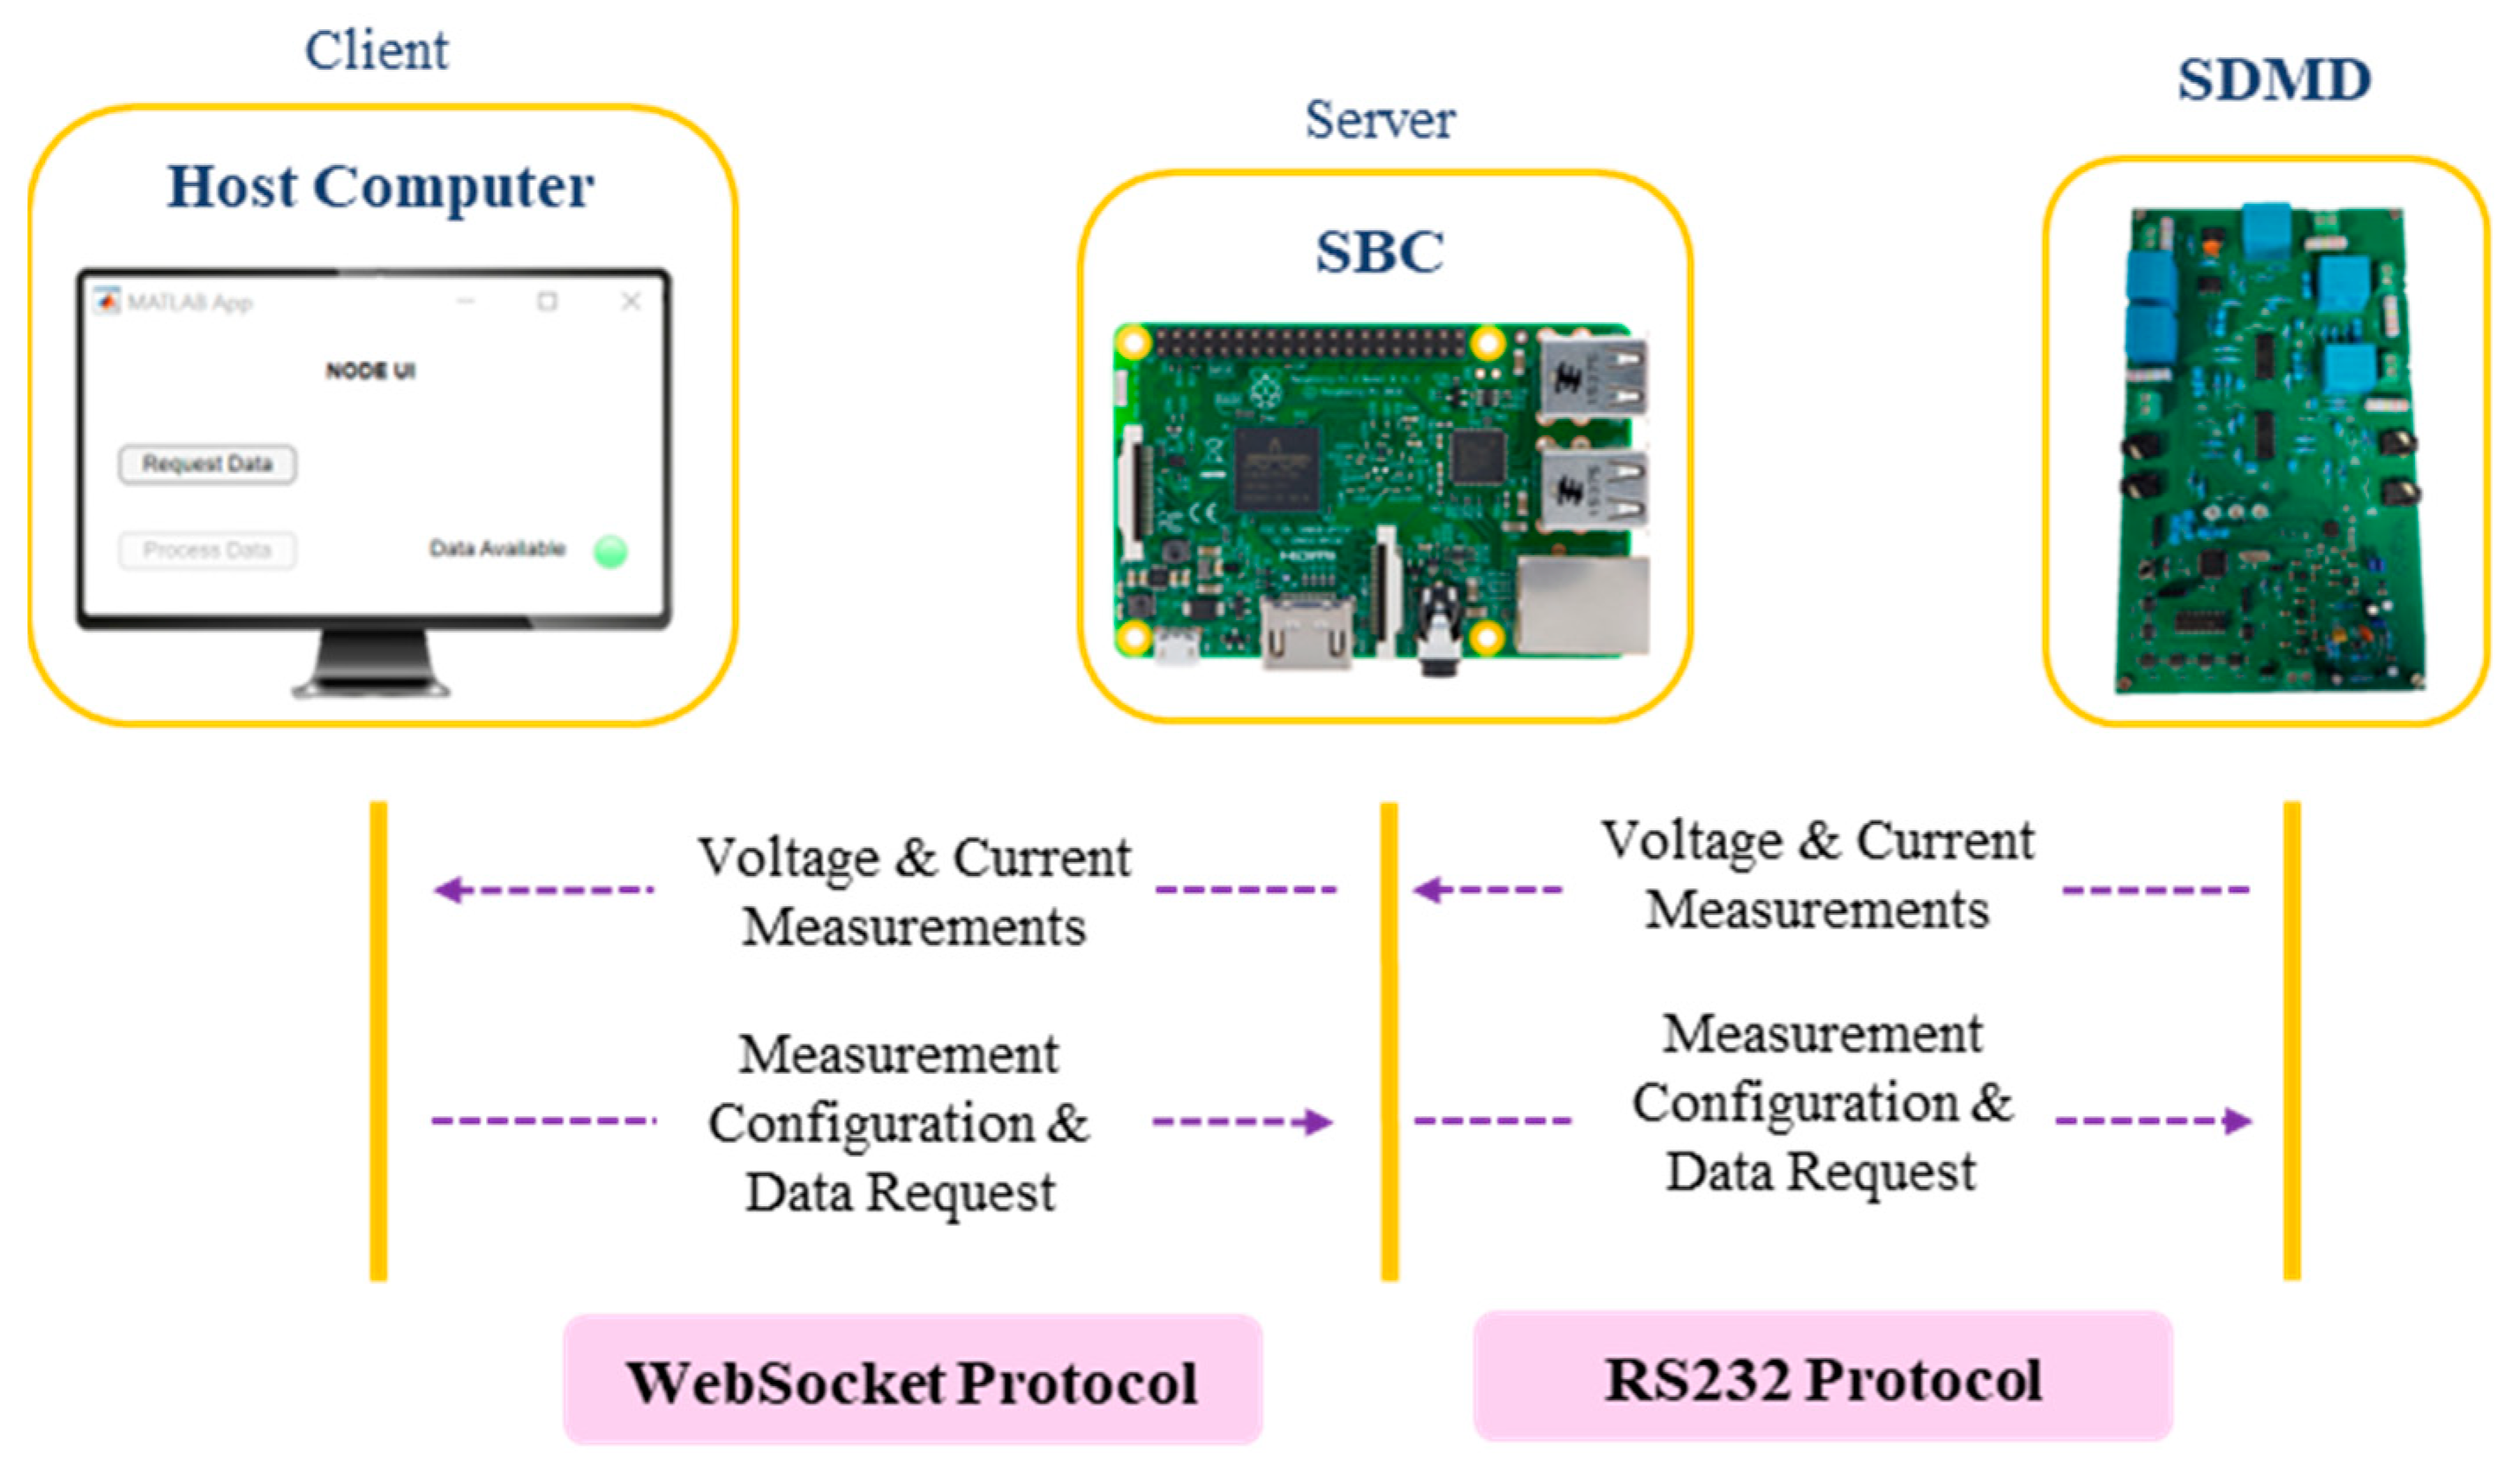
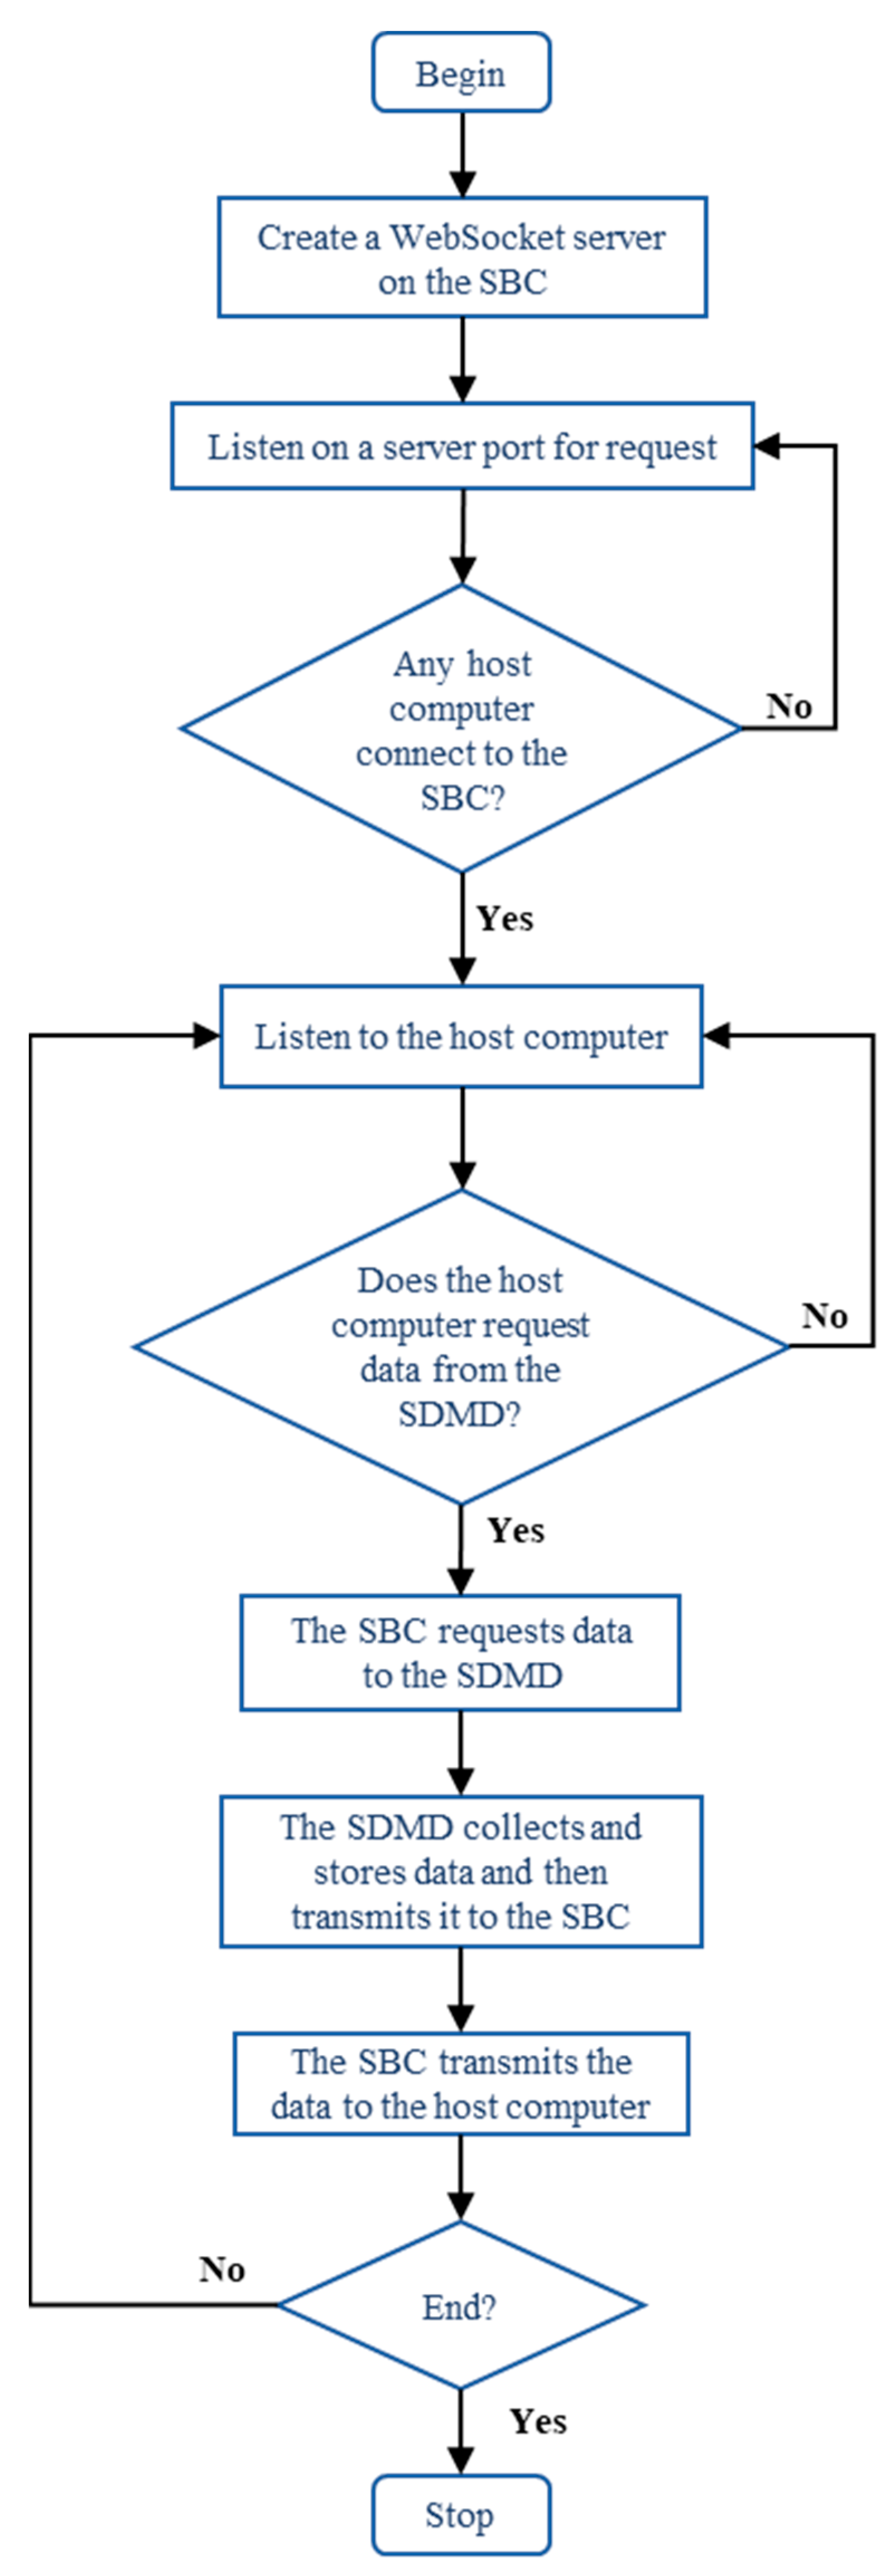
3.2. Description of the Developed Communication Network

This subsection details the hardware and software elements that form the communication network. It describes each hardware component used in the development of the network and explains how the communication between these elements is established. In addition, a flowchart outlines the steps from the initial data collection request to the receipt of data on the host computer. Finally, the configuration for multi-node measurements and the mechanism employed to achieve synchronized measurements are presented.
The SDMD is programmed to transmit and receive data to and from a single board computer (SBC). It acts as a bridge between the SDMD and the host computer, which is responsible for initiating requests and processing data collected from a microgrid node.
As SBC, a Raspberry Pi® 4 Model B (Raspberry Pi Foundation, Cambridge, UK) is used. The communication between the SBC and the SDMD is via the RS232 interface. The RS232 is a standard protocol used for serial communication. The serial interface operates in half-duplex mode. In addition, the baud rate is 57,600 bps, and the data are transmitted in a frame of 10 bits (1 start bit, 8 data bits, and 1 stop bit) in hexadecimals. Therefore, it is necessary to convert the data from hexadecimals to decimals for further processing. To achieve this, a computer or another SBC, referred to as the host computer, can be used. The host computer used in the use case is described in Section 2.3. Communication between the SBC and the host computer is wireless. Both are connected to the Internet using an RJ45 cable and share the same local area network (LAN). Using a LAN has several benefits, including data security, reduced interference and noise affecting data transmission, easy and fast communication, and the ability to connect devices to the same network without requiring a physical connection among them.
The WebSocket protocol is adopted for establishing real-time bidirectional communication between the server (SBC) and the client (host computer). This protocol is mainly used in web browsers and IoT applications. Once the connection is established, both can transmit messages to each other at any time, even simultaneously. The connection between server and client continues until one of them stops it. In contrast to other protocols like HTTP, the WebSocket protocol does not need to transmit messages via request or response packets. In short, the protocol adopted is one of the most convenient for SBCs due to its easy implementation, lower network bandwidth usage, and high performance in terms of transmitted bytes and required time. The robust, portable, and extensible communication network, which integrates the SDMD, the SBC, and the host computer, is represented in Figure 5.
After describing the hardware elements and the communication protocols used among them, the steps from the initial data collection request to the receipt of data on the host computer are outlined.
The communication process for requesting and collecting data from a microgrid node is illustrated in Figure 6. This process involves a single SDMD, a single SBC, and a host computer, but the number of SDMDs and SBCs can be increased depending on the microgrid nodes, following the same procedure.
The process begins with setting up a WebSocket server on the SBC, defined by an IP address and a port number, and implemented in Python 3.12.1 [51]. Once the server is created, it waits for a connection request from any client. In this case, the WebSocket client is implemented in a customized application on the host computer. After the client opens the WebSocket connection, it sends the measurement configuration to the server, which is then transmitted to the SDMD using serial communication. The SDMD acquires the voltage and current measurements from a microgrid node and saves the data in its SRAM memory, awaiting the reading process from the SBC. Once the SBC reads the data, it transmits the data to the host computer. The algorithm repeats this process until an affirmative end condition is met.
The prototype shown in Figure 4, the communication network illustrated in Figure 5, and the communication process outlined in Figure 6 together constitute the electrical measurement network, DiagElect.
DiagElect enables the analysis of PQ in scenarios with a variety of loads, such as a microgrid with multiple nodes. This capability arises from DiagElect being more than just a single measurement device with a communication network; it is an electrical measurement network composed of many SDMDs, each corresponding to a different microgrid node. This approach facilitates synchronized measurements across multiple microgrid nodes, ensuring that voltage and current measurements request are processed simultaneously and accurately.
Figure 7 showcases a comprehensive schematic diagram of the proposed DiagElect system within a microgrid environment. It features a host computer, an SDMD, and an SBC at each microgrid node. Each node represents a generic load, and the system can be scaled to include more nodes as needed.
Both the SDMD and SBC, along with other components, are installed into the mounting plate shown in Figure 8. The system is modular and can be packed into a portable case, facilitating transport and quick deployment in diverse microgrid environments. In addition, it is scalable to accommodate an increase in the number of microgrid nodes.
As a requirement, the voltage and current measurement requests to all SDMDs must be simultaneous. To achieve this, each SBC and the host computer must be synchronized, and the host computer should be capable of processing multiple tasks simultaneously, specifically the requests for voltage and current measurements from all microgrid nodes. For this purpose, an NTP server was installed on each SBC, allowing synchronization between each SBC and the host computer, and parallel computing was implemented on the host computer.
In a scenario with multiple loads, as described in Section 2.3, the procedure outlined in Figure 6 is applied. Once the voltage and current measurements are transferred to the host computer, where the WebSocket client has been implemented, they are processed. Another application that was developed converts the data from hexadecimals to decimals and then organizes the voltage and current measurements for each node. At this point, the data are in suitable conditions for the ongoing PQ analysis.

4. Results

As described in Section 2.3, two experimental setups were conducted to evaluate the suitability of DiagElect. The first setup involves assessing the SDMD as an accurate voltage and current measurement device. The second setup focuses on evaluating DiagElect as an electrical measurement network that can be applied to various PQ analyses, including identifying microgrid nodes that inject harmonics, as proposed in this study.

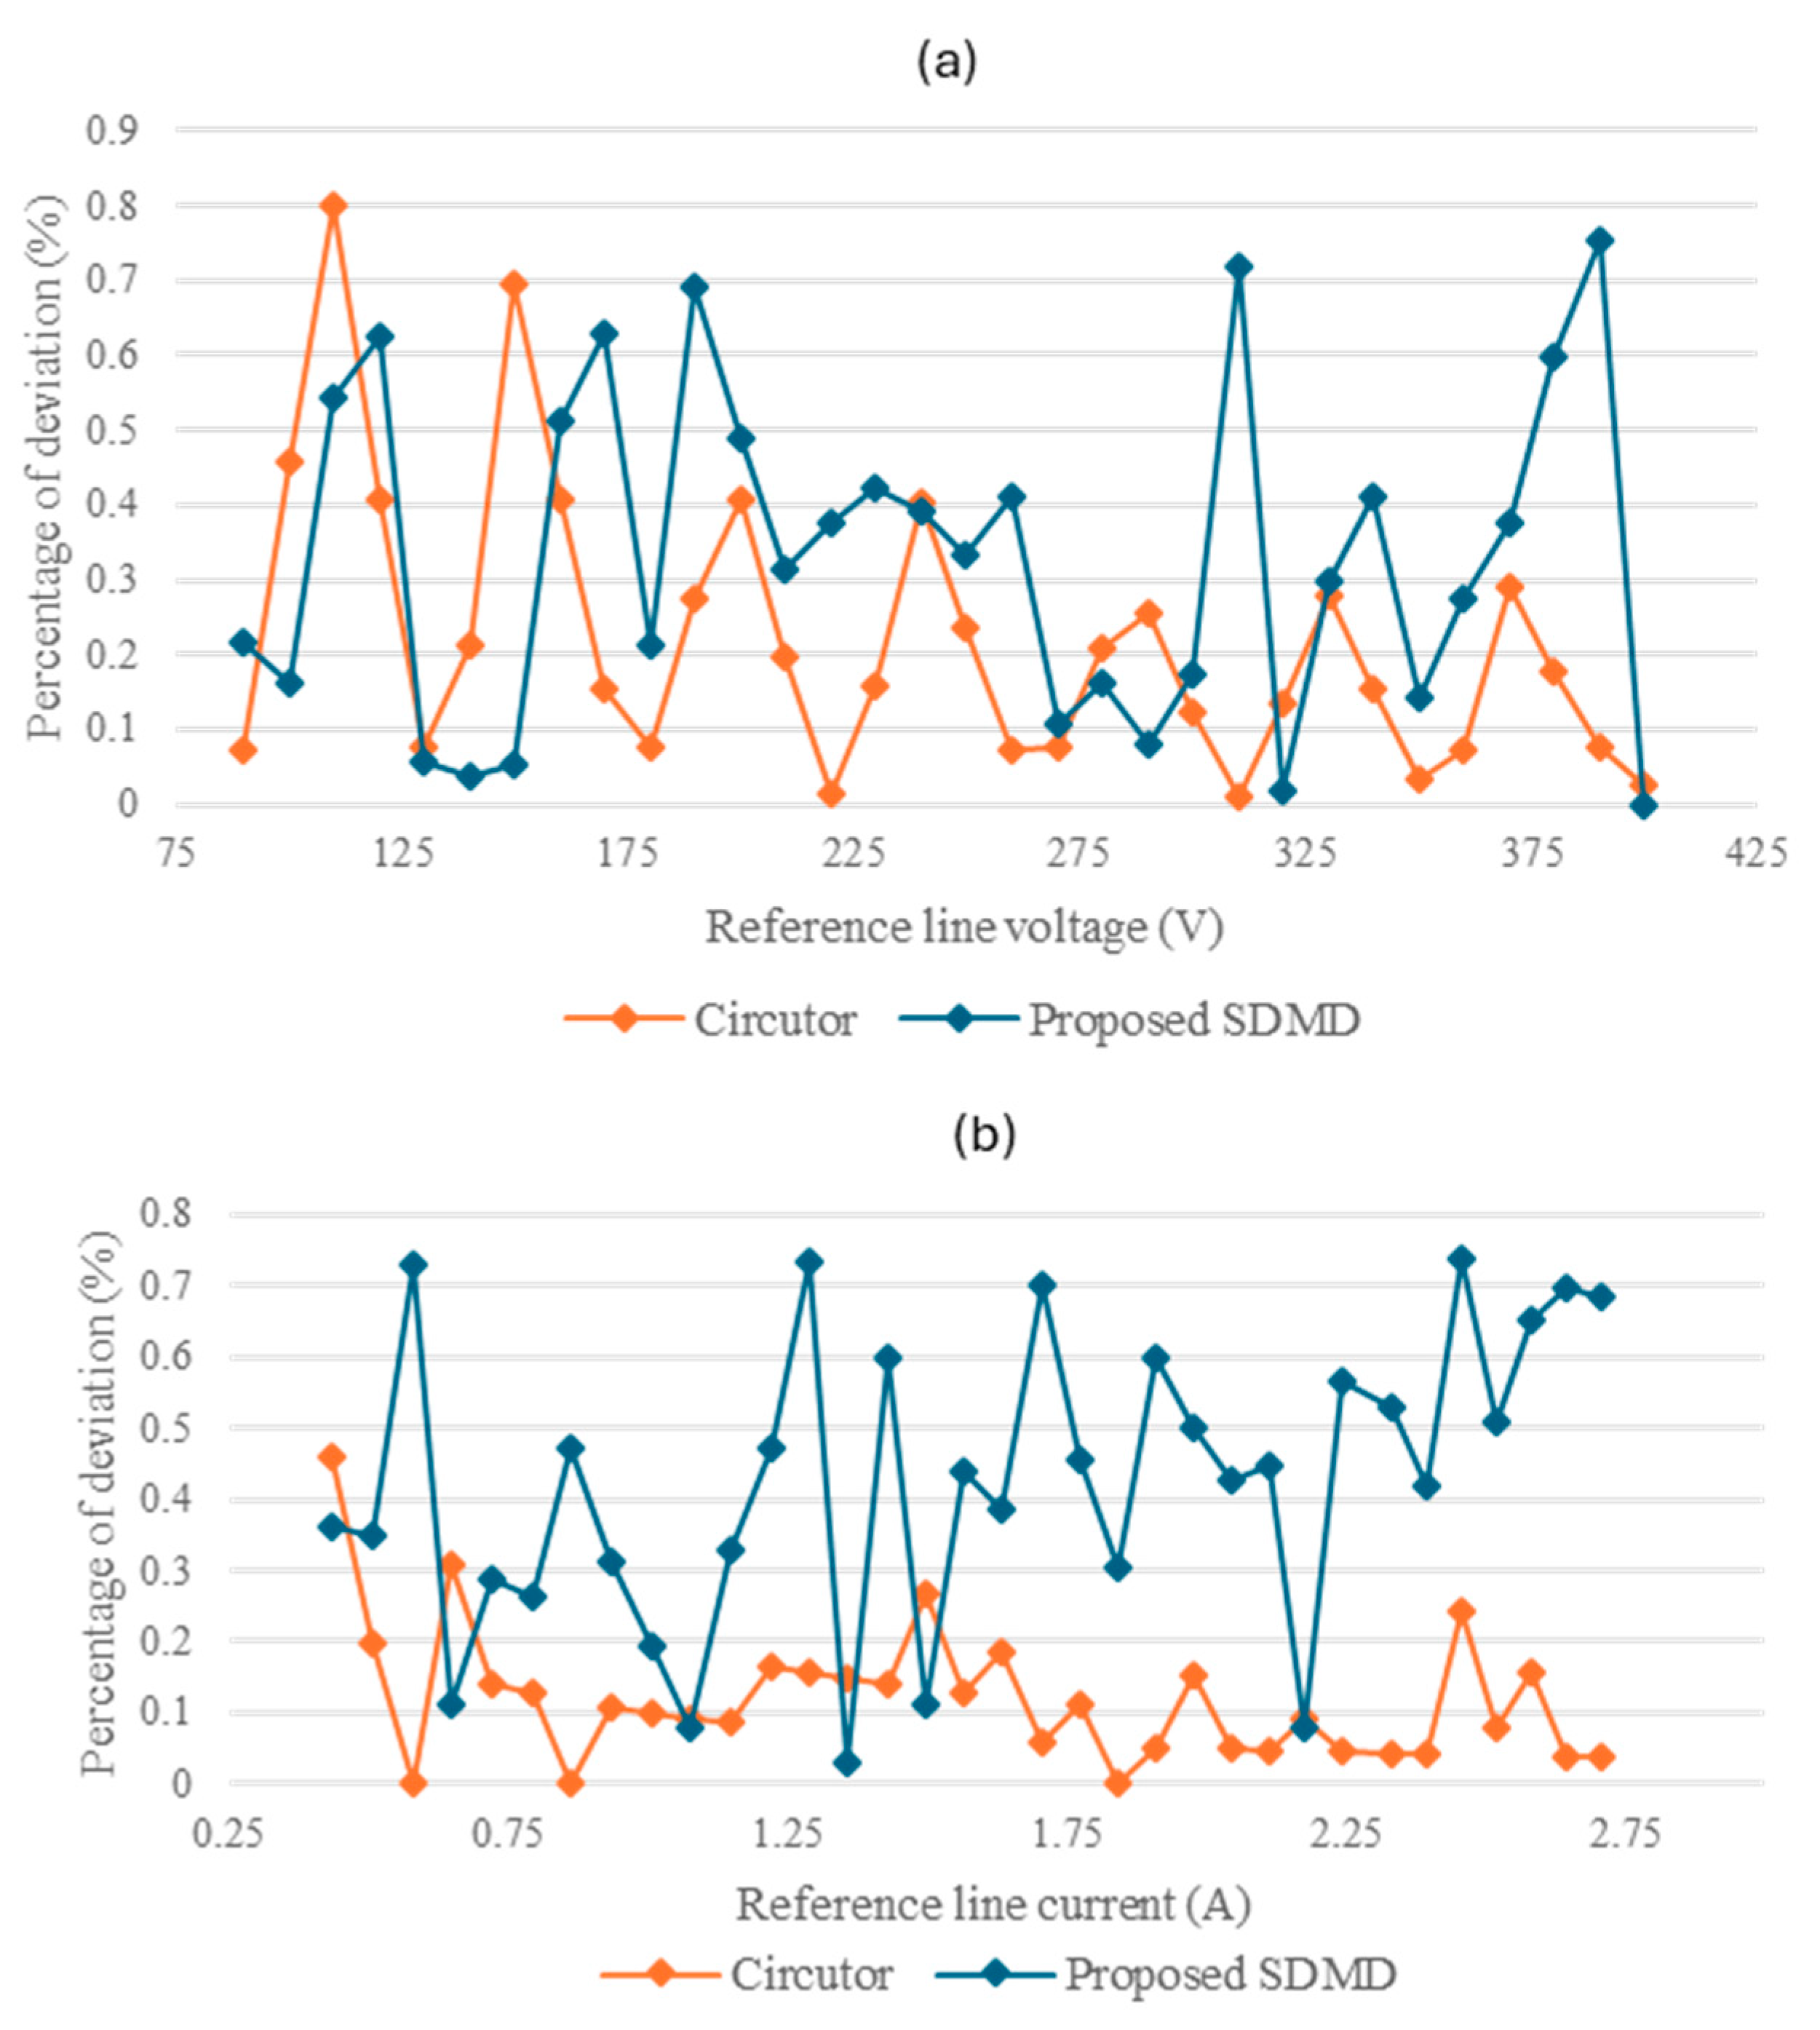
4.1. Performance of the SDMD

The experimental setup involving the SDMD consisted of a test bench with a grid simulator, which provided well-calibrated sinusoidal voltages and currents to a purely resistive load across a range of stepped RMS amplitudes. The measurements from the SDMD were compared with those from a Circutor® measurement device. Both measurement devices were evaluated against reference values established by the grid emulator, with their deviations from these values expressed as percentages for both voltage and current.
Figure 9 provides the comparative performance of the proposed SDMD and Circutor® in measuring voltage and current, against a set of reference values from the grid emulator.
In Figure 9a, which addresses voltage measurements, the SDMD exhibits performance comparable to the Circutor® for a reference line voltage from 90 V to 210 V. Beyond 210 V and up to the highest reference line voltage considered, the SDMD shows slightly higher deviations.
In contrast, Figure 9b, which focuses on current measurements, indicates higher deviations for the SDMD across the entire range when compared to the Circutor®.
The SDMD shows a maximum deviation of 0.7527% in voltage measurements and 0.7364% in current measurements. These deviations correspond to absolute offsets of 1.6950 V and 0.0181 A, respectively.

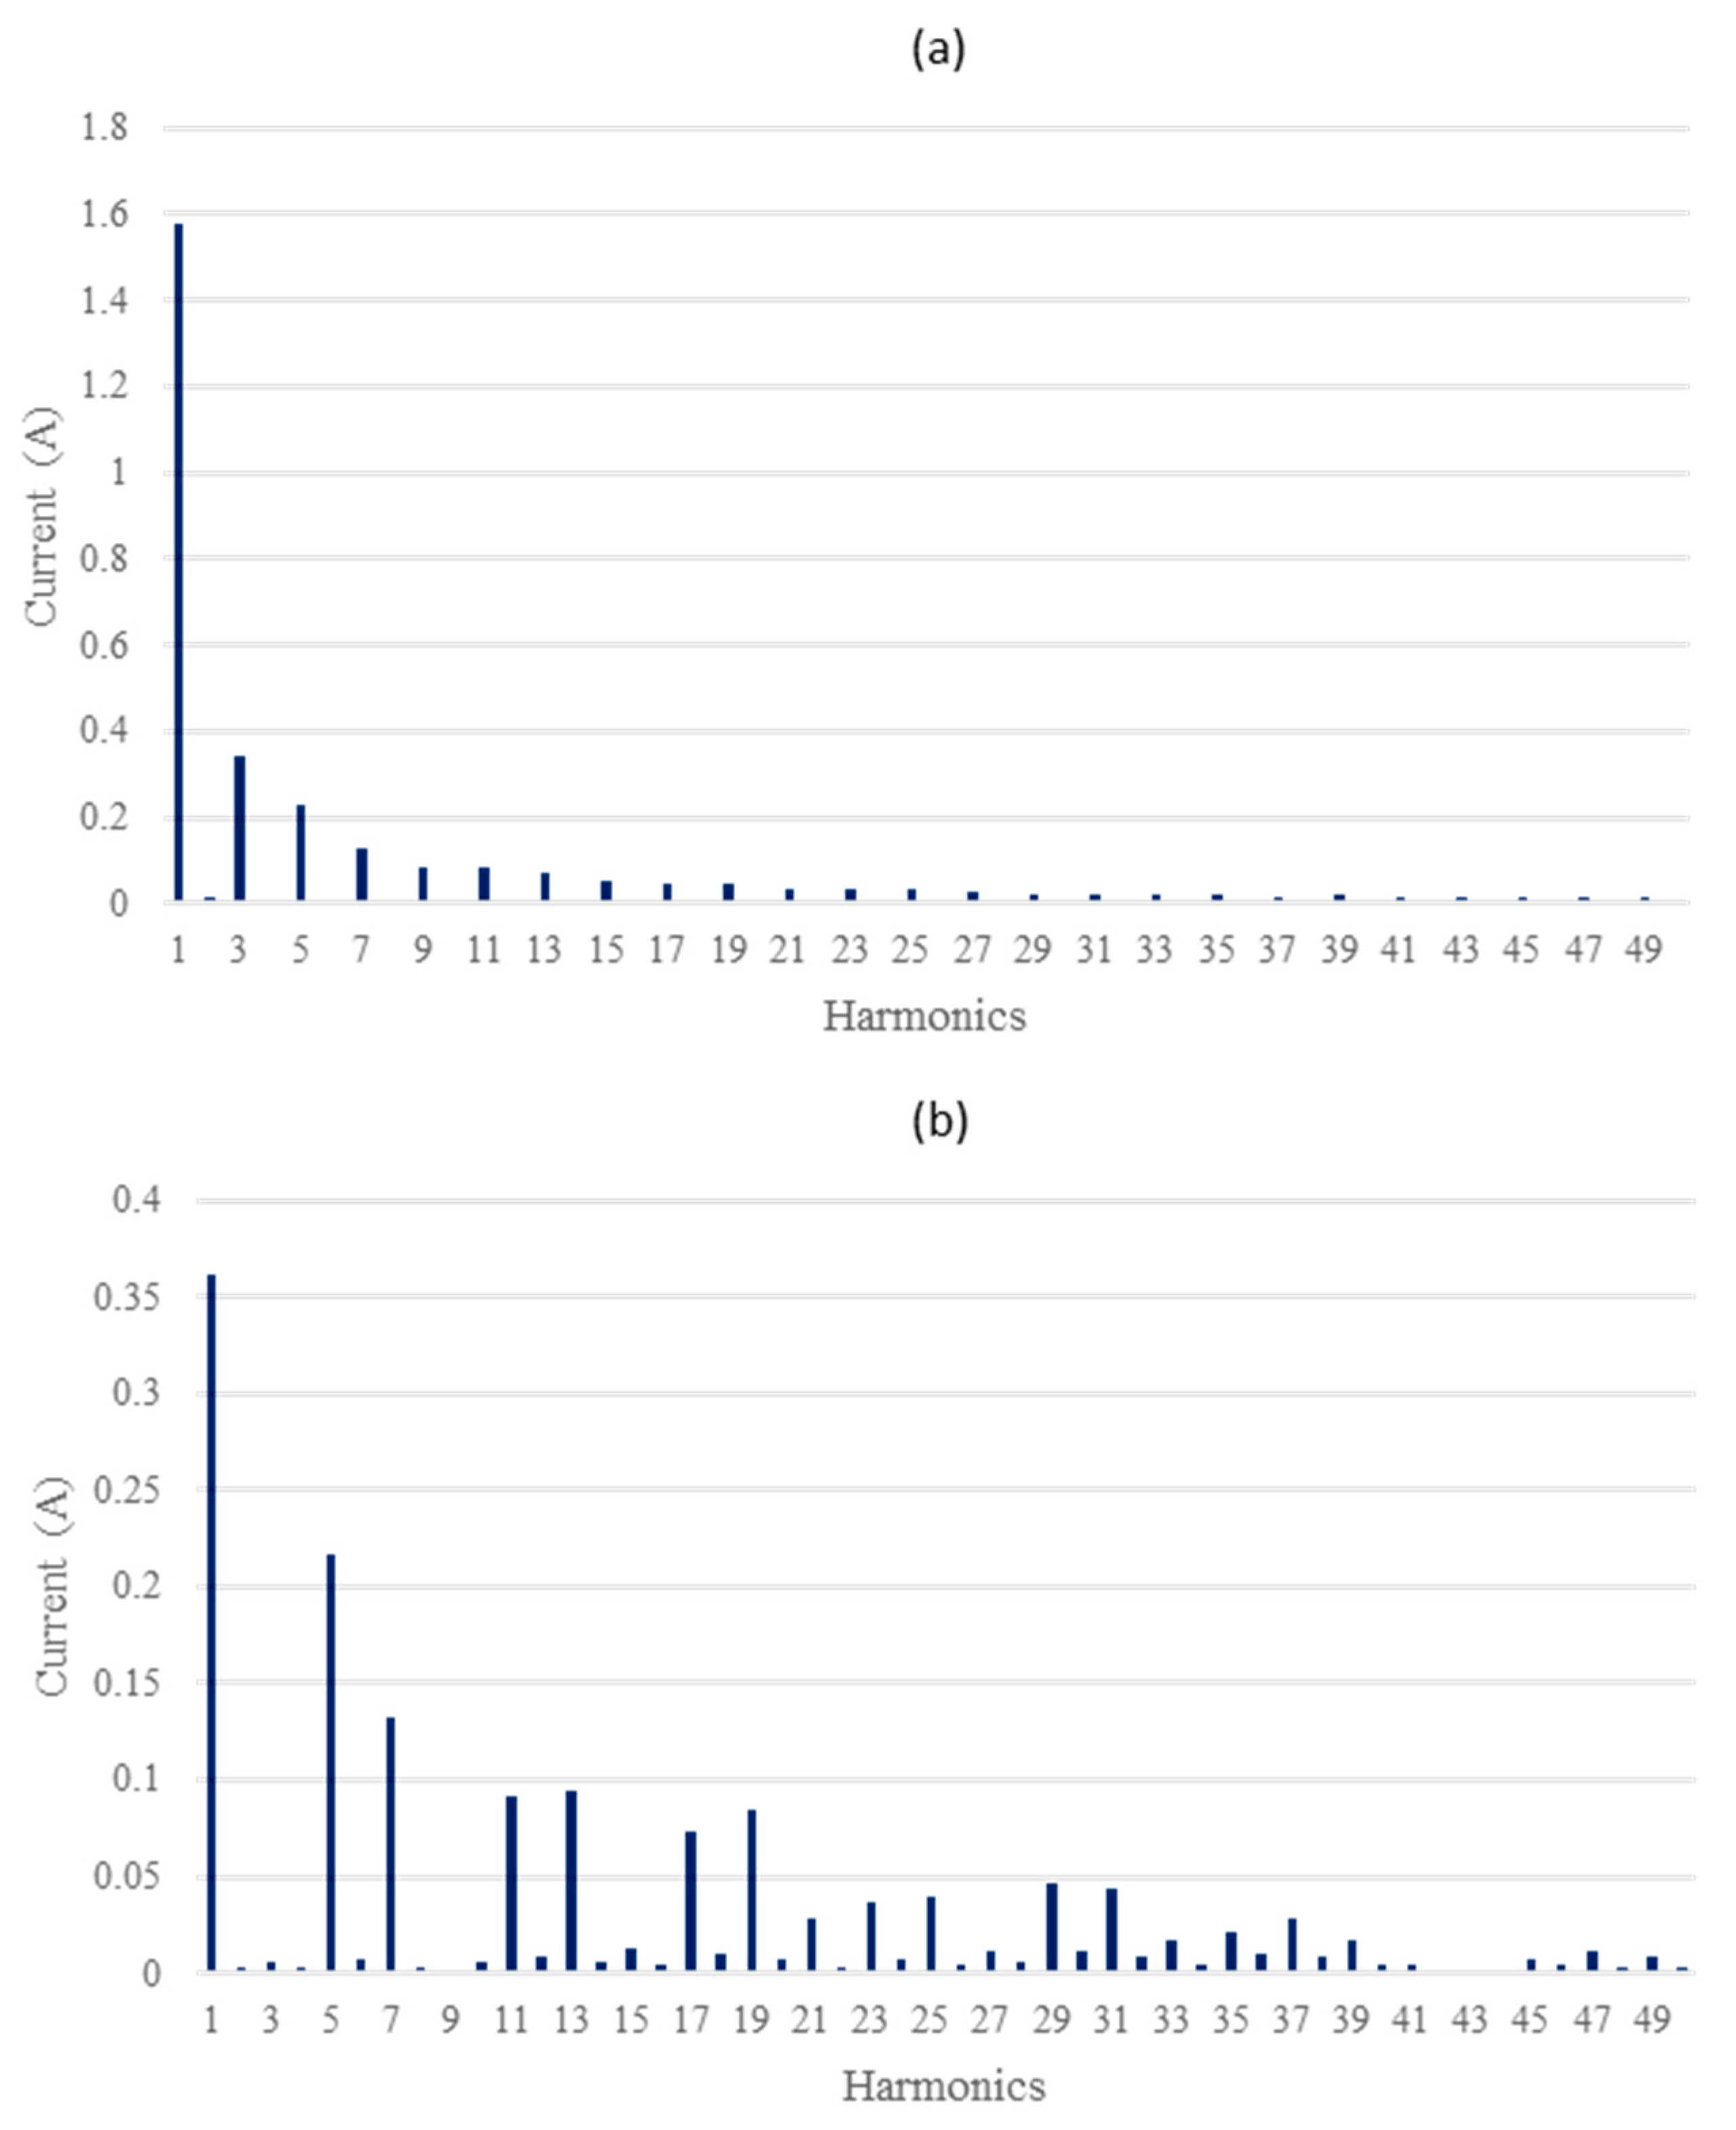
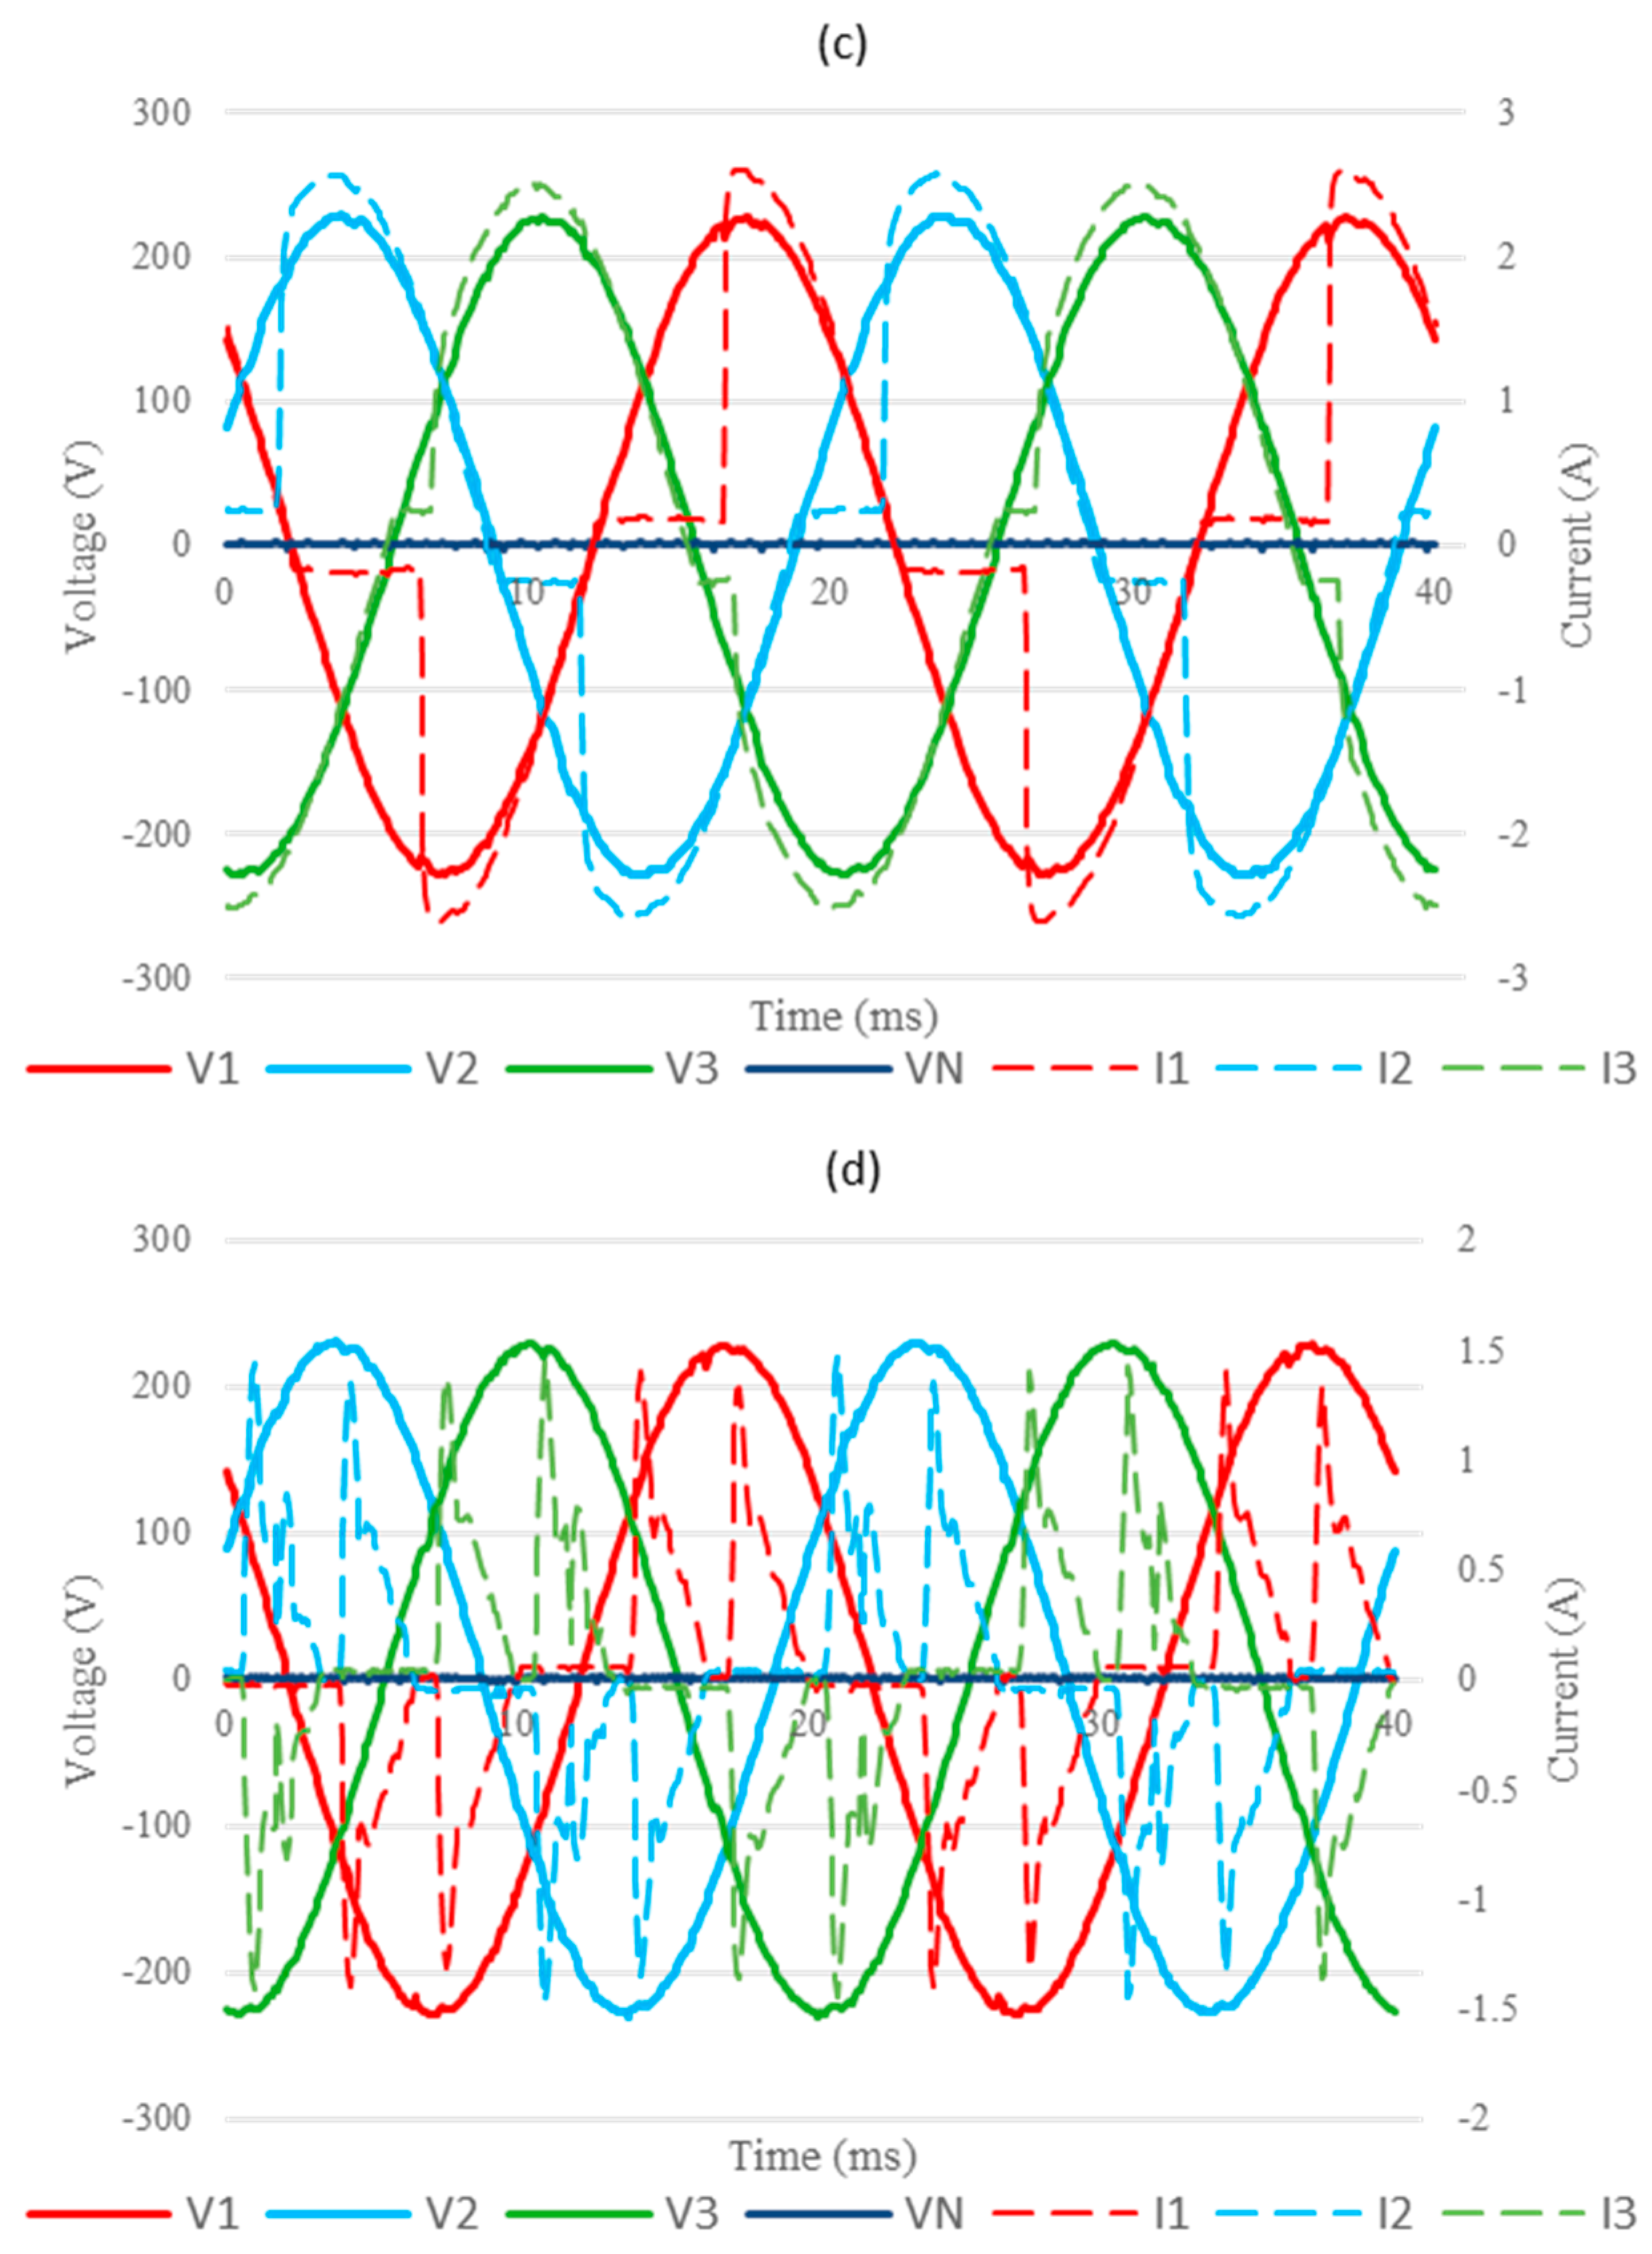
4.2. Performance of DiagElect

To evaluate the performance of DiagElect as an electrical measurement network, specifically for identifying harmonic-injecting nodes, the experimental microgrid described in Section 2.3 was used. Notably, one SDMD was installed at each node of the microgrid to collect voltage and current measurements.
Voltage and current measurements for each microgrid node were collected simultaneously and then received by the host computer, which processed the data according to the methodology outlined in Section 2.2. The computed parameters for harmonic source identification within the experimental microgrid, including the voltage and current THD, the total and fundamental active and reactive power components, and the HGI value, are presented in Table 4.
The voltage and current THD for each microgrid node were computed using (1) and (2), respectively. The total and fundamental active and reactive power components were calculated using (3)–(6), and the HGI value was determined using (8).
It is worth noting that the voltage THD is the same across all microgrid nodes because all the loads are connected to the same point: the PCC.
The current THD values for nodes 1 and 2 are lower compared to those for nodes 3 and 4. The current THD values of nodes 1 and 2 are close to zero because these currents primarily consist of the fundamental component. In contrast, the higher current THD values for nodes 3 and 4 indicate that they are harmonic source nodes. Figure 10 shows the current spectra for nodes 3 and 4.
Waveforms measurements for both voltage and current at each microgrid node are illustrated in Figure 11. Specifically, Figure 11a shows an unbalanced star-connected linear load consisting of three resistances (81 Ω, 124 Ω, and 250 Ω) connected to node 1. Figure 11b illustrates a balanced star-connected linear load consisting of three inductive impedances (47 Ω in series with 0.66 H) connected to node 2. Figure 11c displays three single-phase regulators connected in star with the same inductive load on the DC side (94 Ω and 0.962 mH) connected to node 3. Figure 11d shows node 4, which is made up of a three-phase rectifier with a capacitive impedance (842 Ω and 10 µF) connected on the DC side.

5. Discussion

5.1. Performance of the SDMD

The results depicted in Figure 9 demonstrate slight performance variations between the proposed SDMD and Circutor® in terms of voltage and current measurement deviations. However, these deviations are within the permissible limits set by international standards IEC 62053-21 [39] and IEC 62052-11 [52] for Class 1 accuracy meters. Specifically, the SDMD’s maximum deviation of 0.7527% in voltage and 0.7364% in current, corresponding to absolute offsets of 1.6950 V and 0.0181 A, respectively, comfortably meets these standards.
This adherence to Class 1 accuracy standards indicates that the SDMD, despite exhibiting slightly higher deviations compared to Circutor®, particularly in current measurements, still maintains a high level of accuracy crucial for reliable voltage and current measurements. Further improvements to reduce these deviations could enhance the SDMD’s value as a measurement device.
In summary, the experimental setup evaluated the SDMD through two methods, both providing acceptable results as discussed above: by comparing its measurements against those from a well-calibrated grid emulator and by contrasting them with those from a commercial measurement device, Circutor®. This confirms the suitability of the SDMD as part of the DiagElect system.

5.2. Performance of DiagElect

The results presented in Table 4 confirm the reliability of DiagElect as an electrical measurement network for PQ analysis. Nodes 1 and 2, previously identified as non-distorting, and nodes 3 and 4, identified as distorting, as shown in Table 2, were confirmed by the results in Table 4. This identification was reinforced by the current spectra for nodes 3 and 4 depicted in Figure 10.
Focusing on the computed parameters detailed in Table 4 for each microgrid node, the HGI value for node 1 is nearly zero, indicating that node 1 is a linear load, as expected. Figure 11a shows the waveforms obtained for node 1, where different amplitudes of phase currents due to the load imbalance can be observed.
Similarly, for node 2, the HGI value is near zero, confirming it is a linear load. Figure 11b illustrates the current lagging the voltage, characteristic of the inductive nature of the load.
In contrast, node 3 exhibits an HGI value not near zero, confirming it as a harmonic source. The waveforms corresponding to this node are shown in Figure 11c, where non-sinusoidal current waveforms are evident.
Likewise, node 4 shows a high HGI value, far from zero, confirming it as another harmonic source. The voltage and current waveforms for node 4 are presented in Figure 11d, also displaying non-sinusoidal current waveforms.
DiagElect effectively measures voltage and current simultaneously from each node in a microgrid, regardless of the load type connected. Its adaptable and scalable design enhances this capability, allowing it to be employed across various microgrid configurations.
The system meets the requirements for spectrum calculation established in current standards. In the proposed experimental microgrid, four loads are connected to the same point, the PCC, as shown in Figure 1, with one SDMD placed between the PCC and each load. DiagElect can also be used to evaluate more complex microgrids with multiple PCCs by placing an SDMD at each PCC, thereby providing a more comprehensive and valuable PQ analysis.
DiagElect is also suitable for industrial environments, benefiting from robust voltage and current sensors and a communication network that supports synchronous measurements across multiple nodes.
Moreover, DiagElect can perform the necessary calculations for PQ analysis, including the identification of distortion sources, which is one of the most challenging aspects of PQ assessment. The results shown in Table 4 demonstrate DiagElect’s capability for conducting PQ analysis within a microgrid.

6. Conclusions

The increasing importance of PQ necessitates analysis of microgrids from both the supplier’s and the consumer’s perspectives. Therefore, an electrical measurement network accessible to both is essential. It should also be scalable according to the current microgrid nodes, easily installable, and meet the standards for measuring electrical parameters.
To overcome the indicated challenges, this paper presents an electrical measurement network (DiagElect) based on low-cost, open-hardware devices to guarantee its accessibility. The network simultaneously measures voltage and current at each node of a microgrid according to the established standards. These data are suitable for calculating the waveforms spectra and for comparing results from the different nodes of the microgrid, thereby facilitating any PQ analysis, including the detection and classification of both stationary and non-stationary PQDs, and the identification of nodes that inject harmonics.
DiagElect, completely designed and built by the authors of this paper, consists of multiple measurement devices (SDMDs) connected to each microgrid node, along with a communication network that includes hardware and software elements for connecting all SDMDs, requesting and collecting measurements, and processing the collected data. The structure of DiagElect makes it a complete and versatile system that is easily portable, connectable, and extensible.
In addition, the experimental results obtained for both the SDMD and DiagElect verify their good performance for each proposed application. The PQ analysis chosen to verify the usability of DiagElect has been the identification of the distorting nodes in a microgrid, because it is one of the most complex. As a future work, DiagElect could be assessed in additional PQ analysis and a new algorithm could be developed capable of reliably identifying harmonic sources, which would improve upon the current literature.

Author Contributions

Conceptualization, G.G.-R., R.S.-H. and J.M.A.; methodology, G.G.-R. and R.S.-H.; software, G.G.-R. and A.D.M.; validation, G.G.-R., R.S.-H. and A.D.M.; formal analysis, G.G.-R., R.S.-H. and J.M.A.; investigation, G.G.-R., R.S.-H. and A.D.M.; resources, R.S.-H. and J.M.A.; data curation, G.G.-R., R.S.-H. and A.D.M.; writing—original draft preparation, G.G.-R.; writing—review and editing, R.S.-H. and J.M.A.; visualization, G.G.-R. and R.S.-H.; supervision, R.S.-H. and J.M.A.; project administration, R.S.-H.; funding acquisition, R.S.-H. All authors have read and agreed to the published version of the manuscript.

Funding

This paper is part of the project “Development of a system based on Industrial IoT for the analysis of electrical power in power systems”, grant number UHU-202023, funded by the European Commission (EC), the University of Huelva (Q7150008F) and the Andalusia Government (S4111001F). The author Gabriel Gómez-Ruiz is enjoying an FPU grant funded by the Spanish Ministry of Universities for the training of university teaching staff during his PhD period.

Institutional Review Board Statement

Not applicable.

Informed Consent Statement

Not applicable.

Data Availability Statement

The data presented in this study are available upon request from the corresponding author.

Conflicts of Interest

The authors declare no conflicts of interest.

References

  1. Hakimi, S.M.; Hasankhani, A.; Shafie-khah, M.; Catalão, J.P.S. Demand Response Method for Smart Microgrids Considering High Renewable Energies Penetration. Sustain. Energy Grids Netw. 2020, 21, 100325. [Google Scholar] [CrossRef]
  2. Tang, J.; Ni, H.; Peng, R.-L.; Wang, N.; Zuo, L. A Review on Energy Conversion Using Hybrid Photovoltaic and Thermoelectric Systems. J. Power Sources 2023, 562, 232785. [Google Scholar] [CrossRef]
  3. Eltigani, D.; Masri, S. Challenges of Integrating Renewable Energy Sources to Smart Grids: A Review. Renew. Sustain. Energy Rev. 2015, 52, 770–780. [Google Scholar] [CrossRef]
  4. Zhang, Q.; Dehghanpour, K.; Wang, Z. Distributed CVR in Unbalanced Distribution Systems with PV Penetration. IEEE Trans. Smart Grid 2019, 10, 5308–5319. [Google Scholar] [CrossRef]
  5. Kabalci, Y. A Survey on Smart Metering and Smart Grid Communication. Renew. Sustain. Energy Rev. 2016, 57, 302–318. [Google Scholar] [CrossRef]
  6. Bhattacharyya, S.; Cobben, S.; Bhattacharyya, S.; Cobben, S. Consequences of Poor Power Quality—An Overview; IntechOpen: London, UK, 2011; ISBN 978-953-307-180-0. [Google Scholar]
  7. Igual, R.; Medrano, C. Research Challenges in Real-Time Classification of Power Quality Disturbances Applicable to Microgrids: A Systematic Review. Renew. Sustain. Energy Rev. 2020, 132, 110050. [Google Scholar] [CrossRef]
  8. Garcia, C.I.; Grasso, F.; Luchetta, A.; Piccirilli, M.C.; Paolucci, L.; Talluri, G. A Comparison of Power Quality Disturbance Detection and Classification Methods Using CNN, LSTM and CNN-LSTM. Appl. Sci. 2020, 10, 6755. [Google Scholar] [CrossRef]
  9. Grasso, F.; Paolucci, L.; Bacci, T.; Talluri, G.; Cenghialta, F.; D’Antuono, E.; de Giorgis, S. Simulation Model and Experimental Setup for Power Quality Disturbances Methodologies Testing and Validation. In Proceedings of the 2019 IEEE 5th International forum on Research and Technology for Society and Industry (RTSI), Florence, Italy, 9–12 September 2019; pp. 359–363. [Google Scholar]
  10. EN 50160:2022; Voltage Characteristics of Electricity Supplied by Public Distribution Network. BSI Standard Publication: London, UK, 2022.
  11. Herrera, R.S.; Salmerón, P. Harmonic Disturbance Identification in Electrical Systems with Capacitor Banks. Electr. Power Syst. Res. 2012, 82, 18–26. [Google Scholar] [CrossRef]
  12. IEC 61000-2-2:2002; Compatibility Levels for Low-Frequency Conducted Disturbances and Signalling in Public Low-Voltage Power Supply Systems. International Electrotechnical Commision: London, UK, 2022.
  13. Sinvula, R.; Abo-Al-Ez, K.M.; Kahn, M.T. Harmonic Source Detection Methods: A Systematic Literature Review. IEEE Access 2019, 7, 74283–74299. [Google Scholar] [CrossRef]
  14. Fernandes, R.A.S.; Oleskovicz, M.; Da Silva, I.N. Harmonic Source Location and Identification in Radial Distribution Feeders: An Approach Based on Particle Swarm Optimization Algorithm. IEEE Trans. Ind. Inform. 2022, 18, 3171–3179. [Google Scholar] [CrossRef]
  15. Herrera, R.S.; Vázquez, J.R. Identification of Unbalanced Loads in Electric Power Systems. Int. Trans. Electr. Energy Syst. 2014, 24, 1232–1243. [Google Scholar] [CrossRef]
  16. Martin, A.D.; Herrera, R.S.; Vazquez, J.R.; Crolla, P.; Burt, G.M. Unbalance and Harmonic Distortion Assessment in an Experimental Distribution Network. Electr. Power Syst. Res. 2015, 127, 271–279. [Google Scholar] [CrossRef]
  17. Sánchez-Herrera, R.; Clavijo-Camacho, J.; Gómez-Ruiz, G.; Vázquez, J.R. Identification of Both Distortion and Imbalance Sources in Electrical Installations: A Comparative Assessment. Energies 2024, 17, 2536. [Google Scholar] [CrossRef]
  18. Fluke Corporation. Fluke Electronics, Calibration and Networks. Available online: https://www.fluke.com/ (accessed on 21 June 2023).
  19. Comprehensive Products and Solutions for Electrical Energy Efficiency. Available online: https://circutor.com/ (accessed on 21 June 2023).
  20. Powerside. PQube® 3 Power Analyzers. Available online: https://powerside.com/products/power-quality-measurement-solutions/pqube-3-power-analyzers/ (accessed on 26 October 2023).
  21. Cristaldi, L.; Ferrero, A.; Salicone, S. A Distributed System for Electric Power Quality Measurement. IEEE Trans. Instrum. Meas. 2002, 51, 776–781. [Google Scholar] [CrossRef]
  22. Bucci, G.; Fiorucci, E.; Landi, C. Digital Measurement Station for Power Quality Analysis in Distributed Environments. IEEE Trans. Instrum. Meas. 2003, 52, 75–84. [Google Scholar] [CrossRef]
  23. Babaev, S.; Singh, R.S.; Cobben, S.; Ćuk, V.; Downie, A. Multi-Point Time-Synchronized Waveform Recording for the Analysis of Wide-Area Harmonic Propagation. Appl. Sci. 2020, 10, 3869. [Google Scholar] [CrossRef]
  24. Roy, S.; Bedanta, B.; Dawnee, S. Advanced Metering Infrastructure for Real Time Load Management in a Smart Grid. In Proceedings of the 2015 International Conference on Power and Advanced Control Engineering (ICPACE), Bengaluru, India, 12–14 August 2015; pp. 104–108. [Google Scholar]
  25. Laverty, D.M.; Best, R.J.; Brogan, P.; Al Khatib, I.; Vanfretti, L.; Morrow, D.J. The OpenPMU Platform for Open-Source Phasor Measurements. IEEE Trans. Instrum. Meas. 2013, 62, 701–709. [Google Scholar] [CrossRef]
  26. Shaaban, M.F.; Osman, A.H.; Aseeri, F.M. A Multi-Objective Allocation Approach for Power Quality Monitoring Devices. IEEE Access 2019, 7, 40866–40877. [Google Scholar] [CrossRef]
  27. Cataliotti, A.; Cosentino, V.; Di Cara, D.; Tinè, G. LV Measurement Device Placement for Load Flow Analysis in MV Smart Grids. IEEE Trans. Instrum. Meas. 2016, 65, 999–1006. [Google Scholar] [CrossRef]
  28. Piatek, K.; Firlit, A.; Chmielowiec, K.; Dutka, M.; Barczentewicz, S.; Hanzelka, Z. Optimal Selection of Metering Points for Power Quality Measurements in Distribution System. Energies 2021, 14, 1202. [Google Scholar] [CrossRef]
  29. Kabalcı, E.; Kabalcı, Y.; Siano, P. Design and Implementation of a Smart Metering Infrastructure for Low Voltage Microgrids. Int. J. Electr. Power Energy Syst. 2022, 134, 107375. [Google Scholar] [CrossRef]
  30. Kaur, A.P.; Singh, M. Design and Development of a Three-Phase Net Meter for V2G Enabled Charging Stations of Electric Vehicles. Sustain. Energy Grids Netw. 2022, 30, 100598. [Google Scholar] [CrossRef]
  31. Mudaliar, M.D.; Sivakumar, N. IoT Based Real Time Energy Monitoring System Using Raspberry Pi. Internet Things 2020, 12, 100292. [Google Scholar] [CrossRef]
  32. Rodrigues Junior, W.L.; Borges, F.A.S.; Veloso, A.F. da S.; Rabêlo, R. de A.L.; Rodrigues, J.J.P.C. Low Voltage Smart Meter for Monitoring of Power Quality Disturbances Applied in Smart Grid. Measurement 2019, 147, 106890. [Google Scholar] [CrossRef]
  33. Alonso-Rosa, M.; Gil-de-Castro, A.; Medina-Gracia, R.; Moreno-Munoz, A.; Cañete-Carmona, E. Novel Internet of Things Platform for In-Building Power Quality Submetering. Appl. Sci. 2018, 8, 1320. [Google Scholar] [CrossRef]
  34. Mendi, Y.M.; Akinc, H.; Başalan, İ.; Atlı, D.; Civelek, Y. Design and Implementation of Smart Meters with Hybride Communication System Architecture. In Proceedings of the 2019 IEEE PES Innovative Smart Grid Technologies Europe (ISGT-Europe), Bucharest, Romania, 29 September–2 October 2019; pp. 1–5. [Google Scholar]
  35. Matthee, A.; Moonen, N.; Leferink, F. Synchronous Multipoint Low-Frequency EMI Measurement and Applications. IEEE Lett. Electromagn. Compat. Pract. Appl. 2022, 4, 120–124. [Google Scholar] [CrossRef]
  36. Batista, Í.J.; Barreto, L.H.S.C. Wireless Web-Based Power Quality Monitoring System in a Microgrid. In Proceedings of the 2018 Simposio Brasileiro de Sistemas Eletricos (SBSE), Niteroi, Brazil, 12–16 May 2018; pp. 1–4. [Google Scholar]
  37. de Souza, G.P.; Boaventura, W. do C. Time-Alignment of Electrical Network Measurements through Time Series of Cycle RMS Values. Int. J. Electr. Power Energy Syst. 2023, 144, 108518. [Google Scholar] [CrossRef]
  38. Castello, P.; Murenu, A.; Pegoraro, P.A.; Sulis, S. Accurate Measurement System for Power Quality Monitoring in a Real Grid Context. In Proceedings of the 2020 IEEE PES Innovative Smart Grid Technologies Europe (ISGT-Europe), Delft, The Netherlands, 26–28 October 2020; pp. 1120–1125. [Google Scholar]
  39. IEC 62053-21:2020; Electricity Metering Equipment—Particular Requirements—Part 21: Static Meters for AC Active Energy (Classes 0, 5, 1 and 2). International Electrotechnical Commision: London, UK, 2020.
  40. IEC 61850-3:2013; Communication Networks and Systems for Power Utility Automation—Part 3: General Requirements. International Electrotechnical Commision: London, UK, 2013.
  41. Castello, P.; Muscas, C.; Pegoraro, P.A.; Sulis, S. Synchronization Solutions for Power Quality Functionalities in Low Cost Smart Meters. In Proceedings of the 2022 IEEE International Instrumentation and Measurement Technology Conference (I2MTC), Ottawa, ON, Canada, 16–19 May 2022; pp. 1–6. [Google Scholar]
  42. Muscas, C. Assessment of Electric Power Quality: Indices for Identifying Disturbing Loads. Eur. Trans. Electr. Power 1998, 8, 287–292. [Google Scholar] [CrossRef]
  43. Sahani, M.; Dash, P.K. Automatic Power Quality Events Recognition Based on Hilbert Huang Transform and Weighted Bidirectional Extreme Learning Machine. IEEE Trans. Ind. Inform. 2018, 14, 3849–3858. [Google Scholar] [CrossRef]
  44. IEEE Std 1159-2019; IEEE Recommended Practice for Monitoring Electric Power Quality. IEEE: Piscataway Township, NJ, USA, 2019. [CrossRef]
  45. Sayed, S.; Hussain, T.; Gastli, A.; Benammar, M. Design and Realization of an Open-Source and Modular Smart Meter. Energy Sci. Eng. 2019, 7, 1405–1422. [Google Scholar] [CrossRef]
  46. Havrlík, M.; Libra, M.; Poulek, V.; Kouřím, P. Analysis of Output Signal Distortion of Galvanic Isolation Circuits for Monitoring the Mains Voltage Waveform. Sensors 2022, 22, 7769. [Google Scholar] [CrossRef] [PubMed]
  47. Elvira-Ortiz, D.A.; Morinigo-Sotelo, D.; Zorita-Lamadrid, A.L.; Osornio-Rios, R.A.; Romero-Troncoso, R.d.J. Fundamental Frequency Suppression for the Detection of Broken Bar in Induction Motors at Low Slip and Frequency. Appl. Sci. 2020, 10, 4160. [Google Scholar] [CrossRef]
  48. Conti, G.; Jimenez, D.; del Rio, A.; Castano-Solis, S.; Serrano, J.; Fraile-Ardanuy, J. A Multi-Port Hardware Energy Meter System for Data Centers and Server Farms Monitoring. Sensors 2022, 23, 119. [Google Scholar] [CrossRef] [PubMed]
  49. Parimala, K.V.; Nisha, K.C.R.; Nemichandran. FPGA Based Power Quality Monitoring Using FFT Method for Single Phase Power Metering. In Proceedings of the 2016 International Conference on Emerging Technological Trends (ICETT), Kollam, India, 21–22 October 2016; pp. 1–6. [Google Scholar]
  50. Ribeiro, E.G.; Mendes, T.M.; Dias, G.L.; Faria, E.R.S.; Viana, F.M.; Barbosa, B.H.G.; Ferreira, D.D. Real-Time System for Automatic Detection and Classification of Single and Multiple Power Quality Disturbances. Measurement 2018, 128, 276–283. [Google Scholar] [CrossRef]
  51. Websockets. An Implementation of the WebSocket Protocol (RFC 6455 & 7692). Available online: https://pypi.org/project/websockets/ (accessed on 24 July 2024).
  52. IEC 62052-11:2003; Electricity Metering Equipment (AC)—General Requirements, Tests and Test Conditions. Part 11: Metering Equipment. International Electrotechnical Commision: London, UK, 2003.
Figure 1. Schematic diagram of the proposed experimental microgrid.
Applsci 14 07666 g001
Figure 2. Test bench configuration to validate the performance of DiagElect.
Applsci 14 07666 g002
Figure 3. Architecture of the SDMD.
Applsci 14 07666 g003
Figure 4. The prototype of the SDMD.
Applsci 14 07666 g004
Figure 5. The developed communications network, including the SDMD, the SBC, and the host computer.
Applsci 14 07666 g005
Figure 6. Flow chart of the communication process for requesting and collecting data from a microgrid node, involving the SDMD, the SBC, and the host computer.
Applsci 14 07666 g006
Figure 7. Schematic diagram of the proposed DiagElect.
Applsci 14 07666 g007
Figure 8. Mounting plate developed with the SDMD and the SBC.
Applsci 14 07666 g008
Figure 9. Comparative performance of the proposed SDMD and Circutor®. Percentages of deviations in both voltage and current, relative to the reference values provided by the grid emulator. (a) Percentage of voltage deviation. (b) Percentage of current deviation.
Applsci 14 07666 g009
Figure 10. Current spectra corresponding to (a) node 3 and (b) node 4.
Applsci 14 07666 g010
Figure 11. Voltage and current waveforms at (a) node 1, (b) node 2, (c) node 3, and (d) node 4. Voltages and currents are represented by continuous and dashed lines, respectively. The term ‘V1′ refers to the voltage in phase 1, and similarly for the other phases and the currents. The term ‘VN’ denotes the voltage in the neutral line.
Applsci 14 07666 g011aApplsci 14 07666 g011b
Table 1. Comparison of key features in electrical measurement networks identified in the literature. An “X” indicates that a feature is achieved by a system.
Ref.Detection and Classification of PQ DisturbancesSynchronous Measurements across Multiple PointsLow Cost-Devices, Open-Hardware PlatformsScalability and Portability
[34] X
[35] X
[36]X XX
[37]XX
[38]XX X
DiagElectXXXX
Table 2. Specifications of the loads in the microgrid nodes.
NodeLoad TypeExpected Distortion/Non-Distortion Source
Node 13-phase Unbalanced R LoadNon-distorting
Node 23-phase Balanced RL LoadNon-distorting
Node 33-phase Voltage RegulatorDistortion source
Node 43-phase RectifierDistortion source
Table 3. Specifications for the proposed SDMD.
ParametersValue
Voltage range0–400 V
Current range0–30 A
Resolution156 µV
Supply voltage4.5–16 V
CommunicationRS232
Dimension199 × 116 mm2
Table 4. Computed parameters in each node of the microgrid.
Node 1Node 2Node 3Node 4
T H D V (%)1.141.141.141.14
T H D I (%)1.131.1628.9066.46
P T (W)645.761.7723.7169.8
P 1 (W)645.661.6724.2169.9
Q T (Var)4.62232.994.048.3
Q 1 (Var)4.62232.994.747.5
H G I (%)0.000.5323.7956.97
Disclaimer/Publisher’s Note: The statements, opinions and data contained in all publications are solely those of the individual author(s) and contributor(s) and not of MDPI and/or the editor(s). MDPI and/or the editor(s) disclaim responsibility for any injury to people or property resulting from any ideas, methods, instructions or products referred to in the content.

