Article

Anticancer Properties of Peroxisome Proliferator-Activated Receptor Gamma (PPARγ) Potential Agonists 4-Thiazolidinone-Pyrazoline Hybrids Les-4368 and Les-4370 in Colorectal Adenocarcinoma Cells In Vitro

1
Department of Biotechnology and Cell Biology, University of Information Technology and Management in Rzeszow, St. Sucharskiego 2, 35-225 Rzeszow, Poland
2
Department of Pharmaceutical, Organic and Bioorganic Chemistry, Danylo Halytsky Lviv National Medical University, St. Pekarska 69, 79010 Lviv, Ukraine
3
Department of Organic Chemistry and Pharmacy, Lesya Ukrainka Volyn National University, Volya Avenue 13, 43025 Lutsk, Ukraine
4
Department of Organic Chemistry, Medical University of Lublin, Aleje Racławickie 1, 20-059 Lublin, Poland
*
Author to whom correspondence should be addressed.
Appl. Sci. 2024, 14(17), 7692; https://doi.org/10.3390/app14177692 (registering DOI)
Submission received: 7 June 2024 / Revised: 7 August 2024 / Accepted: 29 August 2024 / Published: 30 August 2024
(This article belongs to the Section Chemical and Molecular Sciences)

Abstract

:
Presently, a major challenge is the search for new compounds that may exhibit an inhibitory effect on tumor progression. Recently, the 4-thiazolidinone (4-TZD) group has gained attention in this research field. The aim of the present study was to evaluate the anticancer effects of two new 4-TZD-based derivatives (Z)-5-[5-(2-hydroxyphenyl)- (Les- 4368) and (Z)-5-[5-(4-dimethylaminophenyl)-3-phenyl-4,5-dihydropyrazol-1-ylmethylene]-3-(3-acetoxyphenyl)-2-thioxothiazolidin-4-ones (Les-4370) on peroxisome proliferator-activated receptor gamma (PPARγ)-dependent cytotoxicity in human colorectal adenocarcinoma cells (CACO-2) and in normal human fibroblasts (BJ) in vitro. Les-4368 and Les-4370 exerted a toxic effect on both tested cell lines in high (micromolar) concentrations (10–100 µM). In addition, Les-4368 and Les-4370 applied in the BJ and CACO-2 cells in the concentration range of 10 µM to 100 µM increased the activity of caspase-3 and the production of reactive oxygen species (ROSs). The mRNA expression of PPARγ-related genes (PPARγ, AhR, PXR, and NF-κB) showed certain changes in these parameters, proving the engagement of this receptor in the induction of the biological effects of both tested 4-TZD derivatives. Moreover, the treatment of the BJ and CACO-2 cells with Les-4368, Les-4370, an antagonist (GW9662), or an agonist (rosiglitazone) of the PPARγ receptor also resulted in changes in the above-mentioned parameters. Unfortunately, the tested substances studied cell line work in a non-selective way at a relatively high concentration, which reduces their potential for clinical application. Our research is the preliminary study with the use of these compounds and requires further studies to elucidate the mechanisms of action of their anticancer potential.

1. Introduction

According to the World Health Organization (WHO), cancer is the second most common cause of death worldwide [1]. In 2022, there were over 19 million new cancer cases and nearly 10 million deaths caused by this disease [2]. Colorectal cancer (CRC) is the second most commonly diagnosed cancer in women and the third most commonly diagnosed cancer in men worldwide [3]. It is estimated to be responsible for 9.4% of cancer-related deaths. Moreover, it has been estimated that, by 2040, the global burden of cancer will have accounted for as many as 28.4 million cases [4,5]. This indicates an emerging problem posed to current medicine and suggests inefficiency of the present anticancer therapies, especially in the case of cancer characterized by the multidrug resistance (MDR) phenotype [6].
Over the last decade, the 4-thiazolidinone-based compounds (4-TZD) have gained increasing attention in the context of the searching for new pharmaceuticals [7]. 4-TZD are promising compounds in the new drug design, as they can serve as a tool for manipulating physicochemical properties such as lipophilicity, polarity, and they even possess a hydrogen bonding ability [8]. These properties make them attractive pharmacokinetically and toxicologically [7]. Among the best-known subtypes are 5-ene-2-amino-4-thiazolidinones and thiopyrano[2,3-d] thiazoles [9]. The anticancer properties of 4-TZD derivatives have been repeatedly described and proved in the various literature reports [10,11,12]. Researchers demonstrated inter alia the ability of 7,8-dimethoxy-1-oxo-1H-isothiochromene-3-carboxylic acid (4-phenylthiazol-2-yl)-amide (Les-3266) to decrease the metabolic activity in human tongue squamous cell carcinoma cells (SCC-15) (Figure 1) [10]. Metabolic activity-reducing properties were also shown by 5-fluoro-3-(4-oxo-2-thioxothiazolidin-5-ylidenemethyl)-1H-indole-2-carboxylic acid methyl ester (Les-6009) in normal human fibroblasts (BJ), lung carcinoma (A549), and neuroblastoma (SH-SY5Y) cells (Figure 1) [11]. Interestingly, many papers suggest engagement of the peroxisome proliferator-activated receptor gamma (PPARγ) in the biological activity of many 4-TZD derivatives [13].
Peroxisome proliferator-activated receptors (PPARs) act as transcription factors regulating the expression of many genes engaged inter alia in oxidative stress response, inflammation, and drug metabolism [14]. Among PPARs, PPARγ is considered to be a promising target in the modern anticancer therapy due to its regulatory role in cell death, proliferation, and angiogenesis [15]. Szychowski et al. have proved the anticancer activity of certain 4-TZD derivatives, namely 5Z-(4-fluorobenzylidene)-2-(4-hydroxyphenylamino)-thiazol-4-one (Les-236) in human cancer cells such as a A549, SCC-15, SH-SY5Y, and colorectal adenocarcinoma (CACO-2) cells [12]. It was proven that these compounds are able to increase lactate dehydrogenase (LDH) release and act as inductors of apoptosis (measured by caspase-3 activity) in a concentration range between 1 µM and 100 µM [12]. Moreover, 4-TZD-based thiopyrano[2,3-d] thiazole derivatives namely rel-N-(2,4-dichlorophenyl)-2-[(5aR,11bR)-2-oxo-5a,11b-dihydro-2H,5H-chromeno[4′,3′:4,5]thiopyrano[2,3-d][1,3]thiazol-3(6H)-yl]acetamide (Les-2194) exerted cytotoxic effects on SCC-15 cells [16]. A similar cytotoxic effect on SCC-15 cells was also exerted by 3-{2-[5-(4-dimethylaminophenyl)-3-phenyl-4,5-dihydropyrazol-1-yl]-4-oxo-4,5-dihydro-1,3-thiazol-5-ylidene}-2,3-dihydro-1H-indol-2-one (Les-3640) [9]. Importantly, 4-TZD-based derivatives can act as PPARγ agonists or antagonists, which has recently been shown inter alia by Szychowski et al. and Bar et al. [10,17]. However, there are no reports on the impact of Les-4368 and Les-4370 on PPARγ-induced toxicity in CACO-2.
The aryl hydrocarbon receptor (AhR) is a ligand-activated transcription factor that integrates environmental, dietary, microbial, and metabolic cues [18]. Previous studies have demonstrated that AhR plays an important role in the regulation of the immune system and modulation of inflammation, cell proliferation, cell differentiation, and apoptosis [19,20]. As reported, inflammation is a well-described risk factor of cancer due to its contribution to induction of oncogenesis [19,21]. AhR expression has been shown to increase in many cancer subtypes, including lymphocytic leukemia [22], breast cancer [23], lung cancer [24], and gastric cancer [25,26]. It has been reported that AhR overexpression reduces PPARγ stability by forming a ubiquitin ligase complex [27]. As shown by Dou et al., AhR-knock-out mouse embryonic fibroblast cells (3T3-L1) were characterized by an increase in the expression of PPARγ; conversely, a decrease in endogenous PPARγ was observed in AhR-overexpressing 3T3-L1 cells [27]. Moreover, a similar correlation was highlighted in the above-cited study, revealing that blocking of AhR degradation by the proteasome inhibitor carbobenzoxyl-L-leucyl-L-leucyl-L-leucine (MG-132) caused a decrease in the PPARγ expression level [27]. Furthermore, Szychowski et al. have proved that methyl 5-fluoro-3-[2-(4-hydroxyanilino)-4-oxo-4,5-dihydro-1,3-thiazol-5-ylidenmethyl]-1H-2-indolecarboxylate (Les-6166) is able to affect AhR mRNA expression in the 3T3-L1 cell line in vitro [28]. However, the PPARγ-AhR-induced anticancer properties of the 4-TZDs, namely Les-4368 and Les-4370, have never been studied in CACO-2 cells in vitro, which is crucial due to the increasing colorectal cancer morbidity. To date, Les-4368 and Les-4370 derivatives were studied only on leukemia cell line (HL-60) [29]. As afore mentioned, it seems to be crucial to study toxicity and mechanism of action of mentioned compounds on other cell types, especially CACO-2 cell line (a common model for gastric cancer or enterocytes in the differentiated state), and compare these data with non-cancerous cells such as normal fibroblasts (well-established model of normal cells).
Therefore, the aim of the present study was to evaluate the anticancer properties of two 4-TZD derivatives, Les-4368 and Les-4370, and the engagement of two intracellular receptors (PPARγ and AhR) in this phenomenon in BJ and CACO-2 cells in vitro by measuring the metabolic activity, reactive oxygen species (ROS) production, LDH release levels, and expression of certain genes and proteins after treatment of the above-mentioned cells with the tested 4-TZD derivatives.

2. Materials and Methods

2.1. Reagents

Phosphate-buffered saline (PBS) without Ca2+ and Mg2+, Dulbecco’s Modified Eagle’s Medium (DMEM) without L-glutamine and phenol red (17-205-CV), and Minimum Essential Medium Eagle (MEM) without L-glutamine and phenol red (17-305-CV) were purchased from Corning (Tewksbury, MA, USA). Trypsin, penicillin, streptomycin, resazurin sodium salt, dimethyl sulfoxide (DMSO), 2′,7′-dichlorodihydrofluorescein diacetate (H2DCF-DA), caspase-3 substrate (Ac-DEVD-pNA), hydroxyethylpiperazineethanesulfonic acid (HEPES), sodium chloride (NaCl), 3-[(3cholamidopropyl)dimethylamino]-1-propanesulfonate hydrate (CHAPS), ethylenediaminetetraacetic acid (EDTA), Bradford reagent, methanol, acrylamide/bisacrylamide, Tris HCl, Tris Base, sodium dodecyle sulfite (SDS), N,N,N′,N′-tetrametyloetylenodiamina (TEMED), bovine serum albumin (BSA), ammonium persulfate (APS), glycerol, dithiothreitol (DTT), and 2-chloro-5-nitro-N-phenylbenzamide (GW9662—a selective PPARγ antagonist) were purchased from Sigma-Aldrich (St. Louis, MO, USA). The lactate dehydrogenase release assay was purchased from Takara Bio (Kusatsu, Japan). Fetal bovine serum (FBS), universal RNA purification kit, radioimmunoprecipitation assay buffer (RIPA), and Fast Probe qPCR Master Mix were purchased from EURx (Gdansk, Poland). The high-capacity cDNA reverse transcription kit, TaqMan® probes and primers corresponding to specific genes encoding ACTB (Hs01060665_g1), AhR (Hs00169233_m1), PPARγ (Hs00234592_m1), NF-κB1 (Hs00765730_m1), and PXR (Hs01114267_m1), and anti-mouse (#31430) and anti-rabbit (SH233595) HRP-conjugated secondary antibodies were purchased from ThermoFisher (Waltham, MA, USA). The primary anti-AhR antibodies (67785-1-Ig) were kindly gifted by Proteintech (Düseldorf, Germany). Primary anti-PPARγ antibodies (24355) were purchased from Cell Signalling (Danvers, MA, USA). Primary anti-GAPDH antibodies (sc-47724) and the 0.45 μm pore-size PVDF membrane were obtained from Santa Cruz Biotechnology (Santa Cruz, CA, USA).

2.2. Synthesis of 4-Thiazolidinone-Pyrazoline Hybrids Les-4368 and Les-4370

The Les-4368 and Les-4370 derivatives were reported early in [29] and were easily obtained from m-aminophenol as shown in Figure 2.

2.3. Cell Culture and Treatment

The BJ cell line (CRL-2522™) and the CACO-2 cell line (HTB-37™) were provided by the American Type Culture Collection (ATCC, distributor: LGC Standards, Lomianki, Poland). The CACO-2 cells were cultured in MEM without phenol red with 10% of FBS containing 2.5 mM of L-glutamine, 1.2 g/L of sodium bicarbonate, and 0.1% of antibiotics. The BJ cells were cultured in DMEM without phenol red supplemented with 2 mM of L-glutamine, 10% of FBS, and 0.1% of penicillin/streptomycin. Both cell lines were maintained at a constant concentration of 5% CO2 at 37 °C. The cells were seeded at a density of 4.5 × 10⁵ cells per well in 96-well plates (for the resazurin reduction assay, the H2DCF-DA assay, the LDH-release assay), 1.1 × 10⁵ cells per well in 12-well plates (for qPCR), and 1.2 × 10⁵ cells per well in 6-well plates (for Western blot). The BJ and CACO-2 cells were treated with increasing concentrations of Les-4368 and Les-4370 in the range between 1 nM and 100 µM for 24 h or 48 h (for assessment of metabolic activity, ROS production, and LDH release levels). In the case of the qPCR method, both tested cell lines were treated with an efficient but non-lethal concentration of Les-4368 (10 µM), Les-4370 (10 µM), and 1 µM of rosiglitazone for 6 h. To assess the engagement of PPARγ in the biological effect of the tested 4-TZD derivatives at the protein level, the BJ and CACO-2 cells were exposed to 10 µM of Les-4368, 10 µM of Les-4370, 1 µM of GW9662, or 1 µM of rosiglitazone alone and in co-treatment with Les-4368 or Les-4370. Cells treated with DMSO served as controls; the amount of DMSO in the experiments was always the same and did not exceed 0.1%.

2.4. Resazurin Reduction Assay

The metabolic activity of the cells was assessed using the resazurin reduction assay according to a previously published protocol [17]. After 24 h and 48 h of treating the cells with the tested compounds, resazurin working solution was added for 1 h. After this time, fluorescence was measured at an excitation wavelength of 530 nm and an emission wavelength of 590 nm on a microplate reader (FilterMax F5, Molecular Devices, Corp., Sunnyvale, CA, USA).

2.5. LDH Cytotoxicity Assay

The toxicity of the tested compounds was measured using the LDH release assay. The measurement was performed in accordance with the manufacturer’s protocol (Takara Bio). Briefly, after 24 h and 48 h of the BJ and CACO-2 treatment with Les-4368 and Les-4370, 80 µL of the culture medium was transferred to a new 96-well plate and the reaction mixture solution was added. The medium with the reaction reagents was incubated for 30 min at RT. Absorbance was measured at 490 nm using a FilterMax F5 Multi-Mode microplate reader (Molecular Devices, Corp., Sunnyvale, CA, USA). The remaining plate with cells was frozen at −80 °C and kept until measurement of caspase activity.

2.6. Measurement of Intracellular ROS Level

Intracellular ROS levels were assessed using 5 µM of H2DCF-DA according to Szychowski et al. [30]. Fluorescence was measured after 24 and 48 h of exposure at an excitation wavelength of 485 nm and an emission wavelength of 535 nm using a microplate reader (FilterMax F5). The results were expressed as a percentage (%) of the control (DMSO-treated cells).

2.7. Caspase-3 Activity Assay

Caspase-3 activity was measured according to a previously published protocol with minor modifications [31]. After 24 and 48 h cell treatment with studied compounds, cell plates without medium were frozen at −80 °C for further analysis. Cells on culture plate were thawed and incubated in lysis buffer for 10 min at 4 °C. After this time, a working mixture containing the caspase-3 substrate in lysis buffer (50 µL per well) was added. Absorbance was measured after 30 min at 405 nm using a microplate reader (FilterMax F5 Multi-Mode; Molecular Devices, Corp., Sunnyvale, CA, USA).

2.8. Rhodamine-B and Hoechst 33,342 Staining

The BJ and CACO-2 cells were exposed to 1, 10, or 50 µM of Les-4368 and Les-4370, and the cells were cultured for an additional 24 h according to the previously described protocol [32]. Staurosporine (STS) at a 100 nM concentration was used as positive control of apoptosis. Briefly, the cells were exposed to Rhodamine-B and Hoechst 33342 (H33342) diluted in medium without FBS at a final concentration of 1 µM and 10 µM, respectively. After incubation, the cells were washed in PBS and visualized using a fluorescence microscope at red (Rhodamine-B) and blue (Hoechst33342) channels (LSM 700, ZEISS, Oberkochen, Germany).

2.9. qPCR Analysis of PPARγ, AhR, PXR, and NF-κB Genes

The qPCR analysis was performed according to the protocol described by Szychowski et al. with minor modifications [33]. Briefly, the total RNA isolation was carried out after 6 h of treatment of the cells with the tested compounds as described above according to the manufacturer’s protocol (Universal RNA Purification Kit, EURx, Gdańsk, Poland). RNA quantity and quality were then determined using a NanoDrop device (ND/1000 UV/Vis; Thermo Fisher, Waltham, MA, USA). RT-PCR was performed using CFX Real Time (BioRad, Hercules, CA, USA), starting with transcription of mRNA to cDNA (with 800 ng of RNA template for CACO-2 and BJ) according to the manufacturer’s protocol (Thermo Fisher). The qPCR analysis of genes was then performed in a volume of 20 µL with 1 µL of cDNA and specific probes and primers. The reaction was performed with the previously described reaction parameters [33]. The analyses were performed using the ΔΔCt method (the sample Ct threshold was determined in the exponential phase). To evaluate the gene expression levels, the reference gene ACTB was selected as the most stable gene.

2.10. Western Blot

For the Western blot method, the BJ and CACO-2 cells were seeded on a 6-well plate at the density of 1.2 × 10⁵ cells/well. Next, the cells were treated as described above (Section 2.3). After the treatment, total proteins were collected using the RIPA buffer and stored at −80 °C for further analysis. On the day of analysis, the protein content in each sample was assessed using the Bradford method, and the protein concentration was normalized [34]. Detailed Western blot was performed according to the previously described protocol [35]. Crucial antibody dilutions of primary antibodies included anti-PPARγ (dilution 1:2000, rabbit), anti-AhR (dilution 1:2500, mouse), and anti-GAPDH (dilution 1:1000, mouse). The GAPDH protein expression was used as a loading control, preceded by striping the membrane with mild stripping buffer according to the producer’s manual (Abcam, Cambridge, UK).

2.11. Statistical Analysis

The data are presented as means ± standard deviation (SD) from six replicates (n = 6). Statistical analysis was performed using GraphPad Prism 8 software with a one-way analysis of variance (ANOVA) and Tukey’s multiple comparison post-hoc test. Statistically significant differences between individual values were denoted as follows: * p < 0.05, ** p < 0.01, *** p < 0.001, compared to the control sample. The data denoted as # were statistically different between certain groups at p < 0.05.

2.12. Analysis of Molecular Docking Simulations

To explore the suitable binding modes between the investigated compounds and the target receptors, a docking study was carried out using the newest version of Autodock Vina 1.2.3 [36]. The NMR structure of the PPARγ receptors was retrieved from the Protein Data Bank (PDB code 6K0T—resolution 1.84 Å) [37]. The PPARγ receptor is co-crystallized with the massive tricyclic non-thiazolidine ligand (PubChem CID 136264026) with excellent affinity (EC50 = 0.0025 µM). The structure of the aryl hydrocarbon receptor was obtained from the Hsp90-XAP2-AhR complex (PDB code 7ZUB electron microscopy with the resolution 2.85 Å), which was co-crystallized with indirubin [38]. The structures of Les-4368 and Les-4370 were drawn by the Biovia Draw 2022 (64-bit version). Energy minimization were performed by Avogadro 1.2.0 [39] using the force field MMFF94 (10,000 steps).
The crystal structures of PPARγ and AhR were prepared using AutoDock Tools by eliminating ligands and water molecules and adding polar hydrogens. The Kollman charges were distributed among the residues. The sizes of PPARγ and AhR sites were set at 50 × 50 × 150 Å coordinates in x, y, and z dimensions. The exhaustiveness parameters were set as 32. The docking simulation parameters were set as valid if they were possible to replicate the positions of the initial ligands from the X-ray crystal structures, as evidenced by the consistently low RMSD values of ≤ 2 Å. Visualization and interpretation were performed using Chimera 1.16 and Discovery Studio Visualizer 21.1.0. The docking scores of the co-crystallized ligands were used for comparison and estimation of the affinity of Les-4368 and Les-4370. In addition, PPARγ agonist rosiglitazone was tested as a reference molecule used during the assays, and its activity was sufficient to be produced as a successful marketing drug.

3. Results

3.1. Metabolic Activity

To assess cell viability, the resazurin reduction assay was chosen. The decrease in resazurin reduction is proportional to the decrease of the cell metabolism or cell number. After the 24 h exposure of the BJ cells to Les-4368, a 24.60%, 66.40%, and 72.34% decrease in the metabolic activity was noted at the three highest µM concentrations (from 10 to 100 µM), compared to the control (Figure 3A). In turn, after the 48 h exposure of the BJ cells to Les-4368, the 1µM, 10 µM, 50 µM, and 100 µM concentrations caused a decrease in the metabolic activity by 17.98%, 43.07%, 73.35%, and 75.77%, respectively, compared to the control (Figure 3A).
In the BJ cell line, after the 24 h exposure to Les-4370, only the 100 µM concentration caused a 17.73% decrease in the metabolic activity, compared to the control (Figure 3B). In turn, after the 48 h treatment of the tested cells with Les-4370, a similar decrease in the metabolic activity was observed in the concentration range of 50–100 µM (by 16.95 and 17.11%, in comparison to the control) (Figure 3B).
After the 24 h exposure of the CACO-2 cells to Les-4368, the metabolic activity was reduced at the concentrations of 10 µM, 50 µM, and 100 µM by 23.39%, 41.94%, and 45.80%, respectively, compared to the control (Figure 3C). In turn, after the 48 h treatment of the cells with 10 µM, 50 µM, and 100 µM of Les-4368, the metabolic activity was decreased by 44.51%, 59.35%, and 58.38%, respectively, compared to the control (Figure 3C).
The treatment of the CACO-2 cells with Les-4370 at the concentrations of 10 µM, 50 µM, and 100 µM for 24 h resulted in a decrease in the metabolic activity by 10.93%, 11.04%, and 13.84%, respectively, compared to the control (Figure 3D). After the 48 h exposure of the CACO-2 cells to Les-4370, an 11.36% decrease in this parameter was found in the 100 µM concentration variant, compared to the control (Figure 3D).
Based on results of the resazurin reduction test, half of the maximal inhibitory concentration (IC50) was calculated (Table 1).

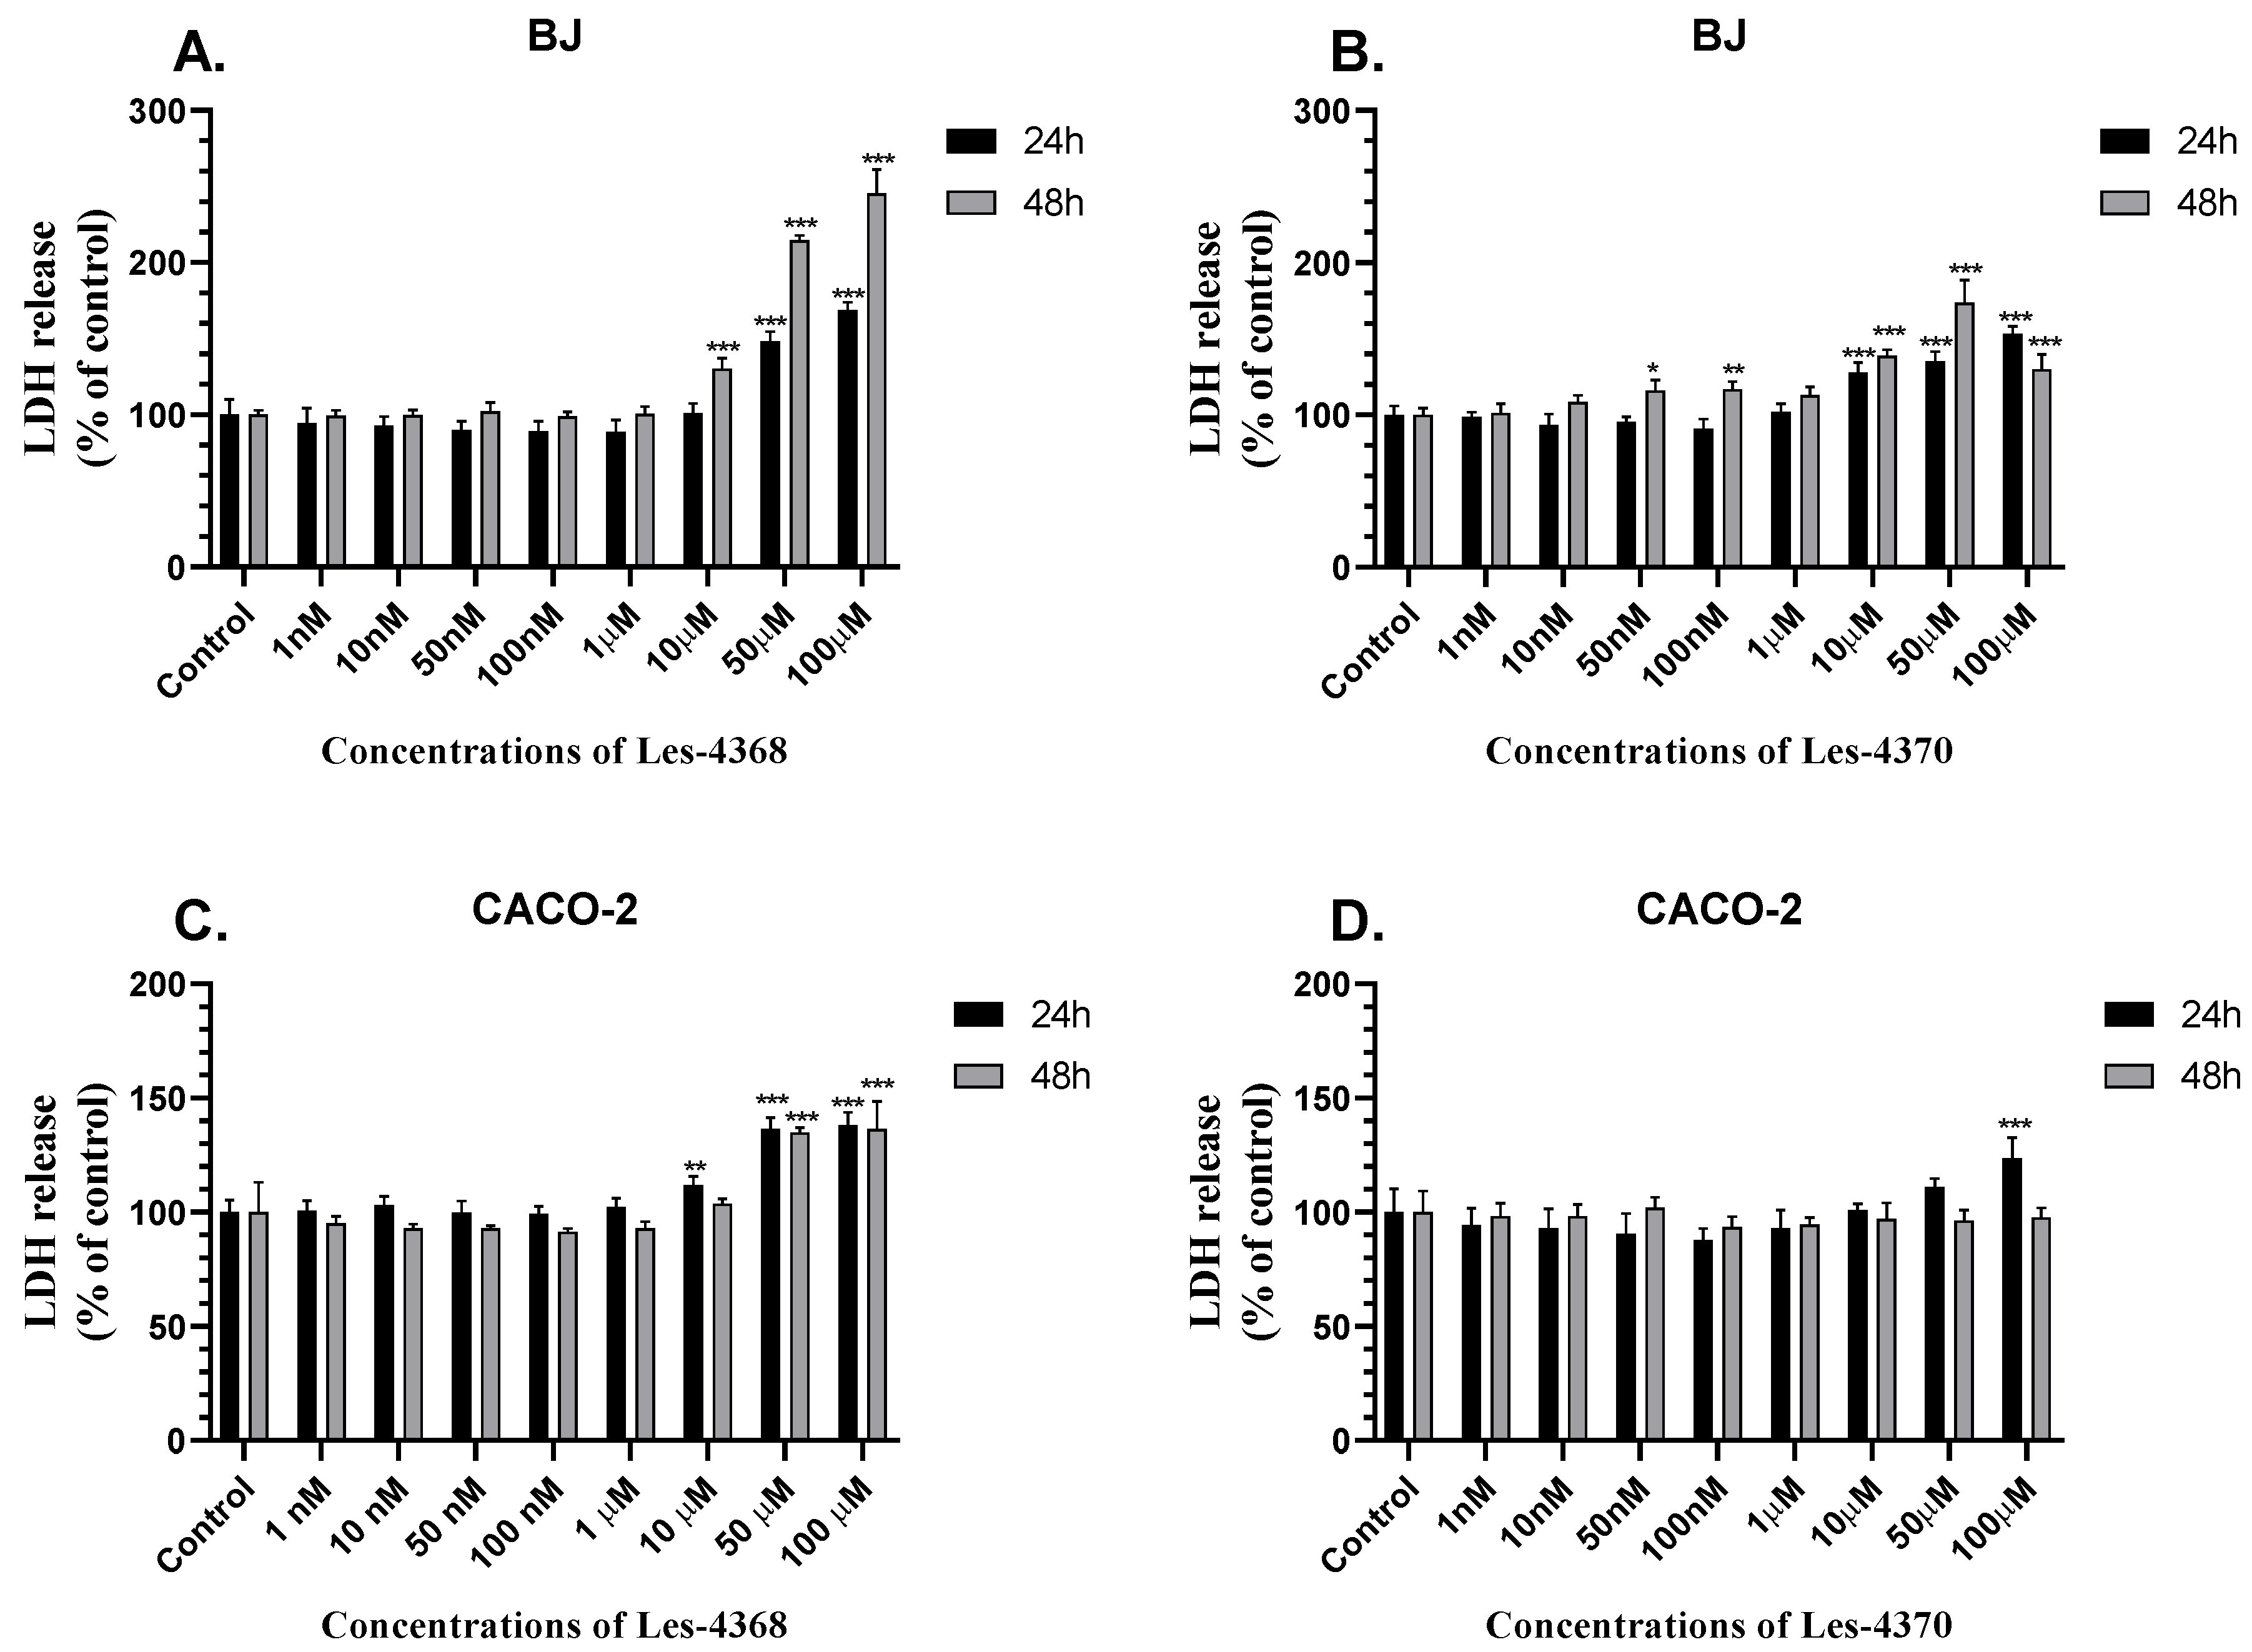
3.2. LDH Release Level

The LDH release assay was chosen to evaluate the toxicity of the tested compounds. LDH is a cytoplasm enzyme and the detection of LDH in the medium is an indicator of a loss of cell membrane integrity. The increase in LDH release is proportional to toxicity of the compound.
BJ cells treated with 50 µM and 100 µM of Les-4368 for 24 h were characterized by a significant 48.15% and 68.63% increase in the LDH release level, respectively, compared to the control (Figure 4A). After the 48 h treatment of the BJ cells with 10 µM, 50 µM, and 100 µM of Les-4368, the LDH release level increased by 30.44%, 114.59%, and 145.30%, respectively, compared to the control (Figure 4A).
After the 24 h exposure of the BJ cells to Les-4370, the level of LDH release increased at the 10 µM, 50 µM, and 100 µM concentrations by 27.82%, 35.14%, and 53.31%, respectively, compared to the control (Figure 4B). In turn, after 48 h, a 38.98%, 73.54%, and 30.04% increase in the level of LDH was observed at the same concentration of Les-4370, i.e., 10 µM, 50 µM, and 100 µM, respectively, compared to the control (Figure 4B).
After the 24 h treatment of the CACO-2 cells with Les-4368, the level of LDH at the 10 µM, 50 µM, and 100 µM concentrations increased by 11.85%, 36.49%, and 38.08%, respectively, compared to the control (Figure 4C). In turn, the CACO-2 cells treated with 50 µM and 100 µM of Les-4368 were characterized by a 34.86 and 36.45% increase in this parameter, respectively, compared to the control (Figure 4C).
A 23.53% increase in the LDH release level in the Les-4370-treated CACO-2 cells was observed only after 24 h in the 100 µM concentration variant, compared to the control (Figure 4D).
Based on data from the released LDH level, the half-maximal lethal dose (LD50) was calculated (Table 1).

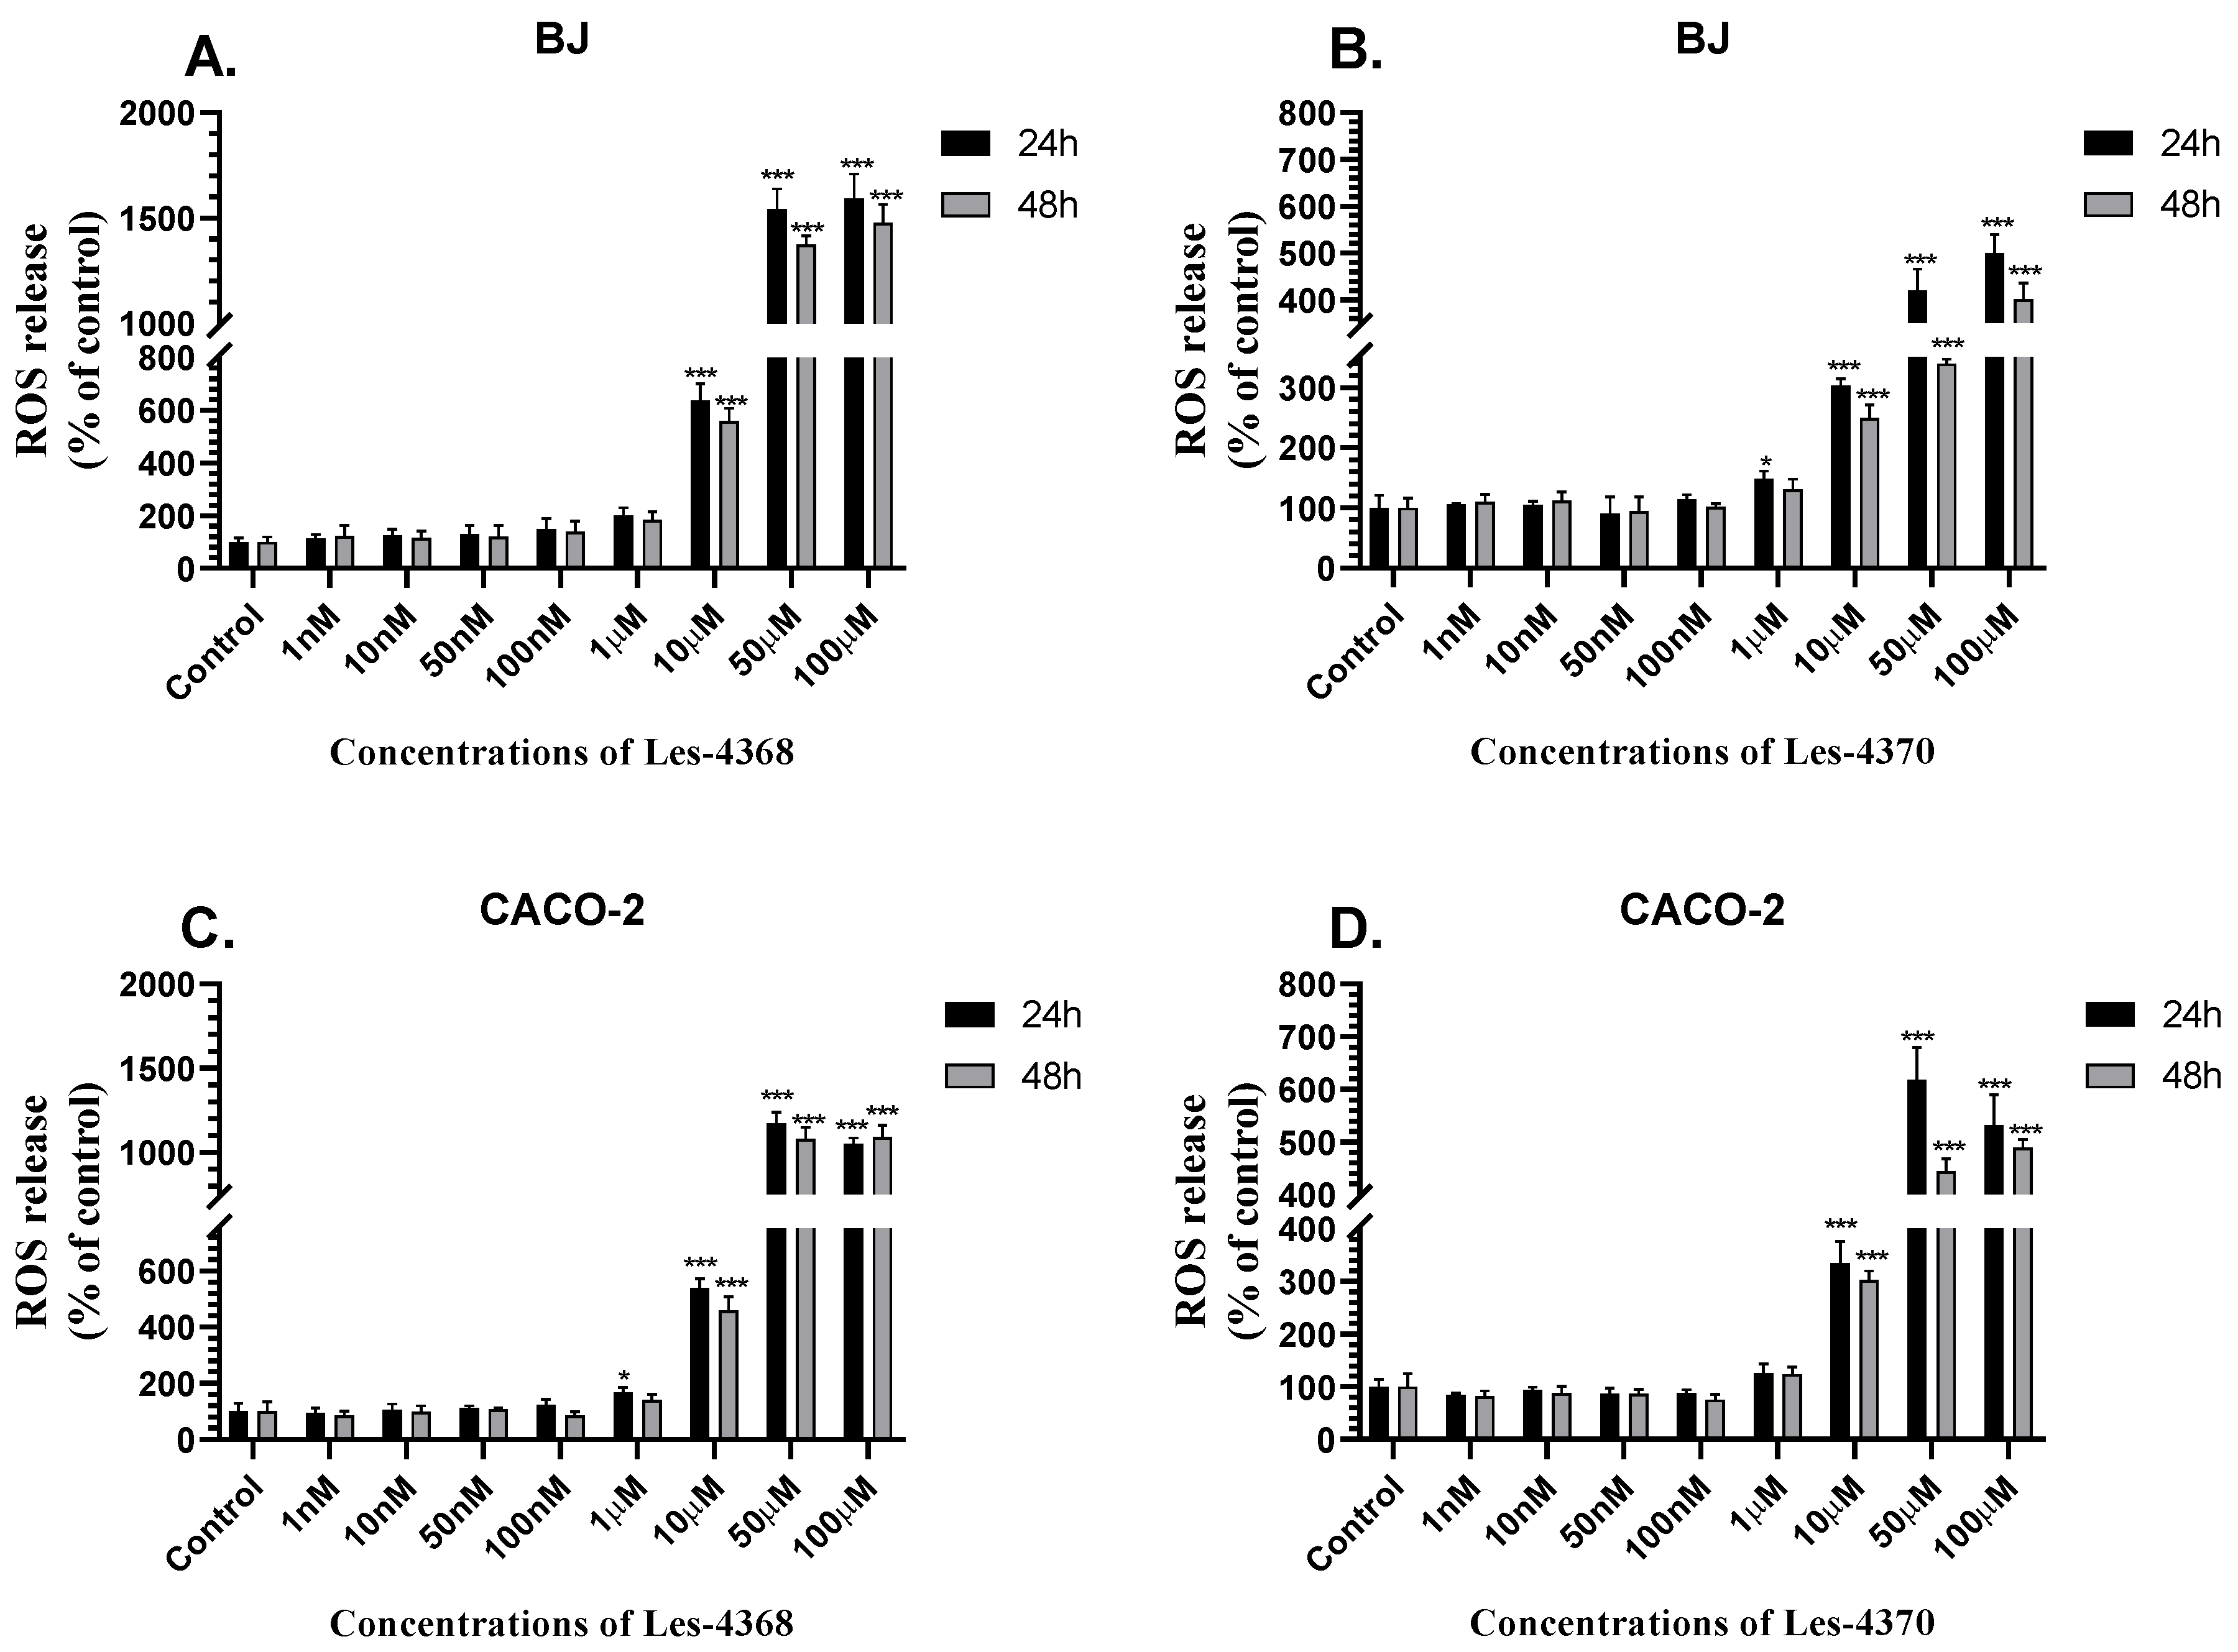
3.3. Intracellular ROS Level

To measure ROS levels, the H2DCFDA dye was selected. The increase in fluorescence of the H2DCF-DA probe in the cell is proportional to the amount of ROS, which may correlate with some types of cell death and/or metabolic processes. After 24 h, a 535.83%, 1442.81%, and 1492.25% increase in the ROS level was observed in the BJ cells treated with 10 µM, 50 µM, and 100 µM concentrations of Les-4368, respectively, compared to the control (Figure 5A). Similarly, after the 48 h treatment of the cells with 10 µM, 50 µM, and 100 µM of Les-4368, the ROS level increased by 458.74%, 1274.34%, and 1375.7%, respectively, compared to the control (Figure 5A).
The 24 h exposure of the BJ cells to 1 µM, 10 µM, 50 µM, and 100 µM of Les-4370 increased the ROS level by 48.61%, 202.79%, 319.97%, and 399.47%, compared to the control (Figure 5B). In turn, the 48 h treatment of the BJ cells to 10 µM, 50 µM, and 100 µM of Les-4370 caused a 149.15%, 239.53%, and 301.18% increase in the ROS level, respectively, compared to the control (Figure 5B).
After the 24 h exposure of the CACO-2 cells to Les-4368 at the concentrations of 1 µM, 10 µM, 50 µM, and 100 µM, the ROS level increased by 68.19%, 440.31%, 1074.63%, and 951.48%, respectively, compared to the control (Figure 5C). The 48 h exposure of the CACO-2 cells to Les-4368 at the concentrations of 10 µM, 50 µM, and 100 µM resulted in a 358.41%, 978.88%, and 990.55% increase in the ROS level, respectively, compared to the control (Figure 5C).
After the 24 h exposure of the CACO-2 cells to Les-4370, a 233.94%, 518.20%, and 431.86% increase in the ROS level was observed at the concentrations of 10 µM, 50 µM, and 100 µM, respectively, compared to the control (Figure 5D). In turn, after the 48 h treatment of the cells with the tested compound, a similar increase in the ROS level, i.e., by 202.12%, 344.68%, and 388.86%, was observed at the concentrations of 10 µM, 50 µM, and 100 µM, respectively, compared to the control (Figure 5D).

3.4. Caspase-3 Activity

Caspase-3 is a recognized marker of the apoptosis process. Therefore, the caspase-3 activity assay was used to determine whether the tested compounds activated this process. After the 24 h treatment of the BJ cells with Les-4368, an increase in the caspase-3 activity (by 93.87%) was observed only at the 100 µM concentration of this compound, compared to the control (Figure 6A). In turn, after the 48 h treatment of the BJ cells with Les-4368, the caspase-3 activity was increased by 29.34% and 191.01% in the 50 µM and 100 µM concentration variants, respectively, compared to the control (Figure 6A).
In the BJ cell line, the 24 h treatment with 100 µM of Les-4370 caused a 13.70% increase in the caspase-3 activity, compared to the control (Figure 6B). In turn, after the 48 h exposure of the BJ cells to Les-4370 in the concentration range of 10 µM, 50 µM, and 100 µM the caspase-3 activity increased by 7.49%, 22.79%, and 18.41%, respectively, compared to the control (Figure 6B).
After the 24 h exposure of the CACO-2 cells to Les-4368, a 23.10% and 51.12% increase in the caspase-3 activity was observed at the concentrations of 50 µM and 100 µM, respectively, compared to the control (Figure 6C). The activity of caspase-3 increased by 9.53% after the 48 h treatment of the CACO-2 cells with 100 µM of Les-4368, compared to the control (Figure 6C).
After the 24 h treatment of the CACO-2 cells with Les-4370, a 22.11% and 21.83% increase in the caspase-3 activity was observed at the 50 µM and 100 µM concentrations, respectively, compared to the control (Figure 6D). Similarly, the cells treated with the same concentrations of Les-4370 for 48 h were characterized by a 9.20% and 13.59% increase in the caspase-3 activity, respectively, compared to the control (Figure 6D).

3.5. Cell Viability and Apoptotic Body Formation Staining

Rhodamine-B was used to visualize the cell morphology while Hoechst 33342 dye was used to visualize DNA in the nucleus. The obtained results show that after 24 h of exposure, the cell morphology was changed only in 50 µM of Les-4368 and 50 µM of Les-4370 concentrations, as well as in the positive control (group treated with STS) (Figure 7). Our data confirmed that after 24 h of exposure, the BJ cells to Les-4368 in 1 µM concentration DNA condensation was not observed. On the other hand, in groups exposed to 10 and 50 µM of Les-4368 the DNA fragmentation and condensation was detected, similar to those observed in STS-treated cells (Figure 7). In the same time interval, no changes in the DNA condensation were observed in cells exposed to 1, 10, or 50 µM of Les-4370 (Figure 7).
In case of CACO-2 cell line, after 24 h of exposure, the cell morphology was changed only after treatment with 50 µM of Les-4368 and 50 µM of Les-4370 concentrations, as well as in the positive control group (STS) (Figure 8). Our data showed that after 24 h of exposure, the CACO-2 cell line to Les-4368 in 1 µM concentration, the DNA condensation was not observed. On the other hand, the cells exposed to 10 and 50 µM of Les-4368 were characterized by a DNA fragmentation and condensation, which was similar to the STS-treated cells (Figure 8). Similarly to the BJ cell line, the CACO-2 cells treated with any concentration of Les-4370 did not cause any changes in DNA condensation or fragmentation (Figure 8).

3.6. mRNA Expression of the PPARγ, AhR, PXR, and NF-κB Genes

After the treatment of the BJ cells with Les-4368, Les-4370, and rosiglitazone, the PPARγ mRNA expression decreased by 10.84%, 21.54%, and 21.93%, respectively, compared to the control (Figure 9A). In turn, the expression of this gene in the CACO-2 cells treated with Les-4368, Les-4370, and rosiglitazone was decreased by 78.40%, 10.95%, and 27.03%, respectively, compared to control (Figure 9A).
The AhR mRNA expression in the Les-4370-treated cells was decreased by 31.12%, compared to the control, while a 20.37% increase was observed in the rosiglitazone-treated cells, compared to the control (Figure 9B). In turn, the Les-4368-, Les-4370-, and rosiglitazone-treated CACO-2 cells exhibited a 237.63%, 35.07%, and 16.36% increase in this parameter, respectively, compared to control (Figure 9B).
Additionally, the exposure of the BJ cells to Les-4368 caused a 35.07% increase in the PXR gene expression, compared to the control (Figure 9C), whereas a 36.61% increase in the AhR mRNA expression was observed in the rosiglitazone-treated cells, compared to the control (Figure 7C). In turn, only the CACO-2 cells treated with Les-4368 were characterized by a decrease (by 31.24%) in the PXR gene expression, compared to the control (Figure 9C).
Lastly, the BJ cells treated with Les-4370 were characterized by a 23.47% increase in the NF-κB mRNA expression, compared to the control. The rosiglitazone treatment caused a 21.86% increase in the expression of this gene, compared to the control (Figure 9D). In turn, the CACO-2 cells treated with Les-4368 were characterized by a 48.58% increase in the NF-κB gene expression, compared to the control, while reduced expression of this gene was observed in the Les-4370- and rosiglitazone-treated cells (by 22.06% and 6.43%, respectively), compared to the control (Figure 9D).

3.7. AhR and PPARγ Protein Level

After the 24 h exposure of the BJ cells with GW9662, a 15.71% increase in the AhR protein expression was observed, compared to the control (Figure 10A). The other compounds, i.e., Les-4368, Les-4368 combined with GW9662, and Les-4370, reduced the AhR protein expression by 34.68%, 53.98%, and 14.48% respectively, compared to the control (Figure 10A). Additionally, the cell co-treatment with GW9662 and Les-4368 decreased the AhR protein expression by 19.03%, compared to the Les-4368-treated cells (Figure 10A).
The BJ cells exposed to GW9662, Les-4368 combined with GW9662, Les-4370, and Les-4370 combined with GW9662 for 24 h were characterized by a 45.97%, 35.68%, 57.12%, and 94.24% decrease in the PPARγ protein expression, respectively, compared to the control (Figure 10B). In contrast, Les-4368 caused a 78.38% increase in the PPARγ protein expression in the BJ cells, compared to the control (Figure 10B). Interestingly, a significantly different effect of Les-4368 was observed (a 114.06% increase) compared to the cells co-treated with Les-4368 and GW9662 (Figure 10B). Additionally, the cell co-treatment with GW9662 and Les-4370 decreased the PPARγ protein expression by 37.12%, compared to the Les-4370-alone-treated cells (Figure 10B).
After 24 h, the AhR protein expression was increased by 33.87% in the rosiglitazone-treated CACO-2 cells, compared to the control (Figure 10C). In turn, the cells treated with Les-4368 and GW9662 were characterized by an 18.10% decrease in the AhR protein expression, compared to control (Figure 10C).
After the exposure of the CACO-2 cells to GW9662 for 24 h, the PPARγ protein expression decreased by 45.55%, compared to the control (Figure 10D). Similarly, Les-4370 and rosiglitazone induced a 51.75% and 85.20% decrease in the PPARγ protein expression, respectively, compared to the control (Figure 10D). Additionally, the Les-4368-treated cells exhibited an 8.97% increase in this protein expression, compared to the control (Figure 10D). Interestingly, a significantly different effect of Les-4368 was observed (a 20.77% increase), compared to the cells co-treated with Les-4368 and GW9662 (Figure 10D). Additionally, the cells co-treatment with GW9662 and Les-4370 decreased the PPARγ protein expression by 31.28%, compared to the Les-4370-treated cells (Figure 10D).

3.8. Molecular Docking Simulations

The docking simulations were performed to explore the interaction of Les-4368 and Les-4370 with the PPARγ and AhR receptors (Table 2). The docking studies revealed high binding energies of Les-4368 and Les-4370 to PPARγ receptors during in silico simulations, which were slightly higher than that of rosiglitazone. However, the docking scores are lower than for the reference CID 136264026. Les-4368 binds to Ser289 via a hydrogen bond with a length 3.37 Å. Three phenyl cores of the molecule are suited to the pockets formed by different aliphatic amino acids and interplay with them through Pi-sigma, Pi-Sulfur, Pi-Pi T-shaped, and Pi alkyl hydrophobic non-covalent interactions (Figure 11). Unfortunately, as indicated by the obtained binding mode, Les-4368 does not exert any influence on Tyr473, which is significant for activation of PPARγ [40].
Les-4370 interacts with PPARγ without any hydrogen bond. The molecule forms a different type of non-covalent interactions (Pi-sigma, Pi-Sulfur, Pi-Pi T-shaped, and Pi alkyl) with lipophilic amino acids Leu330, Ile326, Met364, Phe283, Leu453, and others. The number of amino acids involved in the interaction with the receptors is lower compared to Les-4368-PPARγ. Such a decrease resulted in the lower binding energy of the whole complex. Therefore, the docking simulation confirmed the better activity profile of Les-4368 compared to Les-4370 (Figure 12).
The simulation with the model of AhR receptors revealed drastically lower docking scores, compared to the co-crystallized ligand indirubin. Consequently, the influence of Les-4368 and Les-4370 on the AhR protein expression cannot be explained by straight interactions with the receptors.

4. Discussion

In our experiments, Les-4368 in the 10–100 µM concentration range induced a decrease in resazurin reduction in both studied (CACO-2 and BJ) cell lines in a similar way. Similarly, Les-4370 also decreased resazurin reduction in both studied cell lines but only when applied at the highest µM concentration. The toxicity of Les-4368 was confirmed by the increase in LDH release in both studied cell lines exposed to the 10–100 µM concentrations of the compound (Figure 13). Interestingly, an increase in LDH after the treatment of CACO-2 cells with Les-4370 was observed only at the concentration of 50 µM, while an increase in LDH release in the BJ cell line was observed in the 50 nM and 100 µM concentration variants. Les-4370 decreased the resazurin reduction less than Les-4368, which may suggest that despite the toxicity of Les-4370, metabolism and/or cell number were not significantly reduced. This was confirmed by calculating LD50 and IC50 for both compounds and tested cell lines. Therefore, we conclude that the Les-4368 compound is more toxic in both cell lines than Les-4370. The experiments conducted by Bar et al. demonstrated an increase in LDH release in BJ cells after exposure to ethyl rel-[(5aR,11bR)-10-bromo-2-oxo-5a,11b-dihydro-2H,5H-chromeno[42-oxo-5a,11b-dihydro-2lld][1,3]thiazol-3(6H)-yl] acetate (Les-2769) (50–100 µM) and Les-3266 (10–100 µM) [10]. However, in the SCC-15 line, Les-3266 and Les-2769 induced LDH release at high micromolar concentrations of 10–100 µM (Les-3266) and 100 µM (Les-2769) [10]. To date, an increase in LDH release by 4-TZD derivatives has been observed in healthy BJ cells exposed to Les-236 (10–100 µM) [12]. In the same research, it was noted that Les-236 was significantly more toxic and caused LDH release in SCC-15 cells at concentrations of 1–100 µM when compared to normal cells [12]. In studies of SCC-15 cells treated with Les-2194, Les-3640, and 5,10-dihydro-2H-benzo[6,7]thiochromeno[2,3-d][1,3]thiazole-2,5,10-trione (Les-3377) at the concentration range from 1 nM to 100 µM, an increase in LDH release was observed when the cells were exposed to these compounds at the higher concentrations of 10–100 µM [9]. Skóra et al. showed that all tested compounds (2-{2-[3-(benzothiazol-2-ylamino)-4-oxo-2-thioxothiazolidin-5-ylidenemethyl]-4-chlorophenoxy}-N-(4-methoxyphenyl)-acetamide) (Les-3166), 7-oxa-10-thia-8-aza-cyclopenta[b]phenanthren-9-one (Les-5935), Les-6009, and Les-6166 used at a concentration from 10 to 100 µM were able to reduce metabolic activity in BJ, SH-SY5Y, and A549 cell lines [11]. Moreover, it has been proved that Les-2769 and Les-3266 also decreased metabolic activity in SCC-15 and BJ cell lines [10]. Similarly, Szychowski et al. reported that Les-2194, Les-3640, Les-5935, and Les-6166 decreased resazurin reduction in the 3T3-L1 cell line. When the 3T3-L1 cells were exposed to Les-2194, Les-3640, Les-5935, or Les-6166 at the concentrations of 100 nM, 1 μM, 10 μM, 50 μM, and 100 μM, it was observed that 100 μM Les-2194 and Les-3640 induced a decrease in resazurin reduction [33]. Finiuk et al. proved the effectiveness of a 4-thiazolidinone derivative 5-bromo-3-{2-[5-(4-methoxyphenyl)-3-naphthalen-2-yl-4,5-dihydropyrazol-1-yl]-4-oxo-4,5-dihydro-1,3-thiazol-5-ylidene}-2,3-dihydro-1H-indol-2-one(Les-3833) against human melanoma (WM793) cells. In melanoma cells, Les-3833 induced apoptosis through morphological changes and an increase in the amount of pro-apoptotic proteins, ROS production, and arrest of the G0/G1 phase of the cell cycle [41].
It is known that apoptosis is often caused by a high increase in ROS production [42]. To date, ROS-induced caspase-3 activity has been well described [43]. Therefore, in the next part of our study, we decided to study these parameters. Our experiments proved that both studied compounds (Les-4368 and Les-4370) in both studied cell lines (CACO-2 and BJ) increased ROS production in the 10–100 µM concentration range. However, Les-4368 was a much stronger inducer of ROS production than Les-4370. In the case of caspase-3 activity, both studied compounds in both studied cell lines increased the caspase only at the highest (50 and 100) µM concentrations. The proapoptotic role of caspase-3 in our experiments was confirmed inter alia by Hoechst 33342-based staining in which the DNA fragmentation and condensation were observed in 10 and 50 µM concentrations of Les-4368 in both studied cell lines. The obtained data also suggest that in lower concentrations, the caspase-3 is not involved, or the caspase-3 activity assay is not able to detect slight changes in its activity. Interestingly, in the case of Les-4370, no significant DNA condensation or fragmentation was observed. Our results suggest that increased caspase-3 activity in the case of Les-4370 is involved in a nonapoptotic role of this enzyme. Moreover, in our study compound, Les-4368 activated caspase-3 much more strongly than Les-4360. However, in the case of CACO-2 cells treated by Les-4368 compound after 48 h, caspase-3 activity was almost unchanged. The mentioned phenomenon is most likely the result of the very strong toxicity of Les-3468 and proteolytic degradation of caspase-3 [44]. Skóra et al. revealed that Les-3166 increased ROS production in BJ cells after a 6 h treatment in a concentration range from 1 nM to 10 µM, compared to the control [11]. Moreover, a similar trend was shown by the same team in studies on A549 cells treated with Les-3166. Treatment of cells with Les-3166 in a concentration range from 1 nM to 100 µM for 6 h has also been shown to increase ROS [11]. Similarly, Szychowski et al. showed that 6 h exposure of the SCC-15 cell line to Les-2194, Les-3377, and Les-3640 in a wide (10 nM to 100 µM) range of concentrations increased ROS production, but caspase-3 activity increases only at the highest (50 and 100) µM concentrations [9]. Additionally, Szychowski et al. reported that Les-3640 and Les-6166 in concentrations of 50 and 100 µM caused an increase in caspase-3 activity after 24 and 48 h of exposure in the 3T3-L1 cell line [27]. On the other hand, it is interesting that Les-236 in µM concentrations decreased ROS production in the BJ, CACO-2, SCC-15, A549, and SH-SY5Y cell lines [12]. However, despite the absence of ROS, increased caspase-3 activity was observed [12]. Compounds Les-2769 and Les-3266 also increased caspase-3 activity in the BJ and SCC-15 cell lines when used at the highest (50–100) µM concentrations [10]. Finally, it was established that increasing the dose of another 4-thiazolidinone derivative Les-3288 (5-bromo-3-{2-[5-(4-methoxyphenyl)-3-phenyl-4,5-dihydropyrazol-1-yl]-4-oxo-4,5-dihydro-1,3-thiazol-5-ylidene}-2,3-dihydro-1H-indol-2-one) from 0.5 to 1.0 µg/mL led to an increase in the amount of cleaved caspase-3 in treated U251 glioma cells [45]. It is worth mentioning that despite the classic role of caspase-3, this enzyme is also involved in the regulation of cell survival, proliferation, and tumorigenesis [44,46]. However, summarizing the data on LDH release, resazurin reduction, and ROS production, we believe that caspase-3 activity in our case is the result of apoptotic cell death.
It has been well described that, despite apoptosis activation, ROSs play an important role in PPARγ-related signaling pathways and cell cycle regulation [47]. It is also known that AhR is involved in the response to oxidative stress through different mechanisms [48]. Moreover, AhR signaling may promote the activation of nuclear factor kappa-light-chain-enhancer of activated B cells (NF-κB), whose pathway acts in an antagonist way to the PPARγ pathway [48]. Our study showed that the expression of AhR and NF-κB mRNA increased after the treatment of the BJ cells with rosiglitazone, but at the same time, the level of NF-κB expression decreased in the group exposed to Les-4370. In the CACO-2 cell line, an increase in the level of AhR mRNA expression was observed after the treatment of the cells with Les-4368, Les-4370, and rosiglitazone, while the level of NF-κB expression in the CACO-2 cells decreased after the treatment with Les-4370 and rosiglitazone. Similar results were obtained by Kosińska et al. who described a decrease in AhR protein expression after BJ cell treatment with (Z)-5-[5-(4-chlorophenyl)-3-phenyl-4,5-dihydropyrazol-1-ylmethylene]-3-(3-acetoxyphenyl)-2-thioxo-thiazolidin-4-ones (Les-4369) and (5′Z)-3′-(4-chlorophenyl)-5′-[(4-isopropylphenyl)methy-lene]spiro[indoline-3,2′-thiazolidine]-2,4′-dione (Les-3467). While Les-4369 and Les-3467 increase in AhR protein expression in the A549 cell line [49], studies conducted by Bar et al. showed that Les-2769 and Les-3266 increased the expression of NF-κB mRNA in healthy BJ cells and SCC-15 tumor cells [10]. Szychowski et al. proved that after 14 days of differentiation of rosiglitazone-induced 3T3-L1 cells, there was an increase in the level of NF-κB compared to controls [50]. Moreover, Szlachcikowska et al. showed that similar to our experiments ciminalum–thiazolidinone hybrid molecules 3-{5-[(Z,2Z)-2- chloro-3-(4-nitrophenyl)-2-propenylidene]-4-oxo-2-thioxothiazolidin-3-yl}propanoic acid (Les-45) and 5-[2-chloro-3-(4-nitrophenyl)-2-propenylidene]-2-(3-hydroxyphenyla-mino)thiazol-4(5H)-one (Les-247) decrease in NF-κB protein expression in BJ cells [51]. Our study showed a statistically significant increase in the level of NF-κB mRNA expression as a result of the treatment of the BJ cells with rosiglitazone. Les-4368 caused an increase in the NF-κB expression in the CACO-2 cells, and rosiglitazone and Les-4370 decreased the NF-κB expression. Neri et al. showed that an increase in NF-κB activation by microparticles (MPs) in A549 was inhibited by PPARγ agonists, including rosiglitazone [52]. Moreover, by interacting with NF-κB, PPARγ may have a pro-apoptotic effect [53]. A study conducted by Zhou et al. showed that rosiglitazone inhibited the NF-κB signaling pathway in mouse mononuclear macrophage leukemia cells (RAW264.7) treated with lipopolysaccharide (LPS). The activity of the NF-κB-driven luciferase reporter gene was significantly elevated after LPS induction [54].
Our study has shown that for the treatment of normal BJ and CACO-2 cancer cells, Les-4368, Les-4370, and rosiglitazone resulted in a decrease in PPARγ mRNA expression. Szychowski et al. showed a decrease in the expression of PPARγ mRNA in SCC-15 and CACO-2 cell lines after exposure to 1 µM Les-236 [12]. Interestingly, Szychowski et al. reported that 10 µM Les-2194, Les-3377, or Les-3640 decreased PPARγ mRNA expression in the SCC-15 cell line [17]. We showed in the present study that, after 24 h, the PPARγ protein levels were decreased by the treatment of both BJ and CACO-2 cells with the antagonist (GW9662), the agonist (rosiglitazone), and Les-4370. In the co-treatment of the BJ and CACO-2 cells with Les-4370 and GW9662, a decrease in the PPARγ protein levels was observed. The same decrease was observed in Les-4368 and GW9662 co-treatment. Only Les-4368 increased the PPARγ protein expression in both tested cell lines. Szychowski et al. demonstrated that after a 48 h exposure of the BJ cell line to 1 µM Les-236, both rosiglitazone and GW9662 PPARγ reduced the expression of the PPARγ protein in these cells [12]. In the CACO-2 cells, rosiglitazone increased the PPARγ expression, whereas a decrease in the PPARγ expression was produced by GW9662. Les-236 prevented the decrease in the PPARγ protein expression caused by GW9662 [12]. This may confirm that Les-4368 may have an agonist-like effect.
As a nuclear receptor, the pregnane x receptor (PXR) plays an important role in drug metabolism, regulation of inflammatory reactions, and glucose metabolism and also protects normal cells against carcinogenesis [55]. The literature suggests a close inverse correlation between PXR and NF-κB [56]. Activation of NF-κB inhibits PXR function, causing reduced expression of its target genes, while inhibition of NF-κB increases PXR activity and expression of target genes [56,57].
In our study, we showed that Les-4368 caused a decrease in PXR mRNA expression with a simultaneous increase in NF-κB in the CACO-2 cells. As shown by the literature data, PXR activated by rifampicin is rate-limiting for NF-κB activation. This relationship was observed in colonic epithelial cells [58]. Moreover, as demonstrated by in vitro preclinical models of intestinal inflammation, including intestinal organoids, genetic inactivation of PXR unleashes NF-κB-dependent signal transduction, while conversely NF-κB signaling decreases PXR expression levels [58]. Studies conducted by Deuring et al. have shown that PXR is the major and clinically relevant antagonist of NF-κB activity in the intestinal epithelial compartment during inflammatory bowel disease [58]. This may confirm that Les-4368 may act through interaction with the PXR/NF-κB pathways.

5. Conclusions

Our study is the first to analyze the impact of Les-4368 and Les-4370 on CACO-2 and BJ cell lines in vitro. The present data show that both compounds (Les-4368 and Les-4370) in both cell lines (CACO-2 and BJ) induce toxicity in a similar range of concentrations. However, a stronger toxic response as well as ROS production was induced by Les-4368 in both cell lines. The expression patterns of PPARγ and AhR mRNA and protein as well as NF-κB and PXR mRNAs after the treatment of the CACO-2 and BJ cell lines with Les-4368 and Les-4370 and the tool-compounds suggest that Les-4368 and Les-4370 interact with PPARγ and/or AhR receptors. However, we cannot exclude that other molecular pathways are also involved in the Les-4368 and Les-4370 mechanism of action. Unfortunately, in our study, the cytotoxic effect of the tested compounds on BJ and CACO-2 cells was shown by the higher doses in the range of 10–100 µM, which may limit their therapeutic use. Moreover, due to the low selectivity of the tested compounds and high toxicity in the case of normal cells confirmed by LD50, the clinical use of the tested compounds may also be limited. Therefore, it is important for future research to thoroughly study the effect of lower concentrations of these compounds on healthy and cancer cells.

Author Contributions

Conceptualization, E.K., K.A.S. and R.L.; data curation, E.K.; formal analysis, E.K.; funding acquisition, K.A.S. and A.T.-Ł.; investigation, E.K.; methodology, A.T.-Ł., S.H., D.K., R.L. and E.K.; visualization, E.K.; writing—original draft, E.K., S.H. and B.S.; writing—review and editing, E.K., B.S, A.T.-Ł., R.L. and K.A.S. All authors have read and agreed to the published version of the manuscript.

Funding

This study was supported by statutory funds of the University of Information Technology and Management in Rzeszow, Poland (DS: 503-07-01-27 and DS: 503-07-01-59). The synthetic research leading to these results has received funding from the Ministry of Health of Ukraine under the project number 0121U100690. The authors would like to thank all the brave defenders of Ukraine who made the finalization of this article possible.

Institutional Review Board Statement

Not applicable.

Informed Consent Statement

Not applicable.

Data Availability Statement

The raw data supporting the conclusions of this article will be made available by the authors on request.

Acknowledgments

The authors would like also to thank Dominika Szlachcikowska for her assistance.

Conflicts of Interest

The authors declare no conflicts of interest.

Abbreviations

3T3-L1—mouse embryonic fibroblast cell line; 4-TZD—4-thiazolidinones; A549—epithelial lung carcinoma cell lines; AhR—aryl hydrocarbon receptor; BJ—human skin fibroblast cell line; CACO-2—human adenocarcinoma cell line; CRC—colorectal cancer; DMEM—Dulbecco’s Modified Eagle Medium; FBS—fetal bovine serum; GW9662—2-chloro-5-nitro-N-phenylbenzamide; H2DCF-DA—2′,7′-dichlorodihydrofluorescein diacetate; LDH—lactate dehydrogenase; Les-2194—rel-N-(2,4-dichlorophenyl)-2-[(5aR,11bR)-2-oxo-5a,11b-dihydro-2H,5H-chromeno[4′,3′:4,5]thiopyrano[2,3-d][1,3]thiazol-3(6H)-yl]acetamide; Les-236—5Z-(4-fluorobenzylidene)-2-(4-hydroxyphenylamino)-thiazol-4-one; Les-2769—ethyl rel-[(5aR,11bR)-10-bromo-2-oxo-5a,11b-dihydro-2H,5H-chromeno[42-oxo-5a,11b-dirano[2,3-d][1,3]thiazol-3(6H)-yl] acetate; Les-3166—(2-{2-[3-(benzothiazol-2-ylamino)-4-oxo-2-thioxothiazolidin-5-ylidenemethyl]-4-chlorophenoxy}-N-(4-methoxyphenyl)-acetamide); Les-3266—7,8-dimethoxy-1-oxo-1H-isothiochromene-3-carboxylic acid (4-phenylthiazol-2-yl)-amide; Les-3640—3-{2-[5-(4-dimethylaminophenyl)-3-phenyl-4,5-dihydropyrazol-1-yl]-4-oxo-4,5-dihydro-1,3-thiazol-5-ylidene}-2,3-dihydro-1H-indol-2-one; Les-4368—(Z)-5-[5-(2-hydroxyphenyl)-3-phenyl-4,5-dihydropyrazol-1-ylmethylene]-3-(3-acetoxyphenyl)-2-thioxothiazolidin-4-one; Les-4370—(Z)-5-[5-(4-dimethylaminophenyl)-3-phenyl-4,5-dihydropyrazol-1-ylmethylene]-3-(3-acetoxyphenyl)-2-thioxothiazolidin-4-one; Les-5935—7-oxa-10-thia-8-aza-cyclopenta[b]phenanthren-9-one; Les-5935—(9H-benzo[5,6]chromeno[2,3-d][1,3]thiazol-9-one); Les-6009—5-fluoro-3-(4-oxo-2-thioxothiazolidin-5-ylidenemethyl)-1H-indole-2-carboxylic acid methyl ester; Les-6166—methyl 5-fluoro-3-[2-(4-hydroxyanilino)-4-oxo-4,5-dihydro-1,3-thiazol-5-ylidenmethyl]-1H-2-indolecarboxylate; Les-3288—5-bromo-3-{2-[5-(4-methoxyphenyl)-3-phenyl-4,5-dihydropyrazol-1-yl]-4-oxo-4,5-dihydro-1,3-thiazol-5-ylidene}-2,3-dihydro-1H-indol-2-one; LPS—lipopolysaccharide; MDR—multidrug resistance; MEM—Minimum Essential Medium; MP—microparticles; mTOR—mammalian target of rapamycin; NF-κB—nuclear factor kappa-light-chain-enhancer of activated B cells; PBS—phosphate-buffered saline; PPARs—peroxisome proliferator-activated receptors; PPARγ—peroxisome proliferator-activated receptor gamma; PXR—pregnane X receptor; RAW264.7—mouse mononuclear macrophage leukemia cells; ROS—reactive oxygen species; SH-SY5Y—neuroblastoma cell line; U251—glioma cell line; WM793—human melanoma cells.

References

  1. Fontana, F.; Anselmi, M.; Limonta, P. Molecular Mechanisms of Cancer Drug Resistance: Emerging Biomarkers and Promising Targets to Overcome Tumor Progression. Cancers 2022, 14, 1614. [Google Scholar] [CrossRef]
  2. Siegel, R.L.; Miller, K.D.; Fuchs, H.E.; Jemal, A. Cancer Statistics, 2022. CA Cancer J. Clin. 2022, 72, 7–33. [Google Scholar] [CrossRef] [PubMed]
  3. Zhang, Y.; Huang, L.; Shi, H.; Chen, H.; Tao, J.; Shen, R.; Wang, T. Ursolic Acid Enhances the Therapeutic Effects of Oxaliplatin in Colorectal Cancer by Inhibition of Drug Resistance. Cancer Sci. 2018, 109, 94. [Google Scholar] [CrossRef]
  4. Debela, D.T.; Muzazu, S.G.; Heraro, K.D.; Ndalama, M.T.; Mesele, B.W.; Haile, D.C.; Kitui, S.K.; Manyazewal, T. New Approaches and Procedures for Cancer Treatment: Current Perspectives. SAGE Open Med. 2021, 9, 205031212110343. [Google Scholar] [CrossRef] [PubMed]
  5. Sung, H.; Ferlay, J.; Siegel, R.L.; Laversanne, M.; Soerjomataram, I.; Jemal, A.; Bray, F. Global Cancer Statistics 2020: GLOBOCAN Estimates of Incidence and Mortality Worldwide for 36 Cancers in 185 Countries. CA Cancer J. Clin. 2021, 71, 209–249. [Google Scholar] [CrossRef] [PubMed]
  6. Bukowski, K.; Kciuk, M.; Kontek, R. Mechanisms of Multidrug Resistance in Cancer Chemotherapy. Int. J. Mol. Sci. 2020, 21, 3233. [Google Scholar] [CrossRef]
  7. Gomtsyan, A. Heterocycles in Drugs and Drug Discovery. Chem. Heterocycl. Compd. 2012, 48, 7–10. [Google Scholar] [CrossRef]
  8. Roszczenko, P.; Holota, S.; Szewczyk, O.K.; Dudchak, R.; Bielawski, K.; Bielawska, A.; Lesyk, R. 4-Thiazolidinone-Bearing Hybrid Molecules in Anticancer Drug Design. Int. J. Mol. Sci. 2022, 23, 13135. [Google Scholar] [CrossRef]
  9. Szychowski, K.A.; Leja, M.L.; Kaminskyy, D.V.; Binduga, U.E.; Pinyazhko, O.R.; Lesyk, R.B.; Gmiński, J. Study of Novel Anticancer 4-Thiazolidinone Derivatives. Chem. Biol. Interact. 2017, 262, 46–56. [Google Scholar] [CrossRef]
  10. Bar, M.; Skóra, B.; Tabęcka-Łonczyńska, A.; Holota, S.; Khyluk, D.; Roman, O.; Lesyk, R.; Szychowski, K.A. New 4-Thiazolidinone-Based Molecules Les-2769 and Les-3266 as Possible PPARγ Modulators. Bioorg. Chem. 2022, 128, 106075. [Google Scholar] [CrossRef]
  11. Skóra, B.; Lewińska, A.; Kryshchyshyn-Dylevych, A.; Kaminskyy, D.; Lesyk, R.; Szychowski, K.A. Evaluation of Anticancer and Antibacterial Activity of Four 4-Thiazolidinone-Based Derivatives. Molecules 2022, 27, 894. [Google Scholar] [CrossRef] [PubMed]
  12. Szychowski, K.A.; Kaminskyy, D.V.; Leja, M.L.; Kryshchyshyn, A.P.; Lesyk, R.B.; Tobiasz, J.; Wnuk, M.; Pomianek, T.; Gmiński, J. Anticancer Properties of 5Z-(4-Fluorobenzylidene)-2-(4-Hydroxyphenylamino)-Thiazol-4-One. Sci. Rep. 2019, 9, 10609. [Google Scholar] [CrossRef]
  13. Jarrar, M.H.; Baranova, A. PPARγ Activation by Thiazolidinediones (TZDs) May Modulate Breast Carcinoma Outcome: The Importance of Interplay with TGFβ Signalling. J. Cell. Mol. Med. 2007, 11, 71. [Google Scholar] [CrossRef] [PubMed]
  14. Kota, B.P.; Huang, T.H.W.; Roufogalis, B.D. An Overview on Biological Mechanisms of PPARs. Pharmacol. Res. 2005, 51, 85–94. [Google Scholar] [CrossRef]
  15. Augimeri, G.; Bonofiglio, D. PPARgamma: A Potential Intrinsic and Extrinsic Molecular Target for Breast Cancer Therapy. Biomedicines 2021, 9, 543. [Google Scholar] [CrossRef]
  16. Kryshchyshyn, A.; Atamanyuk, D.; Lesyk, R. Fused Thiopyrano[2,3-d]Thiazole Derivatives as Potential Anticancer Agents. Sci. Pharm. 2012, 80, 509–530. [Google Scholar] [CrossRef]
  17. Szychowski, K.A.; Leja, M.L.; Kaminskyy, D.V.; Kryshchyshyn, A.P.; Binduga, U.E.; Pinyazhko, O.R.; Lesyk, R.B.; Tobiasz, J.; Gmiński, J. Anticancer Properties of 4-Thiazolidinone Derivatives Depend on Peroxisome Proliferator-Activated Receptor Gamma (PPARγ). Eur. J. Med. Chem. 2017, 141, 162–168. [Google Scholar] [CrossRef] [PubMed]
  18. Rothhammer, V.; Quintana, F.J. The Aryl Hydrocarbon Receptor: An Environmental Sensor Integrating Immune Responses in Health and Disease. Nat. Rev. Immunol. 2019, 19, 184–197. [Google Scholar] [CrossRef] [PubMed]
  19. Guarnieri, T. Aryl Hydrocarbon Receptor Connects Inflammation to Breast Cancer. Int. J. Mol. Sci. 2020, 21, 5264. [Google Scholar] [CrossRef]
  20. Huang, Y.; He, J.; Liang, H.; Hu, K.; Jiang, S.; Yang, L.; Mei, S.; Zhu, X.; Yu, J.; Kijlstra, A.; et al. Aryl Hydrocarbon Receptor Regulates Apoptosis and Inflammation in a Murine Model of Experimental Autoimmune Uveitis. Front. Immunol. 2018, 9, 01713. [Google Scholar] [CrossRef]
  21. Hanahan, D.; Weinberg, R.A. Hallmarks of Cancer: The next Generation. Cell 2011, 144, 646–674. [Google Scholar] [CrossRef] [PubMed]
  22. Sherr, D.H.; Monti, S. The Role of the Aryl Hydrocarbon Receptor in Normal and Malignant B Cell Development. Semin. Immunopathol. 2013, 35, 705–716. [Google Scholar] [CrossRef] [PubMed]
  23. Kim, D.W.; Gazourian, L.; Quadri, S.A.; R Romieu-Mourez, R.; Sherr, D.H.; Sonenshein, G.E. The RelA NF-KappaB Subunit and the Aryl Hydrocarbon Receptor (AhR) Cooperate to Transactivate the c-Myc Promoter in Mammary Cells. Oncogene 2000, 19, 5498–5506. [Google Scholar] [CrossRef] [PubMed]
  24. Lin, P.; Chang, H.; Tsai, W.-T.; Wu, M.-H.; Liao, Y.-S.; Chen, J.-T.; Su, J.-M. Overexpression of Aryl Hydrocarbon Receptor in Human Lung Carcinomas. Toxicol. Pathol. 2003, 31, 22–30. [Google Scholar] [CrossRef]
  25. Chen, J.; Röcken, C.; Klein-Hitpass, L.; Götze, T.; Leodolter, A.; Malfertheiner, P.; Ebert, M.P.A. Microarray Analysis of Gene Expression in Metastatic Gastric Cancer Cells after Incubation with the Methylation Inhibitor 5-Aza-2’-Deoxycytidine. Clin. Exp. Metastasis 2004, 21, 389–397. [Google Scholar] [CrossRef] [PubMed]
  26. Wang, Z.; Snyder, M.; Kenison, J.E.; Yang, K.; Lara, B.; Lydell, E.; Bennani, K.; Novikov, O.; Federico, A.; Monti, S.; et al. How the AHR Became Important in Cancer: The Role of Chronically Active AHR in Cancer Aggression. Int. J. Mol. Sci. 2021, 22, 387. [Google Scholar] [CrossRef]
  27. Dou, H.; Duan, Y.; Zhang, X.; Yu, Q.; Di, Q.; Song, Y.; Li, P.; Gong, Y. Aryl Hydrocarbon Receptor (AhR) Regulates Adipocyte Differentiation by Assembling CRL4B Ubiquitin Ligase to Target PPARγ for Proteasomal Degradation. J. Biol. Chem. 2019, 294, 18504–18515. [Google Scholar] [CrossRef] [PubMed]
  28. Szychowski, K.A.; Skóra, B.; Kryshchyshyn-Dylevych, A.; Kaminskyy, D.; Rybczyńska-Tkaczyk, K.; Lesyk, R.; Gmiński, J. Induction of Cyp450 Enzymes by 4-Thiazolidinone-Based Derivatives in 3T3-L1 Cells in Vitro. Naunyn. Schmiedebergs. Arch. Pharmacol. 2021, 394, 915–927. [Google Scholar] [CrossRef]
  29. Senkiv, J.; Finiuk, N.; Kaminskyy, D.; Havrylyuk, D.; Wojtyra, M.; Kril, I.; Gzella, A.; Stoika, R.; Lesyk, R. 5-Ene-4-Thiazolidinones Induce Apoptosis in Mammalian Leukemia Cells. Eur. J. Med. Chem. 2016, 117, 33–46. [Google Scholar] [CrossRef]
  30. Szychowski, K.A.; Rombel-Bryzek, A.; Dołhańczuk-Śródka, A.; Gmiński, J. Antiproliferative Effect of Elastin-Derived Peptide VGVAPG on SH-SY5Y Neuroblastoma Cells. Neurotox. Res. 2019, 36, 503–514. [Google Scholar] [CrossRef]
  31. Nicholson, D.W.; Ali, A.; Thornberry, N.A.; Vaillancourt, J.P.; Ding, C.K.; Gallant, M.; Gareau, Y.; Griffin, P.R.; Labelle, M.; Lazebnik, Y.A.; et al. Identification and Inhibition of the ICE/CED-3 Protease Necessary for Mammalian Apoptosis. Nature 1995, 376, 37–43. [Google Scholar] [CrossRef] [PubMed]
  32. Skóra, B.; Piechowiak, T.; Szychowski, K.A. Epidermal Growth Factor-Labeled Liposomes as a Way to Target the Toxicity of Silver Nanoparticles into EGFR-Overexpressing Cancer Cells in Vitro. Toxicol. Appl. Pharmacol. 2022, 443, 116009. [Google Scholar] [CrossRef] [PubMed]
  33. Szychowski, K.A.; Skóra, B.; Kryshchyshyn-Dylevych, A.; Kaminskyy, D.; Khyluk, D.; Lesyk, R. 4-Thiazolidinone-Based Derivatives Rosiglitazone and Pioglitazone Affect the Expression of Antioxidant Enzymes in Different Human Cell Lines. Biomed. Pharmacother. 2021, 139, 111684. [Google Scholar] [CrossRef]
  34. Bradford, M.M. A Rapid and Sensitive Method for the Quantitation of Microgram Quantities of Protein Utilizing the Principle of Protein-Dye Binding. Anal. Biochem. 1976, 72, 248–254. [Google Scholar] [CrossRef] [PubMed]
  35. Finiuk, N.; Kaleniuk, E.; Holota, S.; Stoika, R.; Lesyk, R.; Szychowski, K.A. Pyrrolidinedione-Thiazolidinone Hybrid Molecules with Potent Cytotoxic Effect in Squamous Cell Carcinoma SCC-15 Cells. Bioorganic Med. Chem. 2023, 92, 117442. [Google Scholar] [CrossRef] [PubMed]
  36. Eberhardt, J.; Santos-Martins, D.; Tillack, A.F.; Forli, S. AutoDock Vina 1.2.0: New Docking Methods, Expanded Force Field, and Python Bindings. J. Chem. Inf. Model. 2021, 61, 3891–3898. [Google Scholar] [CrossRef]
  37. Yamamoto, K.; Tamura, T.; Nakamura, R.; Hosoe, S.; Matsubara, M.; Nagata, K.; Kodaira, H.; Uemori, T.; Takahashi, Y.; Suzuki, M.; et al. Development of a Novel Class of Peroxisome Proliferator-Activated Receptor (PPAR) Gamma Ligands as an Anticancer Agent with a Unique Binding Mode Based on a Non-Thiazolidinedione Scaffold. Bioorg. Med. Chem. 2019, 27, 115122. [Google Scholar] [CrossRef] [PubMed]
  38. Gruszczyk, J.; Grandvuillemin, L.; Lai-Kee-Him, J.; Paloni, M.; Savva, C.G.; Germain, P.; Grimaldi, M.; Boulahtouf, A.; Kwong, H.-S.; Bous, J.; et al. Cryo-EM Structure of the Agonist-Bound Hsp90-XAP2-AHR Cytosolic Complex. Nat. Commun. 2022, 13, 7010. [Google Scholar] [CrossRef]
  39. Hanwell, M.D.; Curtis, D.E.; Lonie, D.C.; Vandermeersch, T.; Zurek, E.; Hutchison, G.R. Avogadro: An Advanced Semantic Chemical Editor, Visualization, and Analysis Platform. J. Cheminform. 2012, 4, 17. [Google Scholar] [CrossRef]
  40. Einstein, M.; Akiyama, T.E.; Castriota, G.A.; Wang, C.F.; McKeever, B.; Mosley, R.T.; Becker, J.W.; Moller, D.E.; Meinke, P.T.; Wood, H.B.; et al. The Differential Interactions of Peroxisome Proliferator-Activated Receptor γ Ligands with Tyr473 Is a Physical Basis for Their Unique Biological Activities. Mol. Pharmacol. 2008, 73, 62–74. [Google Scholar] [CrossRef] [PubMed]
  41. Finiuk, N.; Boiko, N.; Klyuchivska, O.; Kobylinska, L.; Kril, I.; Zimenkovsky, B.; Lesyk, R.; Stoika, R. 4-Thiazolidinone Derivative Les-3833 Effectively Inhibits Viability of Human Melanoma Cells through Activating Apoptotic Mechanisms. Croat. Med. J. 2017, 58, 129–139. [Google Scholar] [CrossRef] [PubMed]
  42. Shin, D.Y.; Kim, G.Y.; Li, W.; Choi, B.T.; Kim, N.D.; Kang, H.S.; Choi, Y.H. Implication of Intracellular ROS Formation, Caspase-3 Activation and Egr-1 Induction in Platycodon D-Induced Apoptosis of U937 Human Leukemia Cells. Biomed. Pharmacother. 2009, 63, 86–94. [Google Scholar] [CrossRef] [PubMed]
  43. Redza-Dutordoir, M.; Averill-Bates, D.A. Activation of Apoptosis Signalling Pathways by Reactive Oxygen Species. Biochim. Biophys. Acta—Mol. Cell Res. 2016, 1863, 2977–2992. [Google Scholar] [CrossRef]
  44. Eskandari, E.; Eaves, C.J. Paradoxical Roles of Caspase-3 in Regulating Cell Survival, Proliferation, and Tumorigenesis. J. Cell Biol. 2022, 221, e202201159. [Google Scholar] [CrossRef] [PubMed]
  45. Kobylinska, L.I.; Klyuchivska, O.Y.; Grytsyna, I.I.; Finiuk, N.; Panchuk, R.R.; Starykovych, M.O.; Lehka, L.; Lesyk, R.B.; Zimenkovsky, B.S.; Stoika, R.S. Differential Pro-Apoptotic Effects of Synthetic 4-Thiazolidinone Derivative Les-3288, Doxorubicin and Temozolomide in Human Glioma U251 Cells. Croat. Med. J. 2017, 58, 150–159. [Google Scholar] [CrossRef] [PubMed]
  46. Cullen, S.P.; Martin, S.J. Caspase Activation Pathways: Some Recent Progress. Cell Death Differ. 2009, 16, 935–938. [Google Scholar] [CrossRef]
  47. Tickner, J.; Fan, L.M.; Du, J.; Meijles, D.; Li, J.M. Nox2-Derived ROS in PPARγ Signaling and Cell-Cycle Progression of Lung Alveolar Epithelial Cells. Free Radic. Biol. Med. 2011, 51, 763–772. [Google Scholar] [CrossRef]
  48. Grishanova, A.Y.; Perepechaeva, M.L. Aryl Hydrocarbon Receptor in Oxidative Stress as a Double Agent and Its Biological and Therapeutic Significance. Int. J. Mol. Sci. 2022, 23, 6719. [Google Scholar] [CrossRef]
  49. Kosińska, K.; Skóra, B.; Holota, S.; Shepeta, Y.; Tabęcka-Łonczyńska, A.; Lesyk, R.; Szychowski, K.A. Role of 4-Thiazolidinone–Pyrazoline/Indoline Hybrids Les-4369 and Les-3467 in BJ and A549 Cell Lines. Cells 2024, 13, 1007. [Google Scholar] [CrossRef] [PubMed]
  50. Szychowski, K.A.; Skóra, B.; Kryshchyshyn-Dylevych, A.; Kaminskyy, D.; Tobiasz, J.; Lesyk, R.B.; Gmiński, J. 4-Thiazolidinone-Based Derivatives Do Not Affect Differentiation of Mouse Embryo Fibroblasts (3T3-L1 Cell Line) into Adipocytes. Chem. Biol. Interact. 2021, 345, 109538. [Google Scholar] [CrossRef]
  51. Szlachcikowska, D.; Tabęcka-Łonczyńska, A.; Holota, S.; Roman, O.; Shepeta, Y.; Lesyk, R.; Szychowski, K.A. Role of Ciminalum-4-Thiazolidinone Hybrids in Molecular NF-ΚB Dependent Pathways. Int. J. Mol. Sci. 2024, 25, 7329. [Google Scholar] [CrossRef] [PubMed]
  52. Neri, T.; Armani, C.; Pegoli, A.; Cordazzo, C.; Carmazzi, Y.; Brunelleschi, S.; Bardelli, C.; Breschi, M.C.; Paggiaro, P.; Celi, A. Role of NF-ΚB and PPAR-γ in Lung Inflammation Induced by Monocyte-Derived Microparticles. Eur. Respir. J. 2011, 37, 1494–1502. [Google Scholar] [CrossRef] [PubMed]
  53. Chen, F.; Harrison, L.E. Ciglitazone Induces Early Cellular Proliferation and NF-ΚB Transcriptional Activity in Colon Cancer Cells through P65 Phosphorylation. Int. J. Biochem. Cell Biol. 2005, 37, 645–654. [Google Scholar] [CrossRef] [PubMed]
  54. Zhou, J.-P.; Yang, X.-N.; Song, Y.; Zhou, F.; Liu, J.-J.; Hu, Y.-Q.; Chen, L.-G. Rosiglitazone Alleviates Lipopolysaccharide-Induced Inflammation in RAW264.7 Cells via Inhibition of NF-ΚB and in a PPARγ-Dependent Manner. Exp. Ther. Med. 2021, 22, 10175. [Google Scholar] [CrossRef] [PubMed]
  55. Niu, X.; Wu, T.; Li, G.; Gu, X.; Tian, Y.; Cui, H. Insights into the Critical Role of the PXR in Preventing Carcinogenesis and Chemotherapeutic Drug Resistance. Int. J. Biol. Sci. 2022, 18, 742. [Google Scholar] [CrossRef] [PubMed]
  56. Zhou, C.; Tabb, M.M.; Nelson, E.L.; Grün, F.; Verma, S.; Sadatrafiei, A.; Lin, M.; Mallick, S.; Forman, B.M.; Thummel, K.E.; et al. Mutual Repression between Steroid and Xenobiotic Receptor and NF-KappaB Signaling Pathways Links Xenobiotic Metabolism and Inflammation. J. Clin. Investig. 2006, 116, 2280–2289. [Google Scholar] [CrossRef] [PubMed]
  57. Wahli, W. A Gut Feeling of the PXR, PPAR and NF-ΚB Connection. J. Intern. Med. 2008, 263, 613–619. [Google Scholar] [CrossRef] [PubMed]
  58. Jasper Deuring, J.; Li, M.; Cao, W.; Chen, S.; Wang, W.; de Haar, C.; Janneke van der Woude, C.; Peppelenbosch, M. Pregnane X Receptor Activation Constrains Mucosal NF-ΚB Activity in Active Inflammatory Bowel Disease. PLoS ONE 2019, 14, e0221924. [Google Scholar] [CrossRef]
Figure 1. Structures of 4-thiazolidinone-based derivatives mentioned in the present study.
Applsci 14 07692 g001
Figure 2. Synthesis of the Les-4368 and Les-4370 derivatives. Structures of the potential PPARγ-agonist rosiglitazone and PPARγ-antagonist (GW9662) used in the experiments.
Applsci 14 07692 g002
Figure 3. Effects of the increasing concentrations (1 nM–100 µM) of Les-4368 (A,C) and Les-4370 (B,D) on metabolic activity in the BJ cell line (A,B) and the CACO-2 cell line (C,D) after treatment for 24 h and 48 h. Data are expressed as means (n = 6) with standard deviation (SD); data marked with *, **, and *** are statistically different at p < 0.05, p < 0.01, and p < 0.001, respectively, compared to the control.
Applsci 14 07692 g003
Figure 4. Effects of the increasing concentrations (1 nM–100 µM) of Les-4368 (A,C) and Les-4370 (B,D) on the LDH release level in the BJ cell line (A,B) and the CACO-2 cell line (C,D) after treatment for 24 h and 48 h. Data are expressed as means (n = 6) with standard deviation (SD); data marked with *, **, and *** are statistically different at p < 0.05, p < 0.01, and p < 0.001, respectively, compared to the control.
Applsci 14 07692 g004
Figure 5. Effects of the increasing concentrations (1 nM-100 µM) of Les-4368 (A,C) and Les-4370 (B,D) on the intracellular ROS level in the BJ cell line (A,B) and the CACO-2 cell line (C,D) after treatment for 24 h and 48 h. Data are expressed as means (n = 6) with standard deviation (SD); data marked with * and *** are statistically different at p < 0.05, and p < 0.001, respectively, compared to the control.
Applsci 14 07692 g005
Figure 6. Effects of the increasing concentrations (1 nM-100 µM) of Les-4368 (A,C) and Les-4370 (B,D) on caspase-3 activity in the BJ cell line (A,B) and the CACO-2 cell line (C,D) after treatment for 24 h and 48 h. Data are expressed as means (n = 6) with standard deviation (SD); data marked with *, **, and *** are statistically different at p < 0.05, p < 0.01, and p < 0.001, respectively, compared to the control.
Applsci 14 07692 g006
Figure 7. Fluorescence imaging with Hoechst 33342 (H33342, blue) and Rhodamine-B (red) staining of the BJ line cells after the exposure to 1, 10, or 50 µM of Les-4368 and 1, 10, or 50 µM of Les-4370, 100 nM of staurosporine (STS) was used as positive control and negative control cells with vehicle after 24 h treatment. Dashed squares indicate the regions used for the zoom. The additional magnification shows a representative cell nucleus. The 100× magnification was used.
Applsci 14 07692 g007
Figure 8. Fluorescence imaging with Hoechst 33342 (H33342, blue) and Rhodamine-B (red) staining of the CACO-2 line cells after the exposure to 1, 10, or 50 µM of Les-4368 and 1, 10, or 50 µM of Les-4370, 1 µM of staurosporine (STS) was used as positive control and negative control cells with vehicle after 24 h treatment. Dashed squares indicate the regions used for the zoom. The additional magnification shows a representative cell nucleus. The 100× magnification was used.
Applsci 14 07692 g008
Figure 9. mRNA expression of PPARγ (A), AhR (B), PXR (C), and NF-κB (D) in the BJ and CACO-2 cells treated with 10 µM of Les-4368, 10 µM of Les-4370, and 10 µM of rosiglitazone for 6 h. Data are expressed as means (n = 9) with standard deviation (SD); data marked with ** and *** are statistically different at p < 0.01 and p < 0.001, compared to the control. ACTB was used as a reference gene.
Applsci 14 07692 g009
Figure 10. Relative protein expression of AhR and PPARγ in the BJ (A,B) and CACO-2 (C,D) cells treated with 1 µM of GW9662, 10 µM of Les-4368, 10 µM of Les-4370, 10 µM of rosiglitazone alone and in co-treatment for 24 h. Data are expressed as means (n = 3) with standard deviation (SD); data marked with *, and *** are statistically different at p < 0.05, and p < 0.001, respectively, compared to the control. Data marked with # are statistically different between certain groups at p < 0.05.
Applsci 14 07692 g010
Figure 11. Molecular docking of Les-4368 with PPARγ.
Applsci 14 07692 g011
Figure 12. Molecular docking of Les-4370 with PPARγ.
Applsci 14 07692 g012
Figure 13. Summary of the evaluation of the cytotoxic effect and some mechanisms of action of Les-4368 and Les-4370 derivatives and some structure–activity relationships (SARs).
Applsci 14 07692 g013
Table 1. The LD50 values (µM, calculated based on the LDH release level) and IC50 (µM, calculated based on the resazurin reduction results) of Les-4368 and Les-4370 compounds in BJ and CACO-2 cells after 24 h and 48 h treatment. N/A—not applicable (uncalculatable).
Cell LineTested CompoundExposure TimeIC50
( x ¯ ± SD, µM)
LD50
( x ¯ ± SD, µM)
BJLes-436824 h27.82 ± 6.3454.50 ± 9.94
48 h15.46 ± 7.8319.95 ± 5.38
Les-437024 hN/A87.75 ± 4.65
48 hN/A15.82 ± 1.62
CACO-2Les-436824 hN/AN/A
48 h29.58 ± 9.45N/A
Les-437024 hN/AN/A
48 hN/AN/A
Table 2. Autodock Vina docking scores of the compounds.
CompoundsPPARγ (PDB: 6K0T)AhR (PDB: 7ZUB)
Binding Energy ∆G kcal/molBinding Energy ∆G kcal/mol
Les-4368−9.15−3.06
Les-4370−8.791.49
CID 136264026−16.15-
Indirubin-−12.68
Rosiglitazone−8.08-
Disclaimer/Publisher’s Note: The statements, opinions and data contained in all publications are solely those of the individual author(s) and contributor(s) and not of MDPI and/or the editor(s). MDPI and/or the editor(s) disclaim responsibility for any injury to people or property resulting from any ideas, methods, instructions or products referred to in the content.

