Abstract
The noticeable dynamic development of electromobility poses new challenges for the energy industry and users of electric vehicles. One of these challenges is coping with the change in the way we refuel. In the case of electric vehicles, the batteries can also be charged via home electrical installations. The presence of a new, non-linear load with significant power may affect the quality parameters of electricity in this installation and therefore indirectly affect the operation of other loads. In order to investigate the possible impact of the electric vehicle charging process on these parameters, a number of measurements were carried out. This paper presents the results of observing voltage distortions in the installation as a result of the harmonics of the current supplying the AC/DC converter in the vehicle. The test results confirm the compliance of the voltage with the requirements of the standards; however, the large share of current harmonics requires the analysis of the anti-shock protections existing in the installation to ensure that they are effective when currents at higher frequencies flow. The research results may be a guide for designers and users of home electrical installations.
1. Introduction
Carbon emissions are an environmental issue rooted in the release of carbon dioxide (CO2) and other greenhouse gases into the atmosphere as a result of the use of fossil fuels, industrial activities, and various other human-induced activities. These emissions are associated with a range of adverse effects. Therefore, efforts to reduce carbon emissions globally are supported through measures such as transitioning to renewable energy sources, increasing energy efficiency, and promoting sustainable transportation models. Achieving international carbon reduction goals is critically important for effectively combating global warming and environmental changes [1,2].
The transportation sector plays a significant role in carbon emissions worldwide. n particular, the widespread use of internal combustion engine vehicles causes intense consumption of fossil fuels [3]. In this context, efforts to reduce carbon emissions in the transportation sector are of paramount importance. Measures aimed at lowering carbon emissions in transportation include promoting electric and hybrid vehicles, enhancing energy-efficient transportation systems, increasing the use of public transportation, and improving bicycle paths and pedestrian areas. These efforts not only seek to mitigate the environmental impacts of transportation but also aim to contribute to a sustainable transportation future by enhancing energy efficiency [4,5].
Since the early 2000s, increasing environmental concerns and the search for energy independence have increased interest in electric vehicles (EVs) and accelerated technological developments in this field [6,7,8].
EVs currently attract attention not only for their environmental benefits but also for their low operating costs and technological innovations. The automotive industry continues its efforts to invest in EV technology, focusing on developing more efficient battery technologies and enhancing vehicle performance [9].
EVs are seen as a part of the global energy transformation, and with the increasing use of these vehicles, they also create significant impacts on energy storage and distribution systems [10].
EVs operate using an electric motor instead of traditional internal combustion engines. This motor is powered by electricity usually supplied by lithium-ion batteries. The battery stores energy when charged or during braking. This energy is managed by a power control unit and directed to the electric motor to facilitate the vehicle’s movement. EVs have a simpler drivetrain and provide a performance advantage with high torque and lower maintenance costs due to fewer moving parts. These characteristics make EVs attractive in terms of energy efficiency, environmental sustainability, new technologies, and analyses of their use, especially in terms of battery charging and motor controlare currently common research topics [11,12,13,14,15,16,17,18].
The widespread adoption of EVs will bring about both positive and negative effects across various sectors and different layers of society. These effects can be categorized into three main headings: environmental, economic, and grid impacts [19].
EVs offer significant environmental advantages due to their zero-emission driving principle. Unlike internal combustion engine vehicles, these vehicles minimize the release of CO2 and other harmful gases into the atmosphere. This contributes to improving air quality and reducing air pollution in urban areas [20,21]. EVs offer significant economic advantages. The decline in demand for traditional internal combustion engine vehicles may bring new business opportunities for EV manufacturers and their supply chain. On the other hand, the low usage costs of EVs offer various economic advantages to users. The higher energy efficiency of these vehicles compared to internal combustion engine alternatives results in lower energy costs and lowers the cost per kilometer. These advantages make EVs economically attractive, encouraging their adoption as a sustainable transportation solution [22,23]. Finally, the widespread use of EVs and their grid-connected charging may cause a significant increase in energy demand and, accordingly, may cause power quality problems [24,25].
Power quality refers to the convenience of the electrical energy generated, transmitted, and used by an electrical system to the desired standards. Power quality problems typically denote abnormal conditions in electrical systems resulting from unexpected and undesired situations. These problems can manifest in various forms, hindering the proper operation of electronic equipment, causing productivity losses, leading to equipment failures, and even resulting in significant financial losses. Power quality issues can have widespread effects across a range of applications, from industrial facilities to residential use. Therefore, the proper monitoring, protection, and correction of energy systems are of paramount importance [26,27,28].
There are a number of factors that cause power quality problems. These factors are caused by various situations that often occur in energy transmission and distribution systems. Lightning strikes can damage power transmission lines or nearby facilities. In this case, instantaneous voltage increases (transient voltages) occur. When large motors, industrial machines, or large energy loads are put into operation, momentary voltage drops and fluctuations may occur. Faults on the network may cause power transmission lines to be interrupted or voltage fluctuations. Non-linear loads, especially loads with non-linear characteristics such as computers, power electronics, and other electronic devices, can cause harmonic distortions. Capacitive reactors are used to correct the power factor on the grid, but their uncontrolled or incorrect use can lead to harmonic distortions. Transformer failures, breaker failures, or other electrical equipment failures can cause power quality problems. Lack of voltage regulation or improper functioning of regulation devices can lead to voltage fluctuations. Unbalanced distribution of loads on the network can cause voltage drops and fluctuations. Abnormal changes in grid frequency can have adverse effects on equipment in industrial facilities. Planned maintenance work by power companies or unexpected power outages can cause power quality problems [29,30,31].
In addition to other factors, the proliferation of EVs also leads to various power quality issues. In particular, the high electrical demand from charging stations can cause voltage drops and frequency fluctuations in the local grid. Furthermore, harmonic distortions generated during the charging process of EVs can disrupt the sinusoidal waveforms of power systems, potentially causing damage to other electronic devices. Managing these issues is possible through strategies such as implementing power quality improvement solutions and strengthening grid infrastructure. This approach allows for the environmental and operational benefits of EVs to be kept, while enabling more sustainable energy consumption [32,33].
Many people are using “clean” personal means of transport like bicycles, scooters, and bikes which contain electrical batteries as an energy source. Other examples of transportation are EVs and buses. The main differences between these groups are the battery capacity and motor power. Most of these vehicles have individual on-board (e.g., cars) or separate chargers (e.g., scooters, bikes, kick scooters) for charging their batteries. Energy which must be stored in batteries is dependent on the charging process [34,35].
Power quality problems can affect the reliability and performance of electrically powered systems in the transportation industry. Therefore, power quality monitoring and correction measures are crucial to help reduce potential problems. In this context, this article includes a power quality monitoring and correction study regarding harmonics and other power quality problems caused by EV charging.
The main goal of the present study is to analyze the influence of the EV charging process on the quality parameters of electricity, especially generated harmonics. In order to analyze these influences, tests were carried out using different cars (EV and PHEV) and electric scooters.
In the literature, one can find studies directly related to the subject of the article, but they mainly concern the impact of higher-power chargers on the operation of the network, e.g., analysis of energy quality parameters for a 160 kW charger at various load levels [36] and analysis of the presence of harmonics in a 33 kV AC line supplying a charging station near a motorway [37]. One can also find information on the analysis of charging profiles and current parameters for a selected point in the network, e.g., for a town in Canada [38]. This article supplements the available works with an analysis of the possible impact of the charging process on the quality parameters of electricity supplying other loads in the home electrical installation system. This topic seems to be particularly important because due to the smaller dimensions and weight of on-board chargers when compared to off-board ones, it seems significantly more difficult to ensure high operating parameters and compliance with standards regarding the quality of electricity. Among the most important parts are the rectifier and filters, which can influence current harmonics the most.
The structure of the article is as follows: In Section 2, background information about harmonics and a description of the test setup can be found. In Section 3, information about the tests conducted and the results obtained from experimental studies are presented. THD, which is an important parameter in identifying power quality issues, was measured and analyzed for the EV charging process. The final section contains conclusions from the conducted experiments and analyses.
2. Materials and Methods
Distortions caused by the non-linear load are directly related to the charging process of EVs described above. EV charging stations typically represent highly non-linear loads. This is due to the use of power electronic components (such as power converters) during the charging process. These components alter the waveform of the electric current while converting alternating current (AC) to direct current (DC) or changing the DC to a different DC voltage level. This alteration deviates from the ideal sinusoidal wave and produces disturbances known as harmonic distortion [39,40].
Harmonics are signals that are exact multiples of the fundamental frequency and act as unwanted additional frequencies in the electrical system. Voltage asymmetry is the imbalance of voltages between phases in a three-phase system. Single-phase loads, particularly large single-phase EV chargers, are potential sources of voltage asymmetry. Other distortions arising from non-linear loads, including non-sinusoidal residual currents, can cause issues in residential or commercial electrical installations during the charging process. These distortions can decrease the efficiency and reliability of the electrical system, pose safety risks, cause overheating in electrical installations, shorten the lifespan of equipment, and lead to many other power quality problems [41].
In this study, total harmonic distortion (THD) and separate harmonic components were examined. Voltage, current THD, and individual harmonics are important power quality parameters and expresses the percentage of the ratio of harmonic components in electrical signals to components at the fundamental frequency. These harmonic components represent distortions that often affect the operation of electronic devices, causing overheating in systems, energy losses, and malfunctions in electrical equipment [42,43].
Standards have been required to define the limits of and methods for measuring harmonic distortion because of the adverse effects of harmonics and inter-harmonics. When relevant studies were examined, it was seen that various equations were used to calculate and measure THD [44,45,46,47].
THD expression is presented in Equations (1) and (2), which are described by [44].
where is
The generalized THD expression presented in [45] is given in Equation (3) below:
where N is a random number of phase voltage levels (odd or even), and is the k-th switching angle.
Moreover, in [46], THD is defined according to Equation (4):
where is the rms value of the harmonic component with index ℎ, where ℎ represents the order of the harmonic and can take values like 2, 3, 4, etc., and is the maximum harmonic order considered in the measurement or analysis. It specifies the highest order of harmonics that is taken into account. Where is the rms value of the fundamental frequency component, which is the lowest frequency component and generally the main component of the signal.
THDu is also calculated using the Equation (5) [47]:
where Uh represents the amplitude of each harmonic component compared to the fundamental voltage. This is typically expressed as a ratio or percentage. Where U1 is the amplitude (generally expressed as an RMS value) of the fundamental frequency component of the signal, and h is the order of the harmonic.
The main difference between THD and individual harmonics is that THD is a metric used to measure the harmonic performance of a system, device, or circuit. In contrast, individual harmonics are frequency components produced in addition to the main frequency of a signal. It is typically expressed as a percentage and indicates how much the signal is distorted. A low THD value means high signal integrity and less distortion [48,49]. In this study, Equation (6) was used to calculate the THD value:
where THD is the harmonic distortion factor of the supply voltage, is the relative value of the voltage of the fundamental component expressed as a percentage of the supply voltage, and h is the higher harmonic order.
Also, the relative contribution of individual harmonics was analyzed via Equation (7):
It was verified as to whether THD and individual harmonics did not exceed the available levels defined by legal acts [50]. The permissible harmonic content cannot exceed 8%, while individual harmonics cannot exceed the levels shown in Table 1.

Table 1.
Permitted harmonic content [50].
For the purpose of carrying out the tests, a measuring stand equipped with 22 kW electric vehicle service equipment (EVSE), commonly named the AC charger, was developed. The station has been equipped with the necessary number of single- and three-phase sockets, which allows it to be powered from any point (mains socket) of the LV network using a single cable. The station is also equipped with Fluke 434-II and 435-II Power Quality Analyzers (Fluke Corporation, Everett, WA, USA). These analyzers were used for measuring the parameters of the electrical energy transferred to the vehicle during charging. The obtained test results were used to analyze power and energy consumption, as well as to show the impact of the charging process of electric vehicles on the harmonic content in current and voltage. They were provided for all three phases and helped identify the sources of power quality issues. The analyzers were also used for the continuous recording of selected electrical parameters. View of test setup is presented on Figure 1.
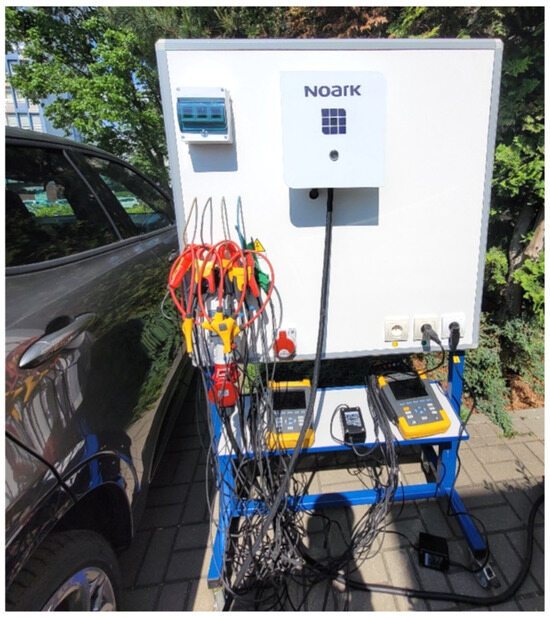
Figure 1.
View of test stand. “Wallbox” in the center; below: power and energy analyzers with probes; tested car on the left.
During the test, conditions similar to the typical method of using the EVs were maintained. The following conditions were considered: we started charging the vehicle when the battery’s SoC level was at the level of 20%, and charging started immediately after the end of the journey. The only exception was charging the battery to 100% instead of 80% or 90% SoC as recommended by vehicle producers. It was assumed that this would be charging while traveling, and therefore the maximum power of the car’s on-board charger (or supplied with the scooter) was used. The tests (registration of parameters) were completed when the on-board charger cut off the power supply.
On-board charging involves a charger within the EV that converts externally supplied AC to DC, enabling the vehicle’s battery to be charged. Off-board charging, on the other hand, provides the ability to supply the EV’s battery with high-speed DC directly, offering much shorter charging times [51].
3. Results of Measurements
3.1. Preliminary Tests
The measurements began with verifying whether the electricity parameters during vehicle charging meet the requirements of the EN 50160 Standard [49]. The EN 50160 Standard is a guideline related to the quality of electrical energy provided to consumers in electrical distribution networks. This standard specifies that electricity obtained from the power grid must meet certain quality criteria in terms of voltage, frequency, and other important electrical characteristics. These features include voltage fluctuations, short-term interruptions, harmonic distortions, and many other electrical parameters.
During the charging processes of high-power devices like EVs, compliance with the EN 50160 standard provides a crucial reference point for the design and operation of chargers and home electrical installations. Meeting the requirements of this standard enhances the stability and safety of the electrical grid and connected devices. It also helps in preventing potential issues related to electrical quality.
The results of the first tests showed that certain parameters were exceeded. In one of the cases, it turned out that it was necessary to take the vehicle to a service center due to a breakdown; while the case shown in the drawing (Figure 2a) indicates the standard operation conditions of the charging system, and opening the door in this vehicle interrupted the charging process. Visible exceedances are related to frequent opening and closing of the car doors. These experiments enabled errors to be avoided in subsequent tests and allowed us to assume that the results were independent of factors originating from outside the tested object. Therefore, it was assumed that the registration of electricity parameters during the charging process will be performed after checking the parameters of the unloaded system, and during the measurement, no activities requiring the consumption of electricity from the battery by the vehicle will be performed (e.g., opening the vehicle). The results of this procedure are shown below (Figure 2b).

Figure 2.
(a) Results of measurements of compliance with electricity parameters for the first test and (b) after procedure correction. Red bar indicate that analyzed parameter exceeds the permitted value, green one informs that value of parameter don’t exceeds permitted value.
Carrying out a series of vehicle charging measurements showed that the normative requirements were met, but the results differed. Therefore, a decision was made to perform more precise measurements consisting of the continuous recording of selected parameters. Changes in power consumption during the charging process, voltage fluctuations, and the content of voltage harmonics were examined. Knowledge of these parameters allows us to assess whether and to what extent the charging process may affect the devices operating in the home electrical installation, as well as the installation itself.
The following electric cars were used to carry out the tests: VW ID.3 (Volkswagen, Zwickau, Germany), Fiat 500e (Fiat, Torino, Italy), Kia eNIRO (Kia Corporation, Hwasung, Republic of Korea). In addition, the Alfa Romeo Tonale PHEV plug-in hybrid (Alfa Romeo, Pomigliano d’Arco, Italy), electric scooters, and a kick scooter were used. When charging the EVs, it was observed that all of them had three-phase chargers with a power of 11 kW, and during the charging process, charging was carried out at maximum power; the current consumed in each phase reached 16 A. and it was a symmetrical load, with slight fluctuations towards the end, i.e., when the degree of charge was greater than 95%. In turn, charging the plug-in hybrid was carried out with a power of 7.4 kW, except that it was single-phase. The consequence of this was a current consumption of 32 A.
3.2. Correlation between Current and Voltage Harmonics
The source of harmonics in the voltage may be the current distortions caused, for example, by power electronic converters. Below, a current and voltage harmonic analysis will be presented for a representative measurement. The recording of parameters started after connecting the EVSE to the vehicle, and the charging process started approximately 3 min later. The recording of power parameters was completed approximately 3 min after vehicle charging was completed. The current harmonic distribution during this measurement is shown in Figure 3.
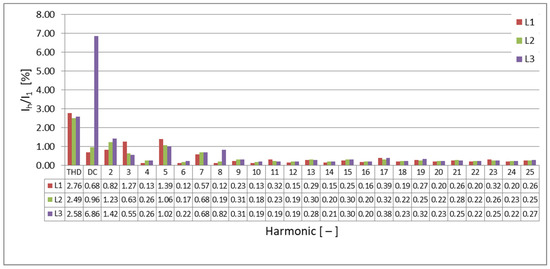
Figure 3.
THDi and individual current harmonic content for electric vehicles.
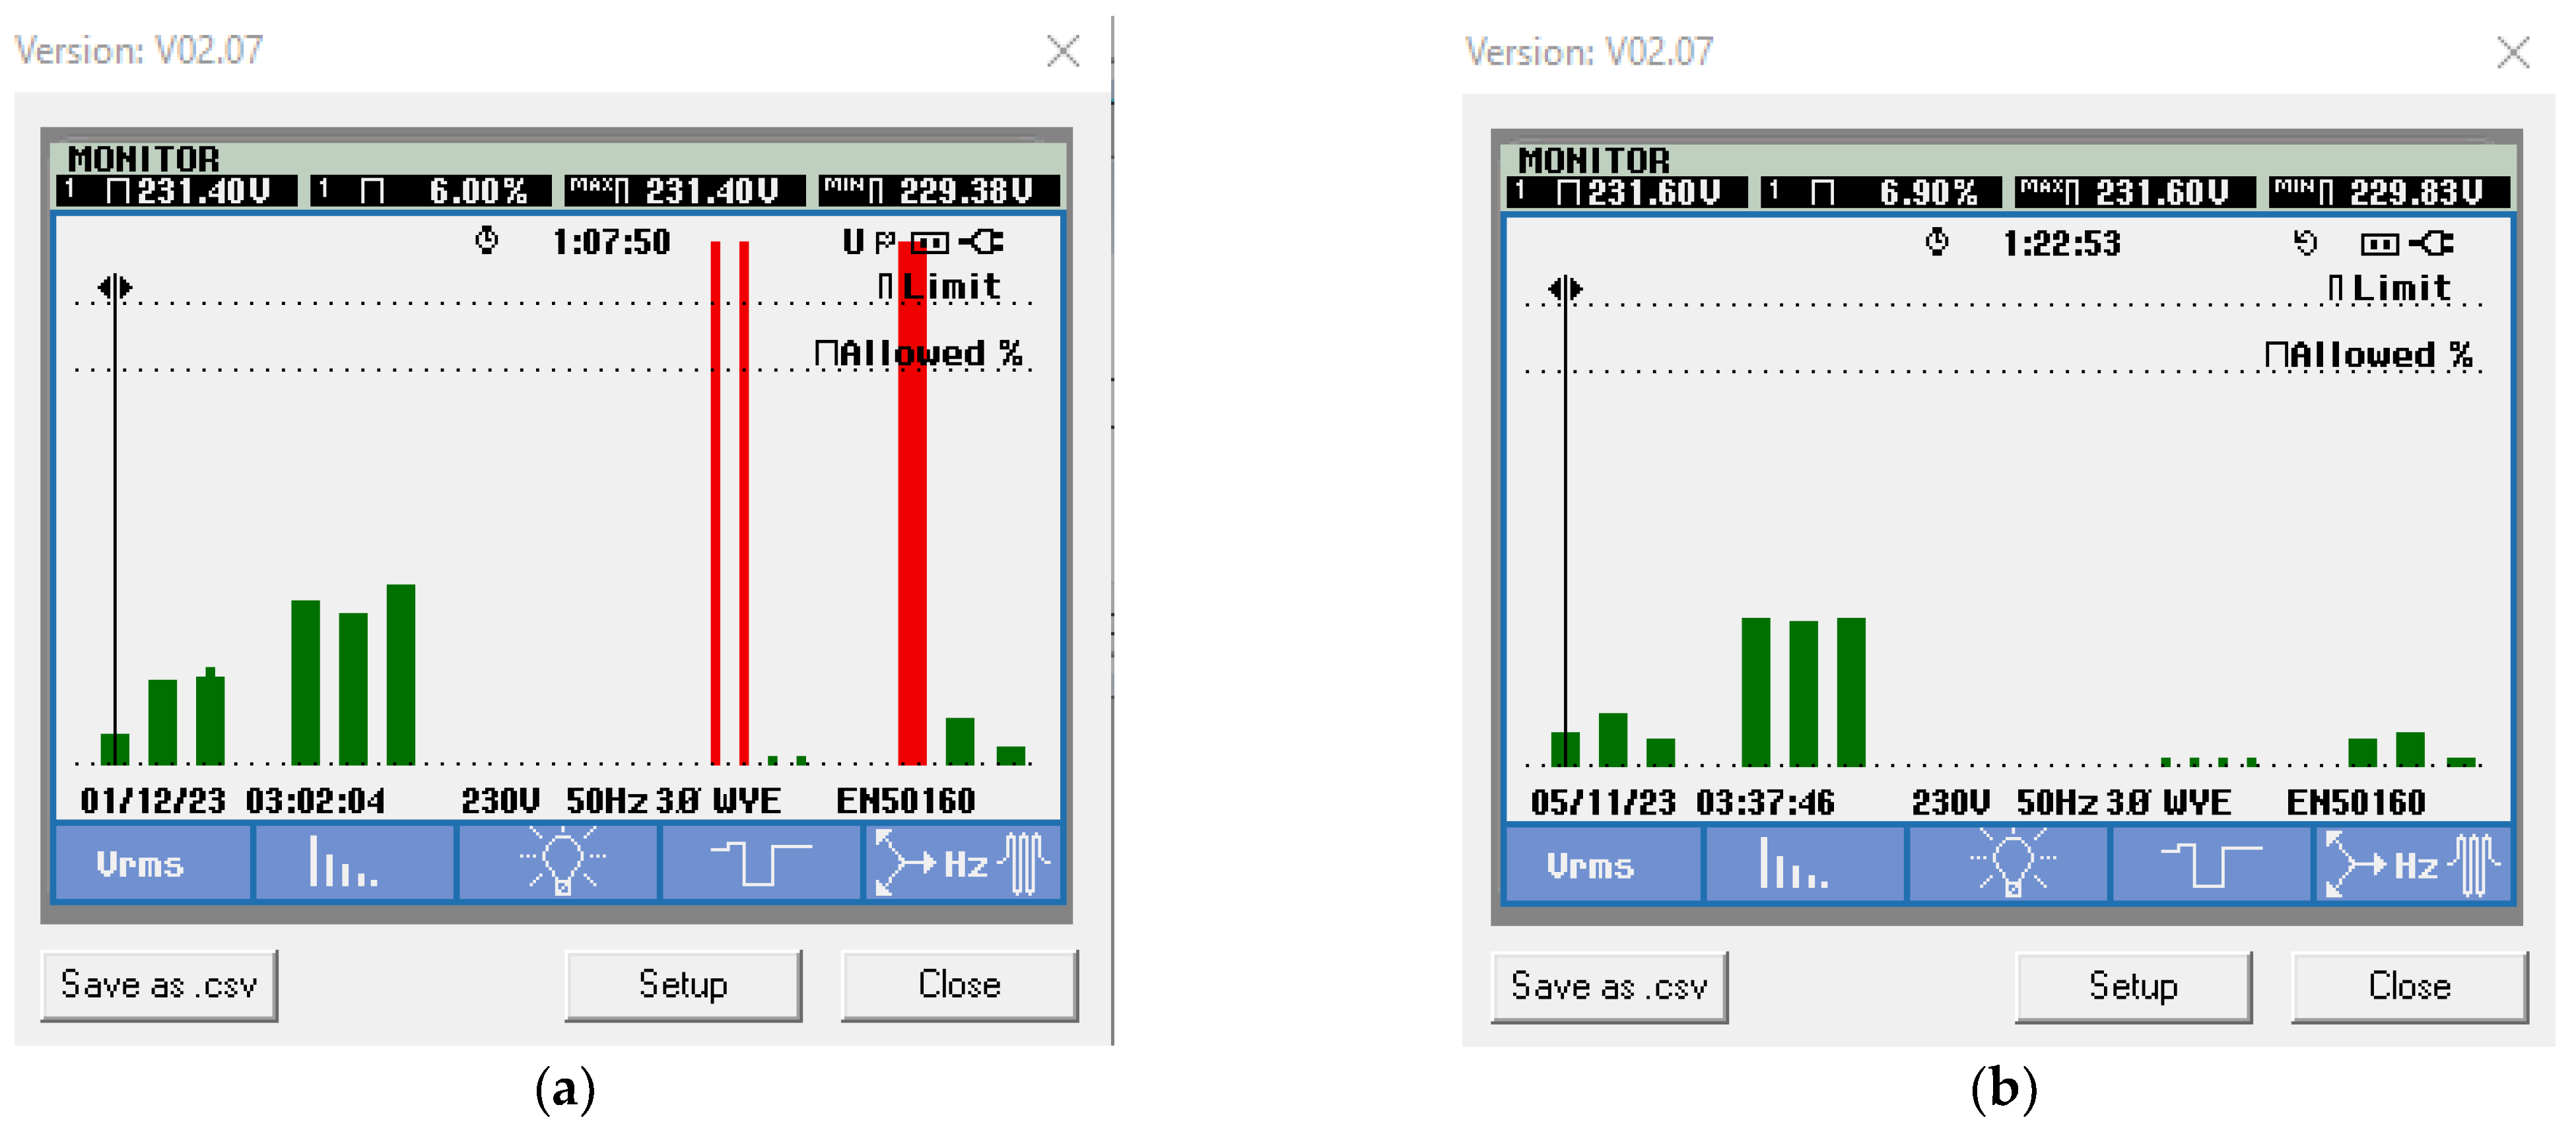
In order to identify the reason for the occurrence of a significant DC component in the current, particularly in phase 3, an analysis of the variability of this component during charging was carried out, and the course of its share is shown in Figure 4.
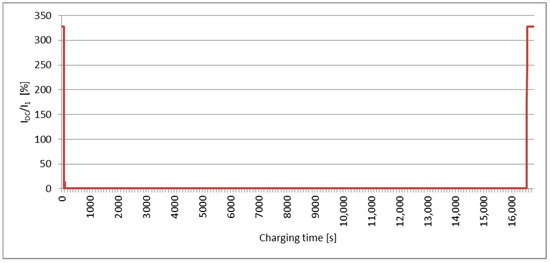
Figure 4.
DC current component while charging the vehicle.
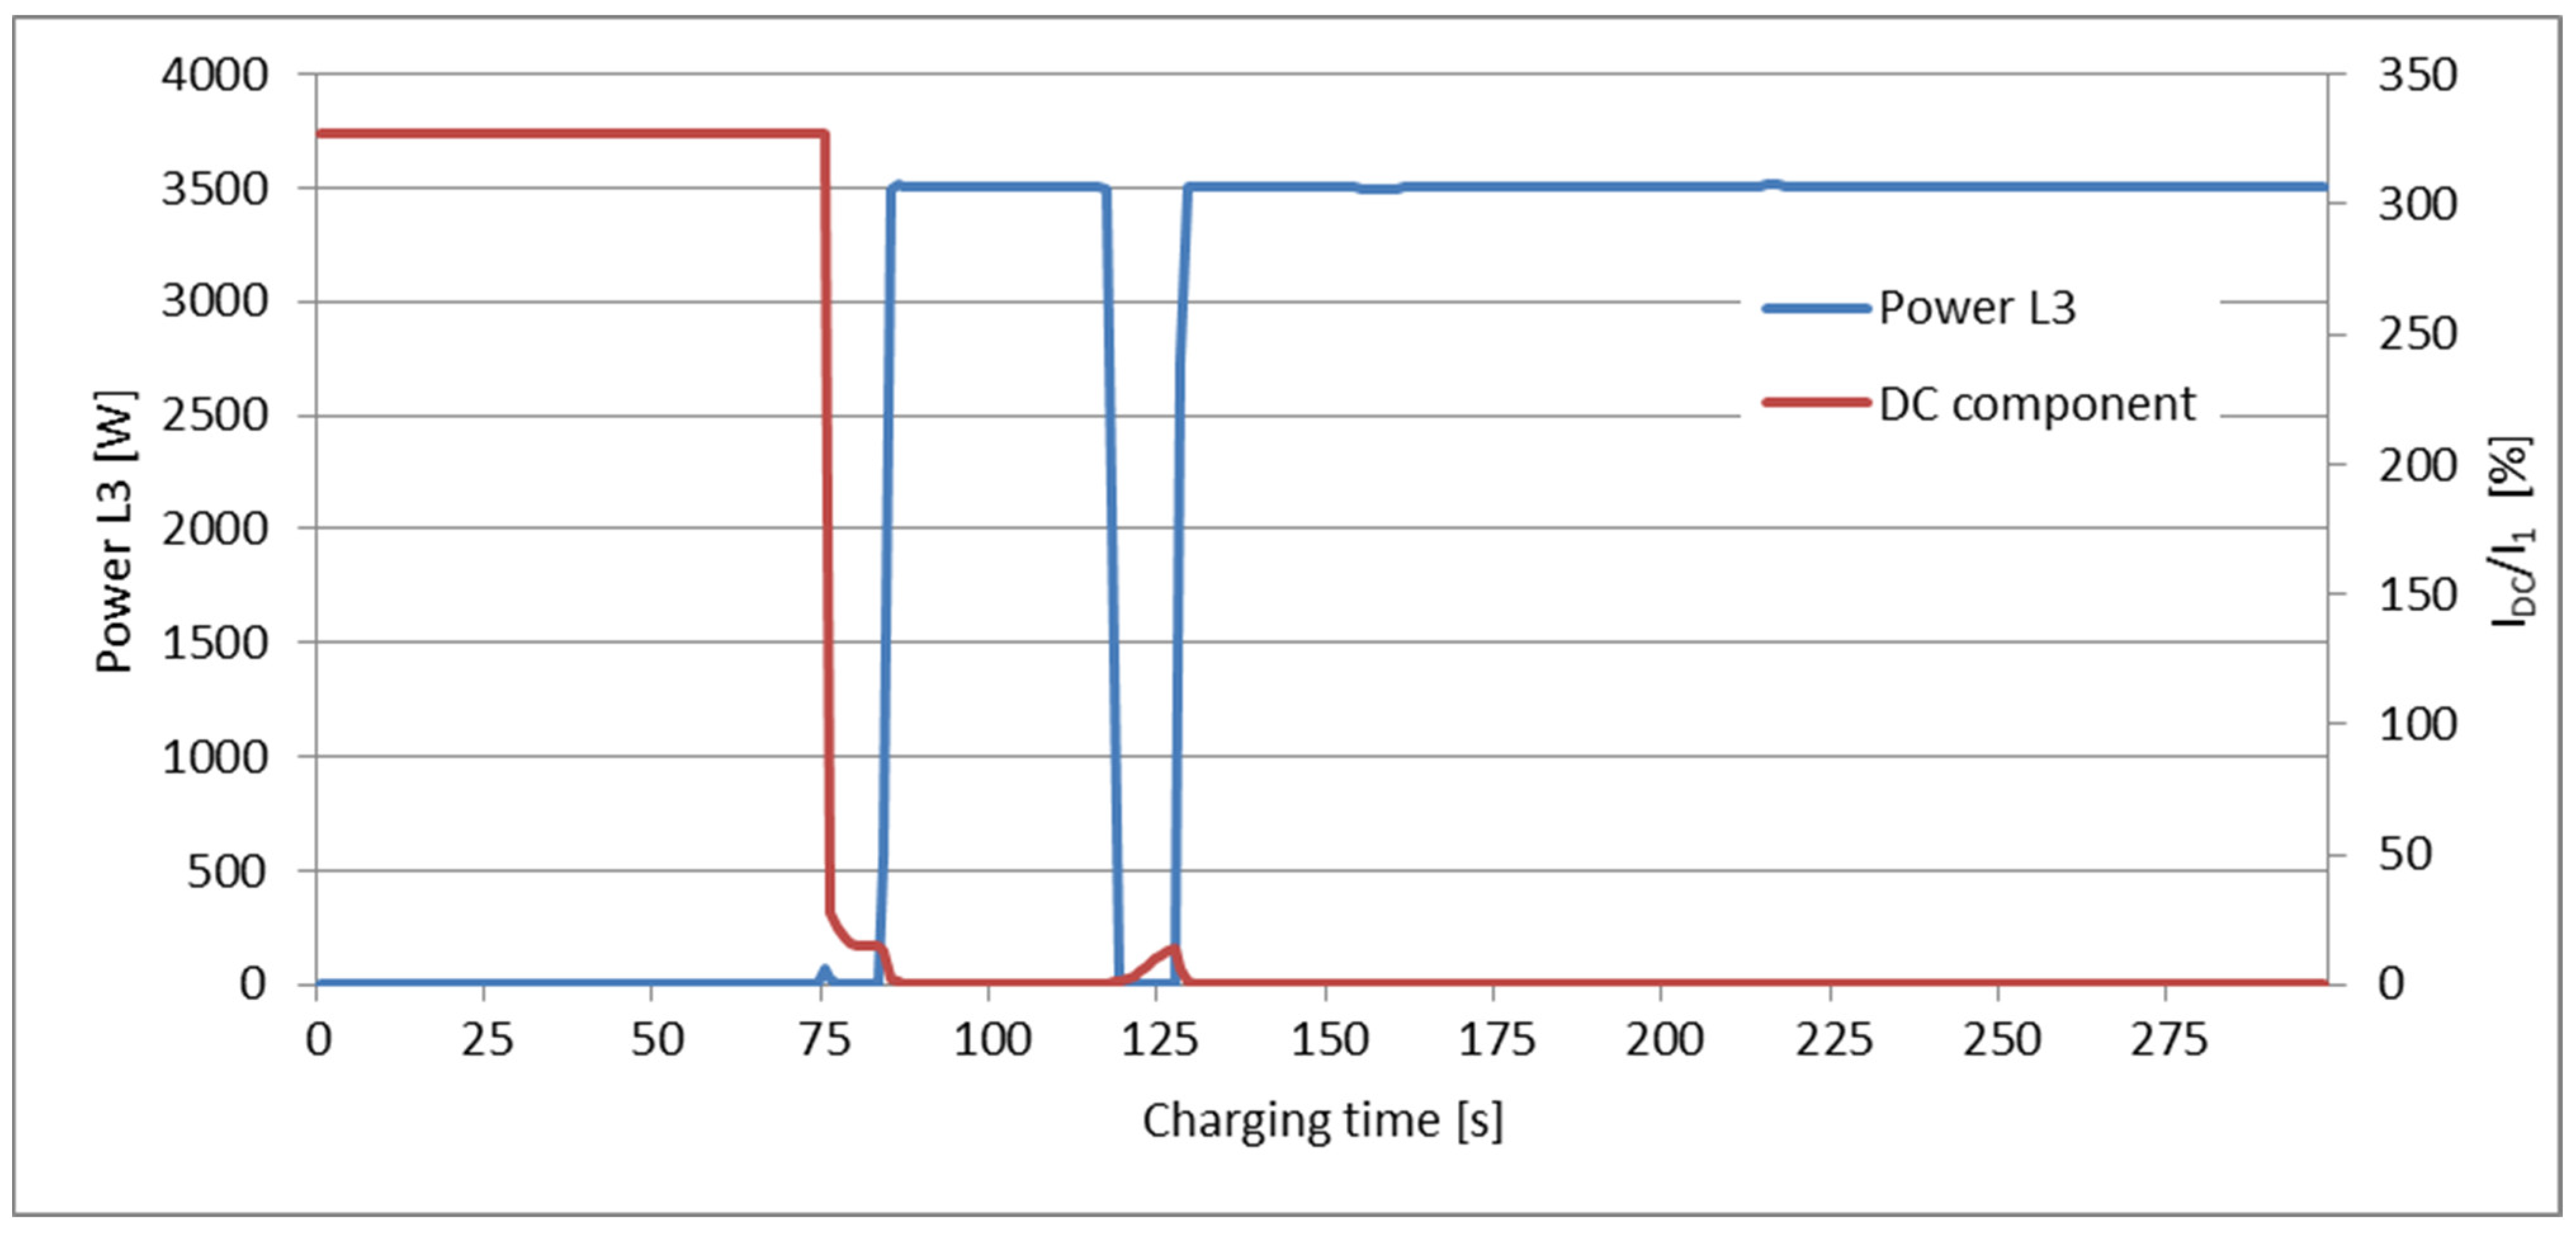
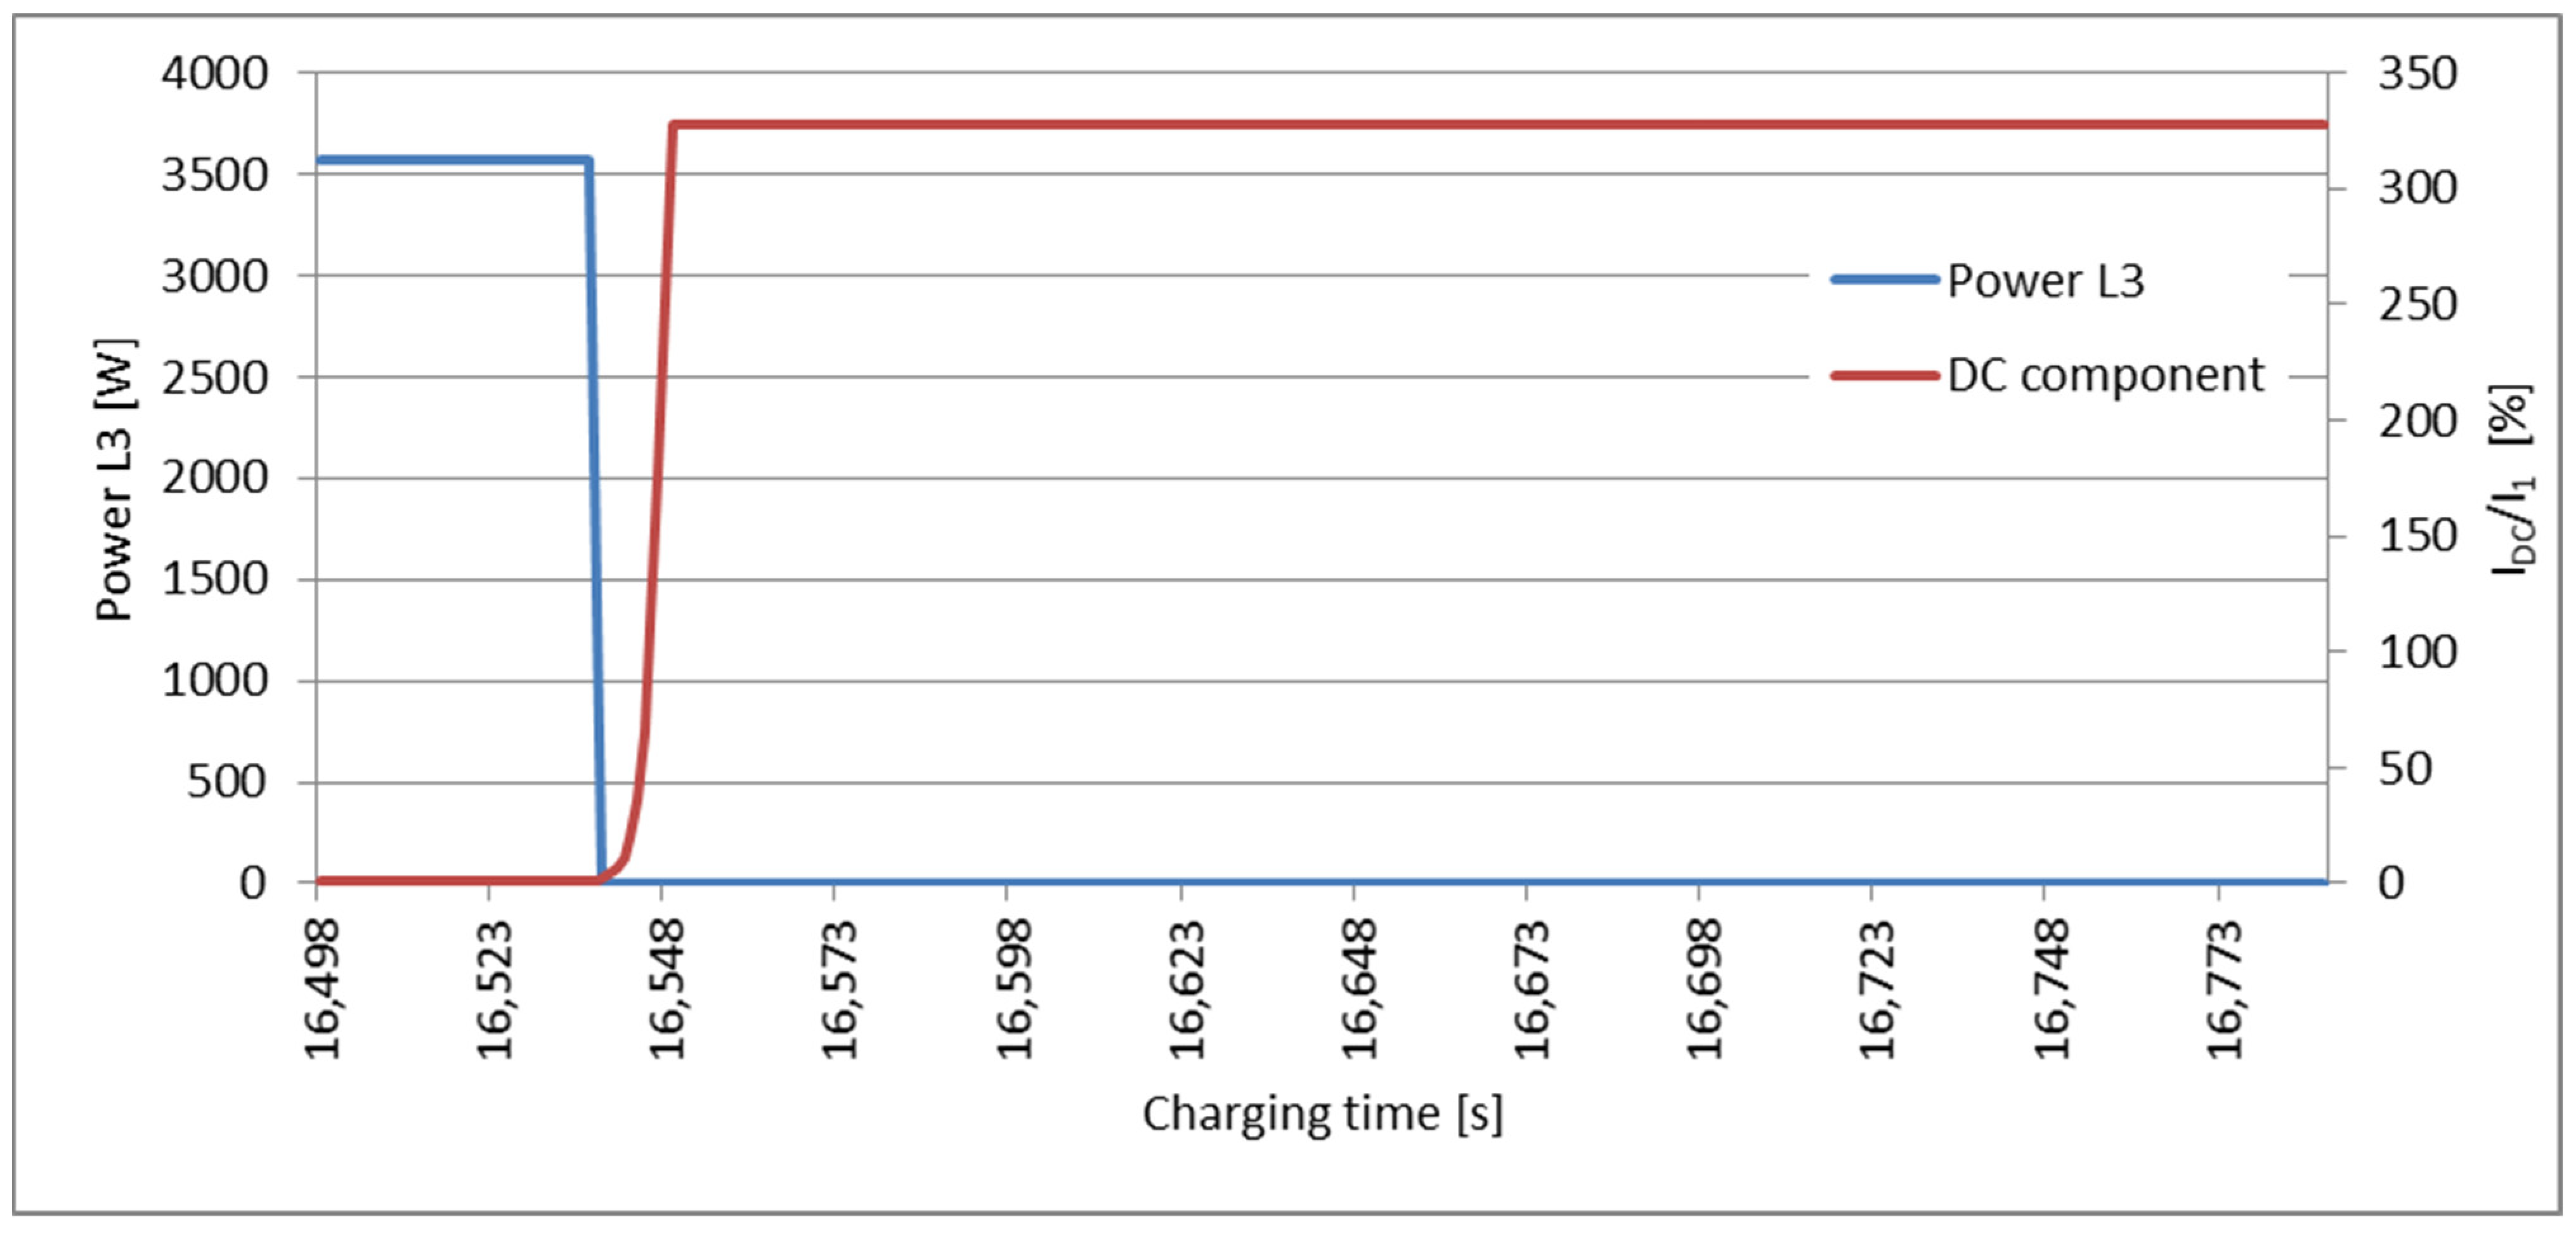
The observed high level of the DC component was related to the power consumed and therefore indirectly to the current flowing from the network to the vehicle. An enlarged fragment of this comparison for the L3 phase at the beginning and end of the measurement is shown in Figure 5 and Figure 6, respectively.
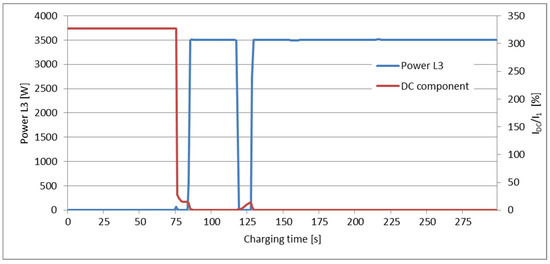
Figure 5.
DC current component and line-3 power at the beginning of the charging vehicle.
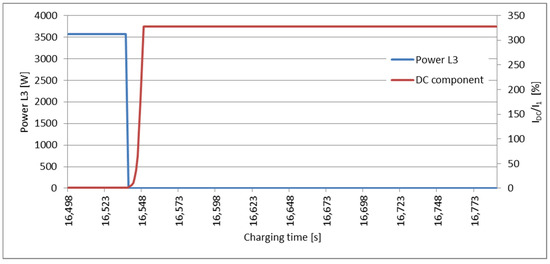
Figure 6.
DC current component and line-3 power at the end of charging the vehicle.
A correlation between the share of the constant component and power consumption; this component is significant in the period before charging starts and after its completion.
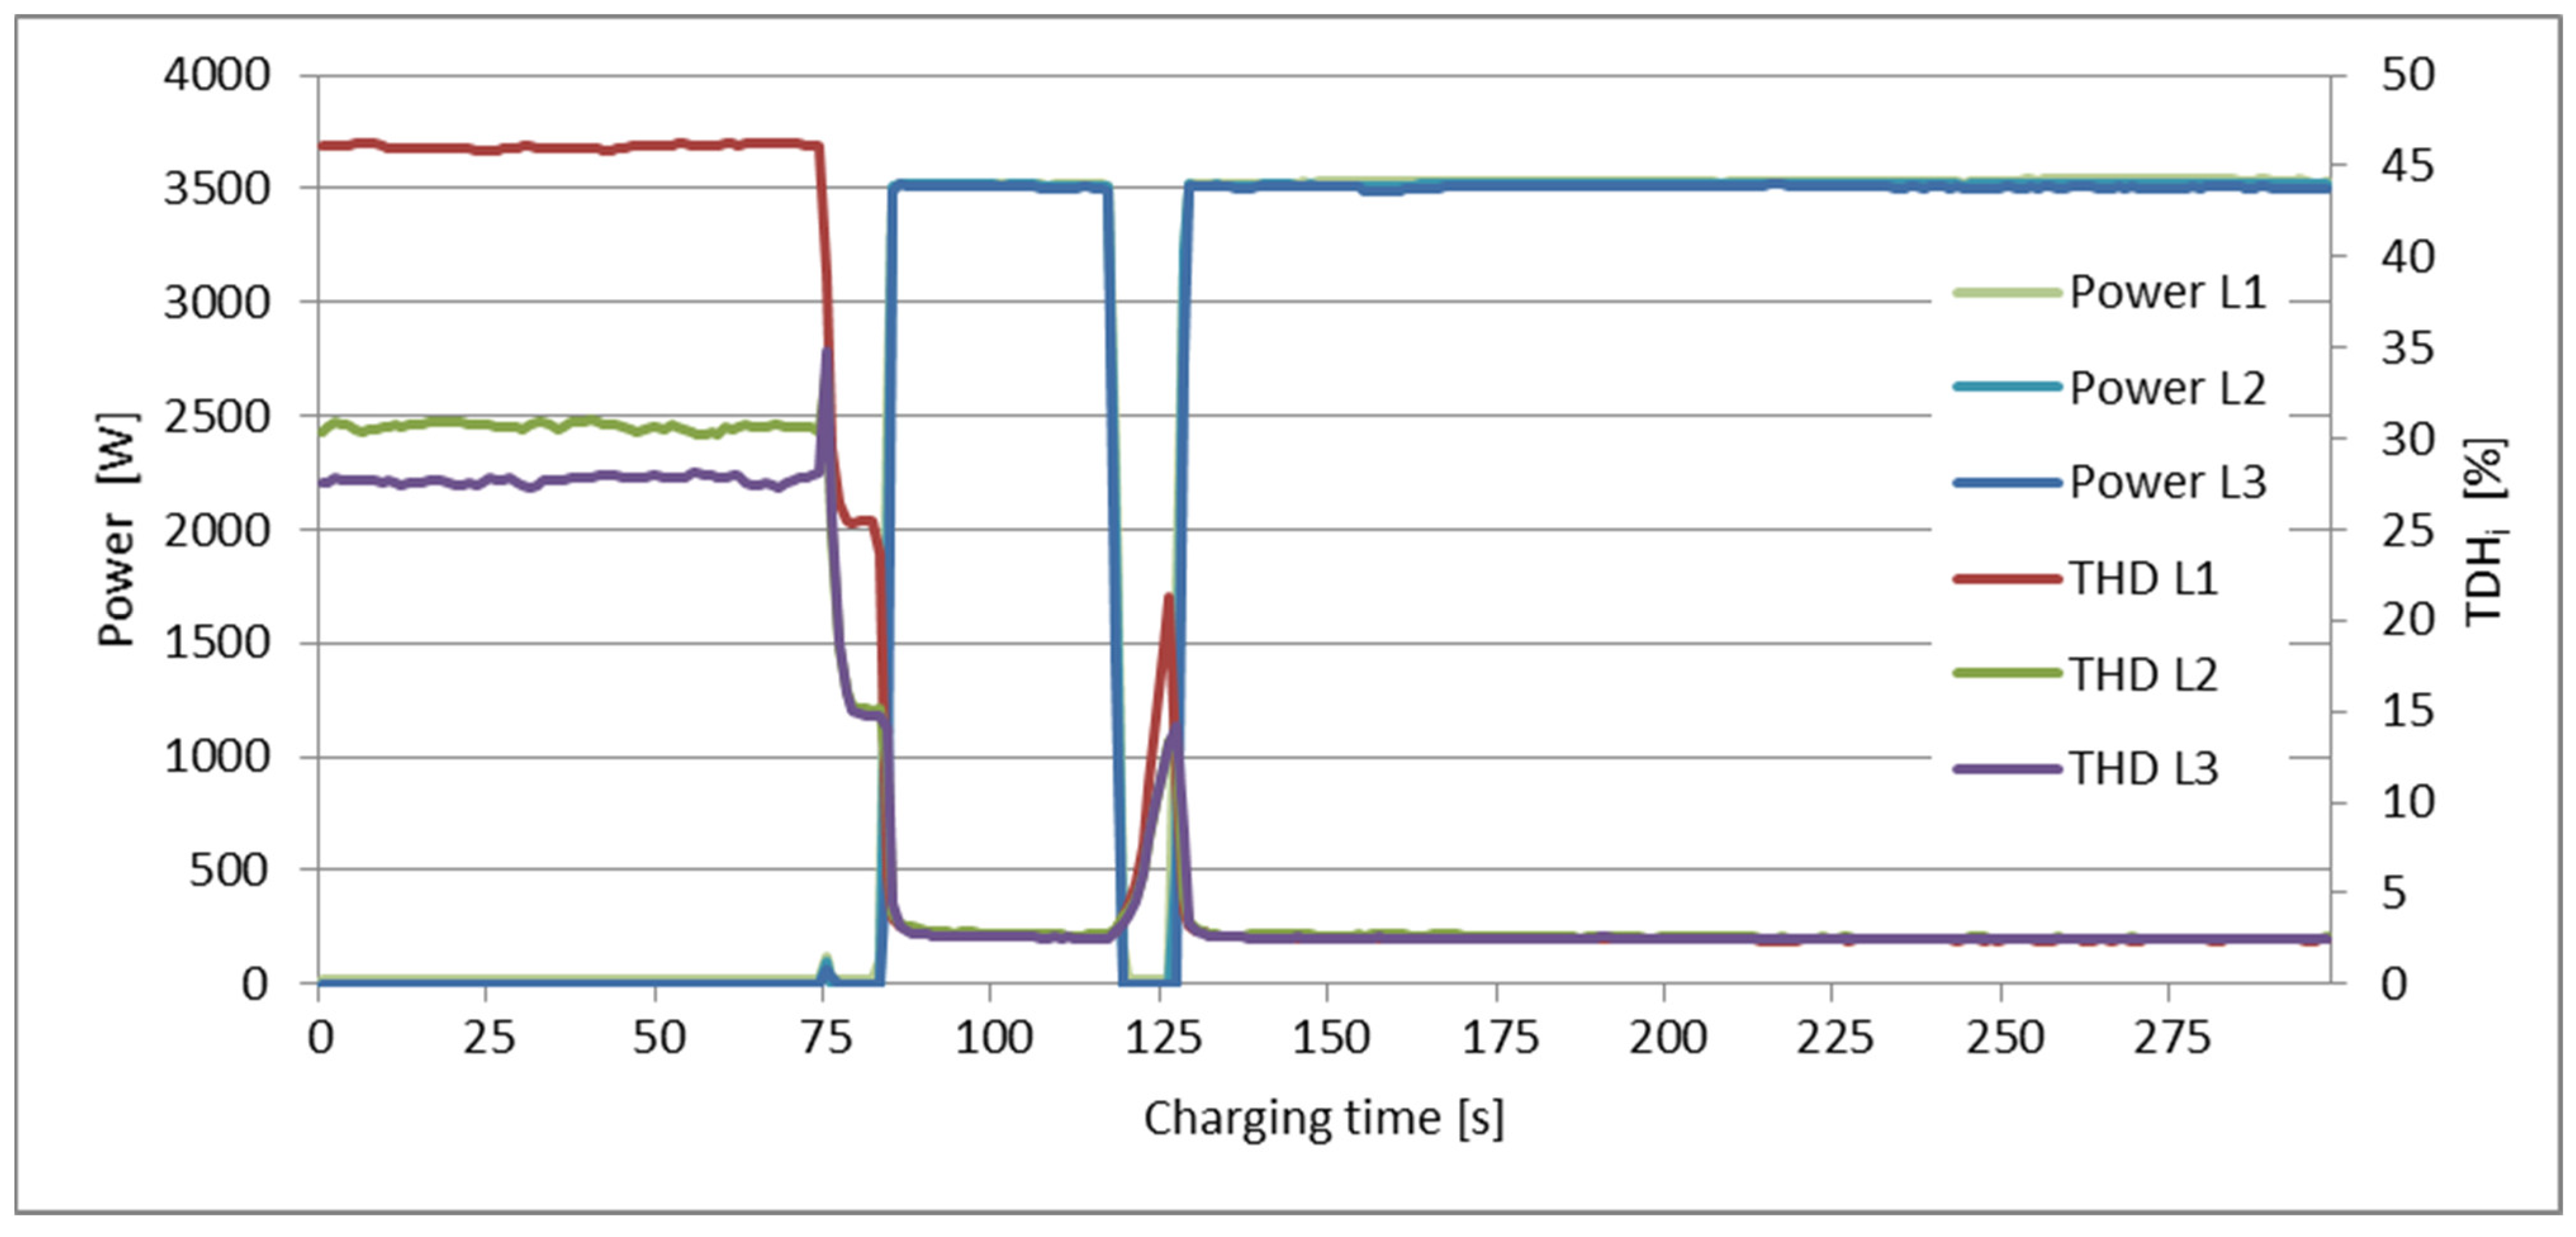
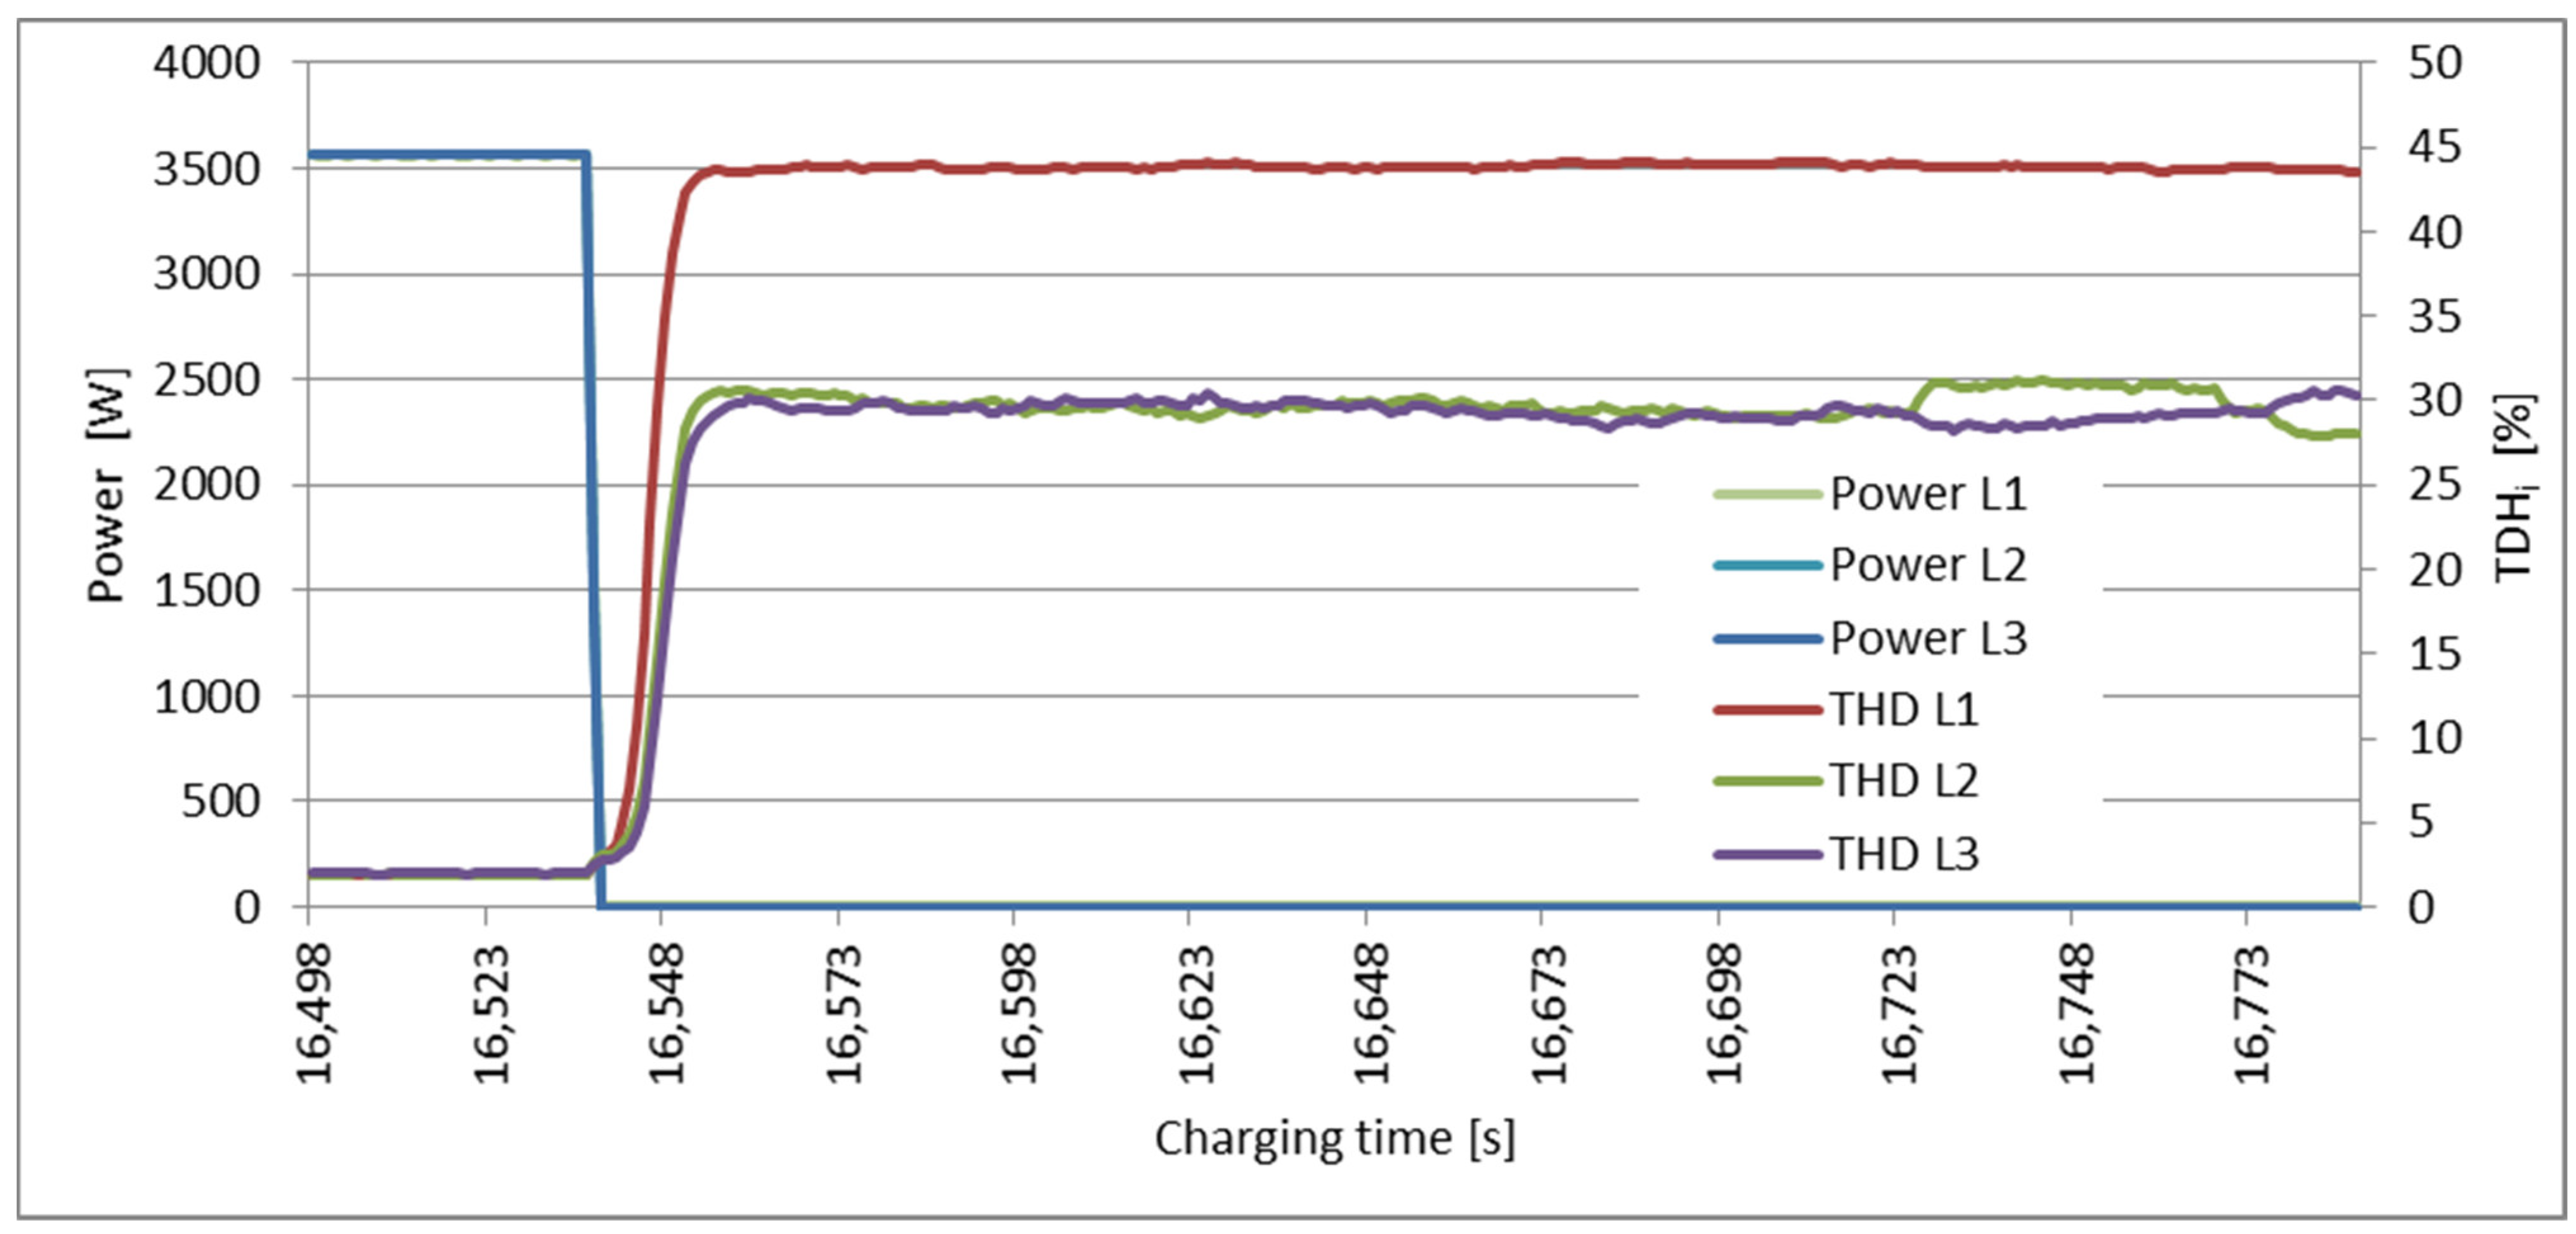
A similar variability analysis was performed for the THDi coefficient values. An enlarged fragment of the power and this coefficient for individual phases at the beginning and end of the measurement is shown in Figure 7 and Figure 8, respectively.

Figure 7.
THDi and power transmitted to the vehicle at the beginning of the test.
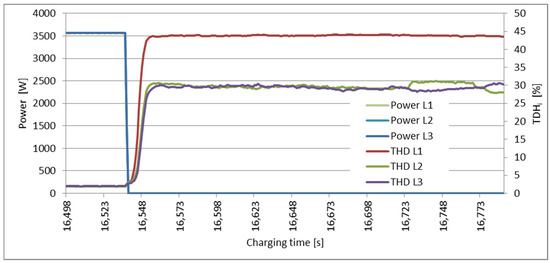
Figure 8.
THDi and power transmitted to the vehicle at the end of the test (powers transmitted by each line are always the same, so overlapping of graph lines be observed).
A very large share of the DC component, over three times higher than fundamental harmonic for the state of the vehicle connected to the network but not being charged, may make voltage nonsinusoidal. However, it should be noticed that the measured effective value of the current drawn from the network during these periods is less than 10 mA. An analysis of harmonic current components was also performed, excluding the period when the vehicle is connected and not charged. Probably, this large share of the DC component is related to the EVSE communication process with the vehicle, which involves, among other things, powering the communication system in the EVSE and the need to “issue” a DC voltage of 9 V on the CP line, which has decreased to 6 V during the charging process [52].
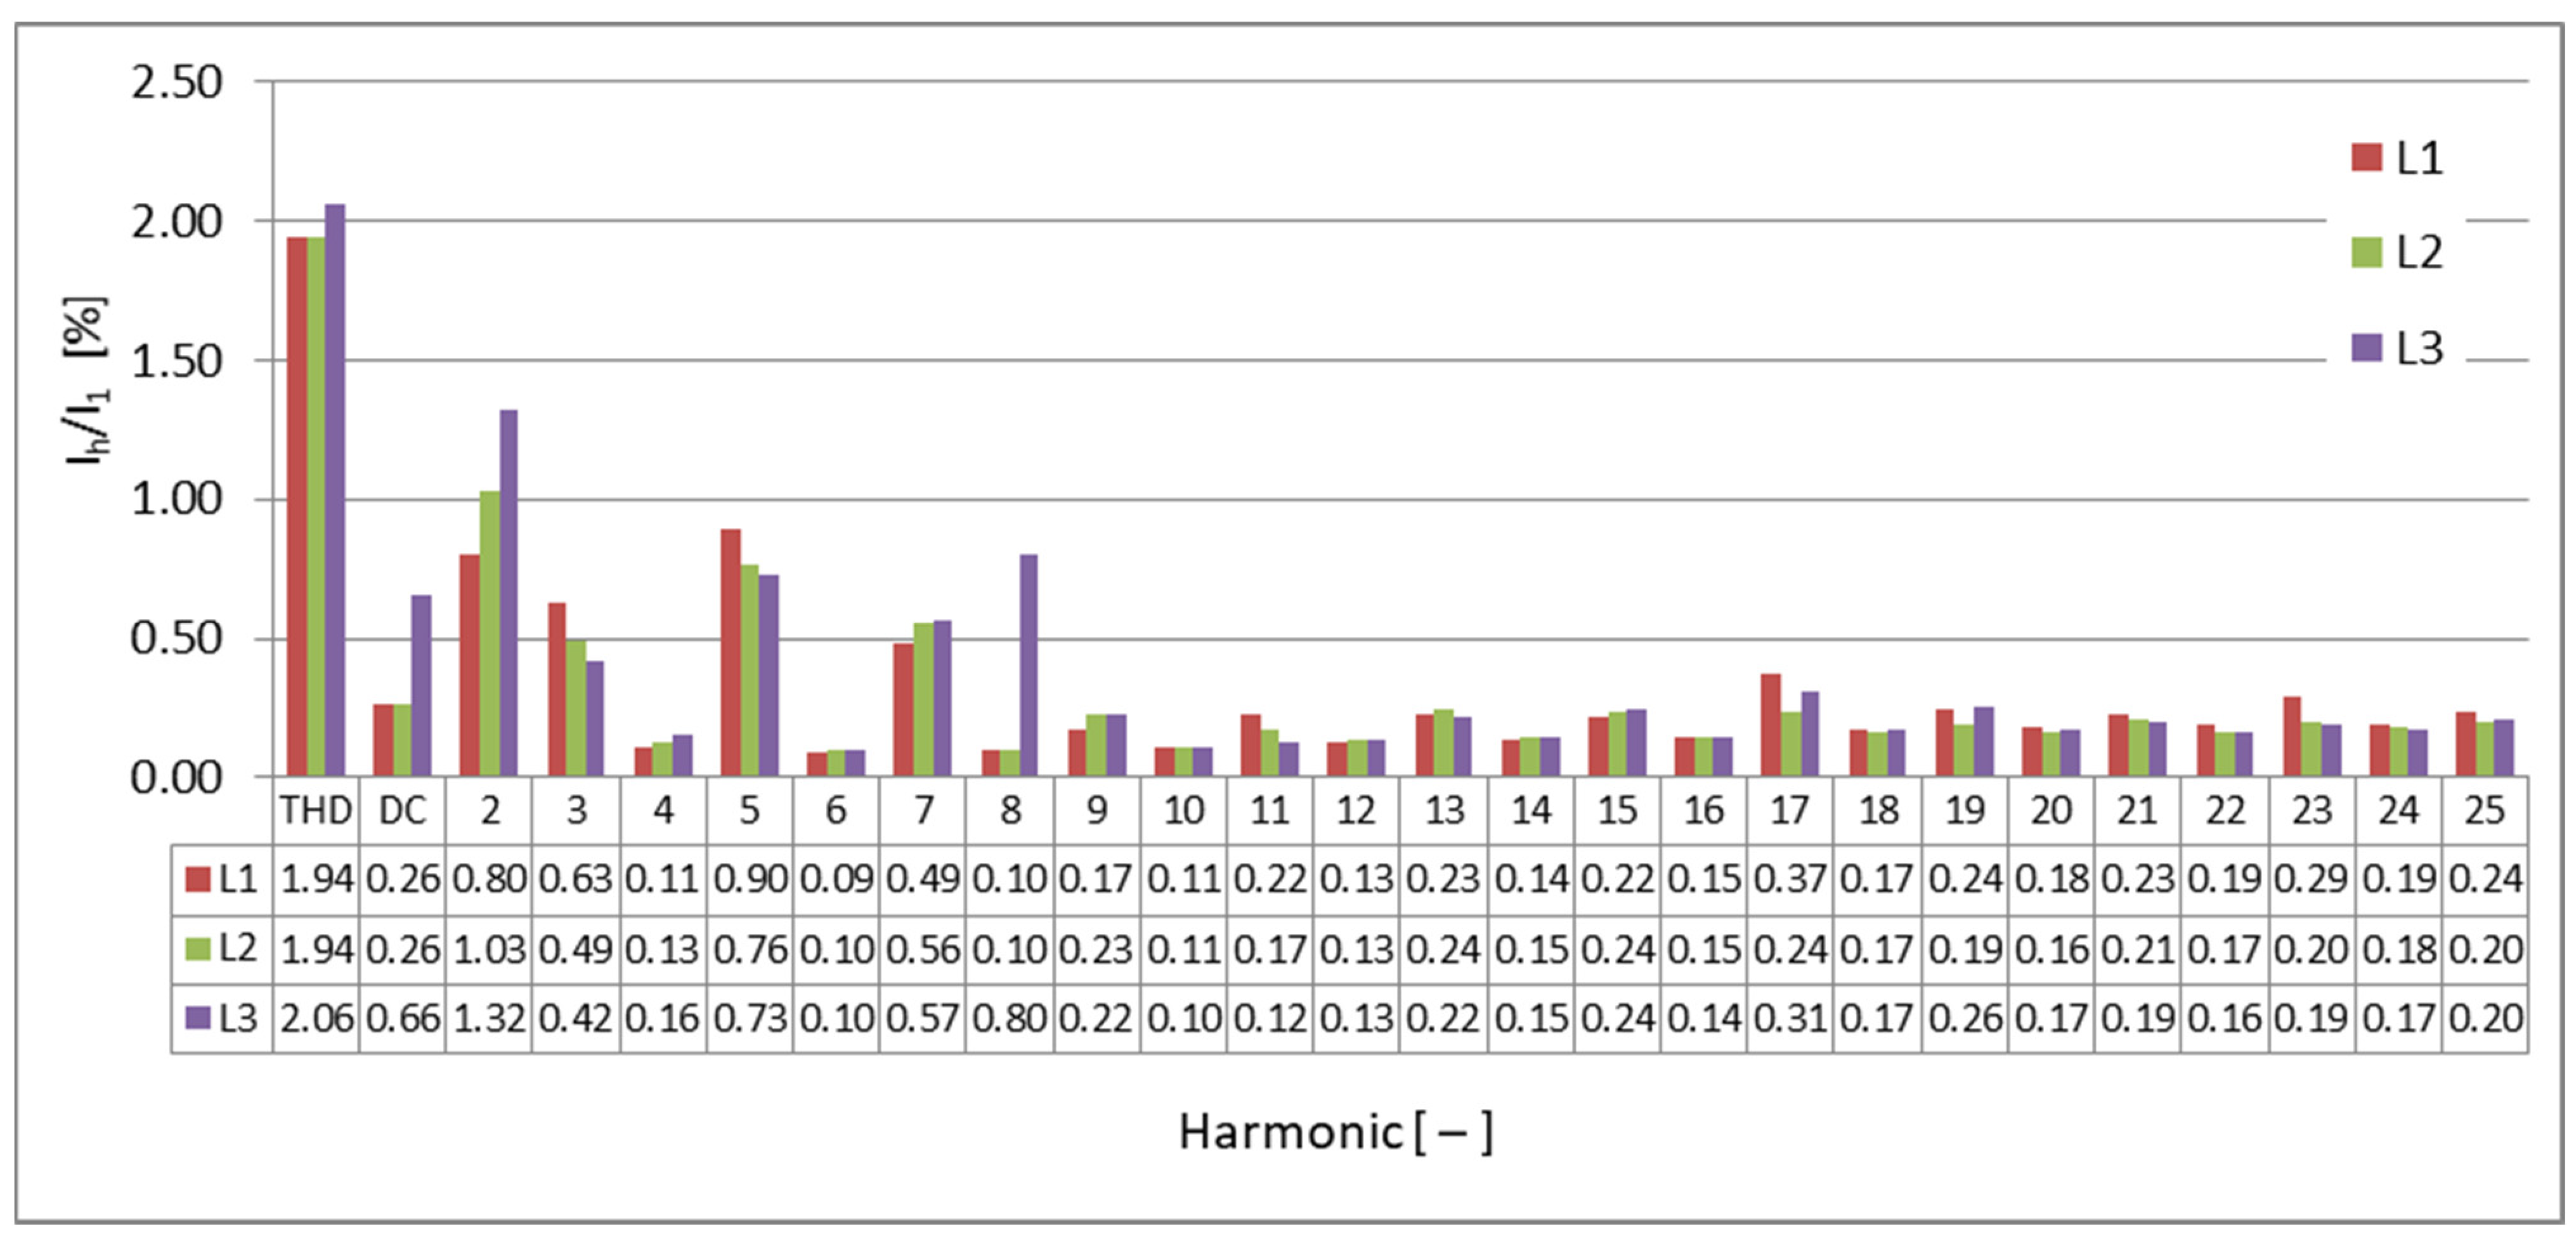
Taking the above into account, an analysis of current and voltage harmonics was also carried out, excluding the time before and after charging; i.e., the analysis concerned only the charging time. The voltage and current harmonic distribution for this case are shown in Figure 9 and Figure 10, respectively.
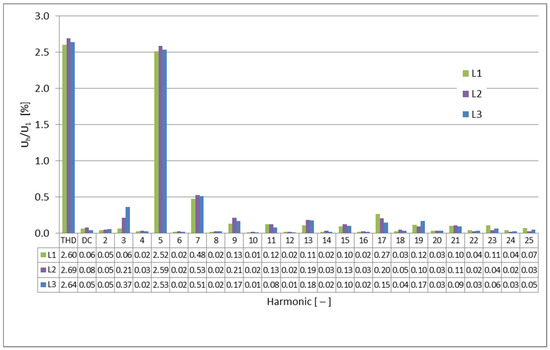
Figure 9.
THDU and individual current harmonic content for electric vehicle (no-charging period at the beginning and end of the process is excluded).
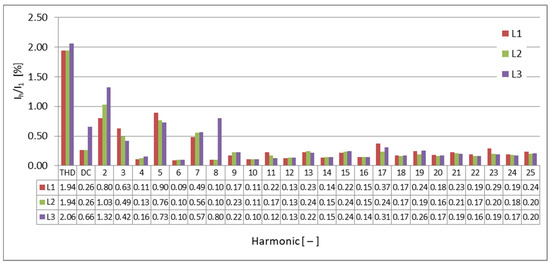
Figure 10.
THDI and individual current harmonic content for electric vehicles (no-charging period at the beginning and end of process is excluded).
This analysis proves that while both the DC component and even the harmonics of the current occur during charging, their share in the voltage, and therefore in the power supply of neighboring loads, is negligible, and the largest contributions are made by harmonics of the following orders: 3, 5, and 7. The main goal of the analyses is to observe the impact of the vehicle charging process on the voltage supplying other loads in the installation; therefore, further considerations will be limited to the recorded voltage distortions.
3.3. Voltage Harmonics during Vehicle Charging
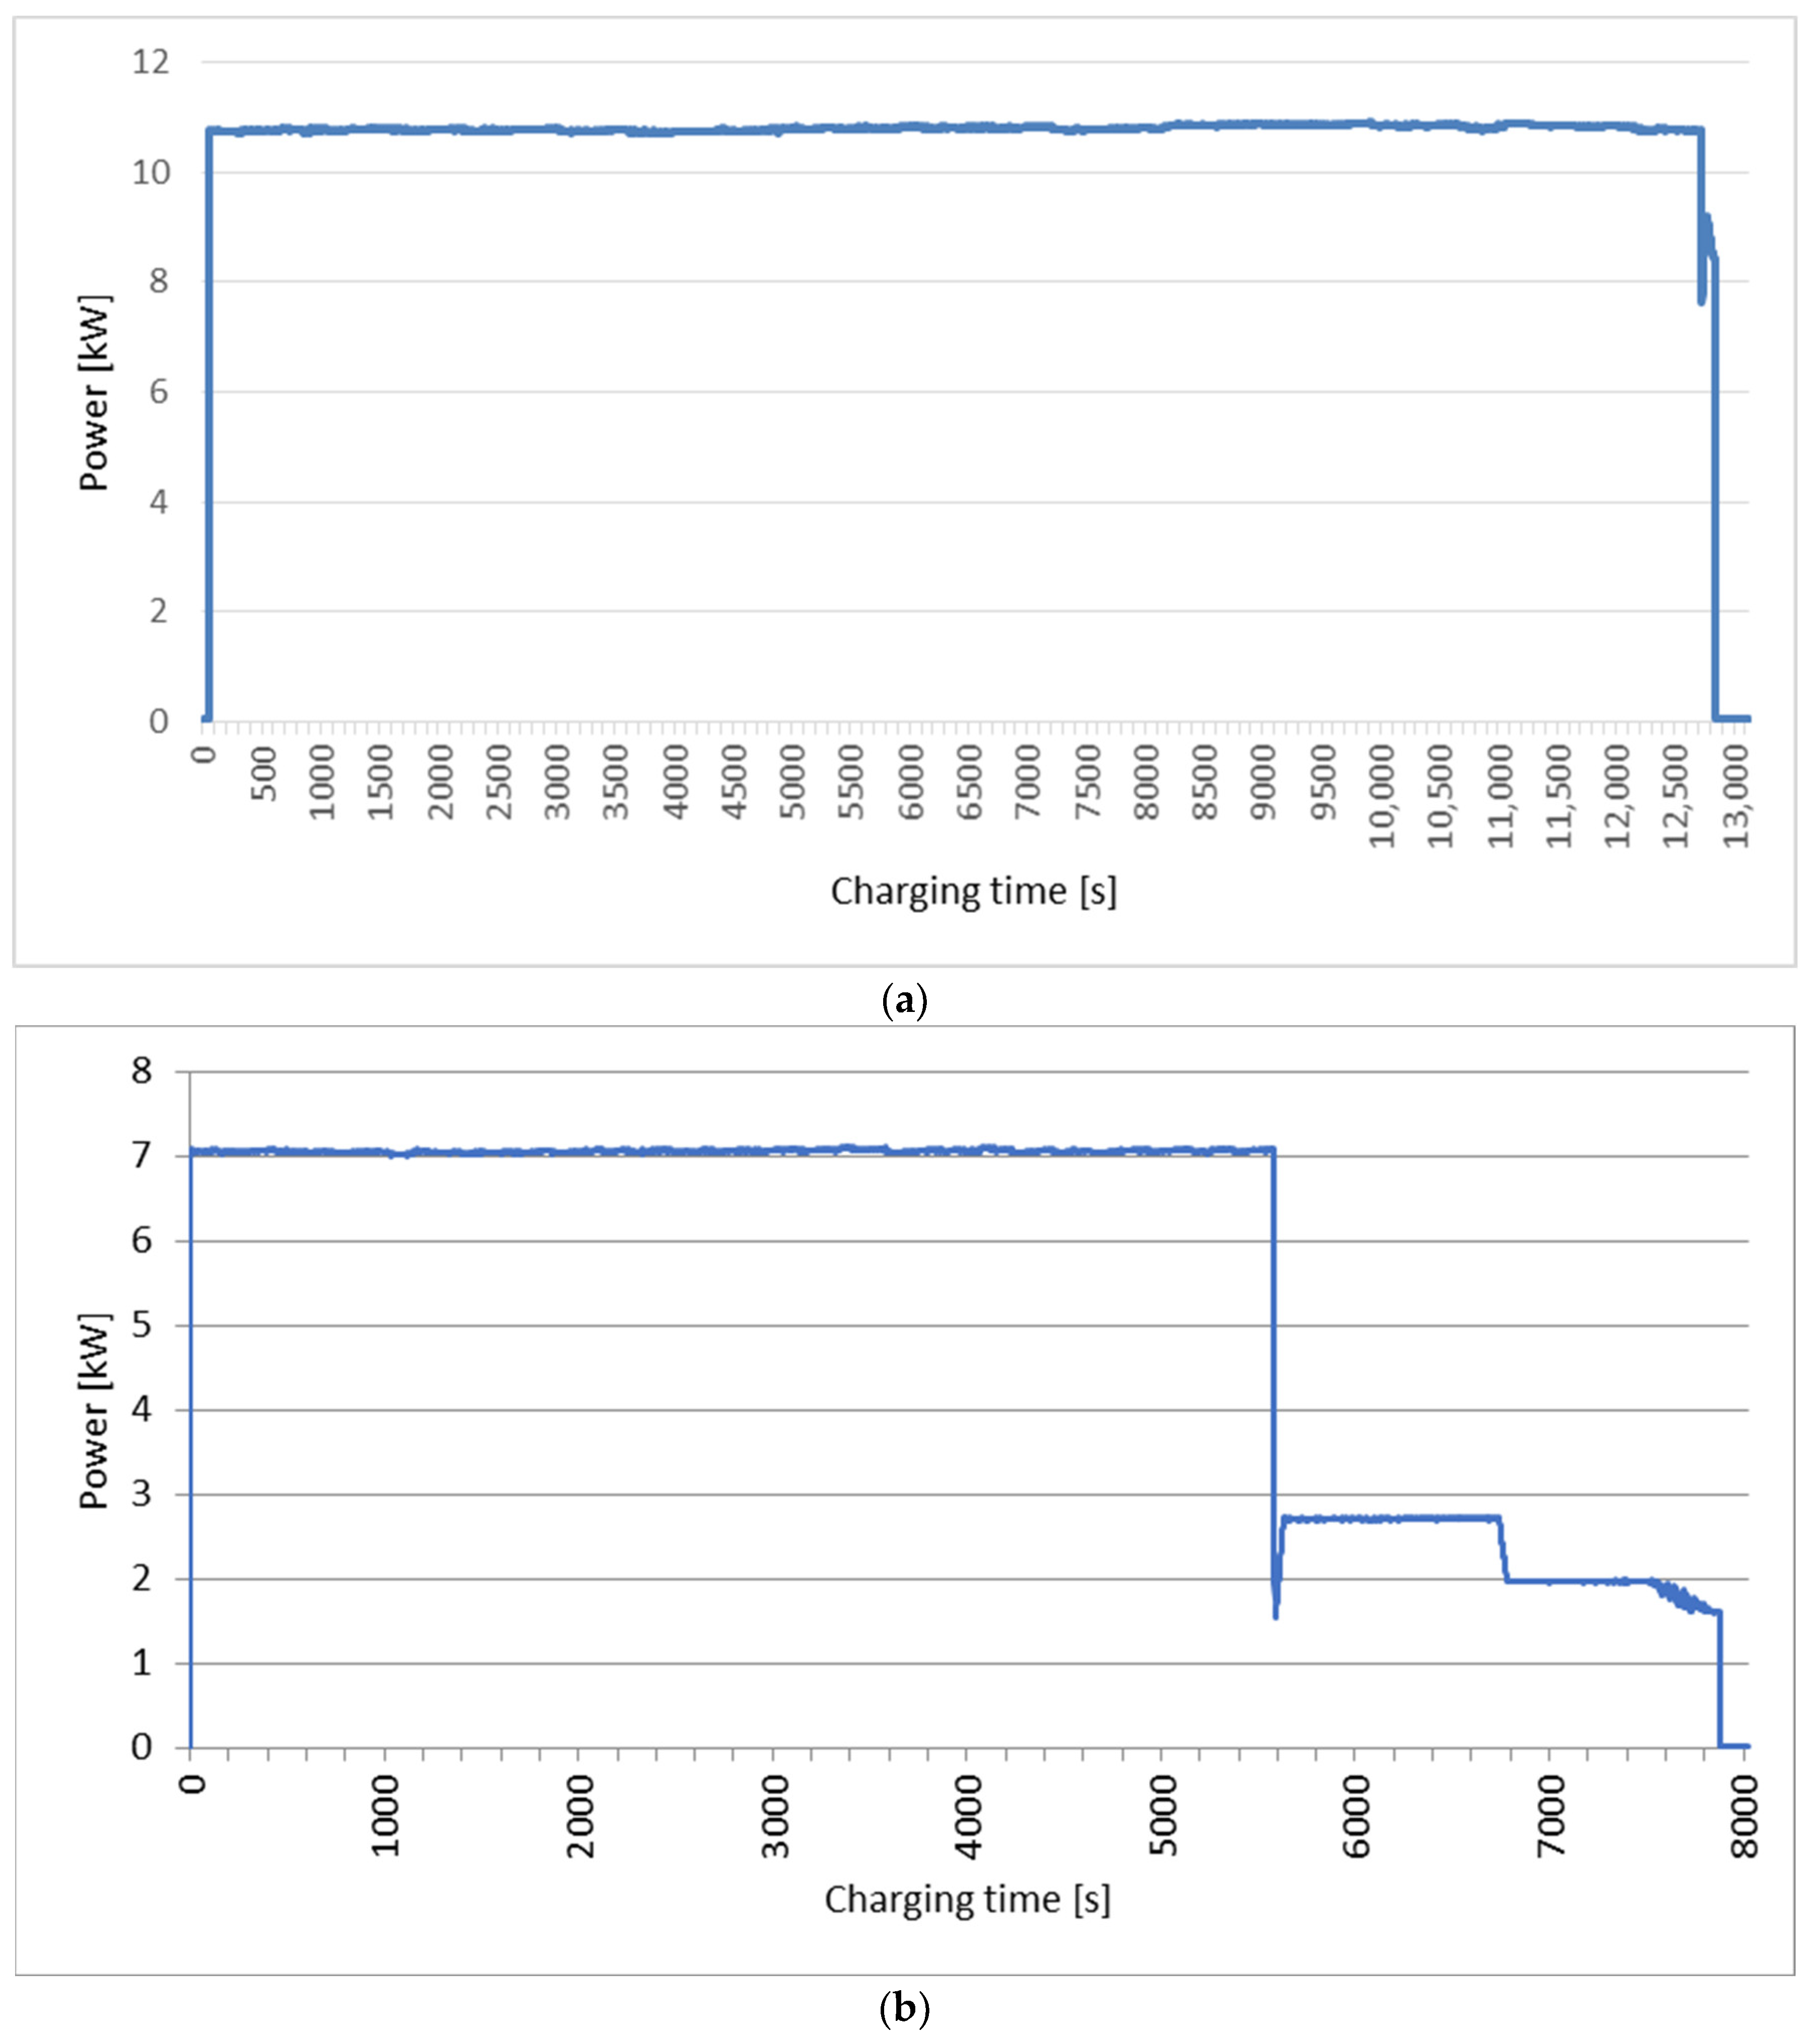
One of the important parameters for users are those connected with the charging process. While in the case of DC charging, the charging time for a passenger car usually does not exceed several minutes to 1 h, depending on the desired charge level, in the case of AC charging, this time is much longer. Therefore, knowledge of this process is important, especially for users who charge their vehicle batteries at home. To investigate the impact of charging an EV on the home electrical installation, a number of tests were carried out. Charging power curves for individual vehicles are presented below (Figure 11).

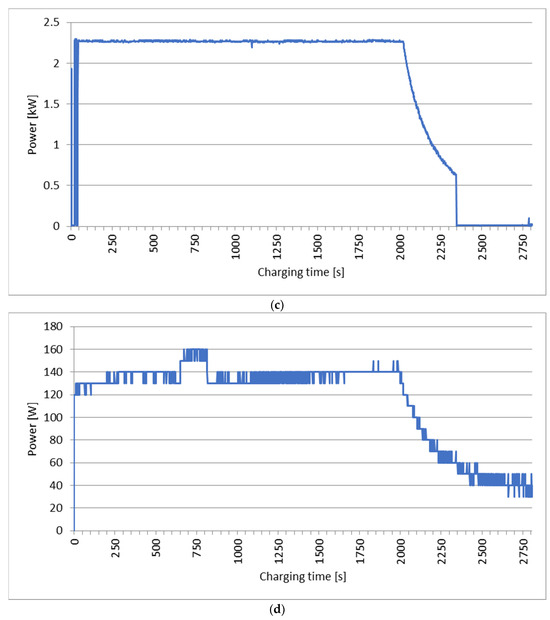
Figure 11.
Power curves for different electric vehicles: (a) for the BEV (11 kW three-phase AC charger); (b) for the PHEV (7.4 kW single-phase AC charger); (c) for the scooter (2.4 kW single-phase AC charger (Brick)); (d) for the kick scooter (3 A, single-phase AC charger (Brick)).
A significant difference was observed during this process, with significant fluctuations in current consumption when the batteries reached a charge level greater than 80%. During the last 20%, the current consumed varied from 1 to 32 A. In addition, it was the only time when the cooling fans of the charging system and batteries turned on after charging. In the case of scooters, charging was as follows: for BMW C evolution, charging was linear with full power, except that in the last stage (the last few percent of capacity), in which there was an exponential decrease in power consumption from the network; in the case of the second scooter, an older example of an unknown brand, the power consumption, and thus the current, oscillated around the maximum value of the charger current throughout the charging process, and at the end, it dropped to the minimum value in a short time; the kick scooter, on the other hand, drew very little current throughout the charging process; moreover, frequent steps of 10 W can be noticed; because of method of operation of the charger—it worked with this step.
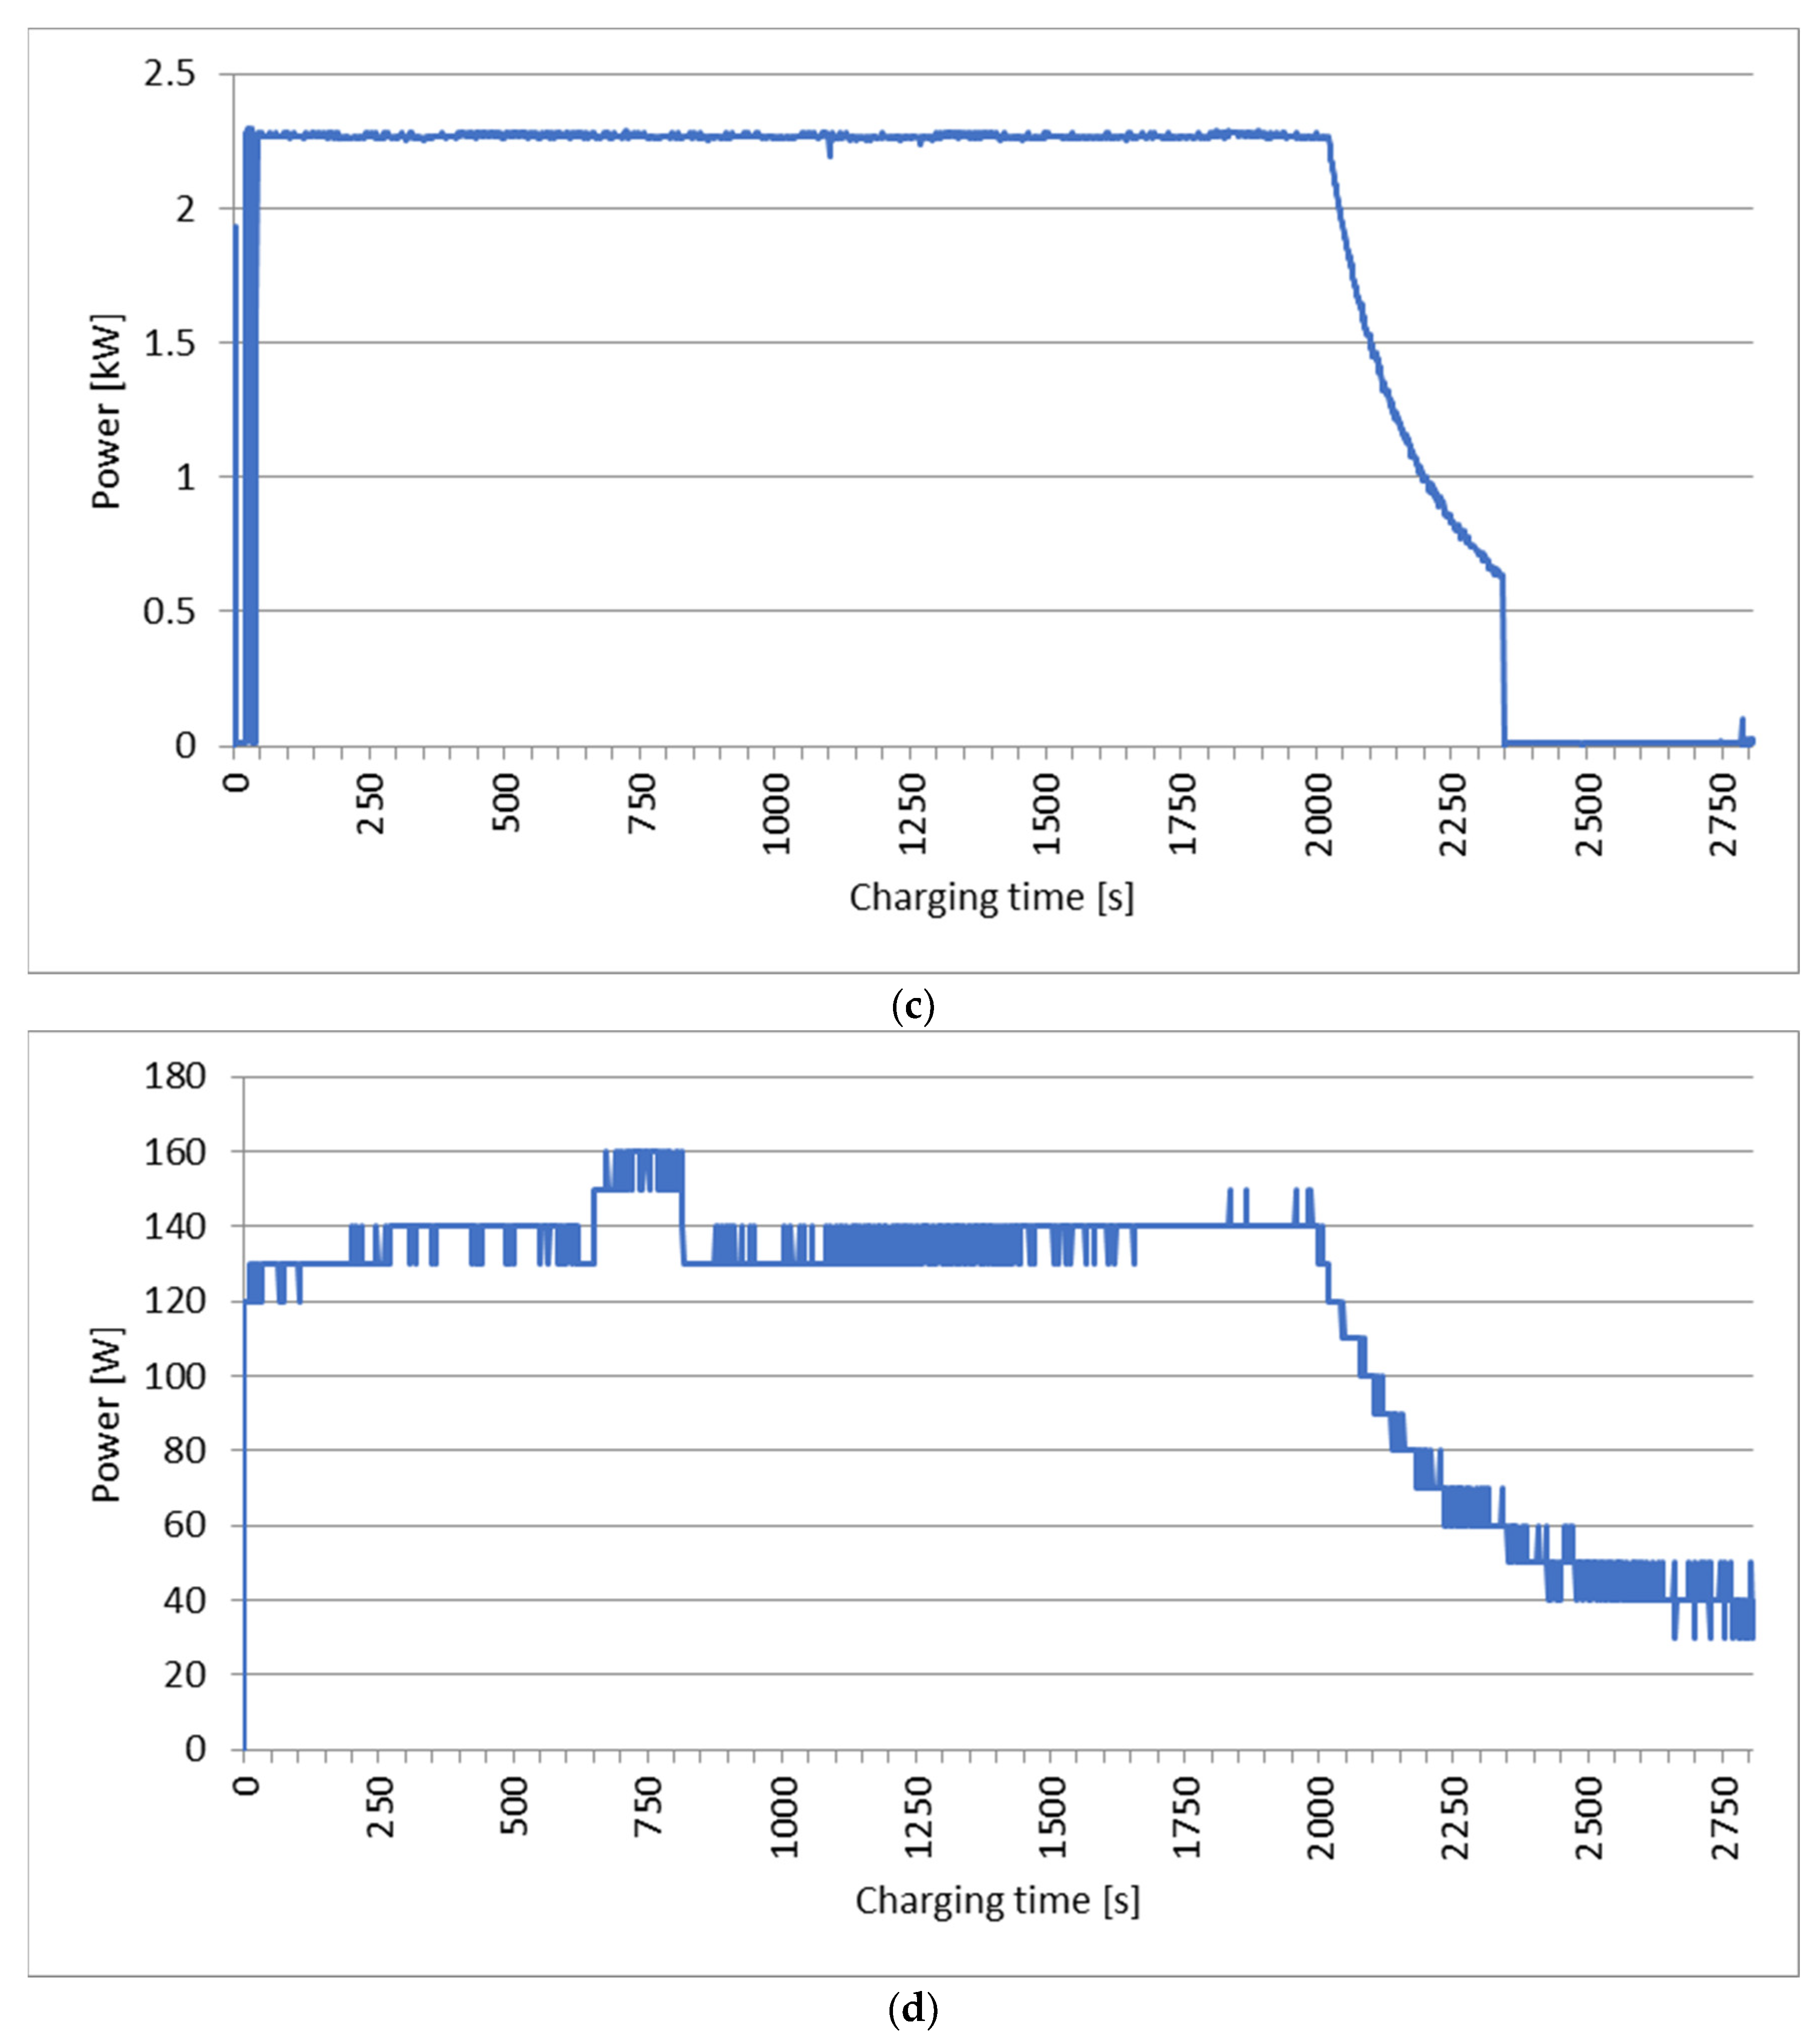
A significant load on the installation may result in a voltage drop in individual phases. As long as the load is symmetrical, this effect is not dangerous, but significant asymmetry in the case of a single-phase load, while home loads are usually single-phase, may result in very high current in the neutral line or voltage asymmetry in the other three-phase loads (e.g., utility water heaters). Phase voltages waveforms is presented for the least favorable case, i.e., the plug-in hybrid (Figure 12).
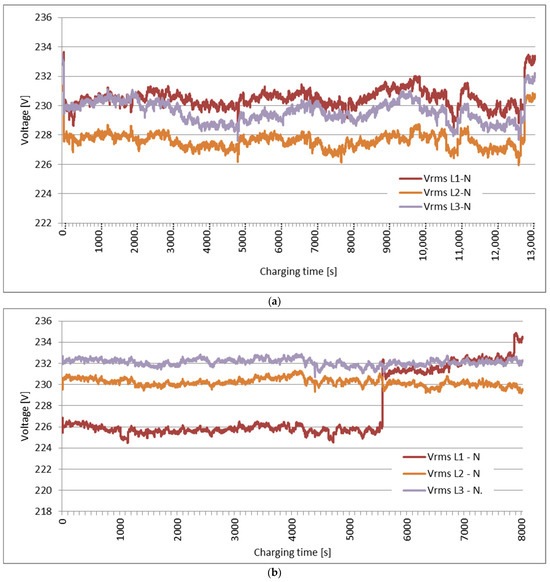
Figure 12.
Voltage during charging for different electric vehicles: (a) for the BEV (11 kW three-phase AC charger); (b) for the PHEV (7.4 kW single-phase AC charger).
In the case of a scooter and kick scooter, voltage changes did not exceed 3 V. It can be seen that the voltage drop is significant for the highest value of the current, but voltage did not exceed the limits of the permissible value range.
Another analyzed parameter was the analysis of distortions caused by the nonlinearity of the load, which is the on-board charger. A potential threat is the impact of the presence of higher harmonics on other loads.
Despite these differences, it was observed that in none of the analyzed cases were the normative quality parameters of electricity exceeded. At the same time, the analysis of the harmonic distribution showed that the chargers generate current and voltage harmonics in the range from the DC component to the 50th harmonic, the distribution of which depends on the vehicle.
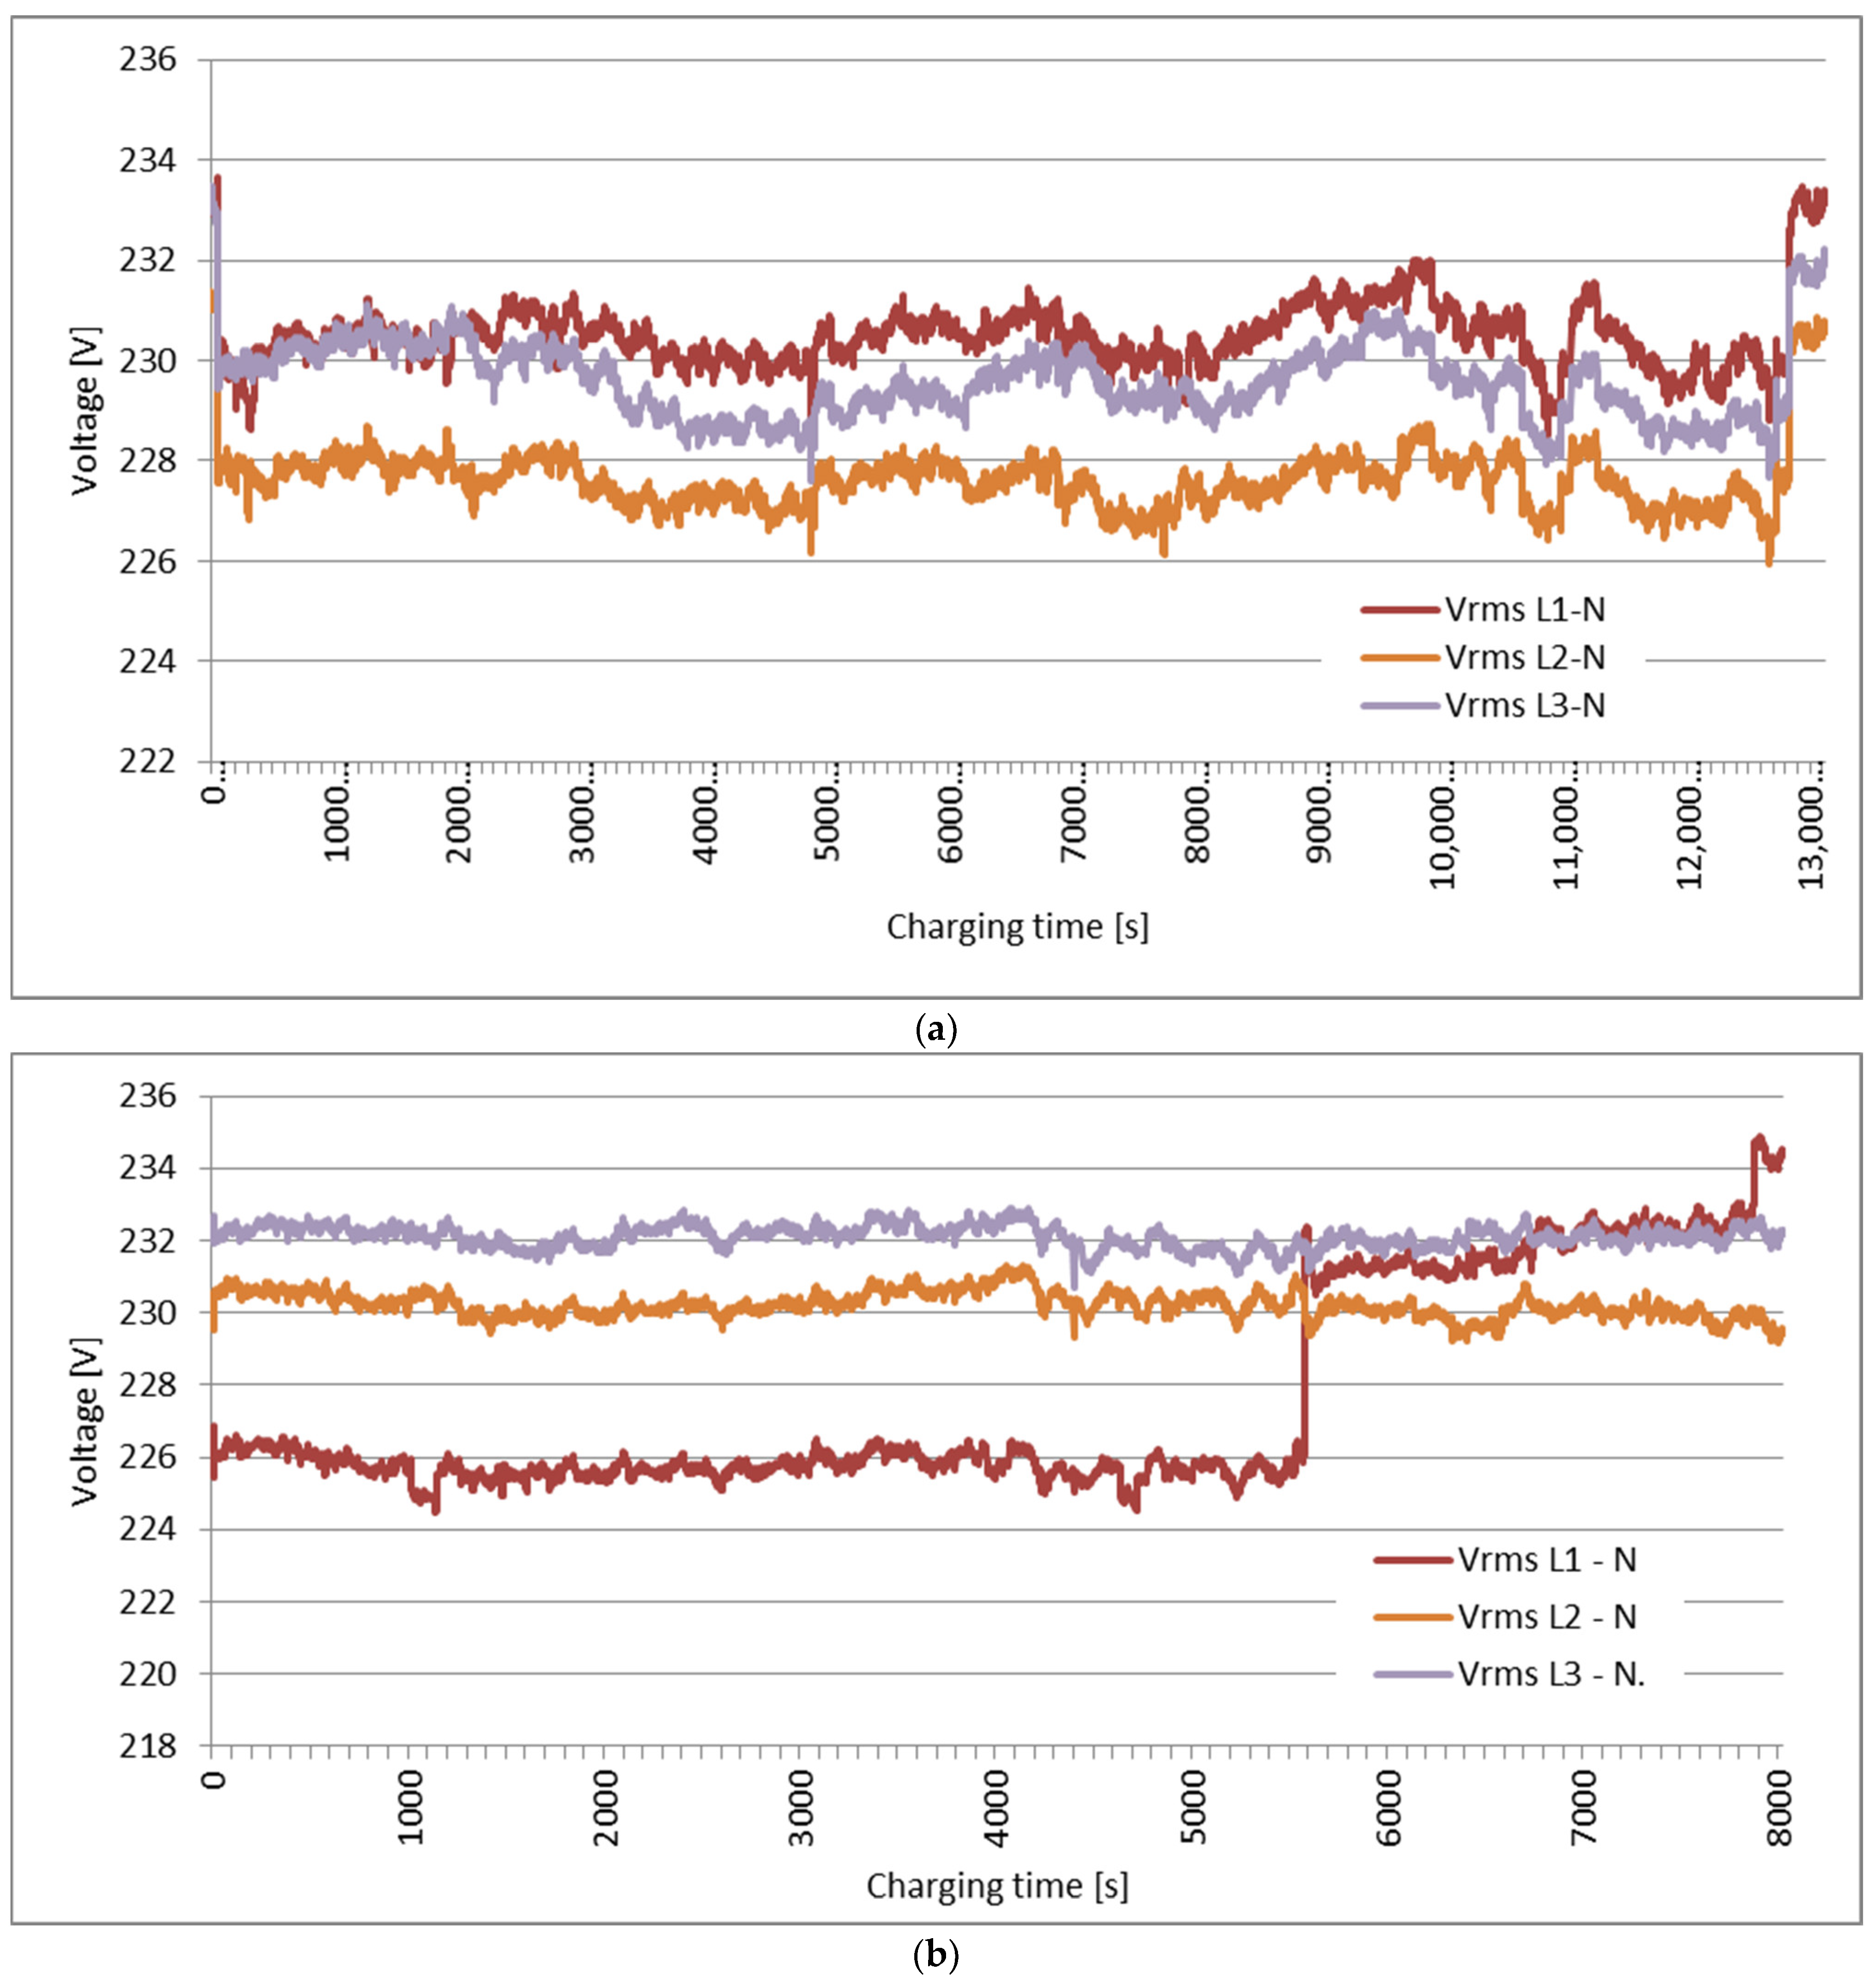
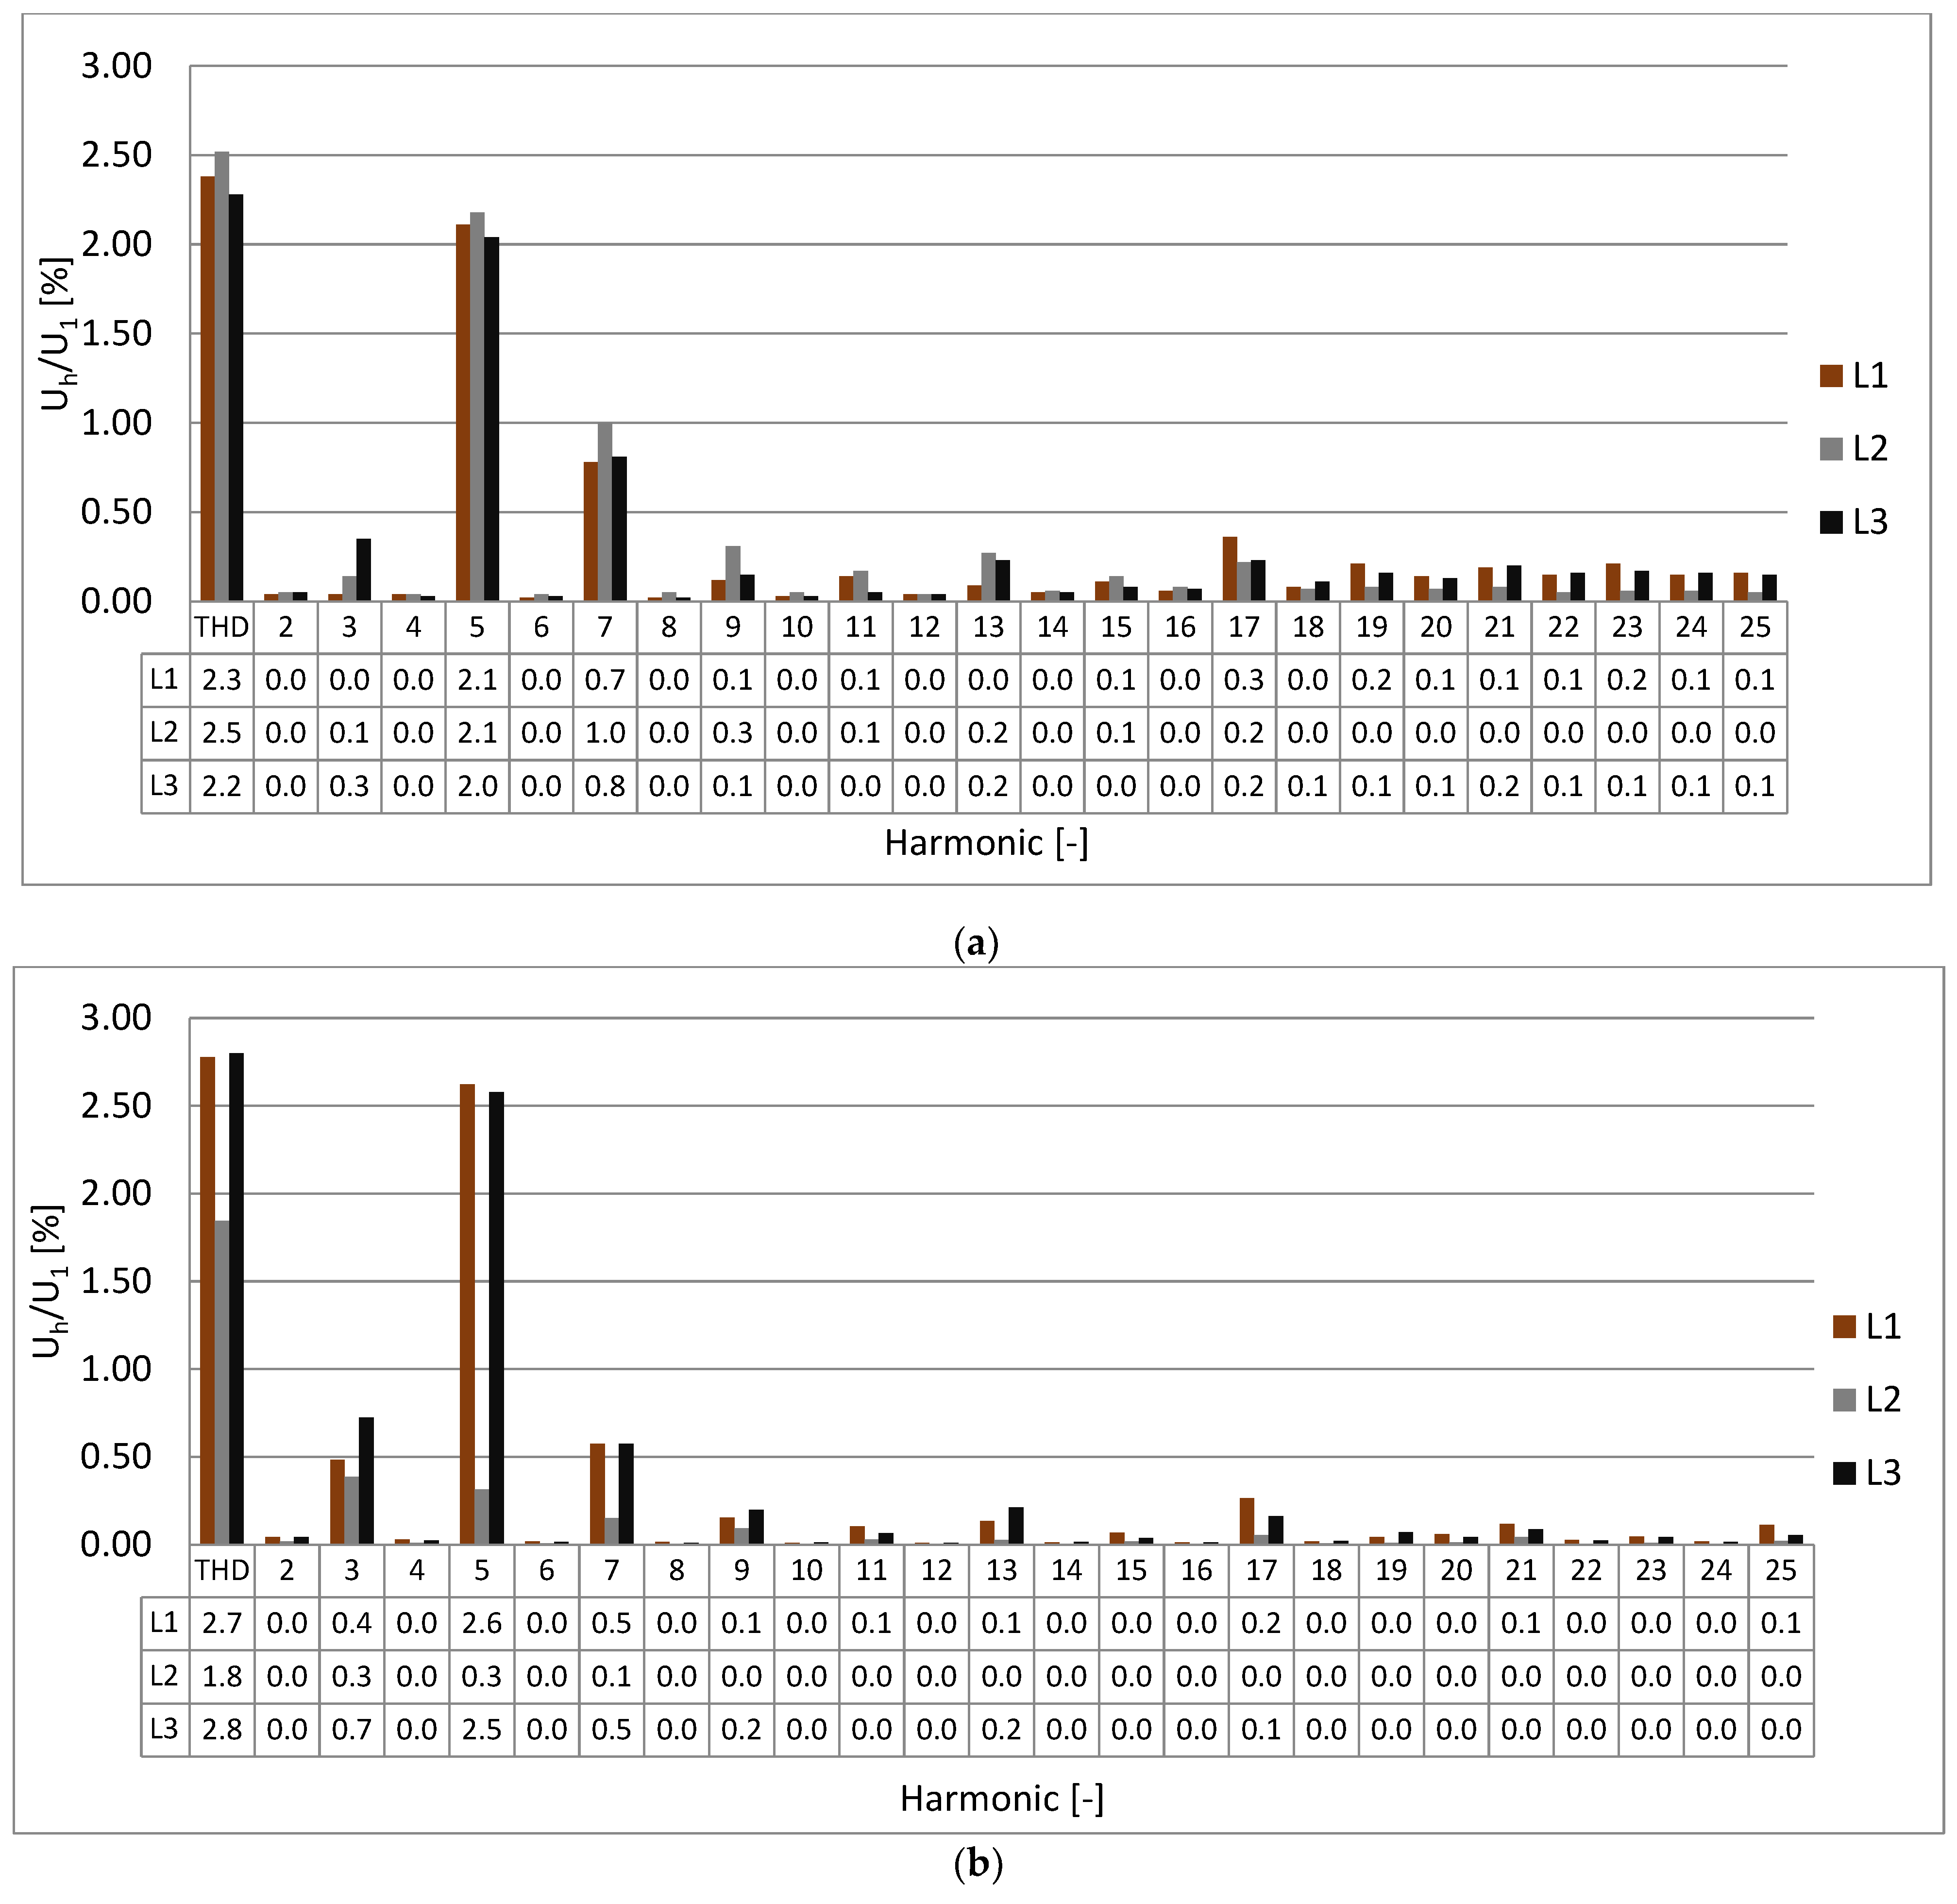
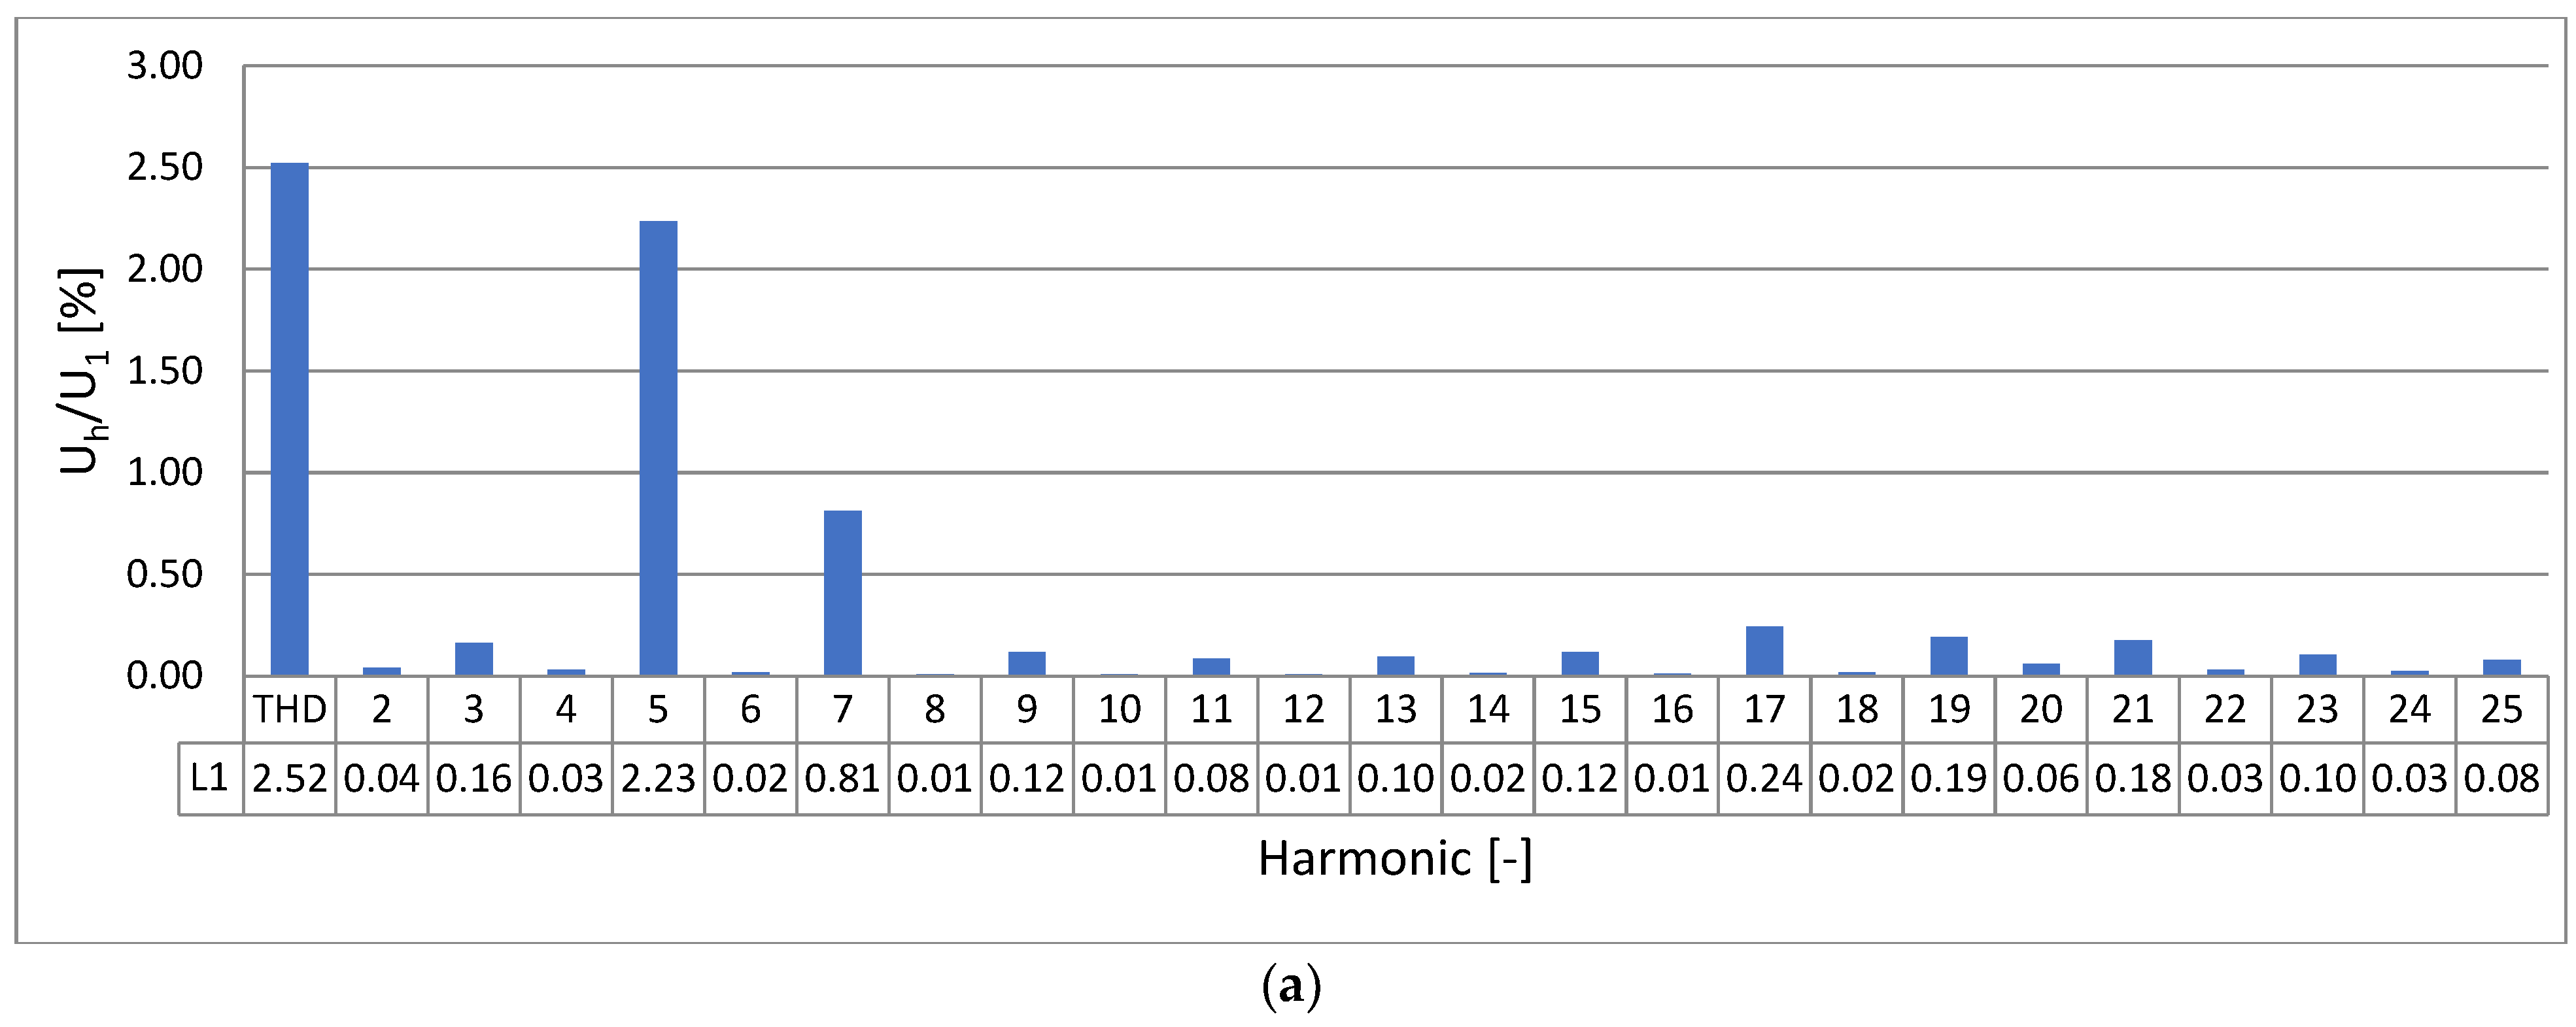
The harmonics spectrums registered during the charging process for the VW ID.3, the Fiat 500e, and the Kia eNIRO, are presented in the Figure 13 respectively. Only the first 25 harmonics are shown, because; components with orders over 25 are negligibly low.
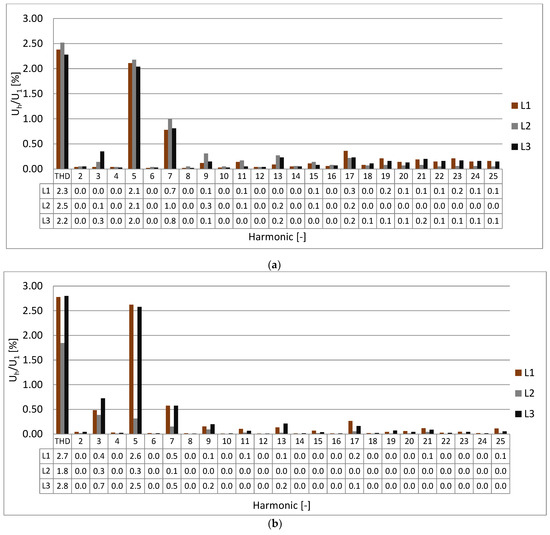
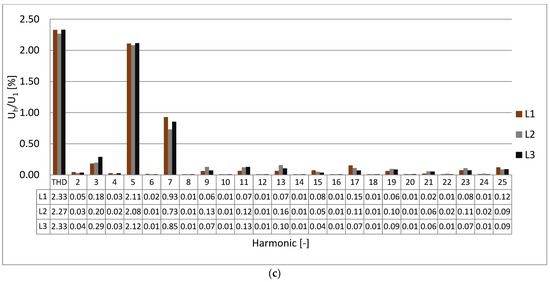
Figure 13.
THD and individual harmonic content for different electric vehicles: (a) for the VW ID.3; (b) for the Fiat 500e; (c) for the Kia e-NIRO.
The above-presented measurement results were obtained in similar weather conditions: a sunny spring day with a temperature of about 20 °C. The on-board charger’s parameters were also similar: 3 × 400 V AC, 11 kW. All tests indicate that nonlinear load, in this case the charger influences on the voltage and generates higher harmonics. In all cases, the highest values are for the third, fifth, and seventh harmonic. What is important is that we can see all the odd harmonics, and the levels of particular harmonics are different for all phases. It can be seen that the highest THD were registered for the Fiat 500e.
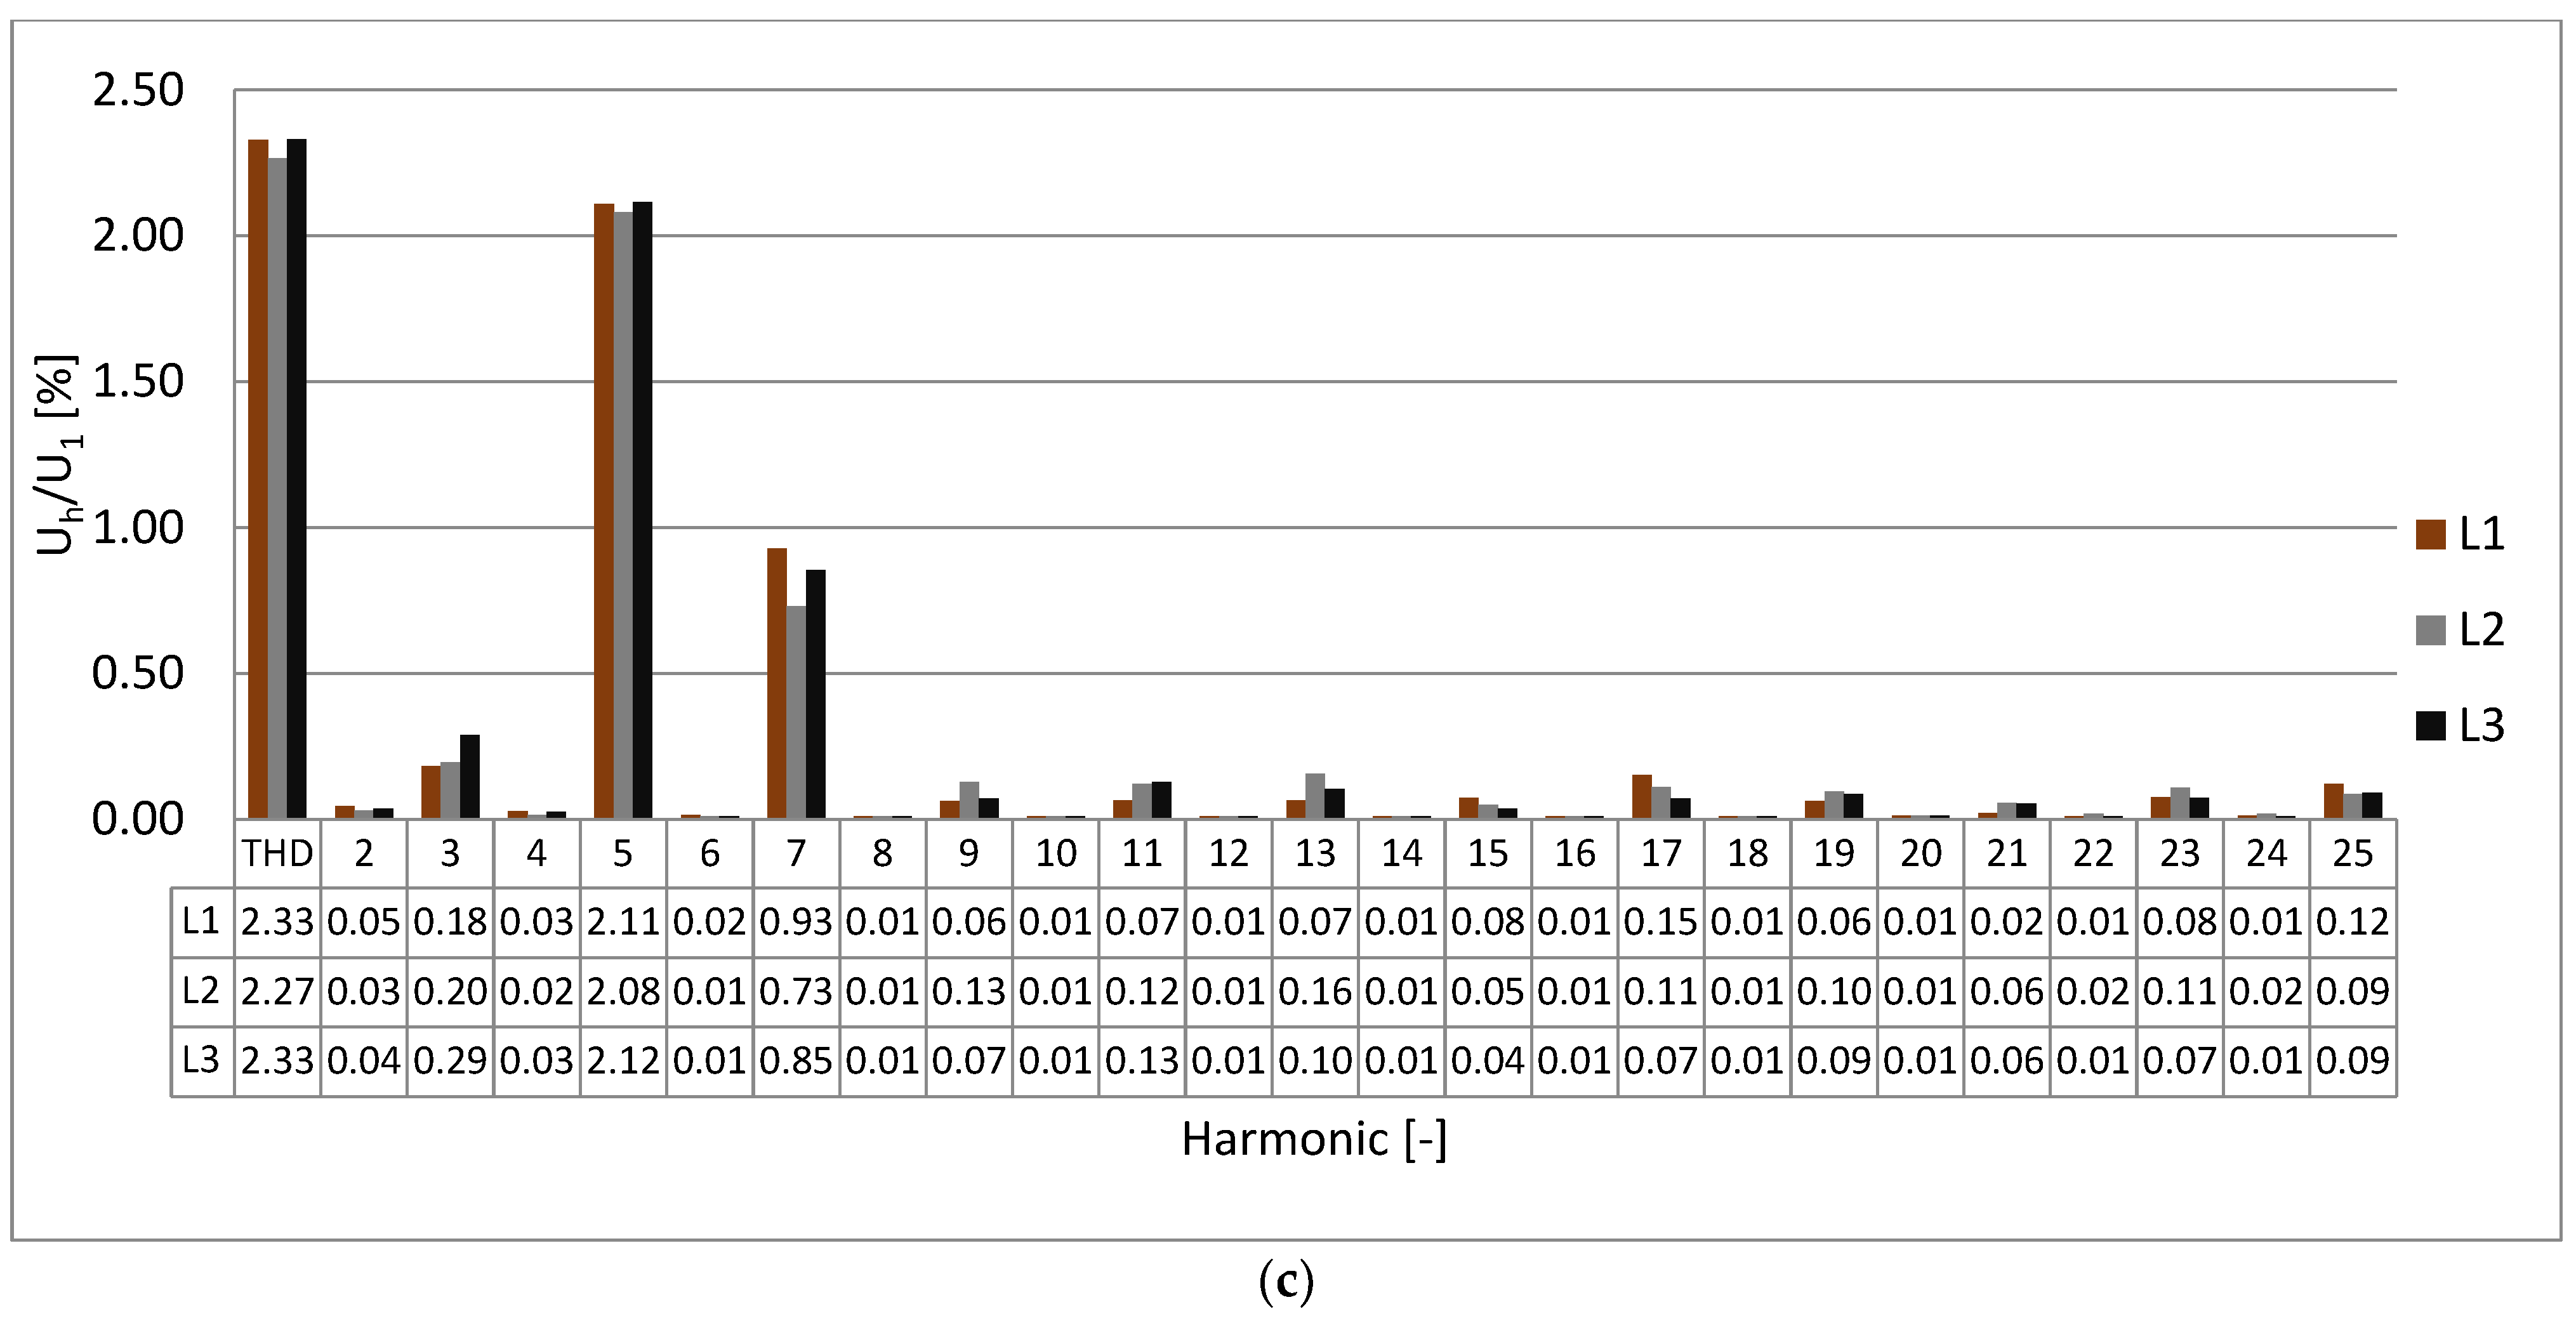
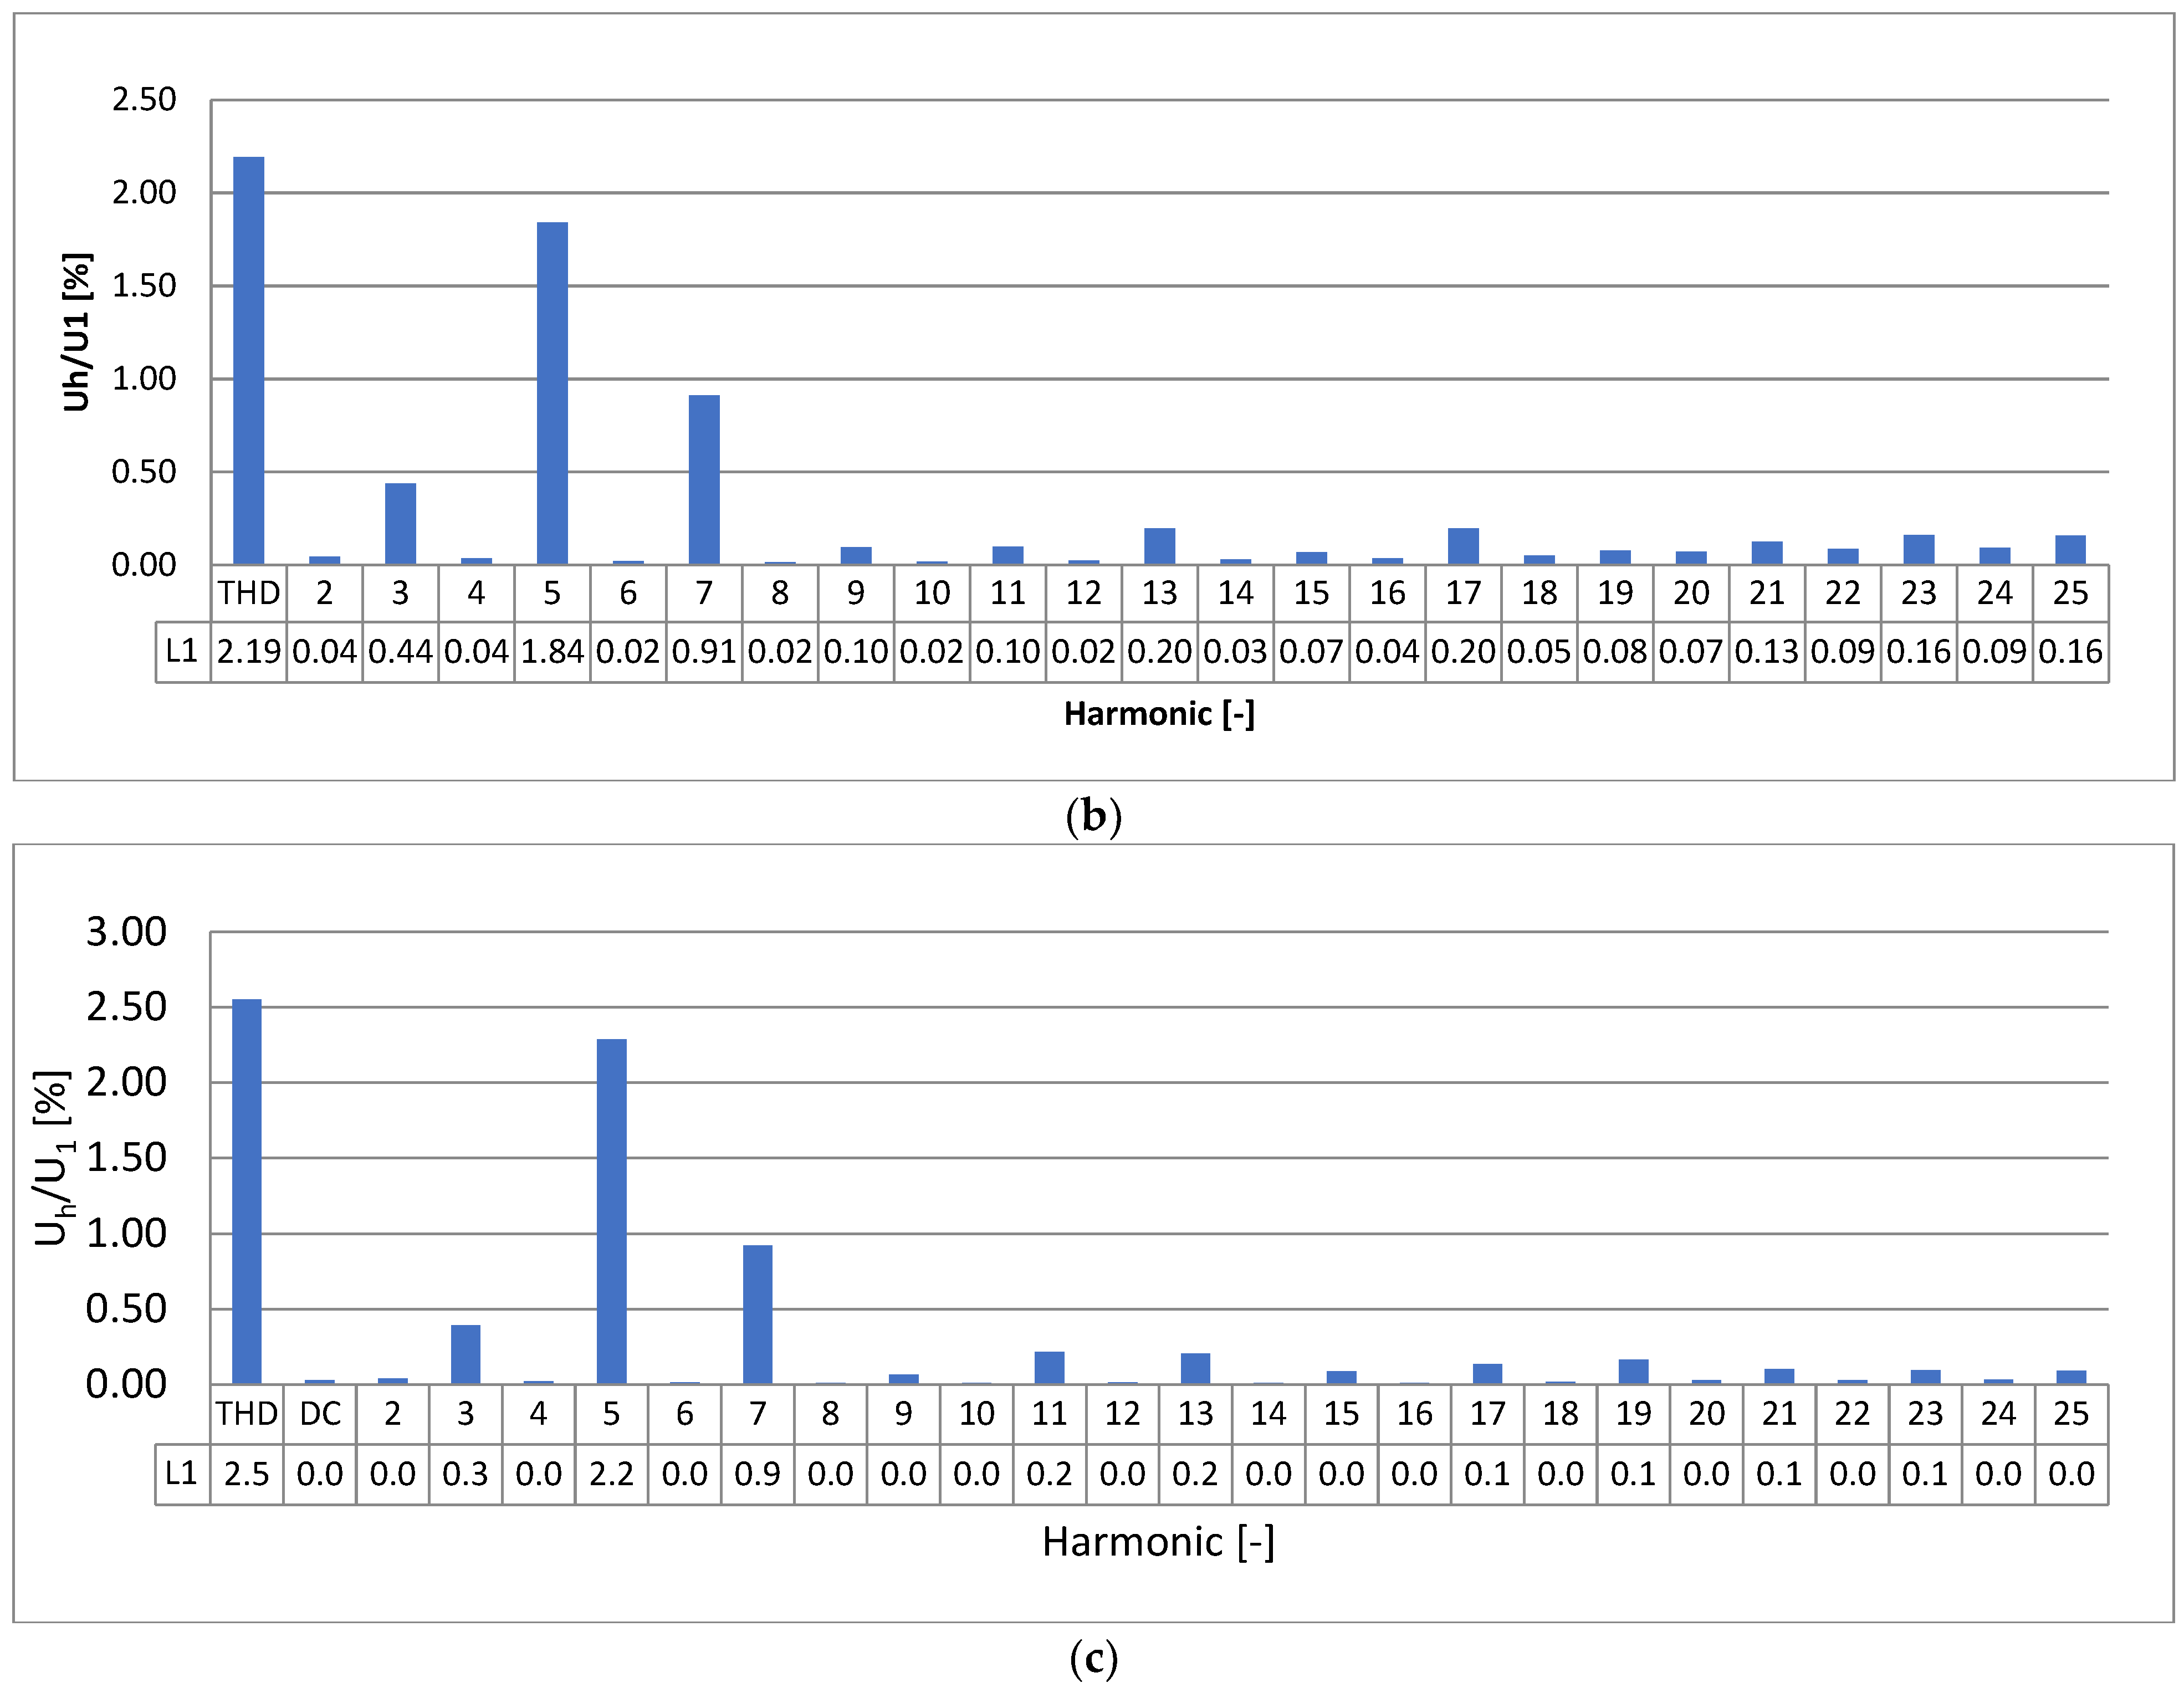
Figure 14 presents the harmonics content registered during the charging process, respectively, for the Alfa Romeo Tonale PHEV, the BMW C evolution (BMW Motorrad, Munich, Germany), and the E-Scooter ESA 800 (Electric Scooters Asia, Hong Kong, China). These batteries are charged from a single-phase socket (230 V AC); powers and currents are different for every charger.
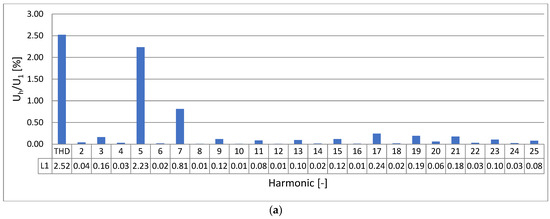
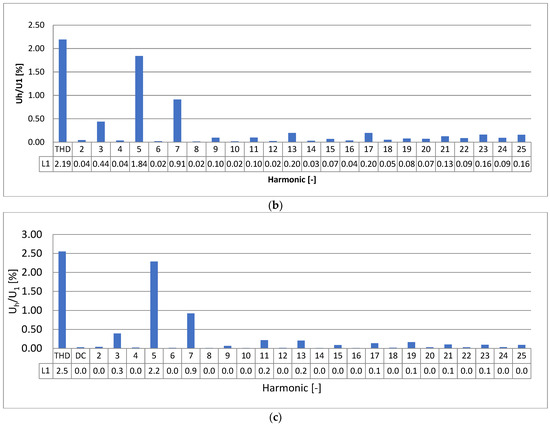
Figure 14.
THD and individual harmonic content for different electric vehicles: (a) for the Alfa Romeo Tonale PHEV; (b) for BMW C Evolution; (c) for the E-Scooter ESA 800 (kick ccooter).
Results are similar to those obtained for the three phase chargers. It should be noticed that the supply current was equal to 32 A for the Alfa Romeo, 10 A for the BMW, and 2 A for E-Scooter. This difference did not influence the harmonics but it influenced voltage symmetry; the highest current in one phase means lower voltage in that phase. In the case of the Alfa Romeo, that difference was equal to 3 V, while the cross-section of lines was equal to 6 mm2. Lower cross-sections will cause higher voltage drops and voltage asymmetry.
4. Discussion
The development of electromobility also poses a challenge for home electrical installations, especially from the point of view of the convenience of treating an electric car like a smartphone in the context of battery charging. However, due to the significant power of the load, it is necessary to analyze the condition of the installation and make users aware of how this process works.
One of the potential problems causing the incorrect operation of loads or a threat to users is power supply asymmetry. The reason for this condition may be a significant load on one phase, which results in an increase in the current in the neutral wire, as well as asymmetry in the power supply of other three-phase receivers. A partial solution to this problem may be to oversize the cross-section of the cables and place the charging point close to the connection. Power cables supplying single-family buildings are usually significantly oversized.
The analysis of current distortions, despite their seemingly small values up to several mA, proves the need to take these distortions into account in the design and operation of home electrical installations in the context of their safe use and, in particular, the selection of anti-shock protection capable of disconnecting the circuit when necessary at currents other than sinusoidal without causing unnecessary disconnections. The distribution of voltage harmonics, i.e., the influence of the non-linearity of the load (converter in the battery charging system), indicates that the fifth harmonic has highest value, and the THD does not exceed 3%. It seems that these values should not cause any concern; however, due to the numerous presences of non-linear receivers in households, attention should be paid to protection. They should operate equally effectively with sinusoidal and distorted currents and voltages.
Comparing the harmonic content for on-board and off-board chargers [36], it can be seen that in both cases, the harmonics of the following order have a significant share: 5, 7, 11, 13, 17, 19, 23, and 25. For on-board chargers, the above-mentioned significant harmonics content of the orders 3, 9, and 15 are also observed. This difference is related to the fact that in the case of off-board chargers, the charger’s influence on the network is measured before the transformer, whose winding on the network side is connected in a delta, and on the charger side in a Wye [53], so the zero sequence symmetrical components are not transferred. Our research concerns measurements on the low voltage side in the TN system, i.e., on the side of the transformer connected in a Wye, which result in the occurrence of zero sequence components and may affect the operation of other devices.
Based on the conducted research, the following conclusions, guidelines for both the users and designers of chargers installed in EVs, can be formulated:
- -
- All tested on-board battery chargers for EVs meet the requirements for the quality of electricity.
- -
- Charging the battery over 80% of its capacity is characterized by the possibility of dynamic changes in current consumption from the network, which, especially in the case of single-phase chargers, can lead to voltage asymmetry in the installation.
- -
- The occurring harmonics may result, depending on the power supply system, in the occurrence of zero, positive, or negative sequence components, which may affect the operation of other devices in the installation, i.e., by making their efficiency lower or increasing windings and insulation temperature; efforts should be made to reduce the share of higher harmonics.
- -
- Users must compare the power of the charger, especially line current, with the maximum line current and overcurrent protection of their installation. In the Alfa Tonale PHEV, we could use a charging current equal to 32 A, while typical lines and sockets at homes are designed for currents equal to 16 A. According to information obtained from car dealers, some producers limited maximum charging current to meet local legal requirements; e.g., for the Kia, 22 kW or 11 kW chargers, depending on country in which the car was sold, can be found.
- -
- High current single-phase chargers can be sources of voltage asymmetry in electrical installations.
- -
- It is strongly recommended to use RCD (type B) as electric shock protection equipment in circuits with chargers because of the possible harmonics and DC components.
The above comments may provide guidance for those designing home electrical installations. In the design and installation of a charging infrastructure for EVs, it is important to implement solutions such as harmonic filtering, power factor correction, and appropriate installation protection measures. These measures help reduce the potential negative impacts of the charging process on electrical systems and increase energy efficiency.
Author Contributions
Conceptualization, A.D.; methodology, A.D.; investigation, A.D and M.S.Ç.; writing—original draft preparation, A.D and M.S.Ç.; writing—review and editing, L.K. and M.T.G.; All authors have read and agreed to the published version of the manuscript.
Funding
This research was funded by the Polish Ministry of Science, grant number: 0212/SBAD/0614.
Data Availability Statement
The data presented in this study are available on request from the corresponding author.
Conflicts of Interest
The authors declare no conflict of interest.
References
- Saidi, K.; Omri, A. Reducing CO2 emissions in OECD countries: Do renewable and nuclear energy matter? Prog. Nucl. Energy 2020, 126, 103425. [Google Scholar] [CrossRef]
- Yoro, K.O.; Daramola, M.O. Chapter 1—CO2 emission sources, greenhouse gases, and the global warming effect. In Advances in Carbon Capture, 1st ed.; Rahimpour, M.R., Farsi, M., Makarem, M.A., Eds.; Elsevier: Amsterdam, The Netherlands, 2020; pp. 3–28. [Google Scholar] [CrossRef]
- Tian, X.; Zha, H.; Tian, Z.; Lang, G.; Li, L. Carbon emission reduction capability assessment based on synergistic optimization control of electric vehicle V2G and multiple types power supply. Energy Rep. 2024, 11, 1191–1198. [Google Scholar] [CrossRef]
- Zhao, X.; Hu, H.; Yuan, H.; Chu, X. How does adoption of electric vehicles reduce carbon emissions? Evidence from China. Heliyon 2023, 9, e20296. [Google Scholar] [CrossRef]
- Guo, X.; Sun, Y.; Ren, D. Life cycle carbon emission and cost-effectiveness analysis of electric vehicles in China. Energy Sustain. Dev. 2023, 72, 1–10. [Google Scholar] [CrossRef]
- Kuppusamy, S.; Magazine, M.J.; Rao, U. Impact of downstream emissions cap-and-trade policy on electric vehicle and clean utility adoption. Transp. Res. Part E Logist. Transp. Rev. 2023, 180, 103353. [Google Scholar] [CrossRef]
- Veza, I.; Asy’ari, M.Z.; Idris, M.; Epin, V.; Rizwanul Fattah, I.M.; Spraggon, M. Electric vehicle (EV) and driving towards sustainability: Comparison between EV, HEV, PHEV, and ICE vehicles to achieve net zero emissions by 2050 from EV. Alex. Eng. J. 2023, 82, 459–467. [Google Scholar] [CrossRef]
- Squalli, J. Greening the roads: Assessing the role of electric and hybrid vehicles in curbing CO2 emissions. J. Clean. Prod. 2024, 434, 139908. [Google Scholar] [CrossRef]
- Husain, I.; Ozpineci, B.; Islam, M.S.; Gurpinar, E.; Su, G.-J.; Yu, W.; Chowdhury, S.; Xue, L.; Rahman, D.; Sahu, R. Electric drive technology trends, challenges, and opportunities for future electric vehicles. Proc. IEEE 2021, 109, 1039–1059. [Google Scholar] [CrossRef]
- Tran, M.-K.; Bhatti, A.; Vrolyk, R.; Wong, D.; Panchal, S.; Fowler, M.; Fraser, R. A review of range extenders in battery electric vehicles: Current progress and future perspectives. World Electr. Veh. J. 2021, 12, 54. [Google Scholar] [CrossRef]
- Cetin, M.S.; Guler, H.; Gencoglu, M.T. Fuzzy Logic Based Battery Control System Design for Electric Vehicles. In Proceedings of the 2021 Innovations in Intelligent Systems and Applications Conference (ASYU), Elazig, Türkiye, 6–8 October 2021; IEEE: Piscataway, NJ, USA, 2021. [Google Scholar] [CrossRef]
- İnci, M.; Büyük, M.; Demir, M.H.; İlbey, G. A review and research on fuel cell electric vehicles: Topologies, power electronic converters, energy management methods, technical challenges, marketing and future aspects. Renew. Sustain. Energy Rev. 2021, 137, 110648. [Google Scholar] [CrossRef]
- Tian, Y.; Wang, Z.; Ji, X.; Ma, L.; Zhang, L.; Hong, X.; Zhang, N. A concept dual-motor powertrain for battery electric vehicles: Principle, modeling and mode-shift. Mech. Mach. Theory 2023, 185, 105330. [Google Scholar] [CrossRef]
- Liu, W.; Placke, T.; Chau, K.T. Overview of batteries and battery management for electric vehicles. Energy Rep. 2022, 8, 4058–4084. [Google Scholar] [CrossRef]
- Sharma, S.; Panwar, A.K.; Tripathi, M.M. Storage technologies for electric vehicles. J. Traffic Transp. Eng. Eng. Ed. 2020, 7, 340–361. [Google Scholar] [CrossRef]
- Karki, A.; Phuyal, S.; Tuladhar, D.; Basnet, S.; Shrestha, B. Status of pure electric vehicle power train technology and future prospects. Appl. Syst. Innov. 2020, 3, 35. [Google Scholar] [CrossRef]
- Khalid, R.; Conjobeeharry, V.; Sanai, A.S.; Brown, C.T.H.; Afrouzi, H.N.; Hassan, A. The Feasibility and Analysis of Electric Taxi Vehicles in Singapore: A Review. Future Energy 2023, 2, 38–48. [Google Scholar] [CrossRef]
- Banagar, I.; Andwari, A.M.; Mehranfar, S.; Könnö, J.; Kurvinen, E. Electric vehicles’ powertrain systems architectures design complexity. Future Technol. 2023, 2, 1–4. [Google Scholar] [CrossRef]
- Rajper, S.Z.; Albrecht, J. Prospects of electric vehicles in the developing countries: A literature review. Sustainability 2020, 12, 1906. [Google Scholar] [CrossRef]
- Shen, Y.-S.; Huang, G.-T.; Chang-Chien, C.-L.; Huang, L.H.; Kuo, C.-H.; Hu, A.H. The impact of passenger electric vehicles on carbon reduction and environmental impact under the 2050 net zero policy in Taiwan. Energy Policy 2023, 183, 113838. [Google Scholar] [CrossRef]
- Albrechtowicz, P. Electric vehicle impact on the environment in terms of the electric energy source—Case study. Energy Rep. 2023, 9, 3813–3821. [Google Scholar] [CrossRef]
- Rapson, D.S.; Muehlegger, E. The economics of electric vehicles. Rev. Environ. Econ. Policy 2023, 17, 274–294. [Google Scholar] [CrossRef]
- Liu, Z. Impact of vehicle purchase tax exemption on electric vehicle sales: Evidence from China’s automotive industry. Energy Strateg. Rev. 2023, 49, 101148. [Google Scholar] [CrossRef]
- Das, H.S.; Rahman, M.M.; Li, S.; Tan, C.W. Electric vehicles standards, charging infrastructure, and impact on grid integration: A technological review. Renew. Sustain. Energy Rev. 2020, 120, 109618. [Google Scholar] [CrossRef]
- Kapustin, N.O.; Grushevenko, D.A. Long-term electric vehicles outlook and their potential impact on electric grid. Energy Policy 2020, 137, 111103. [Google Scholar] [CrossRef]
- Iqbal, A.; Waqar, A.; Madurai Elavarasan, R.; Premkumar, M.; Ahmed, T.; Subramaniam, U.; Mekhilef, S. Stability assessment and performance analysis of new controller for power quality conditioning in microgrids. Int. Trans. Electr. Energy Syst. 2021, 31, e12891. [Google Scholar] [CrossRef]
- Morales-Velazquez, L.; Romero-Troncoso, R.d.J.; Herrera-Ruiz, G.; Morinigo-Sotelo, D.; Osornio-Rios, R.A. Smart sensor network for power quality monitoring in electrical installations. Measurement 2017, 103, 133–142. [Google Scholar] [CrossRef]
- Sivaraman, P.; Sharmeela, C. Chapter 2—Power system harmonics. In Power Quality in Modern Power Systems, 1st ed.; Sanjeevikumar, P., Sharmeela, C., Holm-Nielsen, J.B., Sivaraman, P., Eds.; Elsevier: Amsterdam, The Netherlands, 2021; pp. 61–103. [Google Scholar] [CrossRef]
- Sharew, E.A.; Kefale, H.A.; Werkie, Y.G. Power quality and performance analysis of grid-connected solar pv system based on recent grid integration requirements. Int. J. Photoenergy 2021, 2021, 4281768. [Google Scholar] [CrossRef]
- Han, X.; Jiang, J.; Zhang, C.; Wen, Z.; Chen, G.; Liu, Y. Research on quality problems management of electric power equipment based on knowledge–data fusion method. IET Gener. Transm. Distrib. 2020, 14, 745–751. [Google Scholar] [CrossRef]
- Martinez, R.; Castro, P.; Arroyo, A.; Manana, M.; Galan, N.; Moreno, F.S.; Bustamante, S.; Laso, A. Techniques to locate the origin of power quality disturbances in a power system: A review. Sustainability 2022, 14, 7428. [Google Scholar] [CrossRef]
- Stanko, P.; Reguľa, M.; Otčenášová, A.; Tkáč, M. The influence of the electric vehicle charging station on the power supply network with regard to power quality. Transp. Res. Procedia 2023, 74, 876–883. [Google Scholar] [CrossRef]
- Torres, S.; Durán, I.; Marulanda, A.; Pavas, A.; Quirós-Tortós, J. Electric vehicles and power quality in low voltage networks: Real data analysis and modeling. Appl. Energy 2022, 305, 117718. [Google Scholar] [CrossRef]
- İnci, M.; Bayındır, K.Ç. Single-stage vehicular fuel cell system with harmonic elimination capability to suppress distortion effects of electric vehicle parking lots. J. Power Sources 2024, 597, 234175. [Google Scholar] [CrossRef]
- Misra, R.; Paudyal, S.; Ceylan, O.; Mandal, P. Harmonic distortion minimization in power grids with wind and electric vehicles. Energies 2017, 10, 932. [Google Scholar] [CrossRef]
- Sudha, S.; Bollen, L.; Bollen, M. Impact of Electric Vehicle Charging on the Power Grid; Technical Report; Luleå University of Technology: Luleå, Sweden, 2021. [Google Scholar]
- Shoji, T.; Noda, T. A study of harmonics in a dedicated cable supply system to feed EV fast chargers. Electr. Power Syst. Res. 2023, 221, 109421. [Google Scholar] [CrossRef]
- Ziyat, I.; Gola, A.; Palmer, P.R.; Makonin, S.; Popowich, F. EV Charging Profiles and Waveforms Dataset (EV-CPW) and Associated Power Quality Analysis. IEEE Access 2023, 11, 138445–138456. [Google Scholar] [CrossRef]
- Sivaraman, P.; Sharmeela, C. Chapter 5—Power quality problems associated with electric vehicle charging infrastructure. In Power Quality in Modern Power Systems, 1st ed.; Sanjeevikumar, P., Sharmeela, C., Holm-Nielsen, J.B., Sivaraman, P., Eds.; Elsevier: Amsterdam, The Netherlands, 2021; pp. 151–161. [Google Scholar] [CrossRef]
- Rodríguez-Pajarón, P.; Hernández, A.; Milanović, J.V. Probabilistic assessment of the impact of electric vehicles and nonlinear loads on power quality in residential networks. Int. J. Electr. Power Energy Syst. 2021, 129, 106807. [Google Scholar] [CrossRef]
- Abdelsalam, A.A.; Hassanin, A.M.; Hasanien, H.M. Categorisation of power quality problems using long short-term memory networks. IET Gener. Transm. Distrib. 2021, 15, 1626–1639. [Google Scholar] [CrossRef]
- Lumbreras, D.; Gálvez, E.; Collado, A.; Zaragoza, J. Trends in power quality, harmonic mitigation and standards for light and heavy industries: A review. Energies 2020, 13, 5792. [Google Scholar] [CrossRef]
- Caro, L.M.; Ramos, G.; Rauma, K.; Rodriguez, D.F.C.; Martinez, D.M.; Rehtanz, C. State of charge influence on the harmonic distortion from electric vehicle charging. IEEE Trans. Ind. Appl. 2021, 57, 2077–2088. [Google Scholar] [CrossRef]
- Holmes, D.G.; Lipo, T.A. Pulse Width Modulation for Power Converters: Principles and Practice, 1st ed.; Wiley-IEEE Press: Hoboken, NJ, USA, 2003; pp. 57–60. [Google Scholar]
- Barbie, E.; Rabinovici, R.; Kuperman, A. Closed-form analytic expression of total harmonic distortion in single-phase multilevel inverters with staircase modulation. IEEE Trans. Ind. Electron. 2020, 67, 5213–5216. [Google Scholar] [CrossRef]
- Arranz-Gimon, A.; Zorita-Lamadrid, A.; Morinigo-Sotelo, D.; Duque-Perez, O. A review of total harmonic distortion factors for the measurement of harmonic and interharmonic pollution in modern power systems. Energies 2021, 14, 6467. [Google Scholar] [CrossRef]
- Power Quality Blog. Available online: https://powerquality.blog/2021/07/22/standard-en-50160-voltage-characteristics-of-public-distribution-systems/ (accessed on 17 April 2024).
- Wanik, M. Harmonic measurement and analysis during electric vehicle charging. Engineering 2013, 05, 215–220. [Google Scholar] [CrossRef]
- Ul-Haq, A.; Perwaiz, A.; Azhar, M.; Ullah Awan, S. Harmonic Distortion in Distribution System Due to Single-Phase Electric Vehicle Charging. In Proceedings of the 2018 2nd International Conference on Green Energy and Applications (ICGEA), Singapore, 24–26 March 2018; IEEE: Piscataway, NJ, USA, 2018. [Google Scholar] [CrossRef]
- PN-EN 50160:2023-10; Voltage Characteristics of Electricity Supplied by Public Electricity Networks. PKN: Warszawa, Poland, 2023.
- Shareef, H.; Islam, M.M.; Mohamed, A. A review of the stage-of-the-art charging technologies, placement methodologies, and impacts of electric vehicles. Renew. Sustain. Energy Rev. 2016, 64, 403–420. [Google Scholar] [CrossRef]
- IEC 61851-1; Electric Vehicle Conductive Charging System—Part 1: GENERAL Requirements. IEC: Geneva, Switzerland, 2014.
- Thomas, P.; Chacko, F. Electric vehicle integration to distribution grid ensuring quality power exchange. In Proceedings of the 2014 International Conference on Power Signals Control and Computations (EPSCICON 2014), Thrissur, India, 6–11 January 2014. [Google Scholar] [CrossRef]


Disclaimer/Publisher’s Note: The statements, opinions and data contained in all publications are solely those of the individual author(s) and contributor(s) and not of MDPI and/or the editor(s). MDPI and/or the editor(s) disclaim responsibility for any injury to people or property resulting from any ideas, methods, instructions or products referred to in the content. |
© 2024 by the authors. Licensee MDPI, Basel, Switzerland. This article is an open access article distributed under the terms and conditions of the Creative Commons Attribution (CC BY) license (https://creativecommons.org/licenses/by/4.0/).