Abstract
In recent years, the construction of new railway tunnels worldwide has become increasingly challenging due to larger cross-sections, deeper burial depths, higher in situ stress, and more complex geological conditions. During both construction and operation, some tunnels have encountered significant issues with floor heave. This paper begins by identifying the primary causes of deformation and instability in tunnel floor structures through an investigation and statistical analysis. It then examines floor heave across more than 20 railway lines, summarizing the types, generation mechanisms, and mechanical models associated with this issue. Additionally, extensive survey data indicate that tunnel floor heave is most likely to occur in gently inclined thin-layered rock masses. Therefore, using a tunnel passing through the plate suture zone in such a rock mass as a case study, numerical simulations, theoretical analyses, and on-site monitoring were conducted. This study systematically analyzed the influence of single and multiple factors, as well as the mechanical behavior of the support system, on tunnel floor heave in gently inclined thin-layered surrounding rock. Furthermore, several key models were proposed: a tunnel floor heave estimation and load formula based on a mechanical model, a dynamic relationship between surrounding rock support force and tunnel floor heave using the Nishihara model, a tunnel floor settlement estimation formula based on deformation statistics, and a tunnel floor heave energy prediction model utilizing the B-P neural network algorithm. These conclusions have been validated and widely applied in practical engineering, providing a robust theoretical foundation and technical support for future tunnel construction.
1. Introduction
Tunnel floor heave represents a significant and challenging issue in underground engineering. This phenomenon is often intricately linked to both geological and construction conditions. Geological factors include the mechanical properties of rock and soil, the distribution of aquifers, and the complexity of the rock mass structure. Construction-related factors encompass the design of tunnel support systems, construction techniques, and variations in load. These factors collectively influence the development and severity of tunnel floor heave. Such heave not only compromises the structural stability of the tunnel but can also have considerable effects on construction safety, operational efficiency, and maintenance expenses. Consequently, thorough investigations and comprehensive analyses are essential. Mastering the primary influencing factors and developing accurate load-displacement inversion formulas and intelligent models to predict floor heave are crucial. Only through these measures can we effectively manage its progression and implement scientifically based mitigation strategies. As a result, researchers worldwide have undertaken extensive studies from various perspectives to address this issue. Despite some advancements, many technical challenges and practical difficulties remain unresolved regarding floor heave.
Liu et al. [1] employed the finite difference program FLAC3D for a numerical analysis to investigate the impact of various construction schemes on tunnel floor heave. Sakhno et al. [2] utilized ANSYS to examine how rock moisture content affects tunnel floor heave. Perry et al. [3] also used FLAC3D to validate the effectiveness of floor heave control measures. Several researchers have explored the failure mechanisms of tunnel floors, the classification systems for tunnel floor quality, the causes of tunnel floor heave, the factors influencing floor uplift, and the deformation behavior and failure characteristics of tunnel floors [4,5,6,7,8]. In studies related to gently inclined faults, scholars have identified these faults as primary contributors to the collapse of surrounding rock. They have also found that the spatial orientation of joint dips in the surrounding rock can lead to varying degrees of stress redistribution. Moreover, changes in bedding angles have been shown to affect the uniaxial compressive strength and elastic modulus of the rock [9,10,11,12,13]. The F-test is used to determine whether the parameters in a statistical model can estimate a population [14], and the backpropagation (BP) neural network serves as a gradient descent algorithm for multilayer artificial neural networks [15]. Li [16] examined the relevant characteristics and specific influencing factors of floor heave in soft rock roadways. Lu et al. [17] proposed an inversion method for determining rock creep parameters in tunnel floor heave sections using deep learning. Huang et al. [18] introduced an improved Swin Transformer, while Min et al. [19] developed an artificial neural network model to predict the bearing capacity loss in cracked multi-arch tunnels. Machine learning has indeed begun to play a significant role in geomechanics and rock mechanics within engineering and architecture [20,21,22,23]. Fu et al. [24] rigorously accounted for the viscoelastic–plastic characteristics of surrounding rock and the actual load path during the excavation and support stages, deriving analytical solutions for displacement, stress, and the plastic radius as functions of time. Ahn et al. [25] established a new analytical solution for elastic contact between the lining and ground. Building on the Nishihara model, Gao et al. [26], Zhu et al. [27], and Xia et al. [28] developed corresponding assumptions and studies, leading to the derivation of one-dimensional and three-dimensional creep constitutive equations for soft rock, a novel nonlinear creep constitutive model for frozen sand, and the viscoelastic–viscoplastic analytical solution for circular tunnels.
Through comprehensive field investigations and a detailed data analysis, this study identifies, for the first time, the pronounced vulnerability of gently inclined thin rock masses to tunnel floor heave, challenging prior macro-level research conclusions. The findings underscore the significant impact of rock mass structure on tunnel floor deformation. Additionally, key influencing factors are identified and corroborated with on-site monitoring data. While existing research broadly addresses these factors, the dynamic interaction between the ultimate bearing capacity of the tunnel floor, its maximum deformation, and the supporting force from surrounding rock remains underexplored. Building on the investigation and analytical results, this paper delves into the formation mechanism of tunnel floor heave, develops a mechanical model specific to gently inclined thin-layered rock masses, and presents a load-displacement inversion formula for tunnel bottoms. Moreover, innovative advances have been made in intelligent prediction. Unlike most existing models, this research has been successfully implemented in practical engineering projects, even when traditional guidance for tunnel construction has fallen short. This confirms its effectiveness and offers a robust theoretical framework and technical support for future tunnel engineering endeavors.
2. Statistical Analysis of Tunnel Floor Heave
2.1. Statistical Analysis of Tunnel Floor Heave Locations
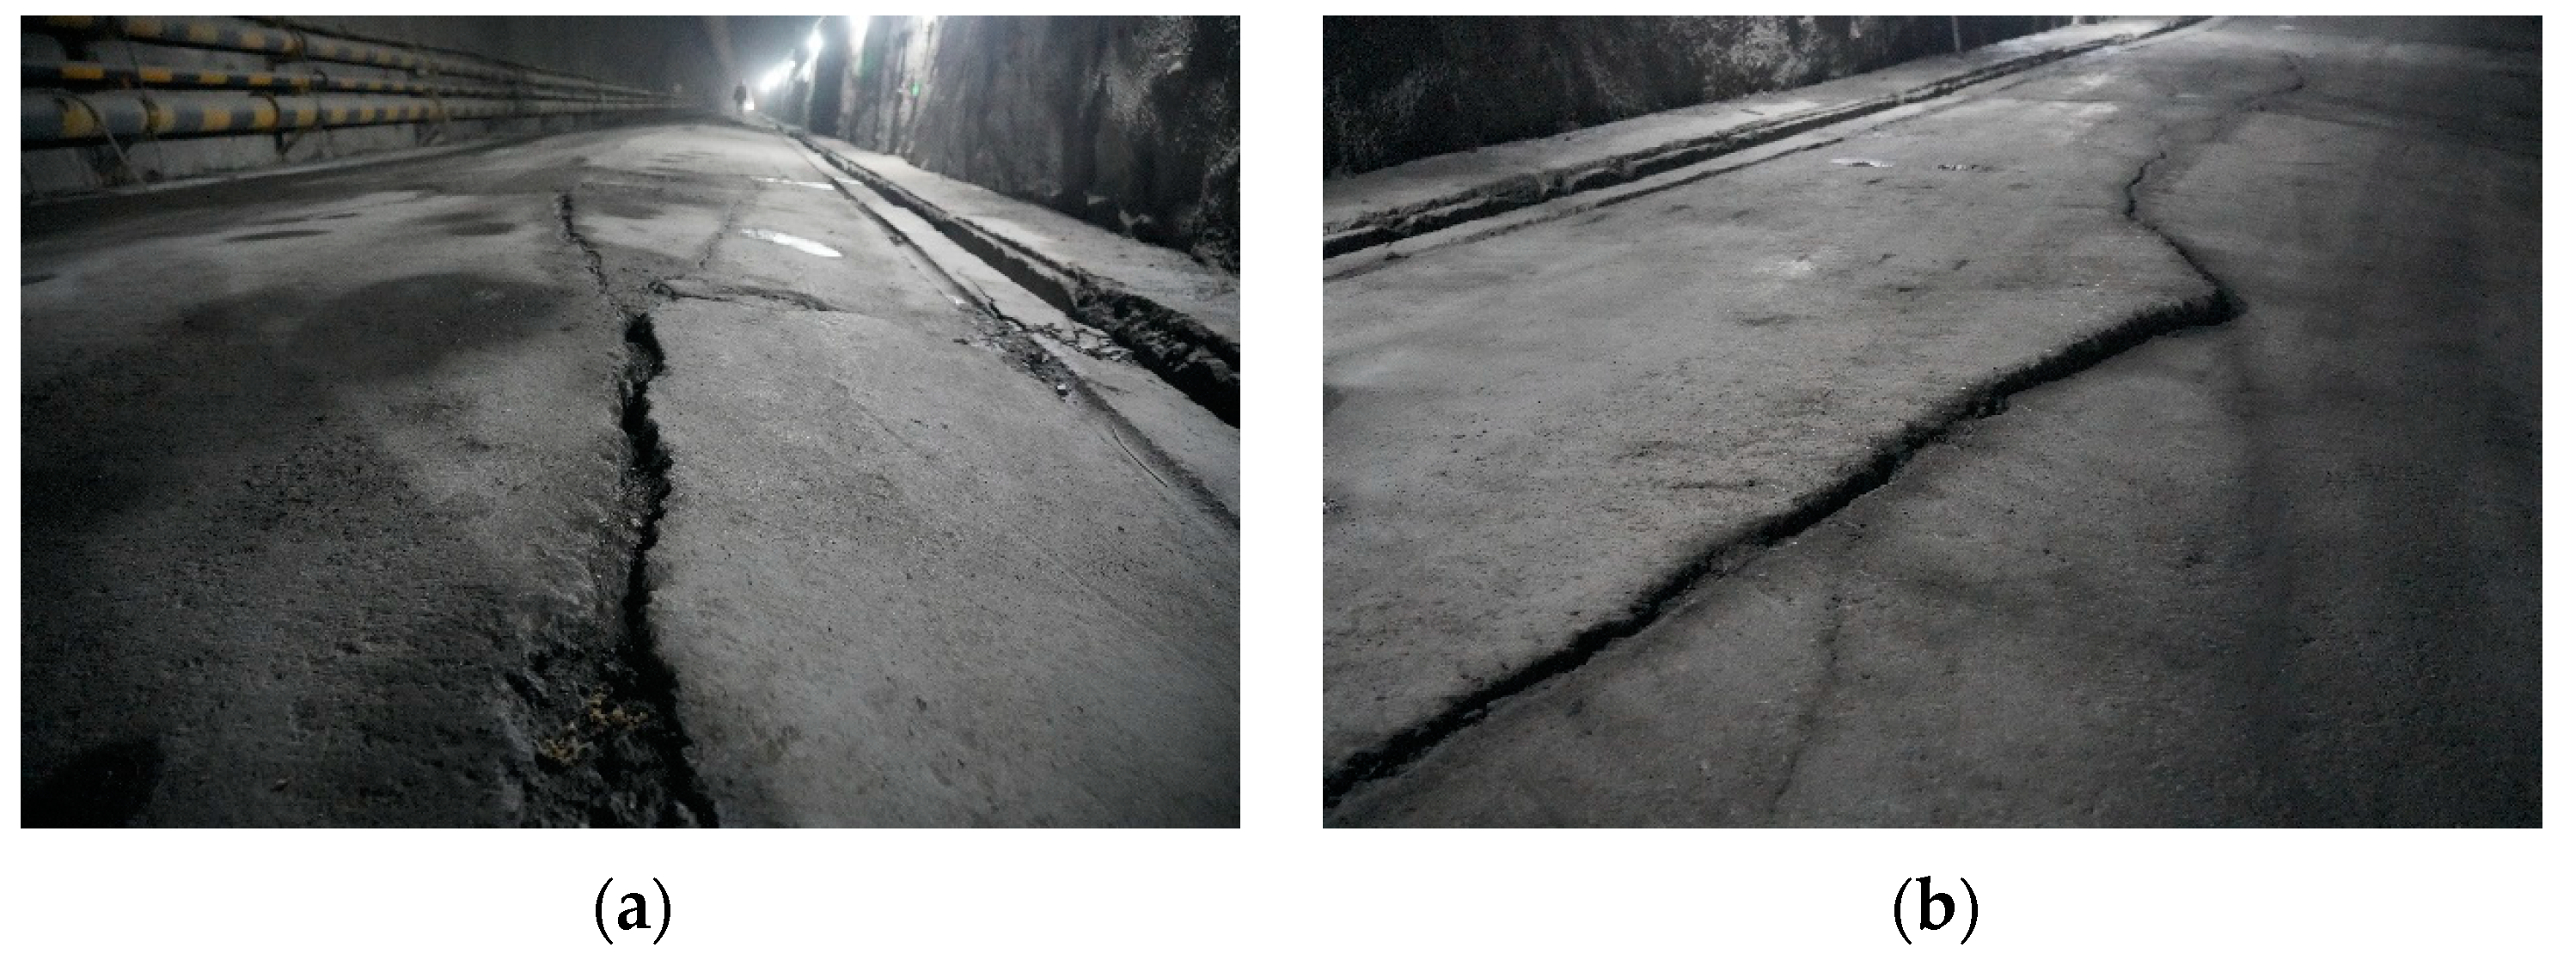
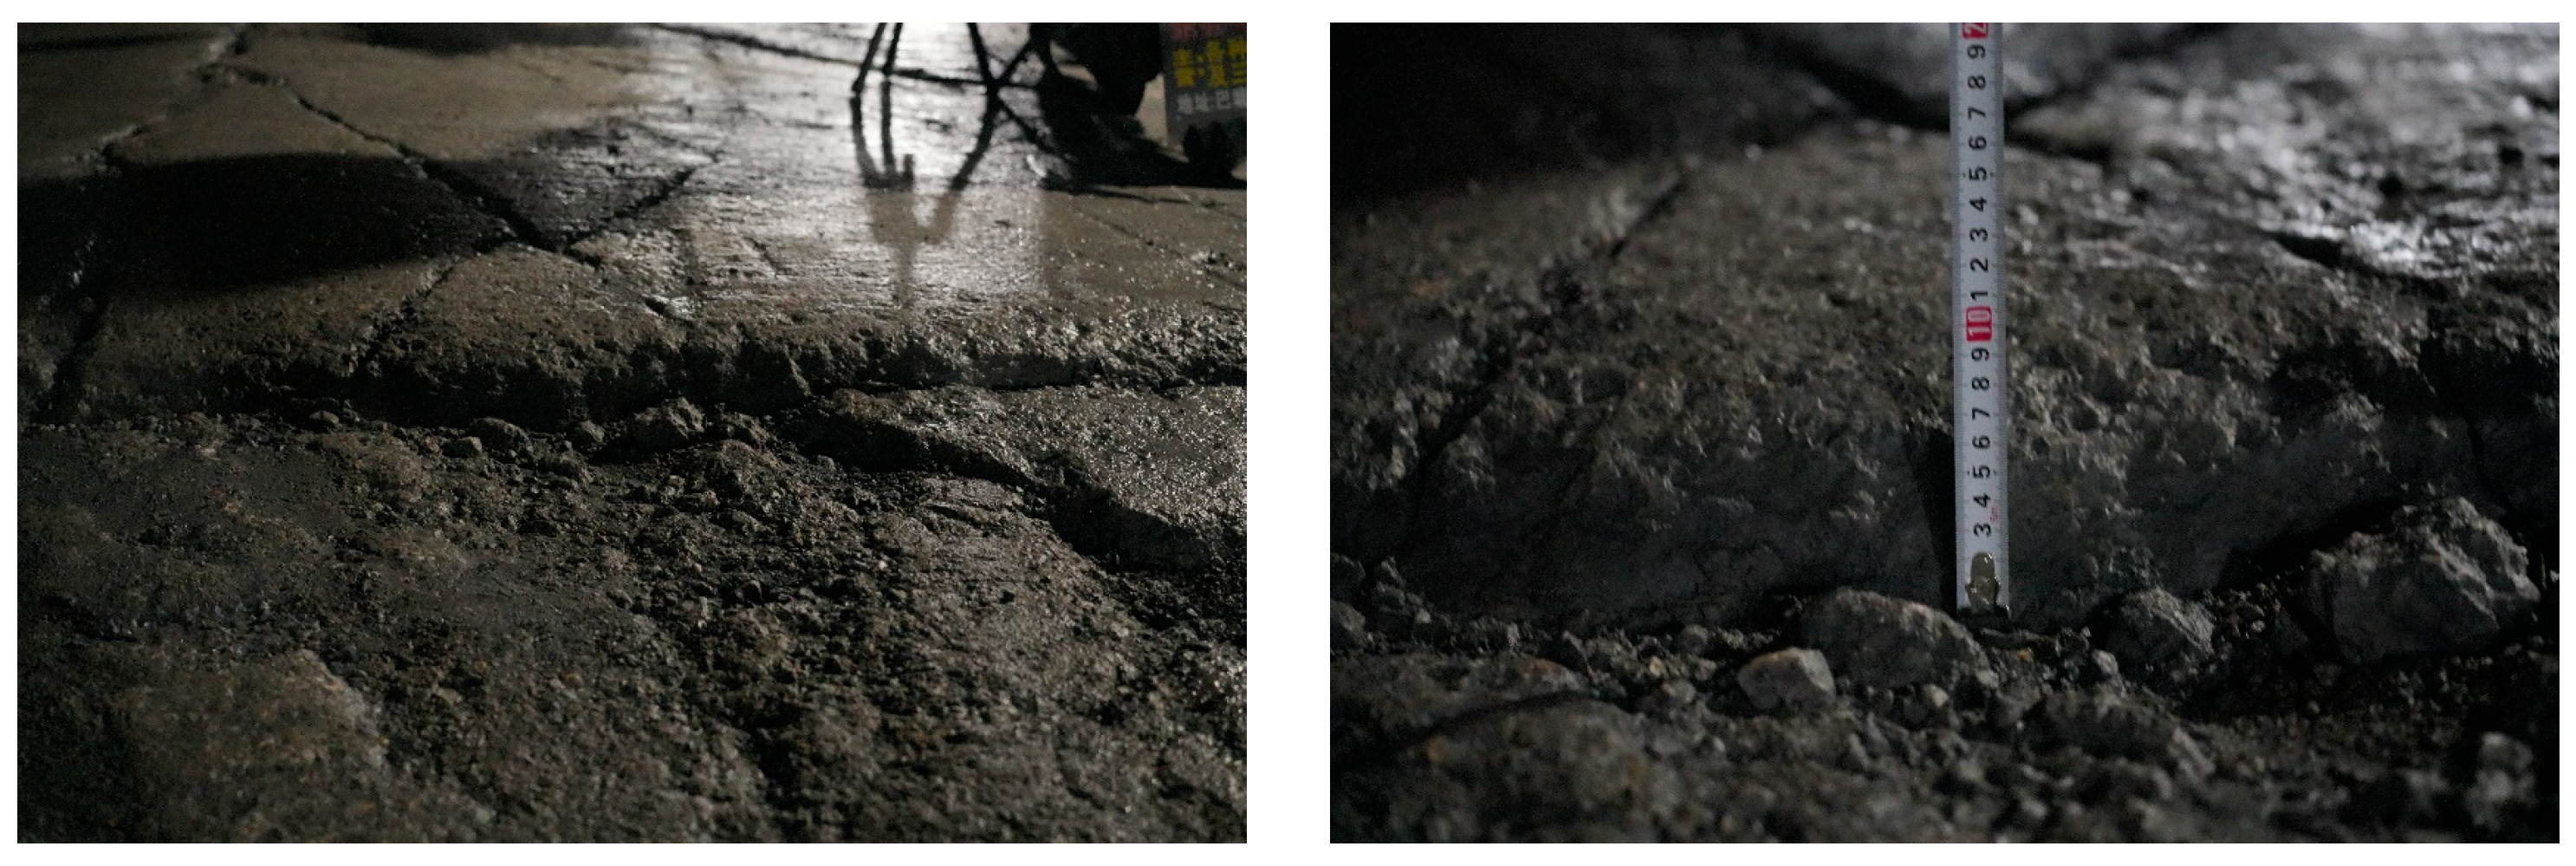
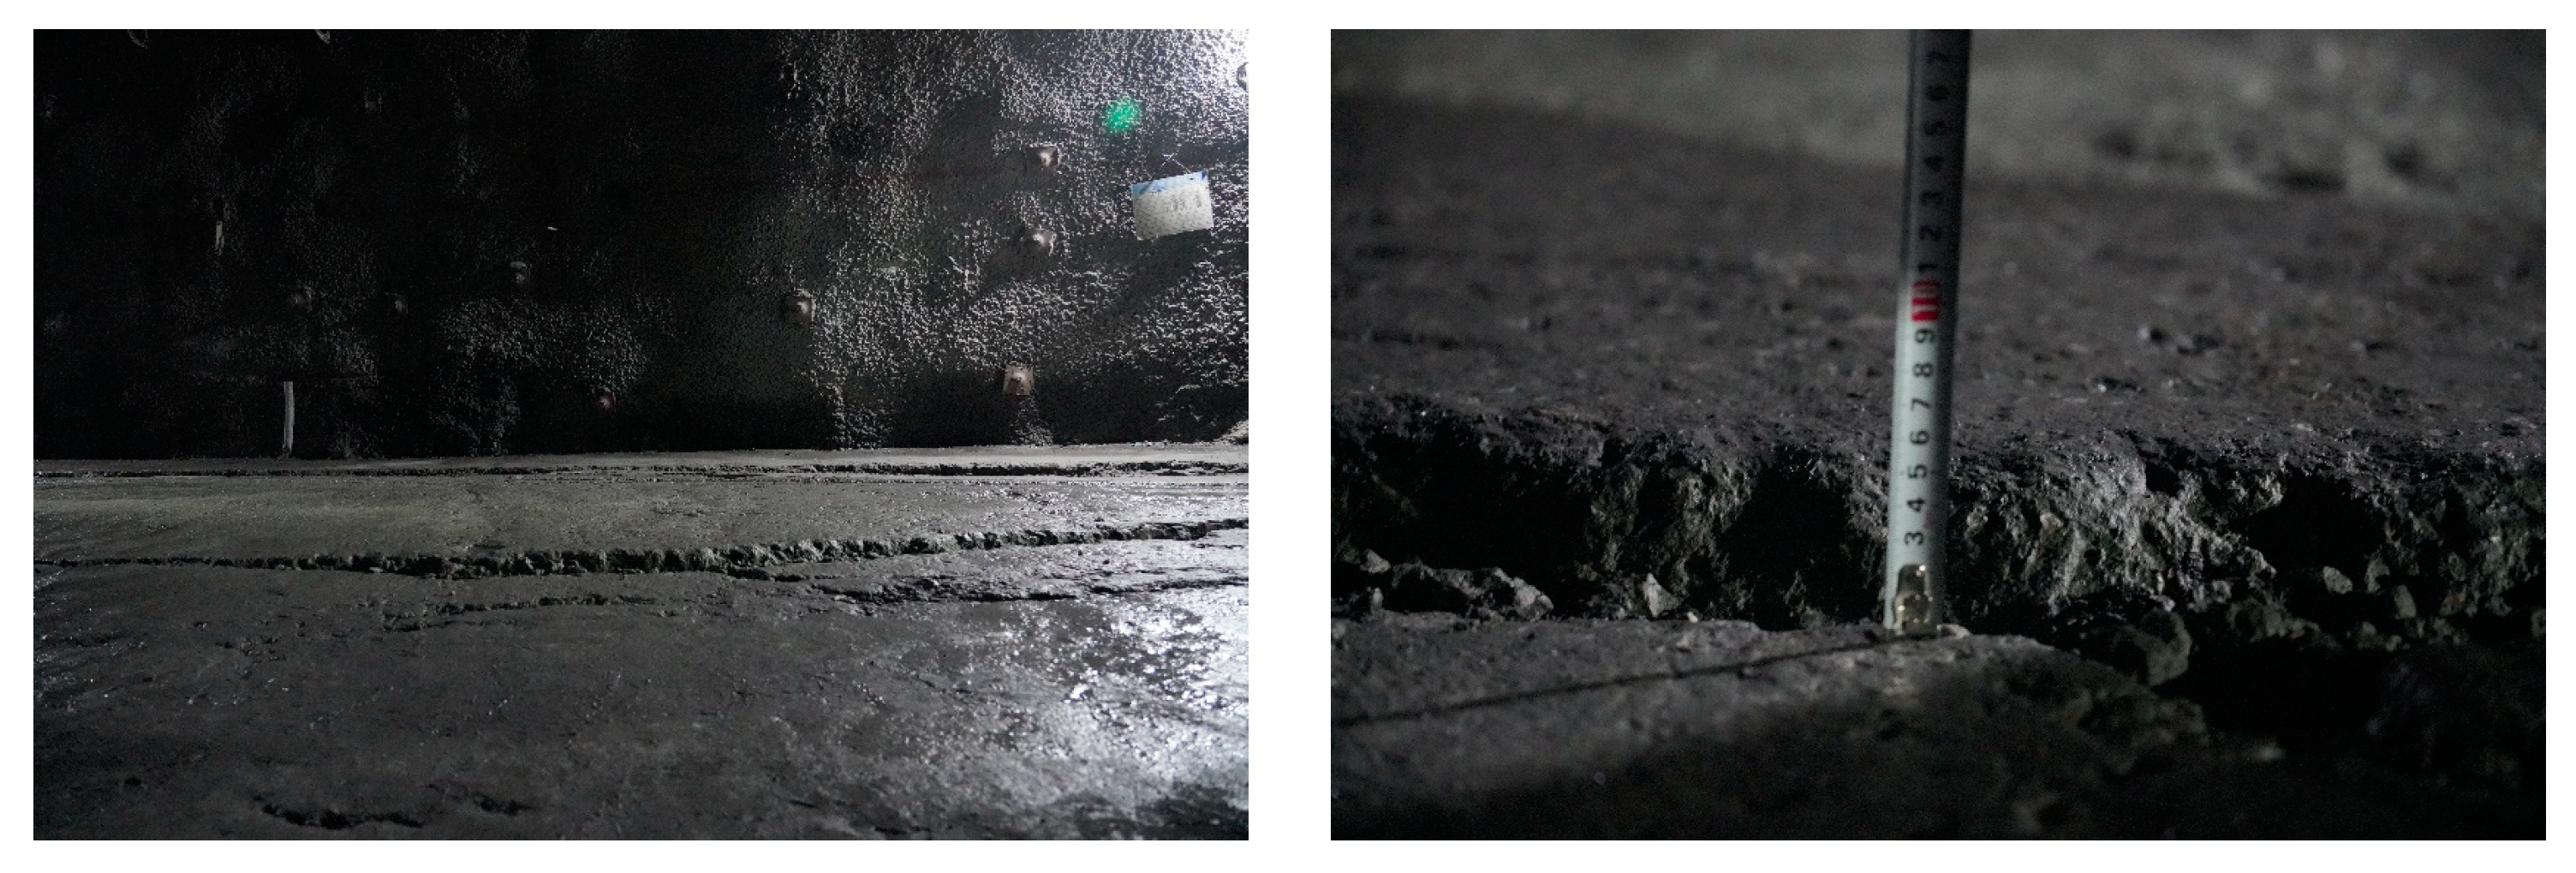
In cases of structural deformation or failure due to tunnel floor heave, the most commonly affected area is the concrete filling layer, followed by the track slab. The typical failure mode in the filling layer is surface cracking, with most cracks running longitudinally along the tunnel. These cracks often exhibit a V-shaped profile, wider at the top and narrowing towards the bottom, and tend to propagate from shallow to deep. Since ballastless tracks demand strict control over the deformation of the tunnel bottom structure, even slight changes in the track slab’s displacement can alter the track geometry, potentially compromising traffic safety. Deformation and failure in the central ditch, side ditch, and cable groove typically occur in two patterns: the bottom and sides of the central ditch are especially vulnerable to damage, while the side ditches and cable grooves often develop cracks, which in severe cases, may fully penetrate the structure.
2.2. Statistical Analysis of Influencing Factors of Tunnel Floor Heave
The deformation of the bottom structure in 18 tunnels across 10 railway lines was investigated, followed by a statistical analysis of the factors influencing this deformation. These tunnels represent a wide range of current engineering conditions, including surrounding rock grade, physical and mechanical properties of the rock, and burial depth. In the fourth section of this paper, typical conditions are selected for a numerical simulation and analysis. This research indicates that the primary factors contributing to deformation can be classified into five categories: groundwater, expansive rock, ground stress, structural alignment, and construction quality. These factors may act independently or in combination, leading to tunnel floor heave. The distribution of these five deformation factors in the investigated tunnels is presented in Table 1.

Table 1.
Statistical table of influencing factors of tunnel floor heave.
2.3. Statistical Analysis of Tunnel Floor Heave during Operation
An in-depth investigation of 14 tunnels across eight projects led to the following conclusions:
- (1)
- Among the 14 tunnels surveyed, a total of 39 instances of tunnel floor heave were observed, spanning 5.1 km, which represents 5.2% of the total tunnel length. The factors influencing these deformations are illustrated in Figure 1.
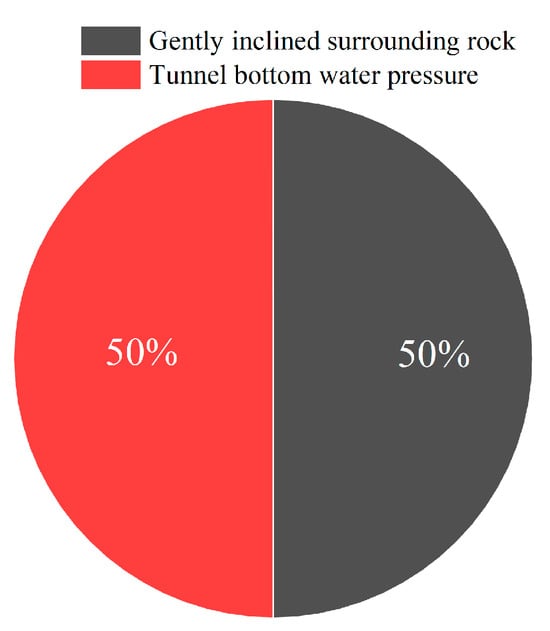 Figure 1. Proportion of influencing factors of tunnel floor heave during operation period.
 - (2)
- Tunnel floor heave predominantly occurs due to the gently inclined surrounding rock and the water pressure at the tunnel’s base. It is notably absent in regions characterized by large deformations, rock bursts, active fractures, or high ground temperatures in soft rock under high ground stress. While arching was observed in some gas sections, the gas itself did not contribute to tunnel floor heave.
- (3)
- There are seven sections where water pressure at the tunnel base is the primary factor (50%) and seven sections where the gently inclined surrounding rock is the main cause (50%).
- (4)
- In sections where floor heave is primarily caused by water pressure at the tunnel base, remedial measures have prevented further deformation. Conversely, in sections where gently inclined surrounding rock is the dominant factor, five tunnels were successfully stabilized following intervention, though two tunnels continue to experience arching despite the measures taken.
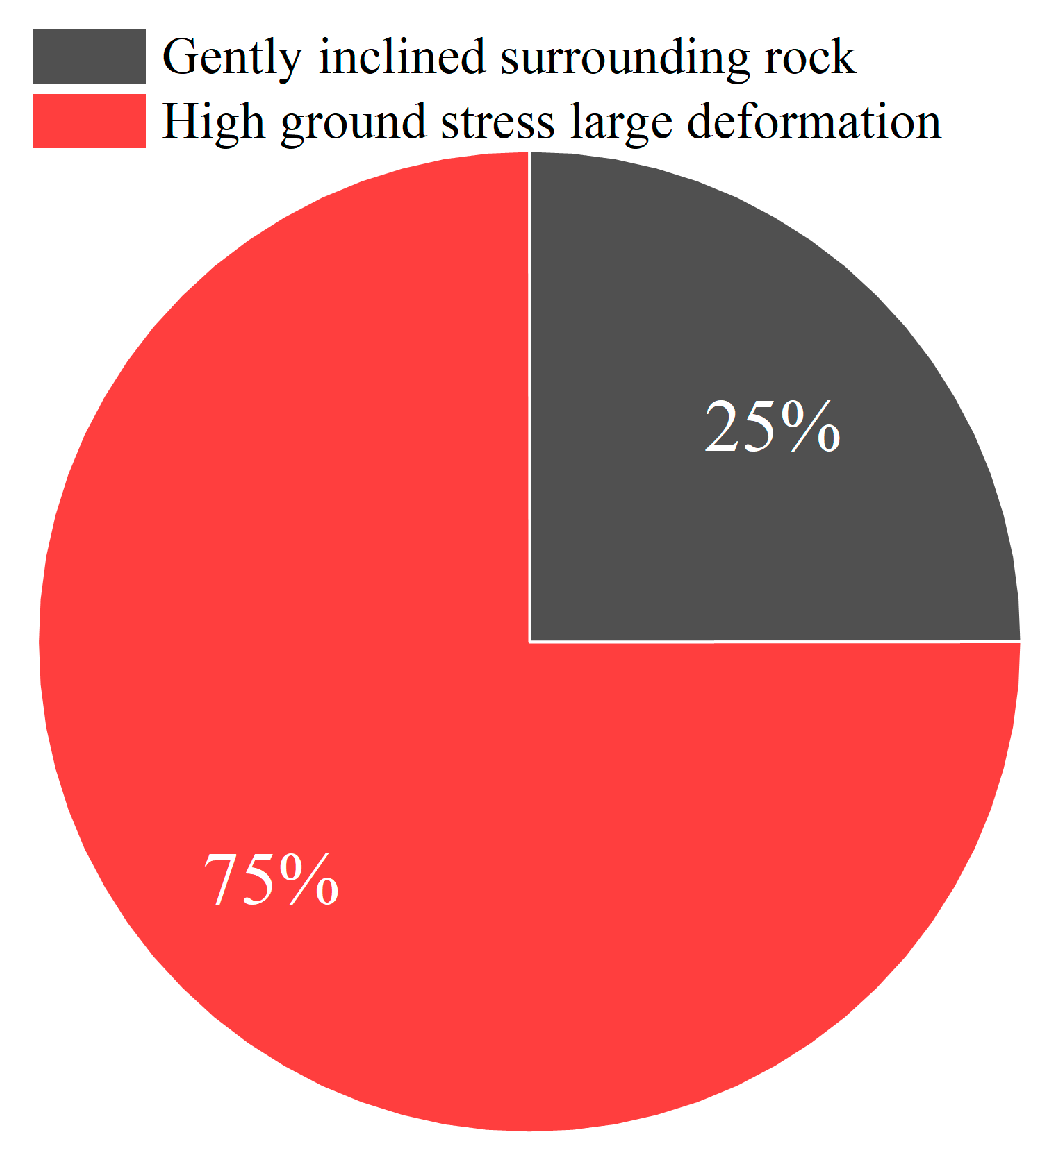
2.4. Statistical Analysis of Tunnel Floor Heave during Construction
Through an in-depth investigation of eight tunnels in five projects, the following conclusions are obtained:
- (1)
- Among the eight tunnels investigated, a total of 15 tunnel floor heaves occurred, totaling 2.9 km, accounting for 3.0% of the total length of the eight tunnels. The influencing factors are shown in Figure 2.
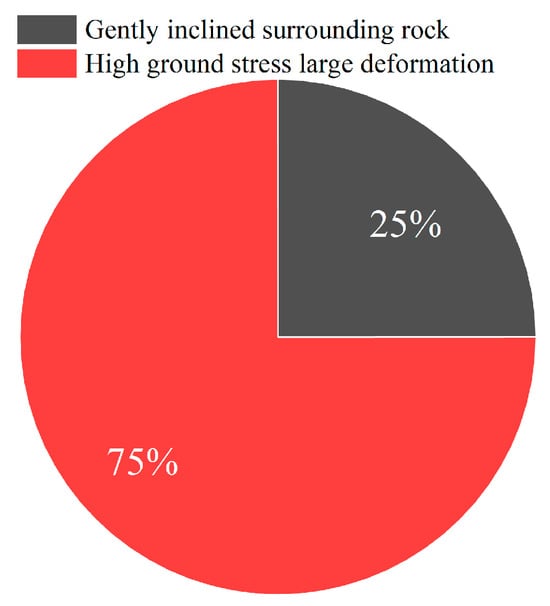 Figure 2. The proportion of influencing factors of tunnel floor heave during construction.
 - (2)
- It primarily happens due to the gently inclined surrounding rock and the water pressure at the tunnel’s base.
- (3)
- There are six high-ground-stress and large-deformation sections (75%), and two gently inclined surrounding rock sections (25%).
- (4)
- The upper arch section mainly caused by high ground stress and large deformation is not abnormal at present after taking measurements; the upper arch section mainly caused by gently inclined surrounding rock was not abnormal after the measurements were taken.
2.5. Statistical Analysis of Tunnel Floor Heave in Gently Inclined Surrounding Rock
- (1)
- Depth
As illustrated in Figure 3a, tunnel floor heave in gently inclined surrounding rock is predominantly observed at depths ranging from 200 to 500 m, with occurrences diminishing beyond 500 m. This trend is attributed to two key factors: the scarcity of gently inclined surrounding rock at depths exceeding 500 m and the elevated ground stress encountered at greater depths. Consequently, tunnel sections buried at depths of 200 to 500 m within gently inclined surrounding rock are particularly susceptible to floor heave.
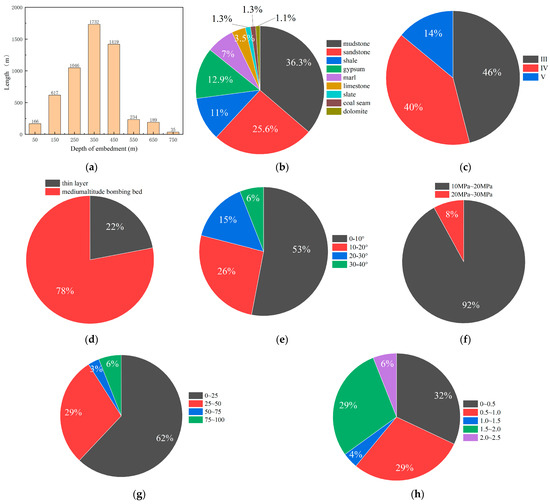
Figure 3.
Floor heave statistics of a gently inclined surrounding rock tunnel. (a) The proportion of different tunnel depths under the condition of gently dipping surrounding rock. (b) Different lithologic ratios of surrounding rocks under gently dipping conditions. (c) The proportion of different surrounding rock grades under the condition of gently dipping surrounding rock. (d) Different thickness ratios of surrounding rock strata under the condition of gently dipping surrounding rock. (e) The proportion of different dip angles of surrounding rocks under slow-dip conditions. (f) Different in situ stress ratios under the condition of gently dipping surrounding rock. (g) A statistics chart of cumulative floor heave of a tunnel under the condition of gently inclined surrounding rock. (h) A statistics chart of the floor heave rate of a tunnel under the condition of gently inclined surrounding rock.
- (2)
- Lithology
As shown in Figure 3b, the floor heave of the gently inclined surrounding rock tunnel is mainly distributed in mudstone, sandstone, and shale strata, among which mudstone accounts for 36.3%, sandstone accounts for 25.6%, gypsum accounts for 12.9%, and shale accounts for 11.0%, so it can be found that mudstone and sandstone are prone to the risk of tunnel bottom bulge under slowly dipping surrounding rock conditions.
- (3)
- Surrounding rock grade
As depicted in Figure 3c, grades III and IV of surrounding rock are the most common, with each accounting for 45.9% of the observed cases, while grade V constitutes 14%.
- (4)
- Layer thickness
As indicated in Figure 3d, both thin and medium–thick layers are affected, representing 21.6% and 78.4% of the occurrences, respectively.
- (5)
- Inclination
As illustrated in Figure 3e, 52.7% of cases occur within a 10° inclination, 41.2% between 10° and 40°, and only 6.1% at inclinations above 30°. Therefore, the risk of tunnel floor heave is more likely to manifest at inclinations below 30°.
- (6)
- Ground stress
As shown in Figure 3f, tunnel floor heave in gently inclined surrounding rock is primarily concentrated within the 10–20 MPa stress range, with fewer occurrences in the 20–30 MPa range and even less below 10 MPa. This indicates that floor heave generally occurs when ground stress reaches a certain threshold, and the coexistence of high ground stress and gently inclined surrounding rock is observed in some cases, particularly when local stress levels reach 20–30 MPa.
- (7)
- Cumulative floor heave
The maximum recorded cumulative floor heave is 122 mm, with a weighted average of 31.9 mm. The majority of cumulative heave values are below 50 mm, with 61.5% being less than 25 mm and only 6.2% exceeding 100 mm.
- (8)
- Floor heave rate
The maximum recorded heave rate is 2.22 mm per month, with the majority of heave rates falling below 2 mm per month. Heave rates exceeding 2 mm per month account for only 6% of the cases.
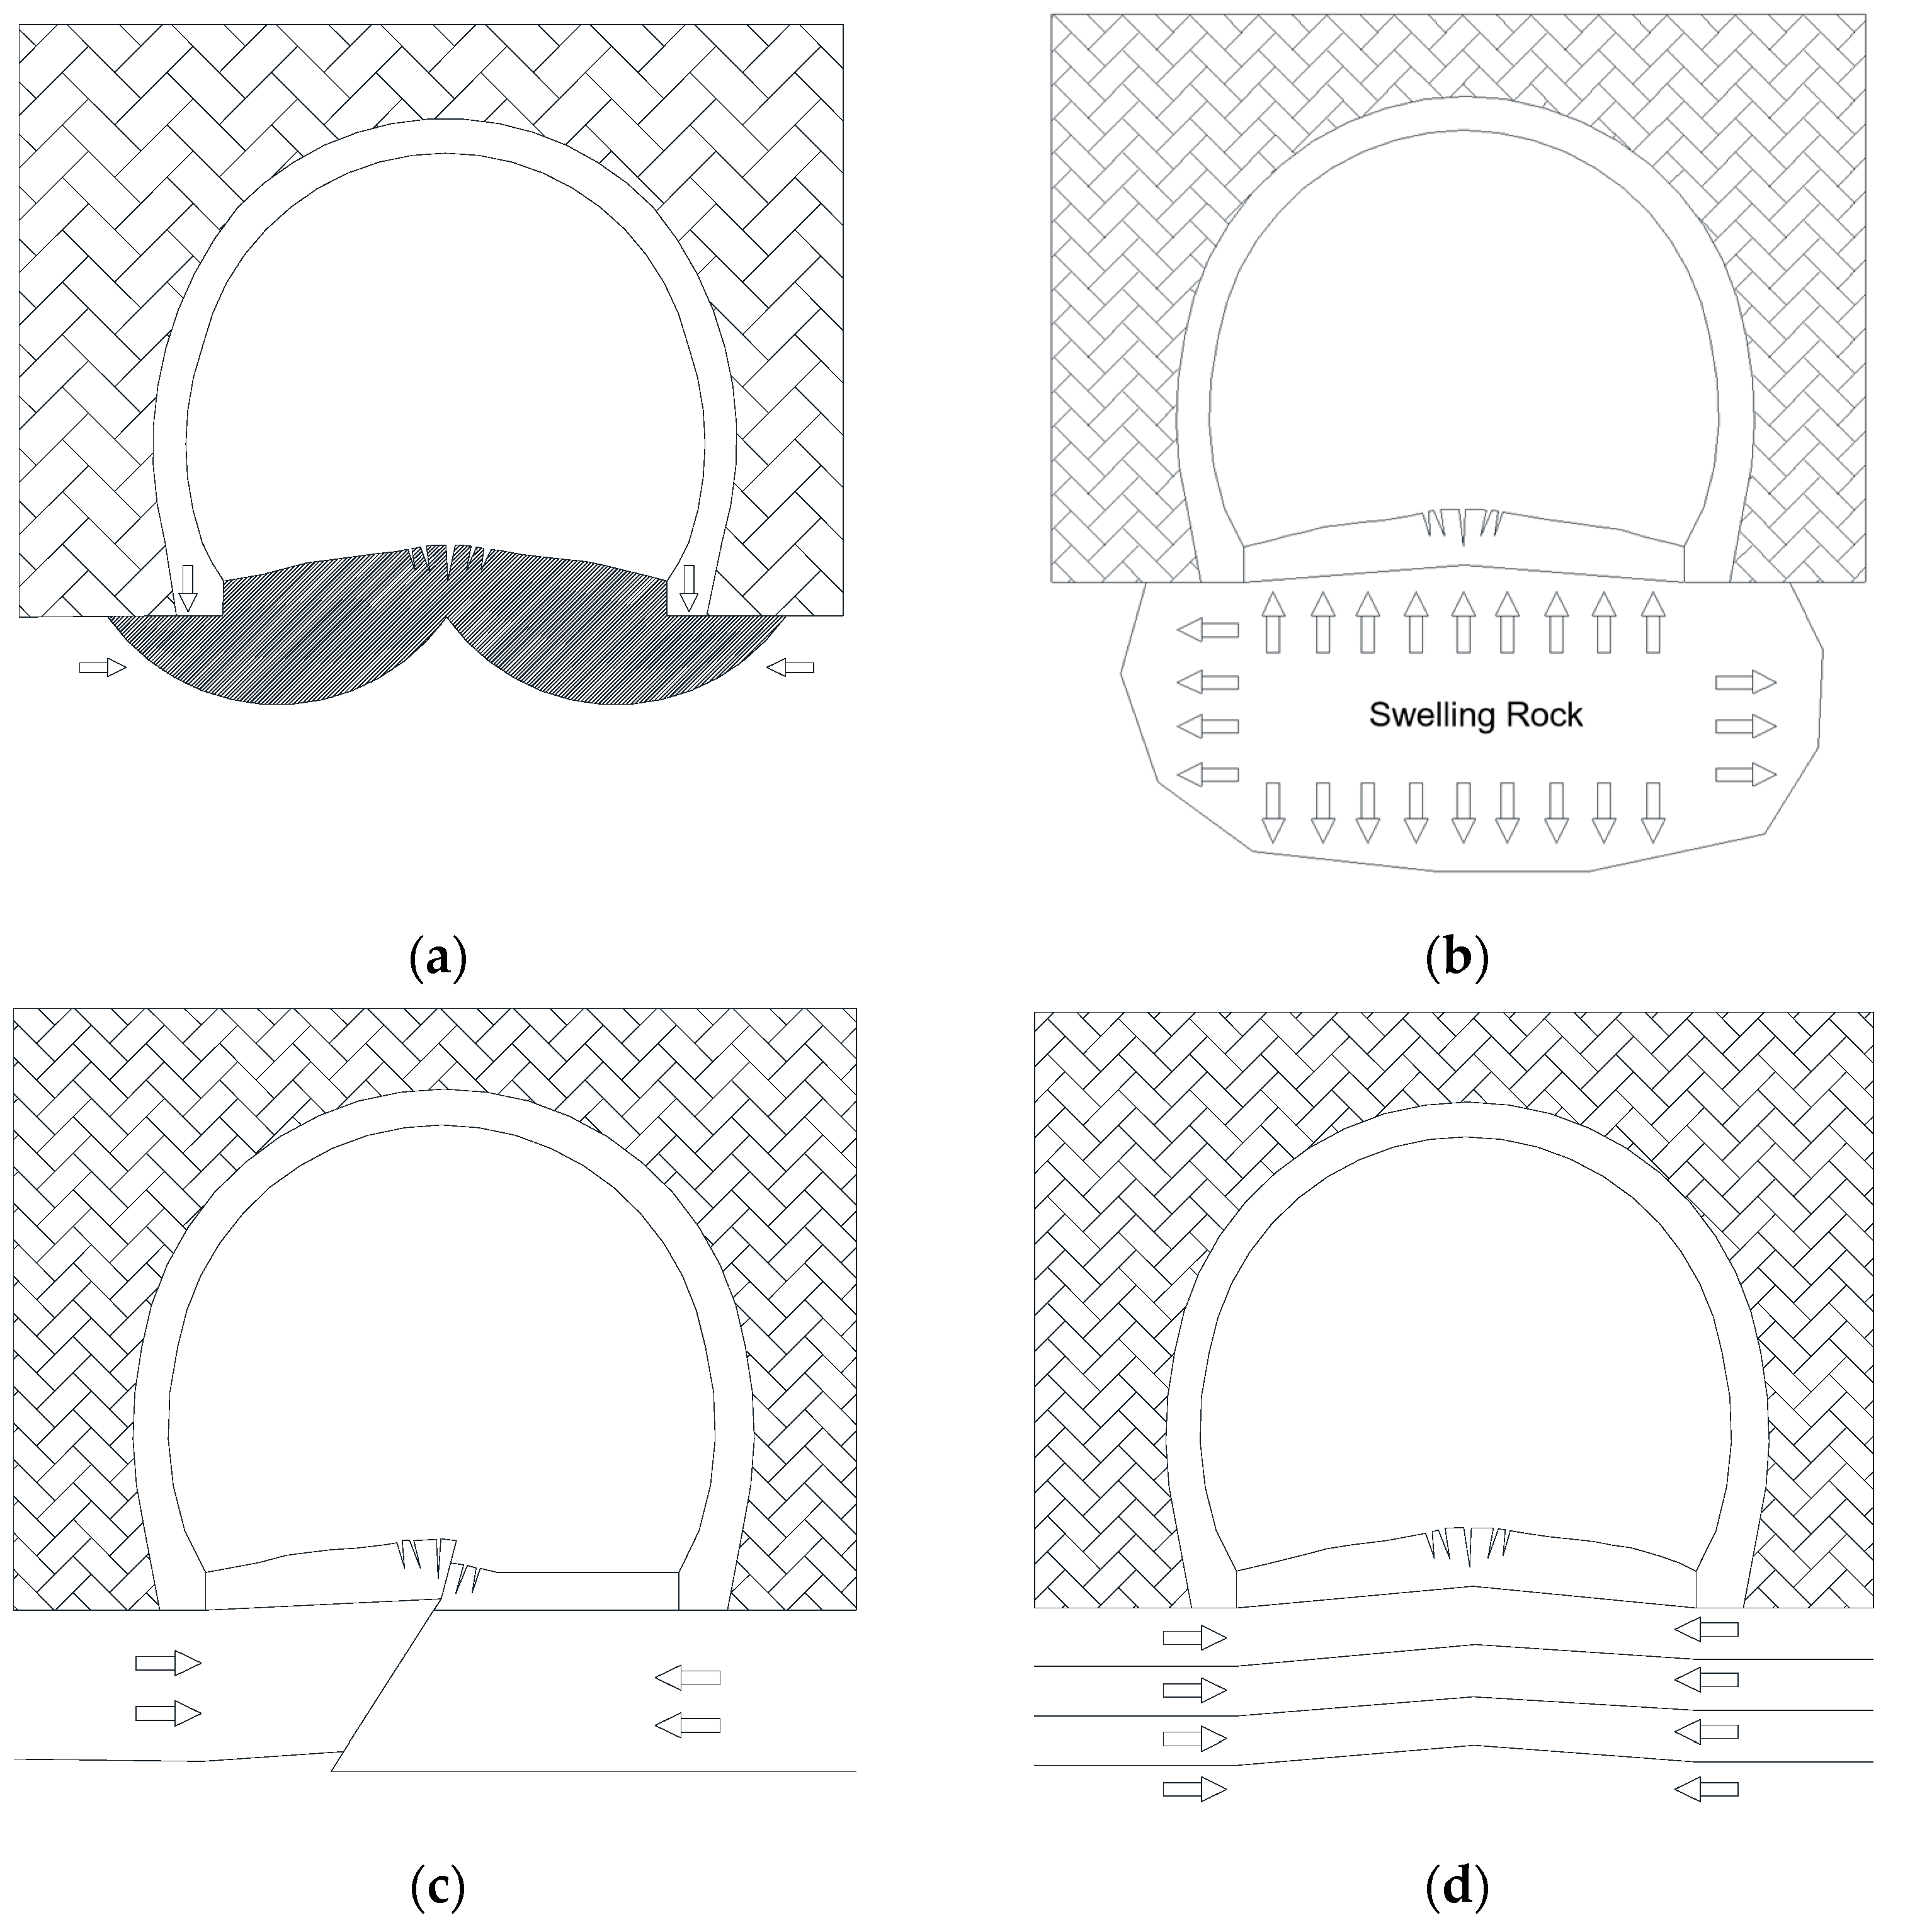
3. Types and Mechanism of Tunnel Bottom Drum
3.1. Type of Tunnel Floor Heave
Tunnel floor heave can be classified into four fundamental types based on the mechanics of failure: extrusion flow deformation, water-induced swelling, flexible folding, and shear dislocation. Each type is illustrated in Figure 4.
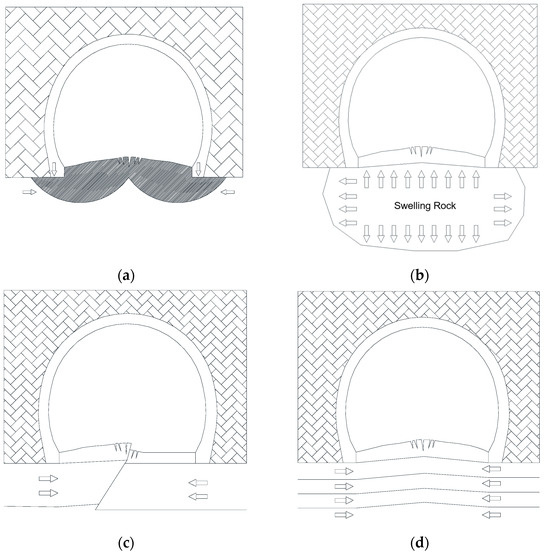
Figure 4.
Tunnel floor heave model diagram. (a) Squeezed flow model of tunnel floor heave. (b) Water swelling model of tunnel floor heave. (c) Shear-staggered model of tunnel floor heave. (d) Upper arch model of tunnel bottom with flexural folds.
3.2. Mechanism and Mechanical Model of Tunnel Floor Heave
The causes and mechanical mechanisms of uplift deformation in tunnel inverted arches can be attributed to two primary factors: lateral load mechanisms and longitudinal load mechanisms.
Lateral load mechanism: The ends of the inverted arch are subjected to vertical loads from the overlying strata and the structure’s weight, which are transmitted through the arch foot. Simultaneously, the base of the arch experiences an upward reaction force from the underlying foundation. These forces generate significant internal stresses within the inverted arch and its fill, resulting in substantial lateral tensile stress at the arch’s cracking points.
Longitudinal load mechanism: Along the tunnel’s longitudinal axis, the presence of extensive weak surrounding rock near the uplifted sections of the inverted arch contributes to increased surrounding rock pressure, structural internal forces, and displacement, particularly foundation settlement. Moreover, the long-term operation of trains exacerbates uneven settlement between uplifted and settled sections, inducing significant internal forces along the tunnel’s longitudinal axis. This phenomenon resembles a “leverage effect” or the distribution pressure on an upper cantilever beam, where the structural internal force peaks at the stratigraphic boundary. The transfer of shear forces intensifies the vertical load at the ends of the inverted arch, further increasing the transverse tensile stress at the arch’s cracking points. The accumulation of bending moments results in substantial longitudinal compressive stress across the cross-section of the inverted arch.
While both Thin Plate Differential Equations and Euler Beam Theory are used to analyze thin structural elements under load, they differ significantly in the type of structures they describe (plates vs. beams), the complexity of their governing equations, and the dimensionality of their applications. Euler Beam Theory is simpler and focuses on one-dimensional bending, whereas Thin Plate Theory deals with two-dimensional bending and is more complex, accommodating a wider range of loading and boundary conditions.
From the above analysis and combined with the Thin Plate Differential Equations [29] and Figure 5, we can obtain the following:
where ω is the deflection of the bottom plate (m); D is the bending stiffness of the bottom plate (N∙m); and , , and are the mid-plane stress of the bottom plate (N/m).
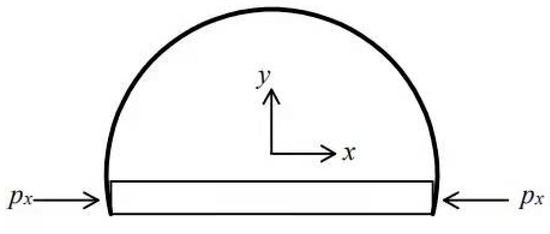
Figure 5.
Mechanical model of bulking damage of invert.
The stress in the bottom plate is as follows (positive in tension):
where is the uniform pressure per unit length of the side of the bottom plate (N·m); t is the thickness of the bottom plate (m); and µ is the Poisson’s ratio.
The stress in the middle surface is thus obtained as
Replace Formula (3) with Formula (1) and, taking into account that deflection is only related to x, obtain
The deflection expression is
In the formula, m is any positive integer; Am is the undetermined coefficient; and l is the width of the floor (m).
Replace (5) with (4).
The crimping conditions are
Let m = 1 and obtain the critical load :
So, the stress in the bottom plate under critical conditions is
and when , there is bottom plate buckling instability.
4. Analysis on Influencing Factors of Tunnel Floor Heave in Gently Inclined Thin-Layered Surrounding Rock
Based on the preceding analysis and data, the primary factors influencing floor heave in tunnels with gently inclined thin-layered surrounding rock include the lateral pressure coefficient, rock dip angle, hard rock thickness, thin layer thickness, elastic modulus of the surrounding rock, and tunnel burial depth. These factors were examined in conjunction with a tunnel section in a gently inclined thin-layered rock mass, as depicted in the tunnel support diagram in Figure 6 and the tunnel section parameters in Figure 7. This study investigates both the individual and combined effects of these six key factors on tunnel floor heave. The physical and mechanical parameters of the surrounding rock, as well as the thin-layered physical and mechanical properties, are detailed in Table 2.
Figure 6.
Tunnel support schematic diagram.
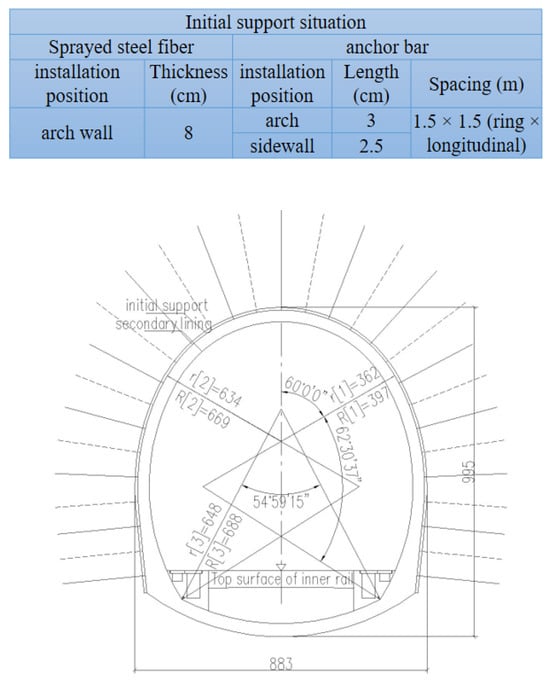
Figure 7.
Tunnel section parameter diagram (cm).
Table 2.
Physical and mechanical parameter values of surrounding rock and thin layer.
4.1. Finite Element Module Method
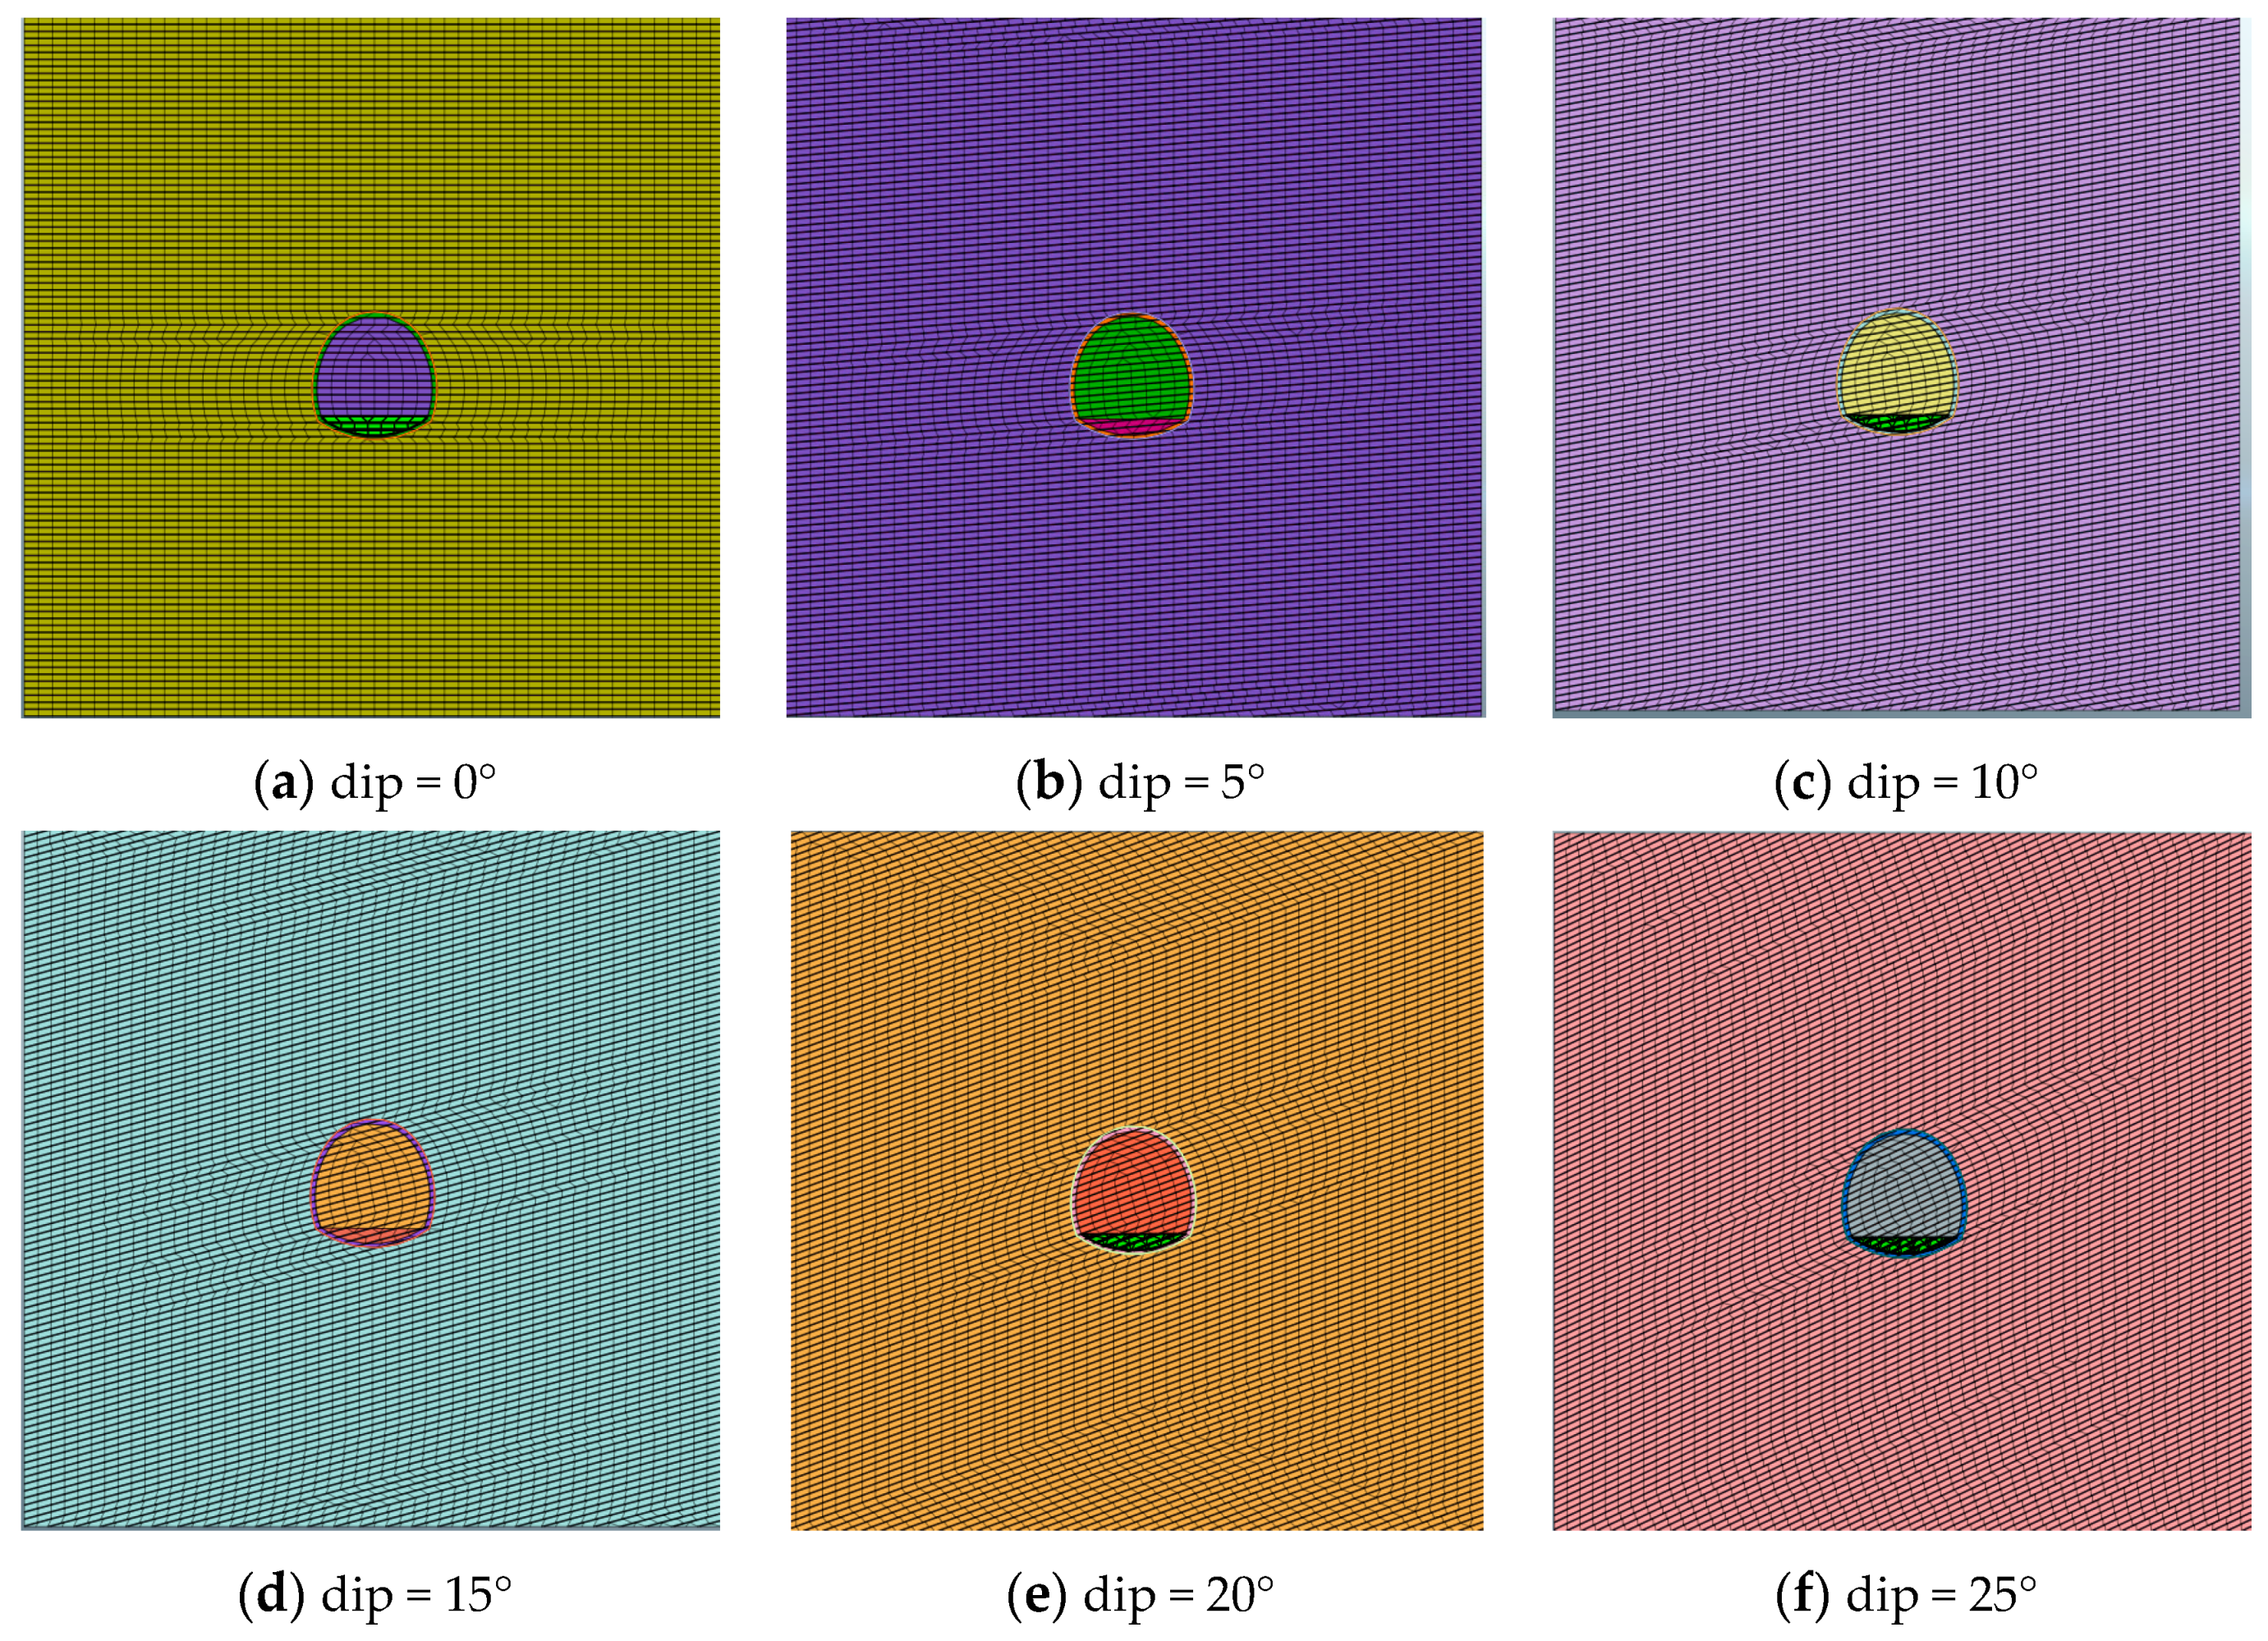
To eliminate the influence of boundary effects, the tunnel section is positioned at the center of the model, with a distance of four times the tunnel diameter from the boundary. The Mohr–Coulomb constitutive model is applied to the hard rock strata and thin layers, while the elastic constitutive model is employed for the primary support, secondary lining, and inverted arch filling layer. The calculation adheres to the plane strain criterion. In the vertical stress field, a uniform load is applied to the top of the model, accounting for self-weight. In the horizontal stress field, the initial stress value varies along the vertical gradient. A fixed constraint is imposed at the model’s base, while a force constraint is applied at the upper boundary to simulate the working conditions at different burial depths. Additionally, a force constraint is applied to the left and right boundaries of the model to simulate varying lateral pressure coefficients. The finite element model is depicted in Figure 8.
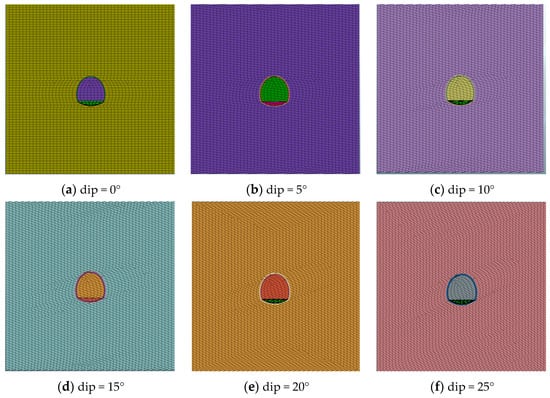
Figure 8.
Schematic diagram of finite element model.
4.2. Single-Factor Analysis
Standard group: The tunnel is buried at a depth of 300 m within thin-layered rock consisting of horizontal (0° dip angle) hard and soft strata. The hard rock layer is 0.5 m thick with an elastic modulus of 13 GPa, while the soft rock layer is 0.05 m thick with an elastic modulus of 0.186 GPa. The lateral pressure coefficient of the thin-layered rock mass is 1.5. According to the lateral pressure coefficient, dip angle of the rock stratum, thickness of the hard rock stratum, thickness of the thin layer, elastic modulus of surrounding rock, buried depth of the tunnel, and different parameters under these six influencing factors (Table 3), numerical models are established, respectively. The influence of parameter variation of a certain influencing factor on tunnel floor heave under the same conditions is discussed.
Table 3.
Parameter value table of single-factor influence analysis.
- 1)
- Tunnel floor heave characteristics under different lateral pressure coefficients
Regarding Figure 9 and the numerical simulation results, it can be concluded that
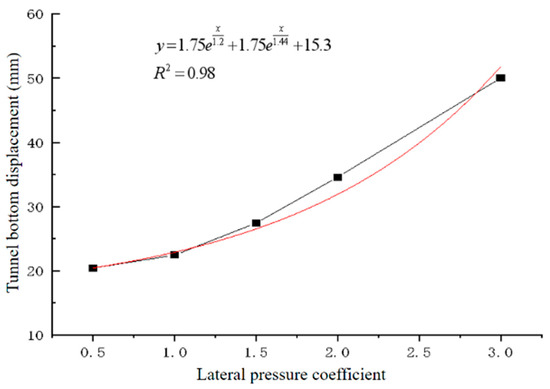
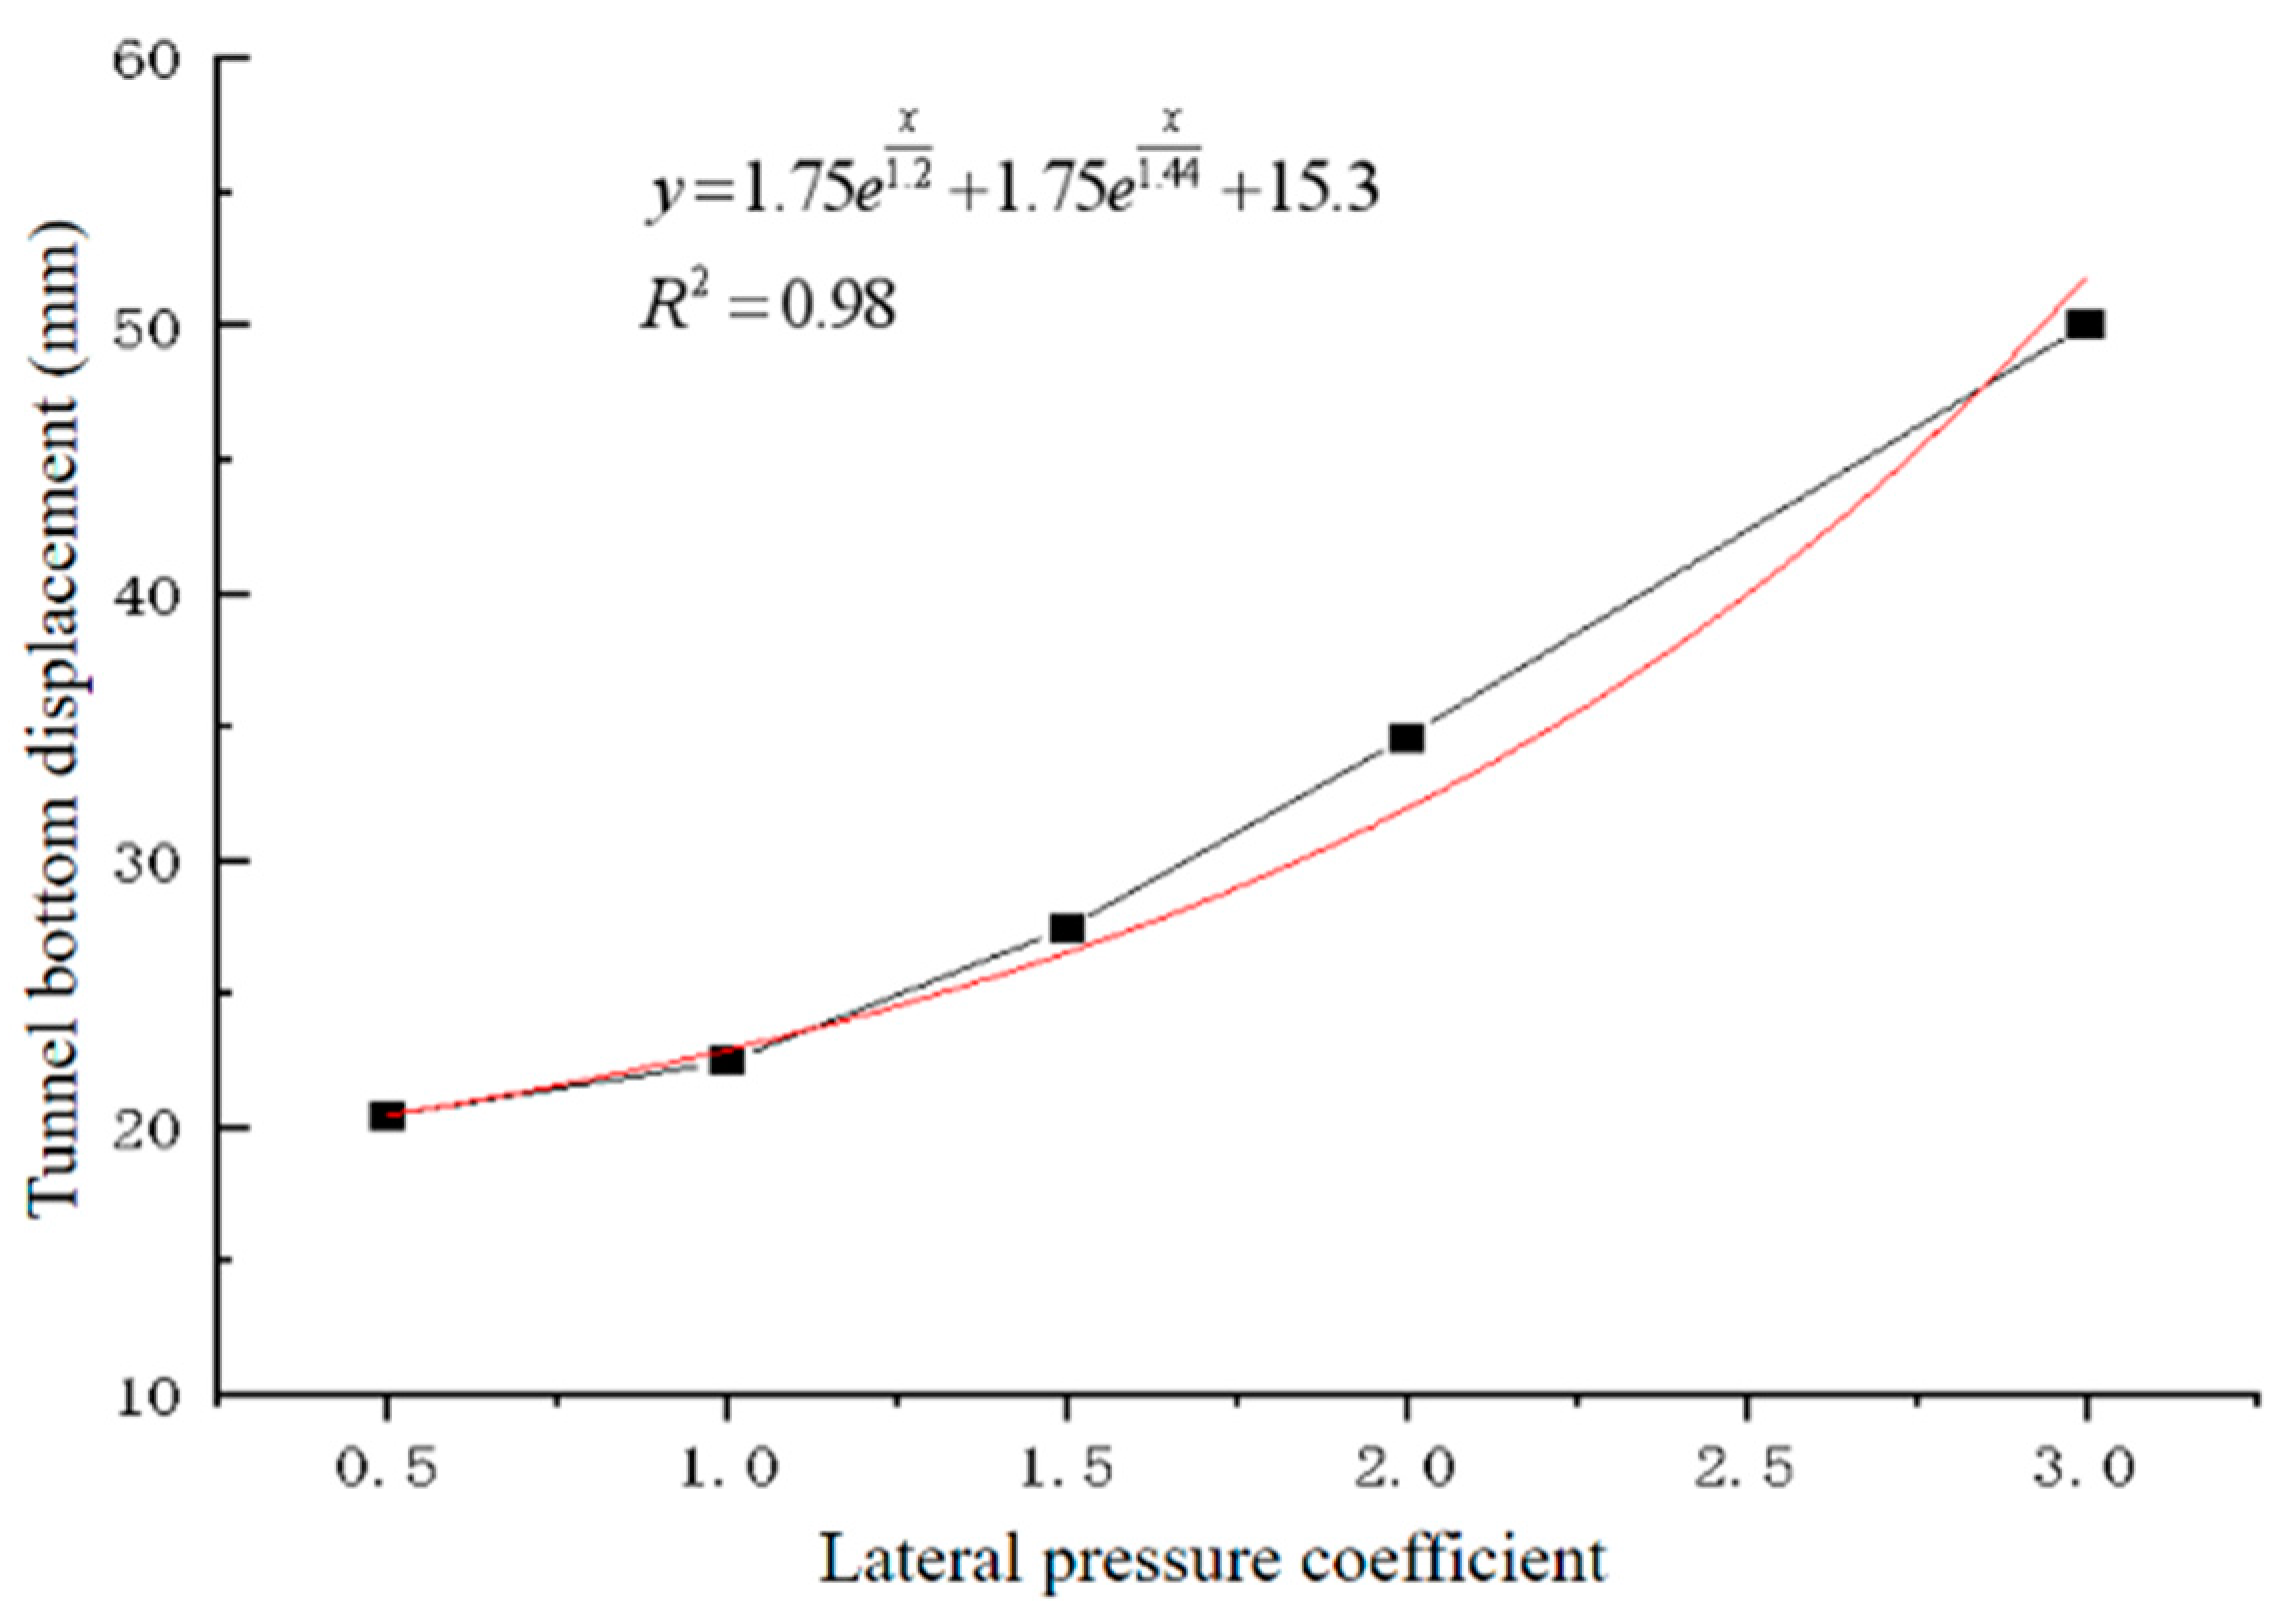
Figure 9.
Fitting curves of tunnel bottom displacement under different lateral pressure coefficients. Black line: the connecting line between numerical simulation results and field testing results; red line: the fitted curve based on the formula.
- (1)
- The tunnel floor heave value increases with the increase in the lateral pressure coefficient, and the growth rate is accelerated. When the lateral pressure coefficient increases from 0.5 to 3.0, the tunnel floor heave gradually increases from 20.42 mm to 50.04 mm, and the displacement increases by 2.45 times. When the lateral pressure coefficient increases from 1.0 to 1.5, the tunnel bottom drum increases from 22.45 mm to 27.43 mm, and the displacement increases by 1.22 times. When the lateral pressure coefficient increases from 1.5 to 2.0, the tunnel bottom drum increases from 27.43 mm to 34.59 mm, and the displacement increases by 1.26 times. When the lateral pressure coefficient increases from 2.0 to 3.0, the tunnel bottom drum increases from 34.59 mm to 50.04 mm, and the displacement increases by 1.44 times.
- (2)
- The displacement of the tunnel sidewall increases with the increase in the lateral pressure coefficient, and the left and right sides converge inward.
- 2)
- Tunnel floor heave characteristics under different rock dip angles
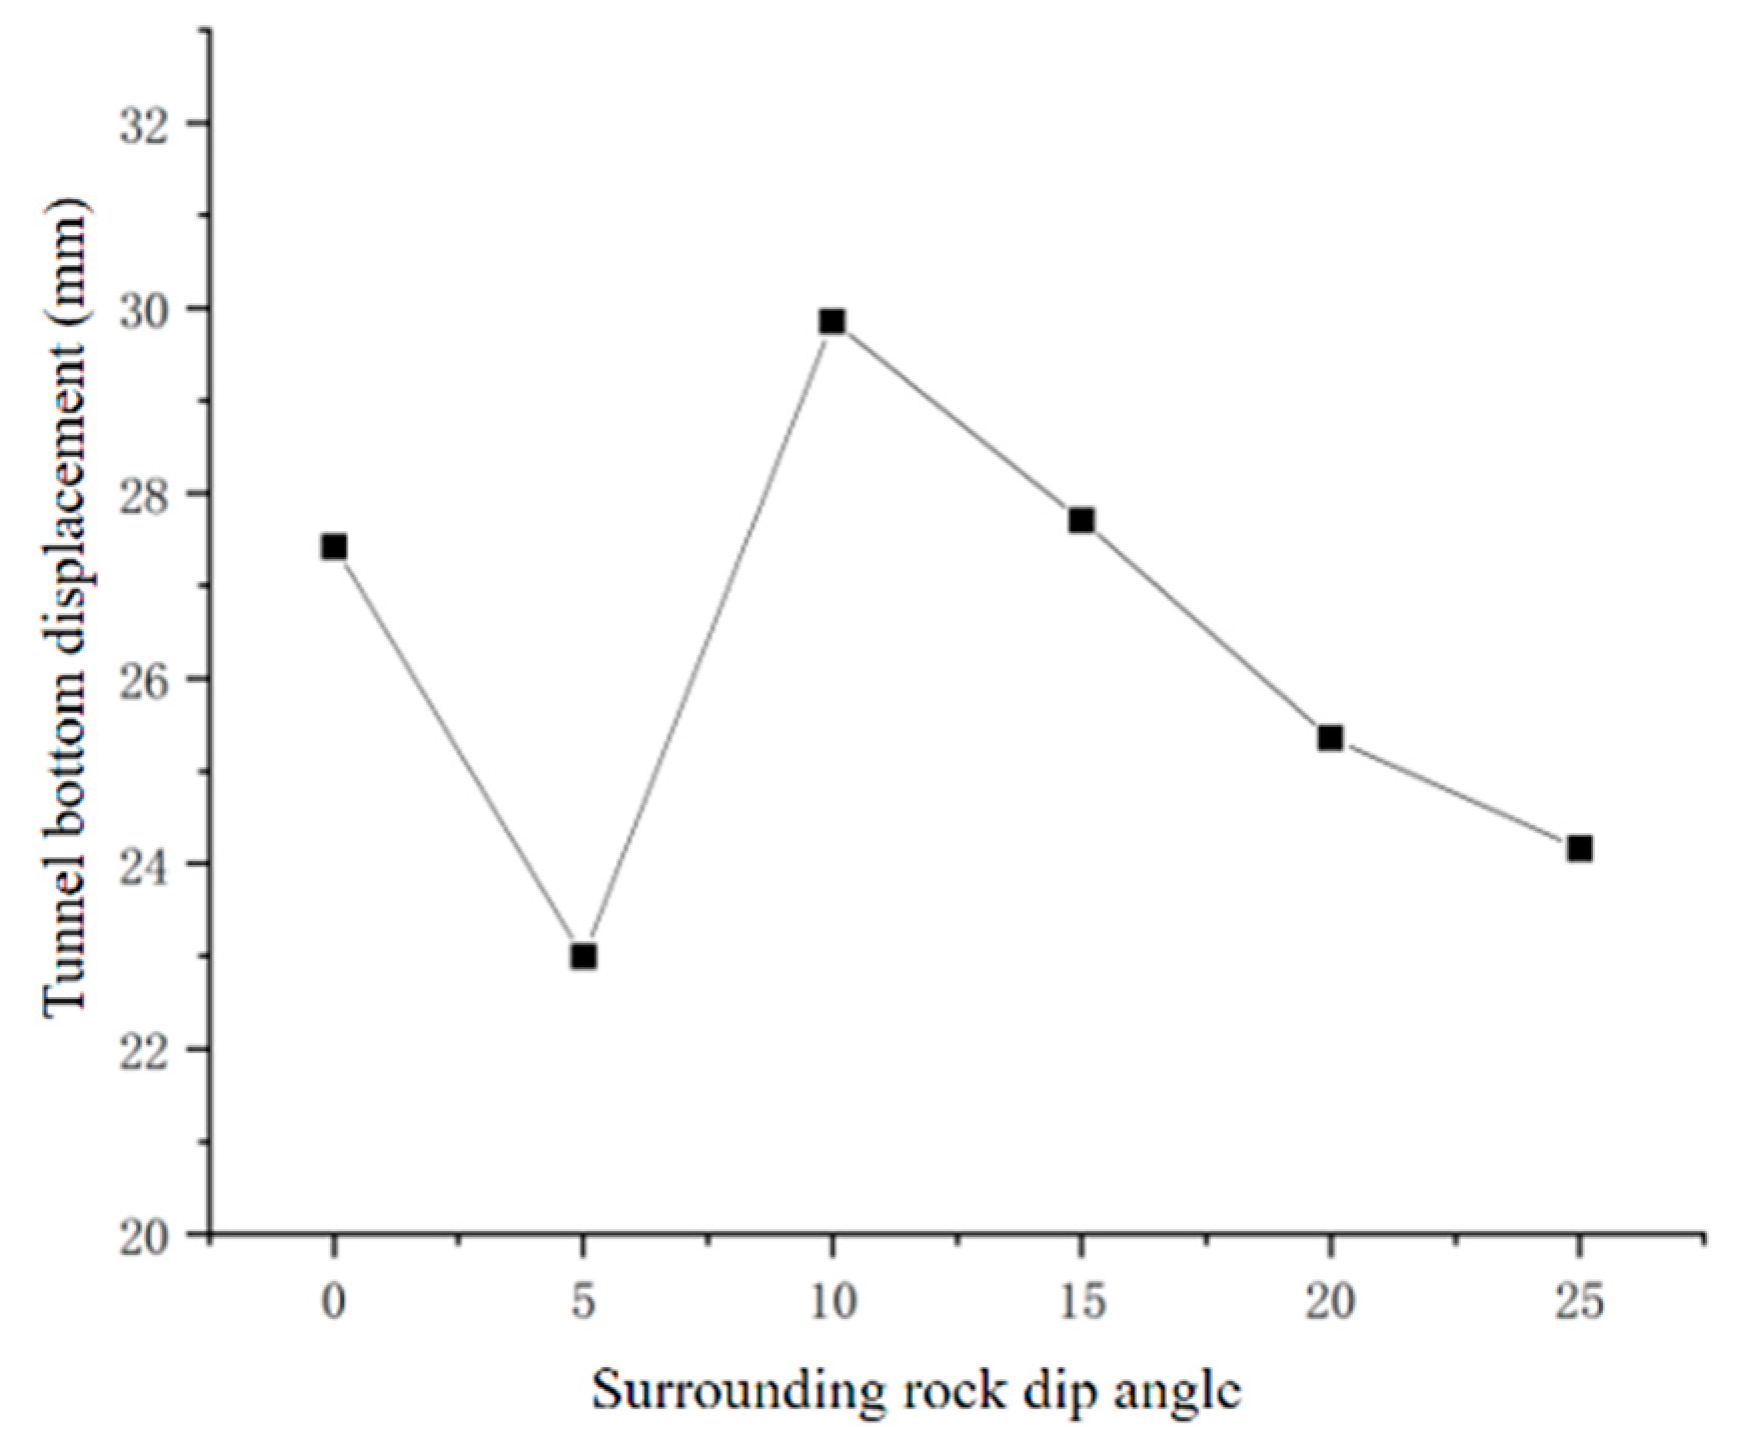
From Figure 10 and the numerical simulation results, it can be concluded that
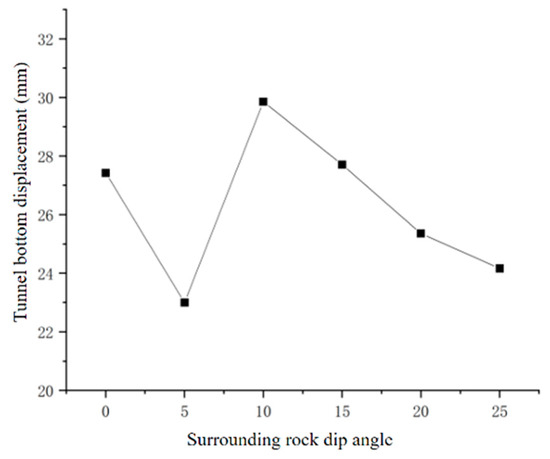
Figure 10.
Tunnel bottom displacement curve with different dip angles.
- (1)
- The tunnel floor heave value decreases first, then increases and then decreases with the increase in the rock dip angle, reaching the peak value of 29.58 mm when the rock dip angle is 10°.
- (2)
- When the dip angle of the rock stratum is not 0, the surrounding rock and the initial tunnel support exhibit noticeable asymmetric displacement, with greater displacement on one side of the dip. As the dip angle increases, the asymmetry in the displacement pattern first grows and then diminishes. The deformations at the left and right arch feet vary, with greater vertical displacement on the left side, leading to an increased sliding tendency between rock layers on both sides. This uneven settlement causes rock dislocation and tensile failure in the primary support structure.
- (3)
- When other conditions are held constant, increasing the rock dip angle from 5° to 25° results in tunnel floor heave ranging from a minimum of 22.99 mm at a 5° dip angle to a maximum of 29.58 mm at a 10° dip angle. The maximum value is 1.3 times greater than the minimum. Compared to the variation in tunnel floor heave under different lateral pressure coefficients, the influence of the rock dip angle is relatively minor.
- 3)
- Characteristics of tunnel floor heave under different hard rock thicknesses
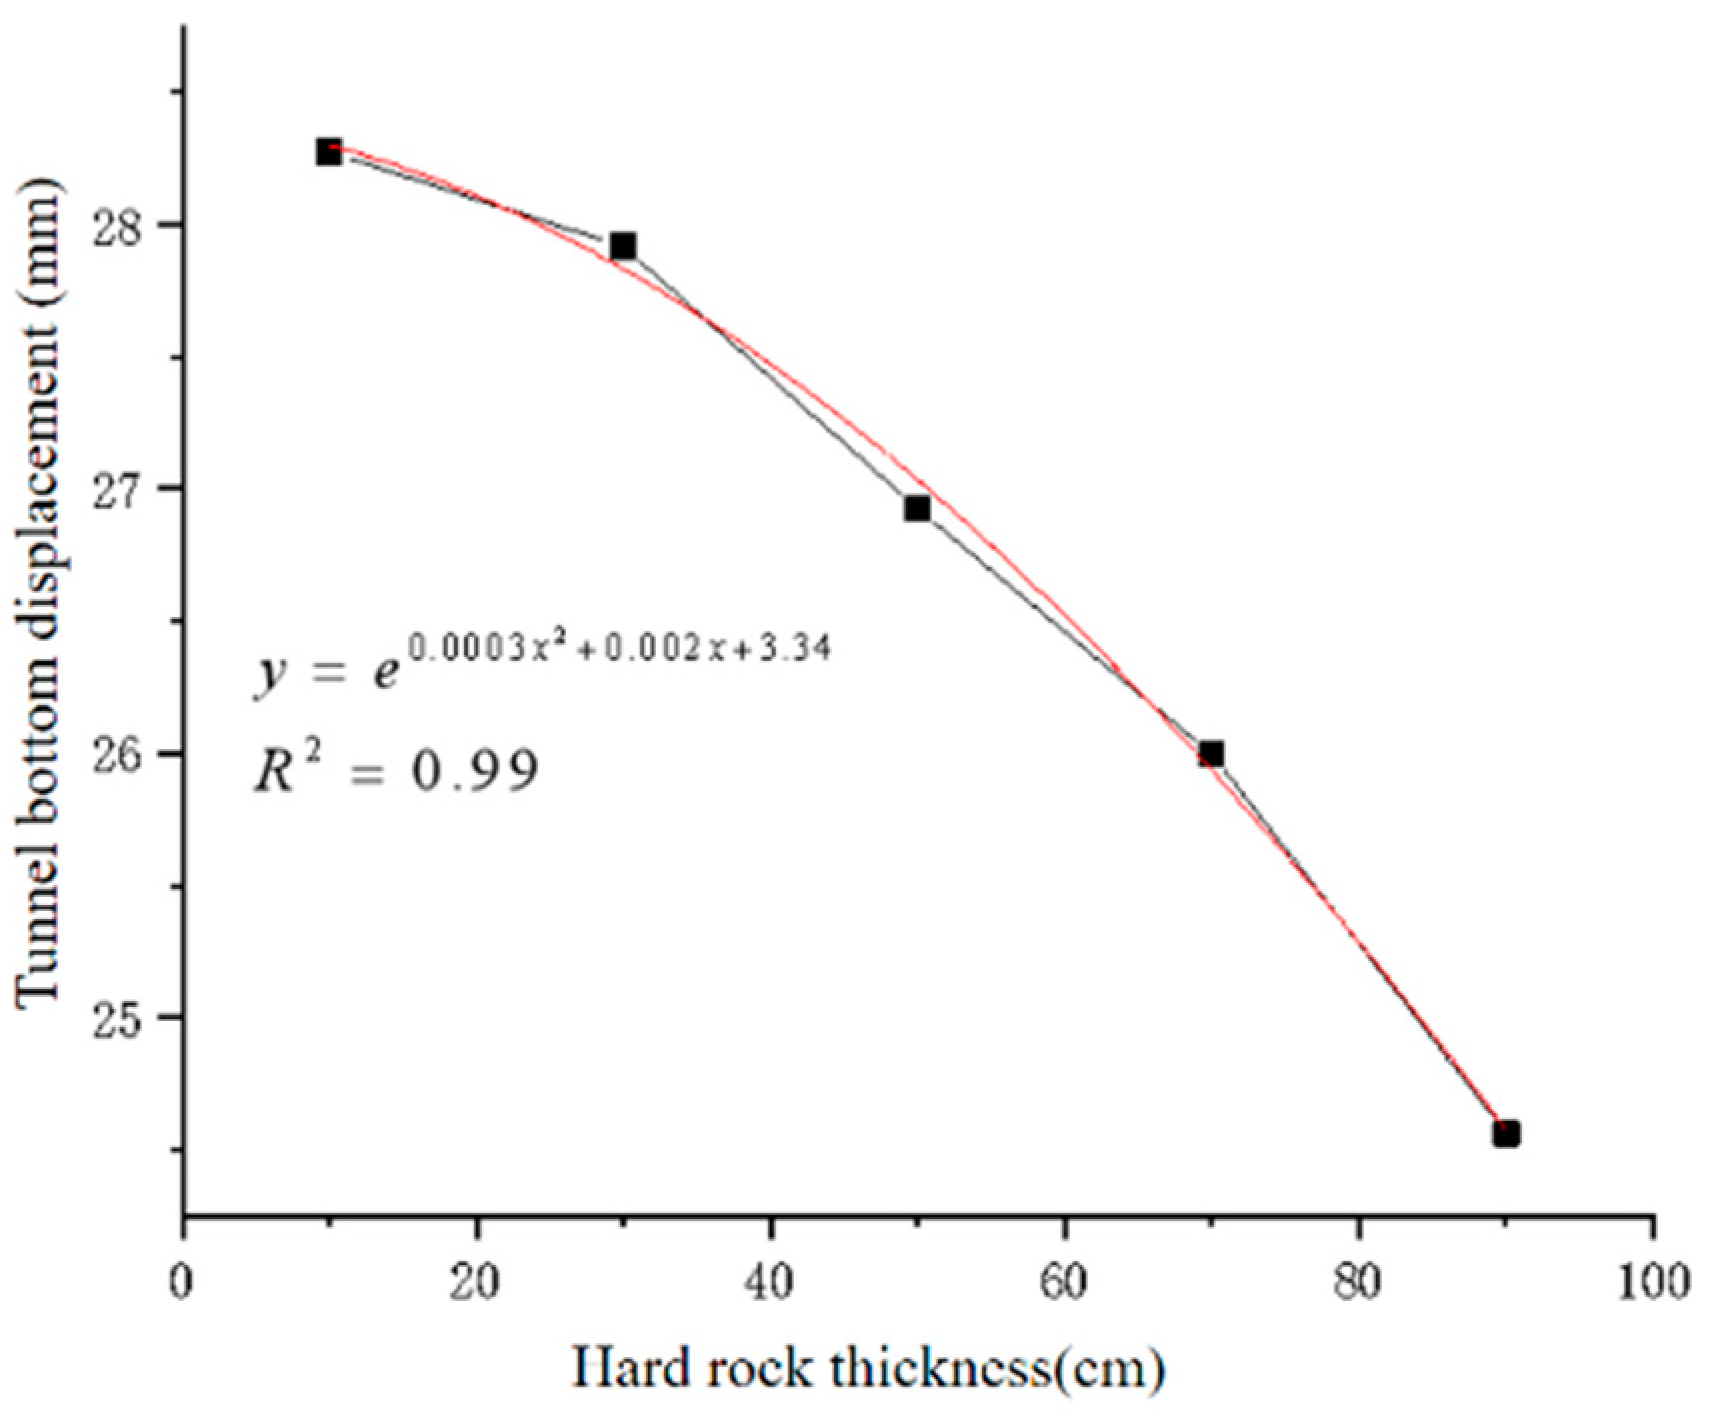
From Figure 11 and the numerical simulation results, it can be concluded that
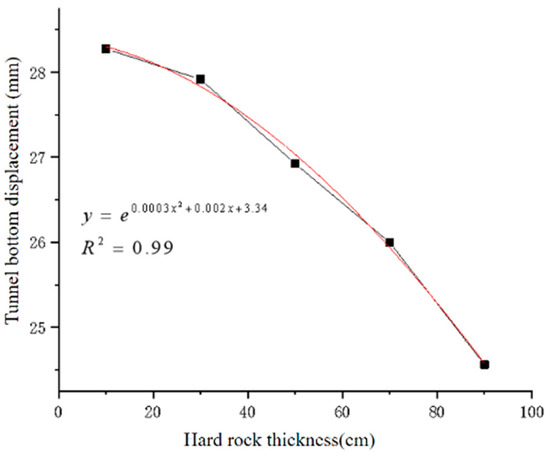
Figure 11.
Fitting curve of tunnel bottom displacement with different thicknesses of hard rock strata. Black line: the connecting line between numerical simulation results and field testing results; red line: the fitted curve based on the formula.
- (1)
- The tunnel floor heave decreases with the increasing thickness of the hard rock layer, and the rate of decrease accelerates. When the thickness of the hard rock layer increases from 20 cm to 50 cm, transforming the layered rock mass from thin to medium–thick, the floor heave reduces from 28.28 mm to 26.92 mm, a decrease of 4.8%. As the thickness increases further from 50 cm to 90 cm, transitioning the rock layer from medium–thick to thick, the tunnel floor heave continues to diminish from 26.92 mm to 24.56 mm, a reduction of 8.7%. The thicker the layer becomes, the more the layered rock approximates a homogeneous rock mass, resulting in a smaller degree of floor heave.
- (2)
- When the dip angle of the rock stratum is 0°, the layered rock mass can be considered as a flexural member under uniform load. Under high ground stress, the effect of the single-layer thickness of the layered rock on tunnel floor heave follows this pattern: the thin layer > medium–thick layer > thick layer. As the single-layer thickness of the rock mass increases, the integrity of the surrounding rock improves, its deformation resistance strengthens, and consequently, the tunnel floor heave decreases.
- (3)
- When other conditions are constant, when the thickness of hard rock increases from 10 cm to 90 cm, the minimum value of tunnel floor heave that occurs in the thickness of 90 cm is 24.56 mm, and the maximum value that occurs in the thickness of 10 cm is 28.28 mm, and the latter is 1.1 times the former. Compared with the lateral pressure coefficient and rock dip angle, the influence is small, and the influence order is the lateral pressure coefficient > rock dip angle > hard rock thickness.
- 4)
- Tunnel Bottom Drum Characteristics under Different Thin Layer Thickness
From Figure 12 and numerical simulation results, it can be drawn that
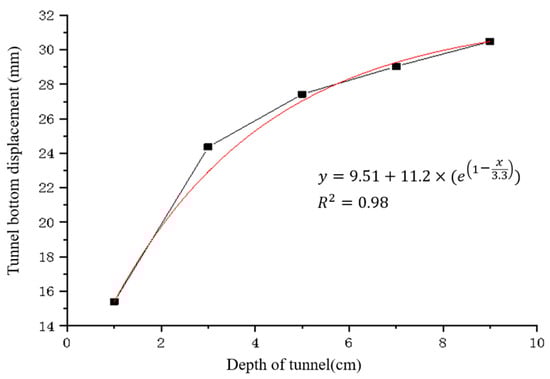
Figure 12.
Fitting curves of tunnel bottom displacement under different thin layers and thick layers. Black line: the connecting line between numerical simulation results and field testing results; red line: the fitted curve based on the formula.
- (1)
- The tunnel floor heave increases with the increase in the thickness of the thin layer. When the thickness of the thin layer increases from 1 cm to 9 cm, the tunnel floor heave gradually increases from 15.40 mm to 30.48 mm, increasing by 198%.
- (2)
- Compared with the lateral pressure coefficient, rock dip angle, and thickness of hard rock strata, the order of influence is the lateral pressure coefficient > thin layer thickness > rock dip angle > hard rock thickness.
- 5)
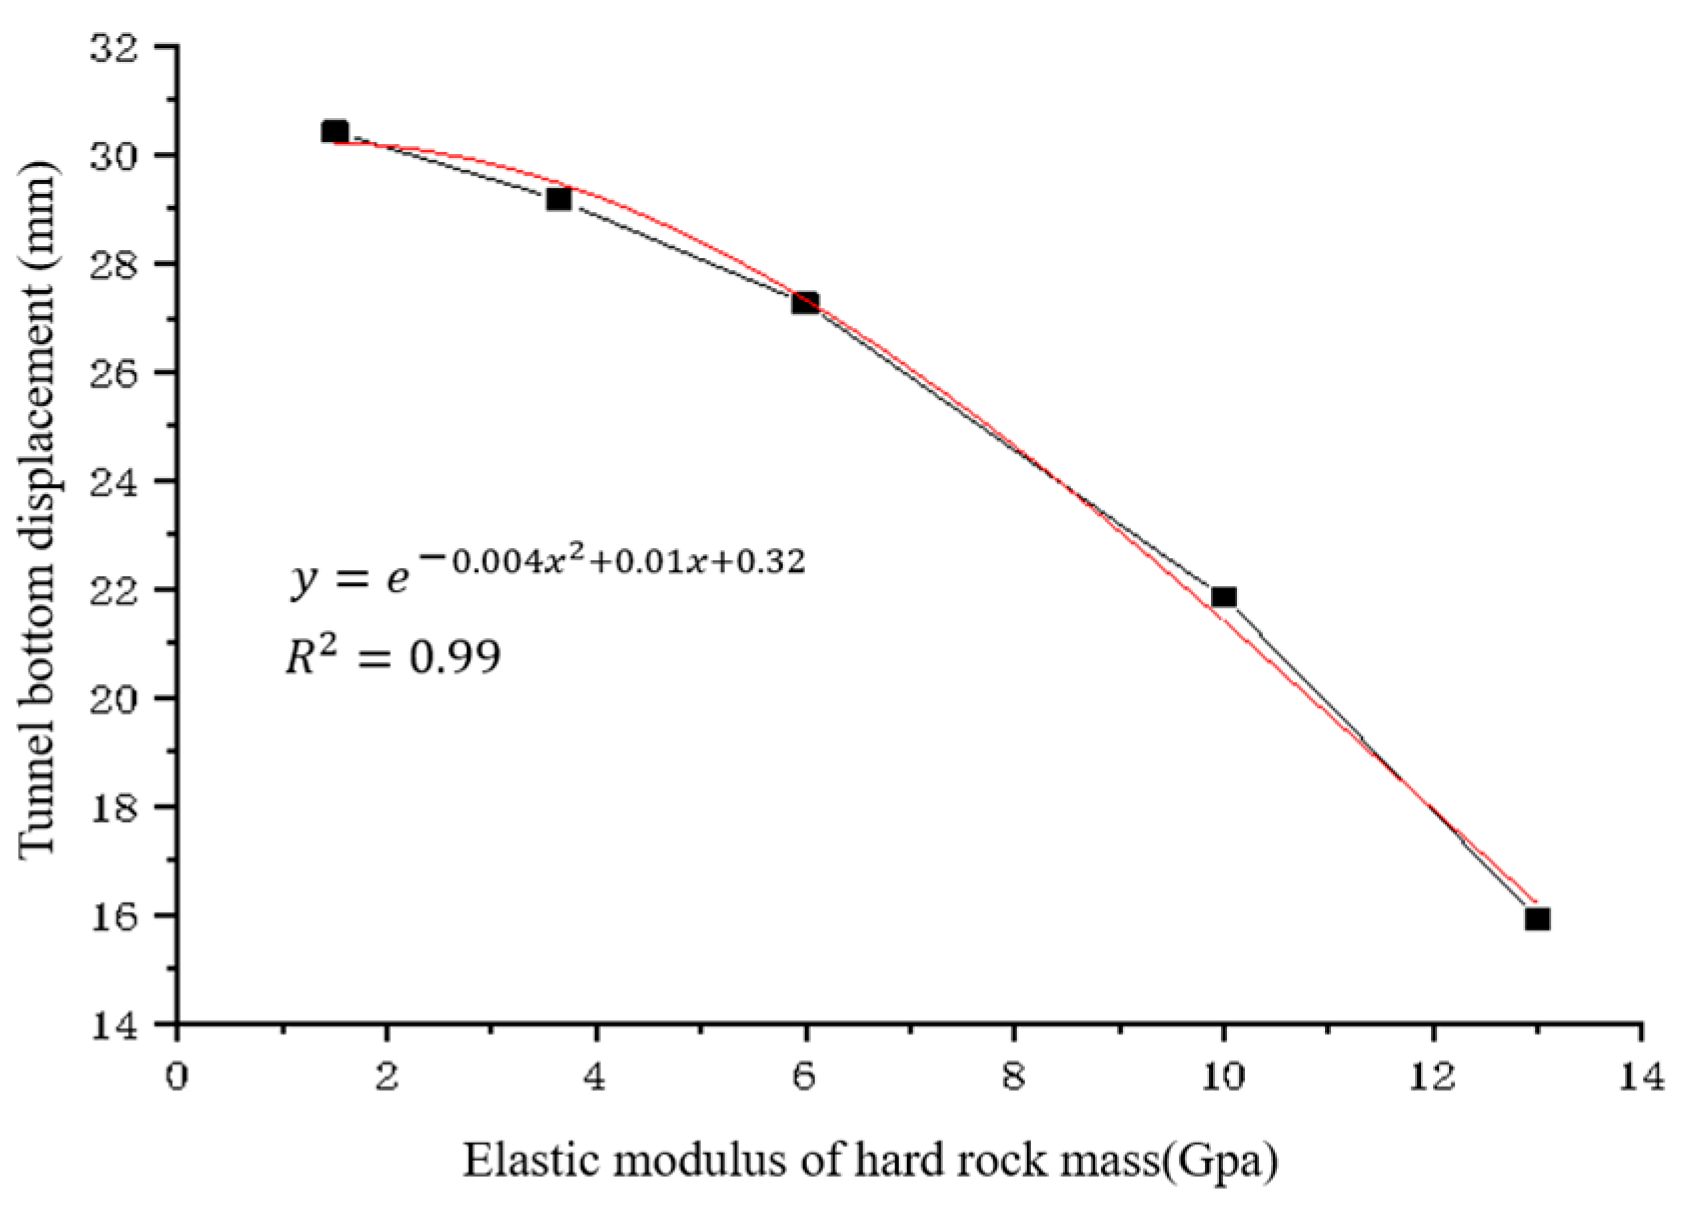
- Characteristics of tunnel floor heave under different elastic modulus of surrounding rock
From Figure 13 and numerical simulation results, it can be drawn that
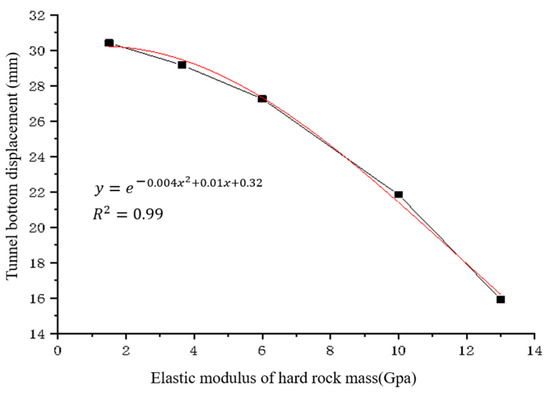
Figure 13.
Fitting curve of tunnel bottom displacement without elastic modulus of surrounding rock. Black line: the connecting line between numerical simulation results and field testing results; red line: the fitted curve based on the formula.
- (1)
- The tunnel floor heave decreases as the elastic modulus of the surrounding rock increases, with the rate of decrease accelerating. When the elastic modulus rises from 1.5 GPa to 3.65 GPa, the floor heave reduces from 30.43 mm to 29.17 mm, a 4.2% decrease. As the elastic modulus further increases from 3.65 GPa to 13 GPa, the heave drops from 29.17 mm to 15.94 mm, a reduction of 45.4%.
- (2)
- Compared with the lateral pressure coefficient, rock dip angle, hard rock thickness, and thin layer thickness, the order of influence significance is the lateral pressure coefficient > thin layer thickness > elastic modulus of surrounding rock > rock dip angle > hard rock thickness.
- 6)
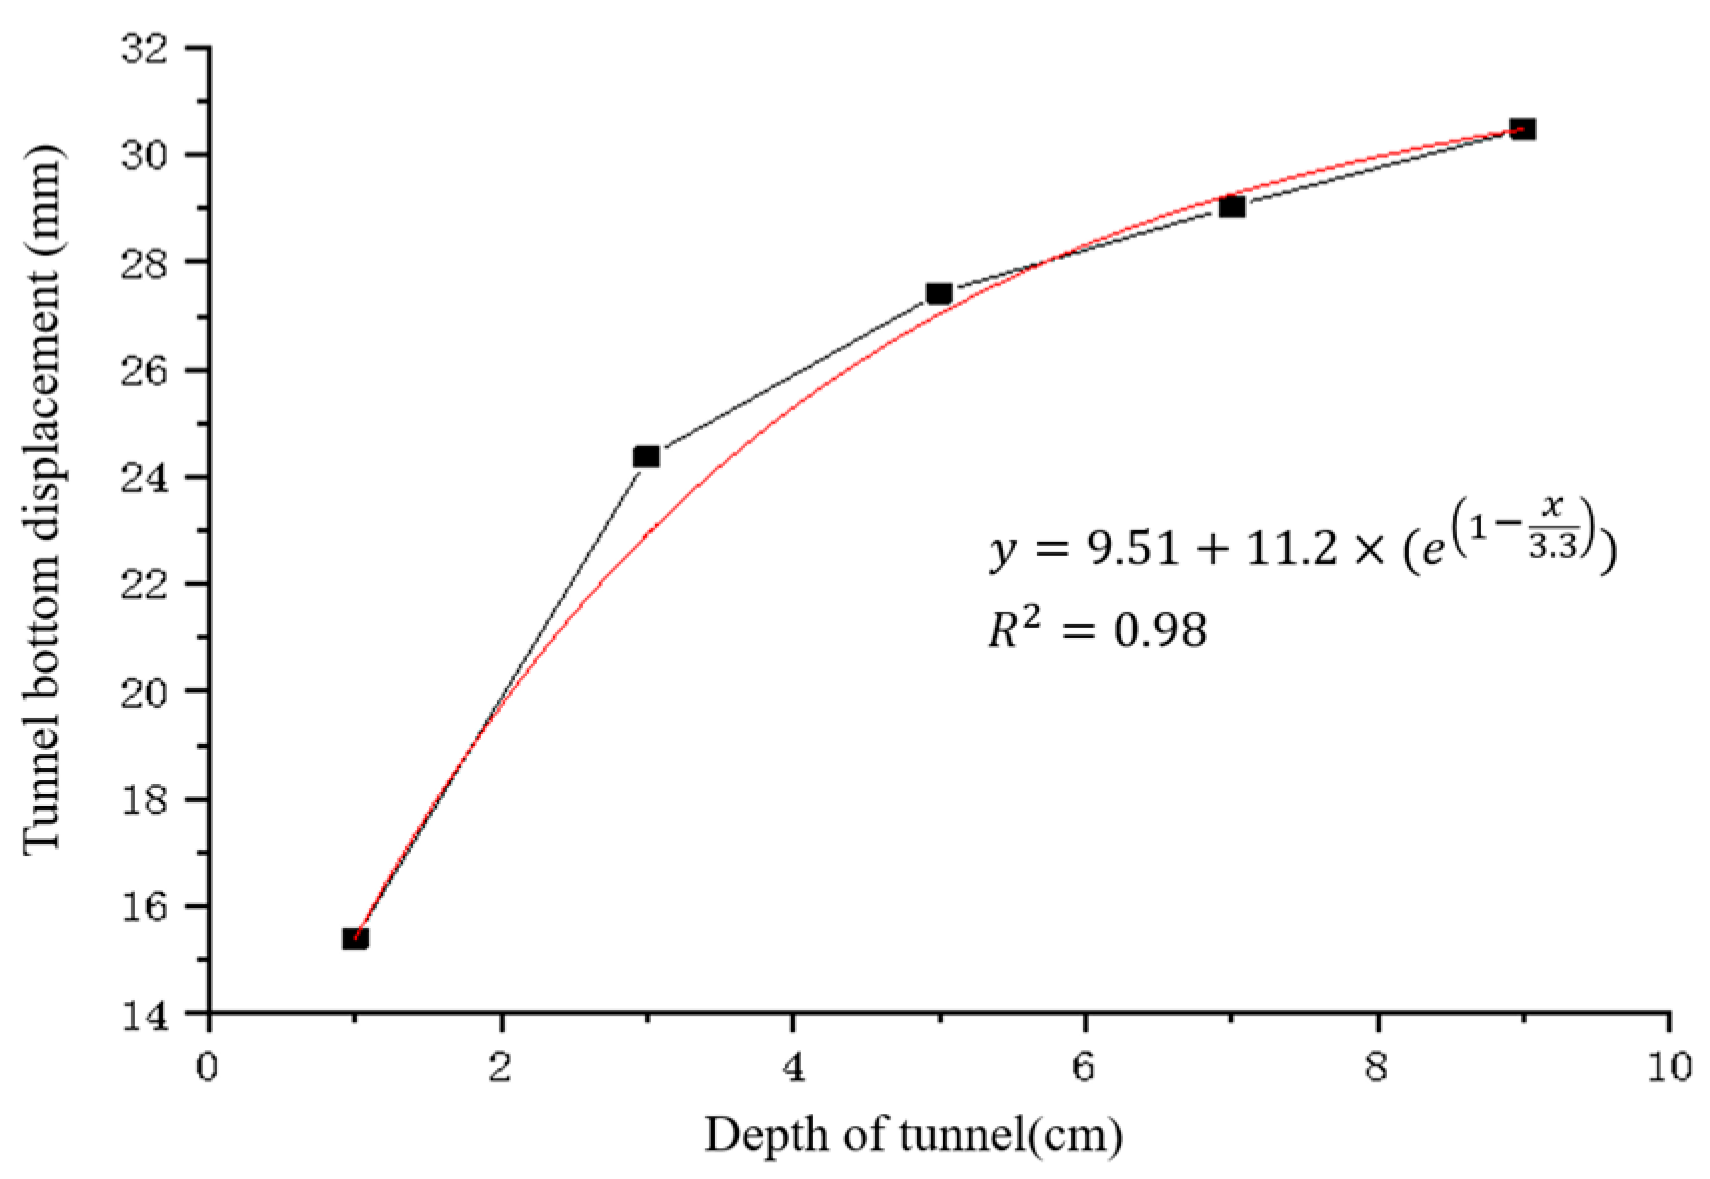
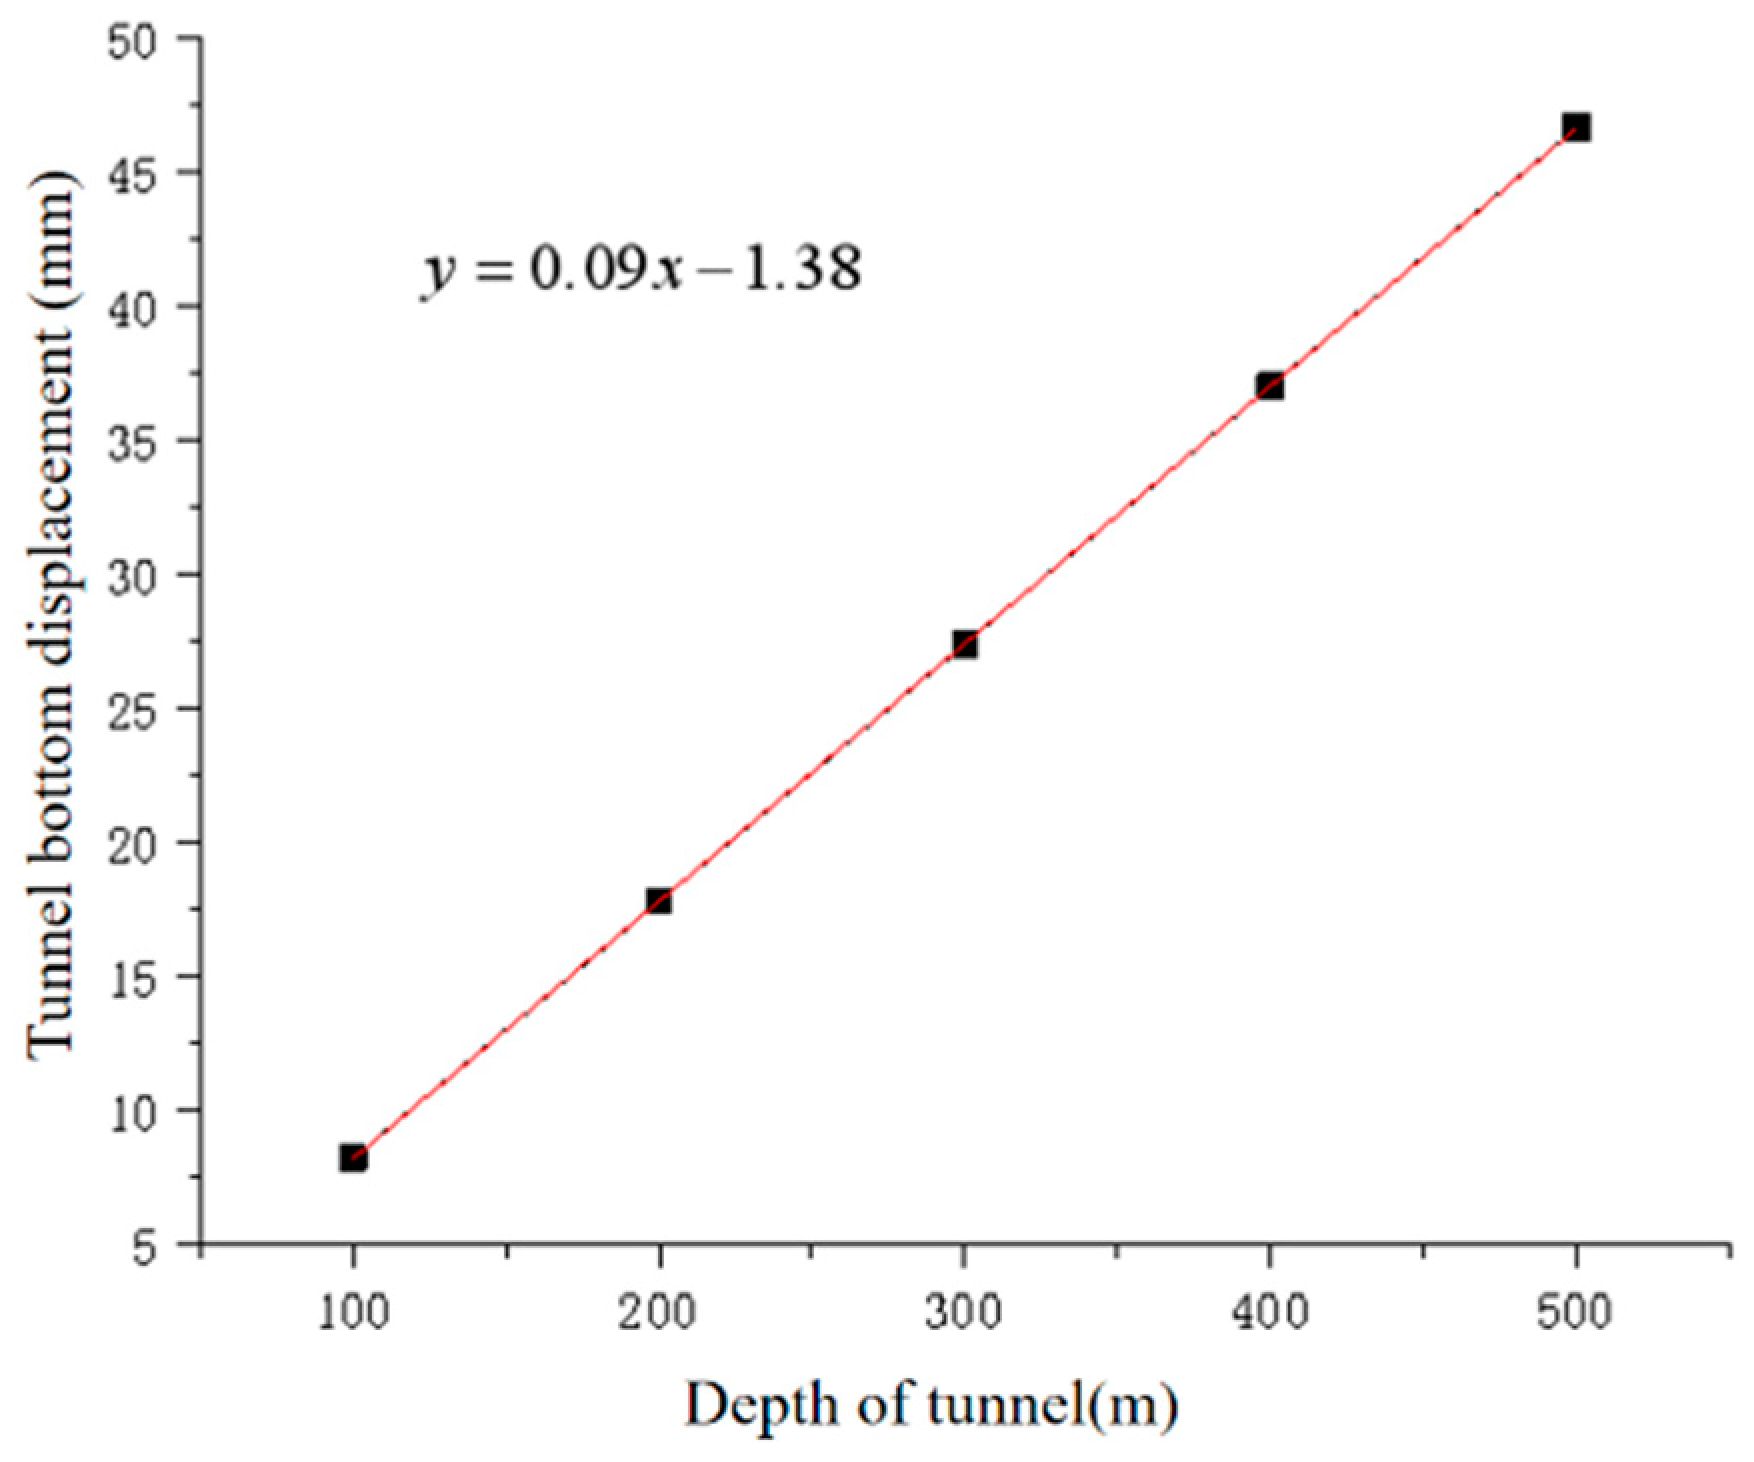
- Characteristics of tunnel floor heave under different tunnel depths
Figure 14 and numerical simulation results show that

Figure 14.
Fitting curves of tunnel bottom displacement under different tunnel depths. Black line: the connecting line between numerical simulation results and field testing results; red line: the fitted curve based on the formula.
- (1)
- The floor heave value of the tunnel increases with the increase in the tunnel depth, and it is basically linear.
- (2)
- In the case of other conditions being constant, when the tunnel depth increases from 100 m to 500 m, the minimum value of the tunnel floor heave that occurs at the tunnel depth of 100 m is 8.25 mm, and the maximum value that occurs at the tunnel depth of 500 m is 46.67 mm, and the latter is 5.65 times the former. Compared with the lateral pressure coefficient, rock dip angle, hard rock thickness, thin layer thickness, and elastic modulus of surrounding rock, the influence order is tunnel depth > lateral pressure coefficient > thin layer thickness > elastic modulus of surrounding rock > rock dip angle > hard rock thickness.
4.3. Multi-Factor Analysis
The F-test is a statistical test used to compare the variances of two or more groups to determine if they are significantly different from each other. It is often used in the context of an analysis of variance (ANOVA), regression analysis, and other statistical models [30]. The fundamental concept behind a variance analysis involves decomposing the total variation in data into two components: variation attributed to specific factors and variation due to random errors. An F-test is then employed to assess whether the impact of the factors is statistically significant. The F value is compared with the critical value Fα. α is the pre-given explicitness level, which is commonly used as α = 0.01, α = 0.05, and α = 0.10. Through the F value, it can be seen that if the different levels of control variables have a significant impact on the observation variables, the sum of variance squares between the observation variables is large, and the F value is also large. On the contrary, if the different levels of control variables do not have a significant impact on the observed variables, the sum of variance squares within the group is larger and the F value is smaller. At the same time, the F distribution table gives the corresponding probability value sig. If sig is less than the significant level, it is considered that there are significant differences in the overall mean of each control variable at different levels, otherwise. Generally, the larger the F value, the smaller the sig value. By the F value and aboriginality analysis, the influence order of each factor in the single-factor influence analysis can be verified, that is, tunnel depth > lateral pressure coefficient > thin layer thickness > elastic modulus of surrounding rock > dip angle > hard rock thickness.
In Table 4, the F and sig values of the modified model, intercept, lateral pressure coefficient, dip angle of surrounding rock, thickness of hard rock, thickness of the thin layer, elastic modulus of hard rock, tunnel depth, and their interaction are compared. The table shows that the influence of tunnel depth on tunnel displacement is very obvious, followed by the lateral pressure coefficient and thin layer thickness, and the influence of the rock dip angle and hard rock thickness is general; that is, the main effect is not obvious. In terms of the interaction of various factors, the interaction effects of various factors are not obvious, so it is no longer necessary to conduct a simple effect test.
Table 4.
Inter-subject effect test.
4.4. Influence Analysis of Support Mechanical Behavior
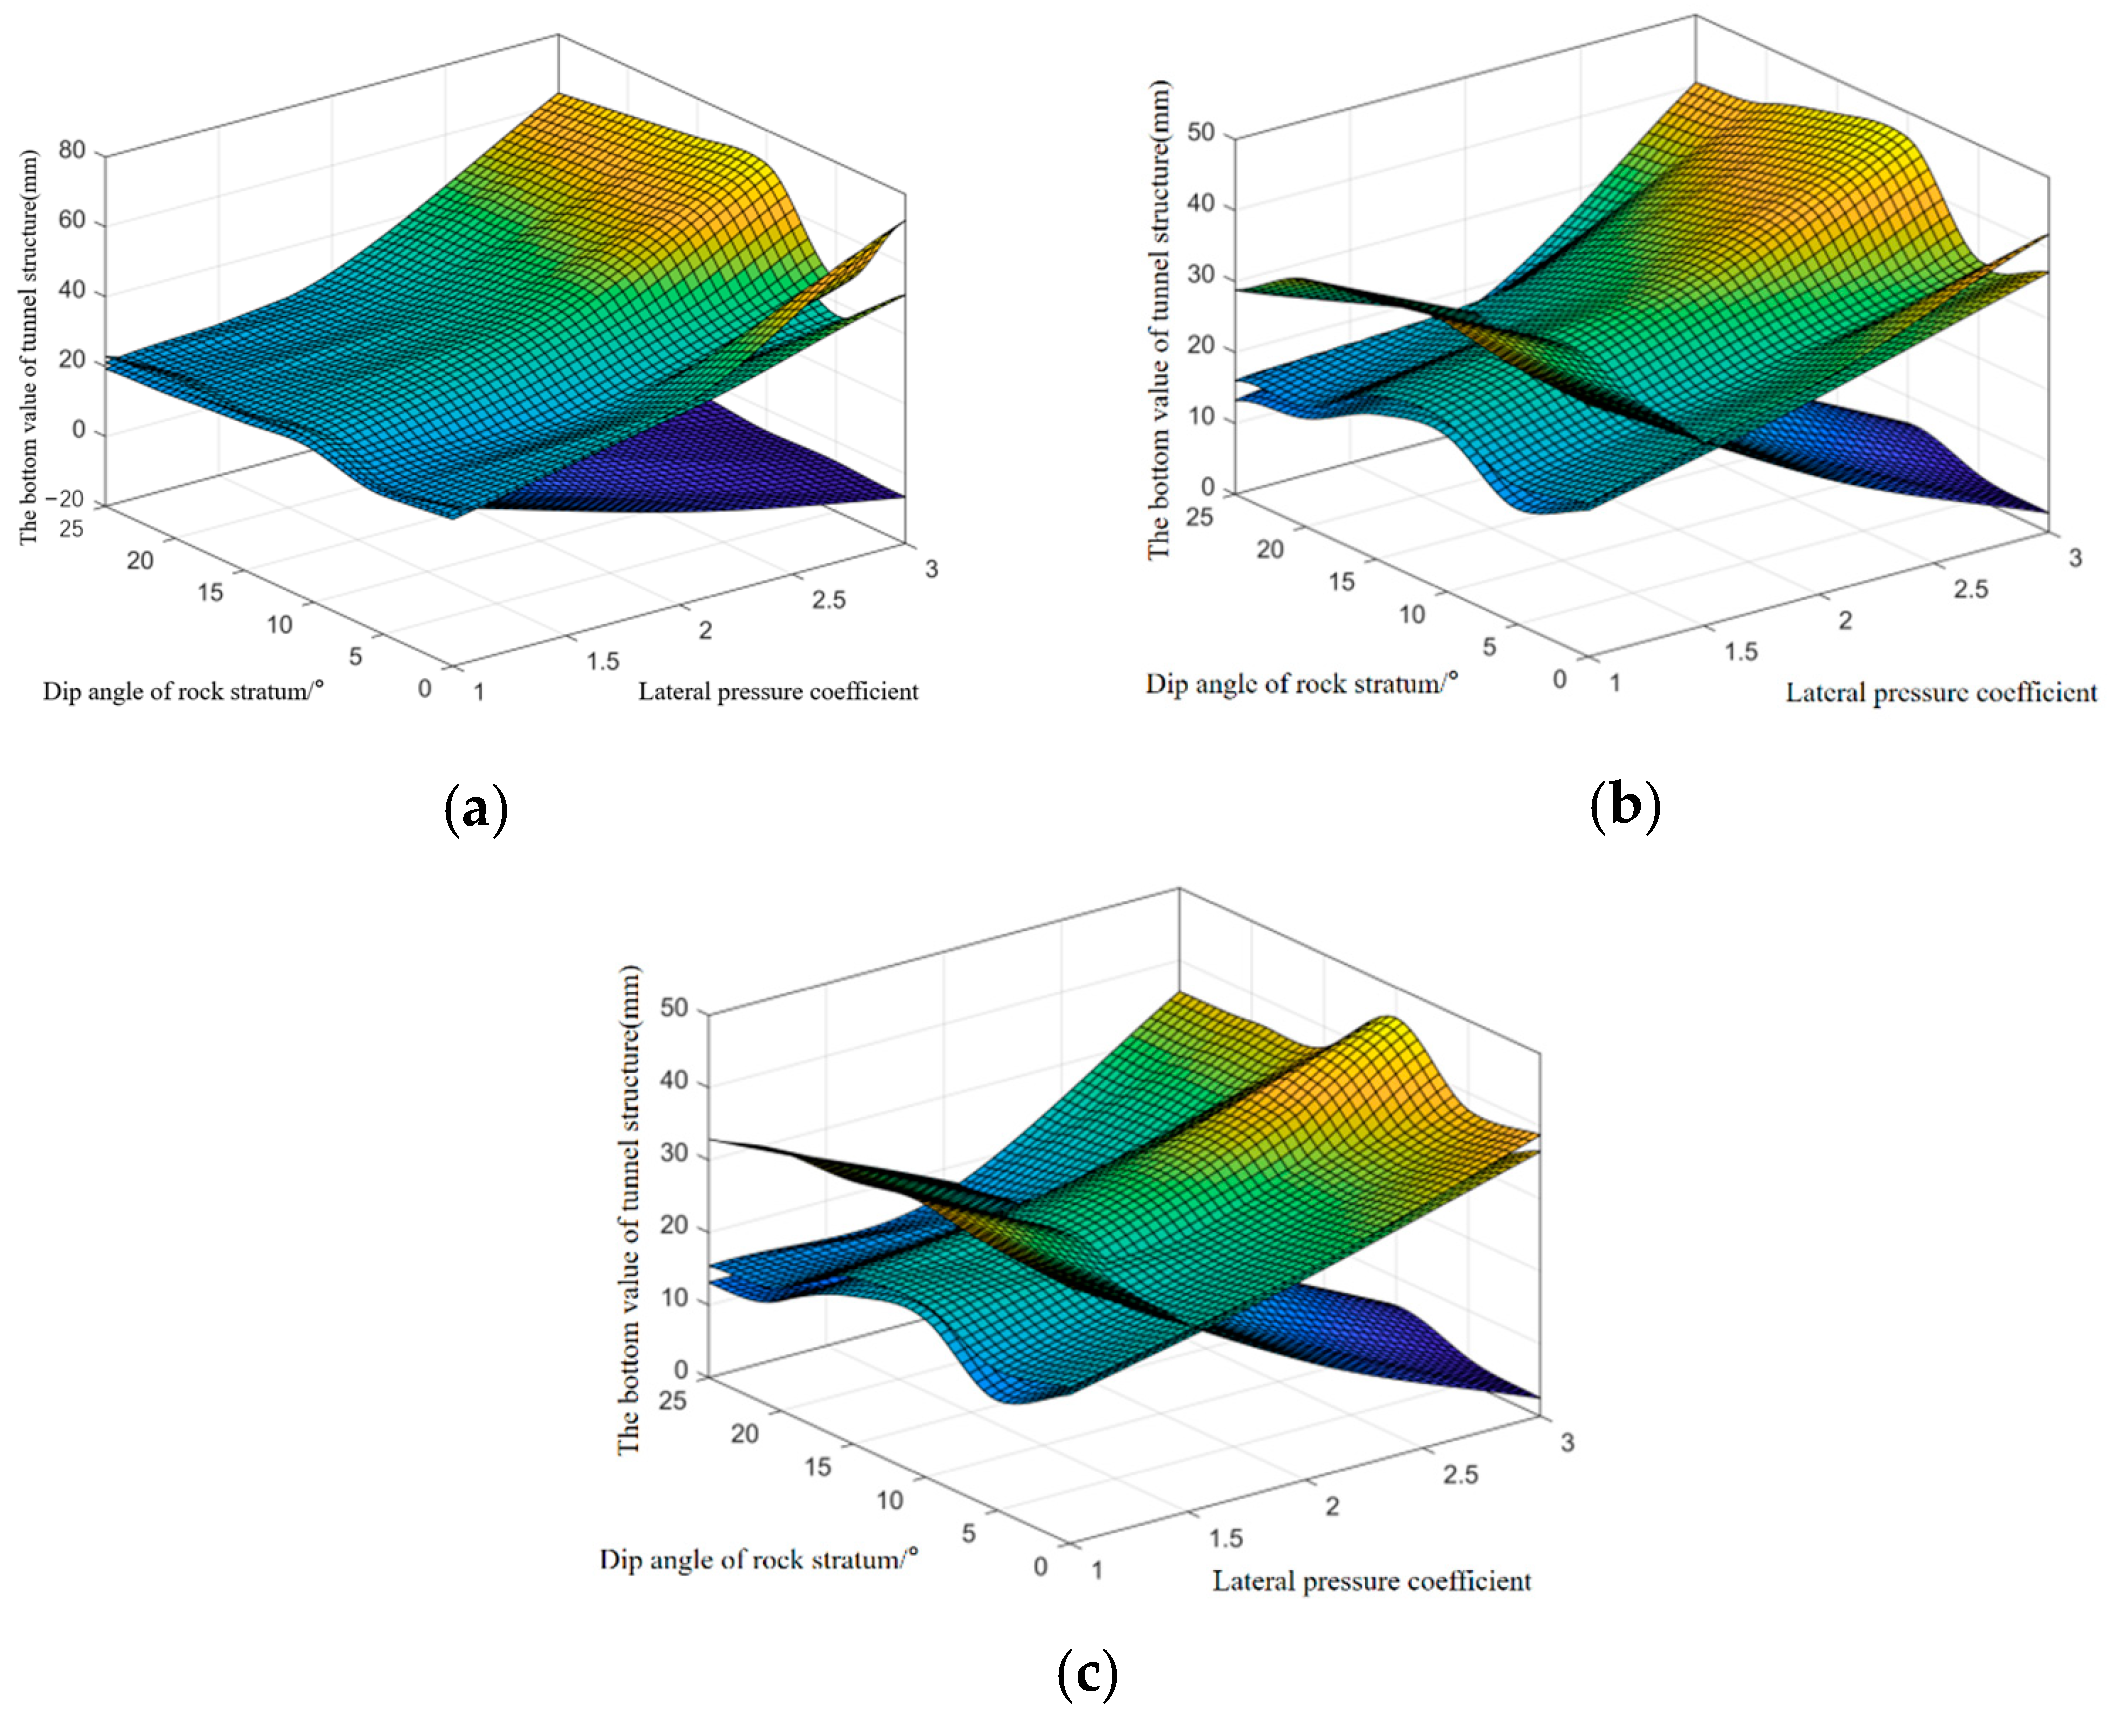
To preliminarily investigate the influence of support mechanical behavior on tunnel floor heave under gently inclined thin-layered surrounding rock, lateral pressure coefficients of 1.0, 2.0, and 3.0 were considered. The dip angles of the surrounding rock were set at 0°, 5°, 10°, 15°, 20°, and 25°, while the rock grades were classified as IIIb, IVb, and Vb. The support conditions evaluated included the initial support structure alone, the initial support combined with a secondary lining, and the initial support with both a secondary lining and an inverted arch filling layer. This resulted in a total of 162 models (3 × 6 × 3 × 3). Due to space constraints, the finite element model schematic is not provided, but the numerical simulation results are illustrated in Figure 15.

Figure 15.
Statistical chart of tunnel floor heave under different support conditions. (a) Only initial support. (b) Initial support and secondary lining structure. (c) Initial support with secondary lining structure and inverted arch filling layer.
From the above statistical and numerical simulation results, it can be obtained that
- (1)
- Tunnel floor heave predominantly manifests in surrounding rock of grades III and IV. However, in grade V rock, tunnel bottom sinking can occur due to the combined influence of high ground stress, tectonic stress, deviatoric stress, and the timing of support installation. This phenomenon is consistent with previous field investigation findings.
- (2)
- As illustrated in Figure 16, the application of secondary lining, in contrast to solely relying on initial support, can significantly mitigate tunnel floor heave. The effectiveness of this mitigation becomes more pronounced with an increase in the lateral pressure coefficient and the deterioration of surrounding rock conditions. For instance, when the lateral pressure coefficient is 1.0, floor heave ranging from 1 to 6 mm can be somewhat reduced. At a lateral pressure coefficient of 2.0, the floor heave in the range of 6 to 12 mm can be curtailed to some extent. When the lateral pressure coefficient reaches 3.0, the reduction in floor heave spans 12 to 22 mm, depending on the degree of the condition. Furthermore, under grade III surrounding rock conditions, floor heave in the range of 1 to 14 mm can be mitigated to varying degrees. This reduction is more pronounced under grade IV surrounding rock conditions, where floor heave ranging from 1 to 30 mm can be diminished to different extents.
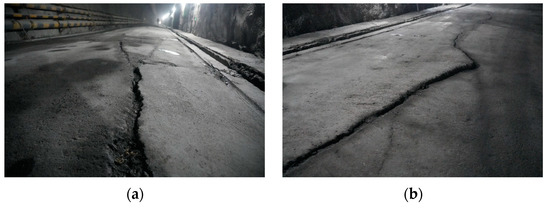 Figure 16. Comparison diagram of inverted arch uplift between tunnel with secondary lining and tunnel without secondary lining. (a) Only initial support. (b) Initial support and secondary lining structure.
 - (3)
- While the initial support, secondary lining structure, and inverted arch filling layer all effectively suppress tunnel floor heave, the disparity between the initial support and secondary lining structure is minimal. The difference typically ranges from 0.09 to 6 mm, following a trend similar to the one previously described. In most instances, this difference is within the 0.09 to 1.5 mm range. However, when the lateral pressure coefficient reaches 3.0 or when surrounding rock conditions deteriorate further, the disparity between the two becomes more pronounced.
5. Estimation and Prediction of Tunnel Floor Heave
5.1. Load Calculation Formula
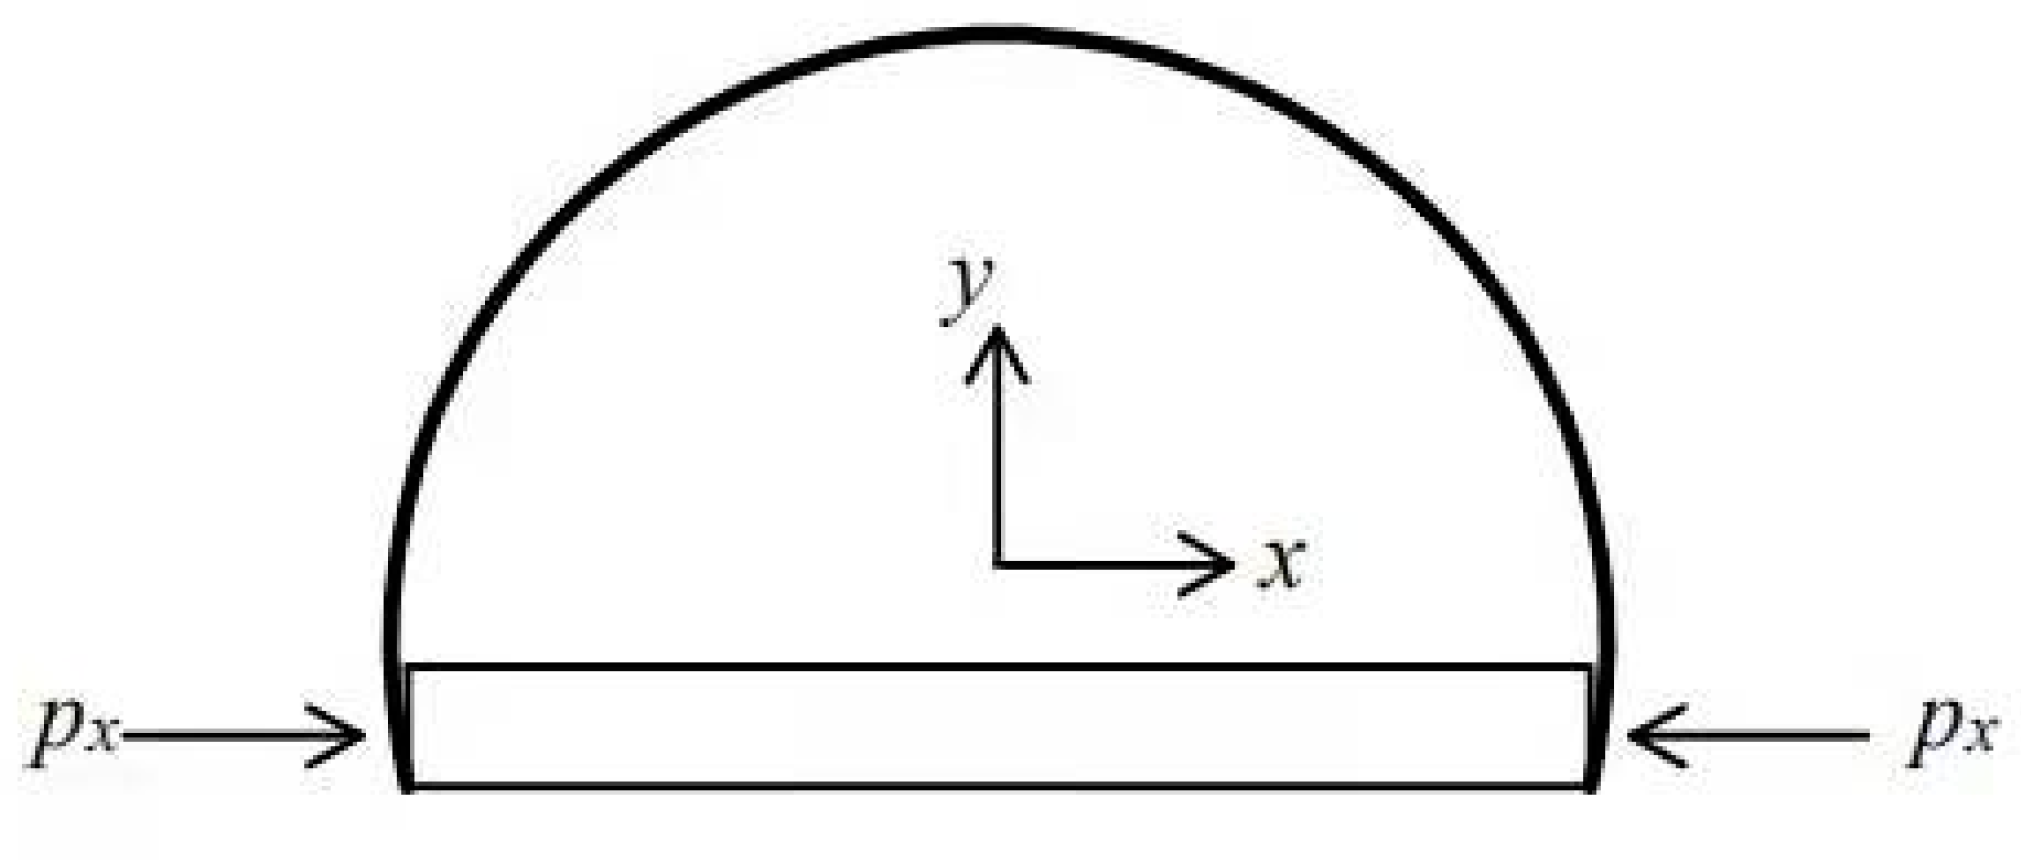
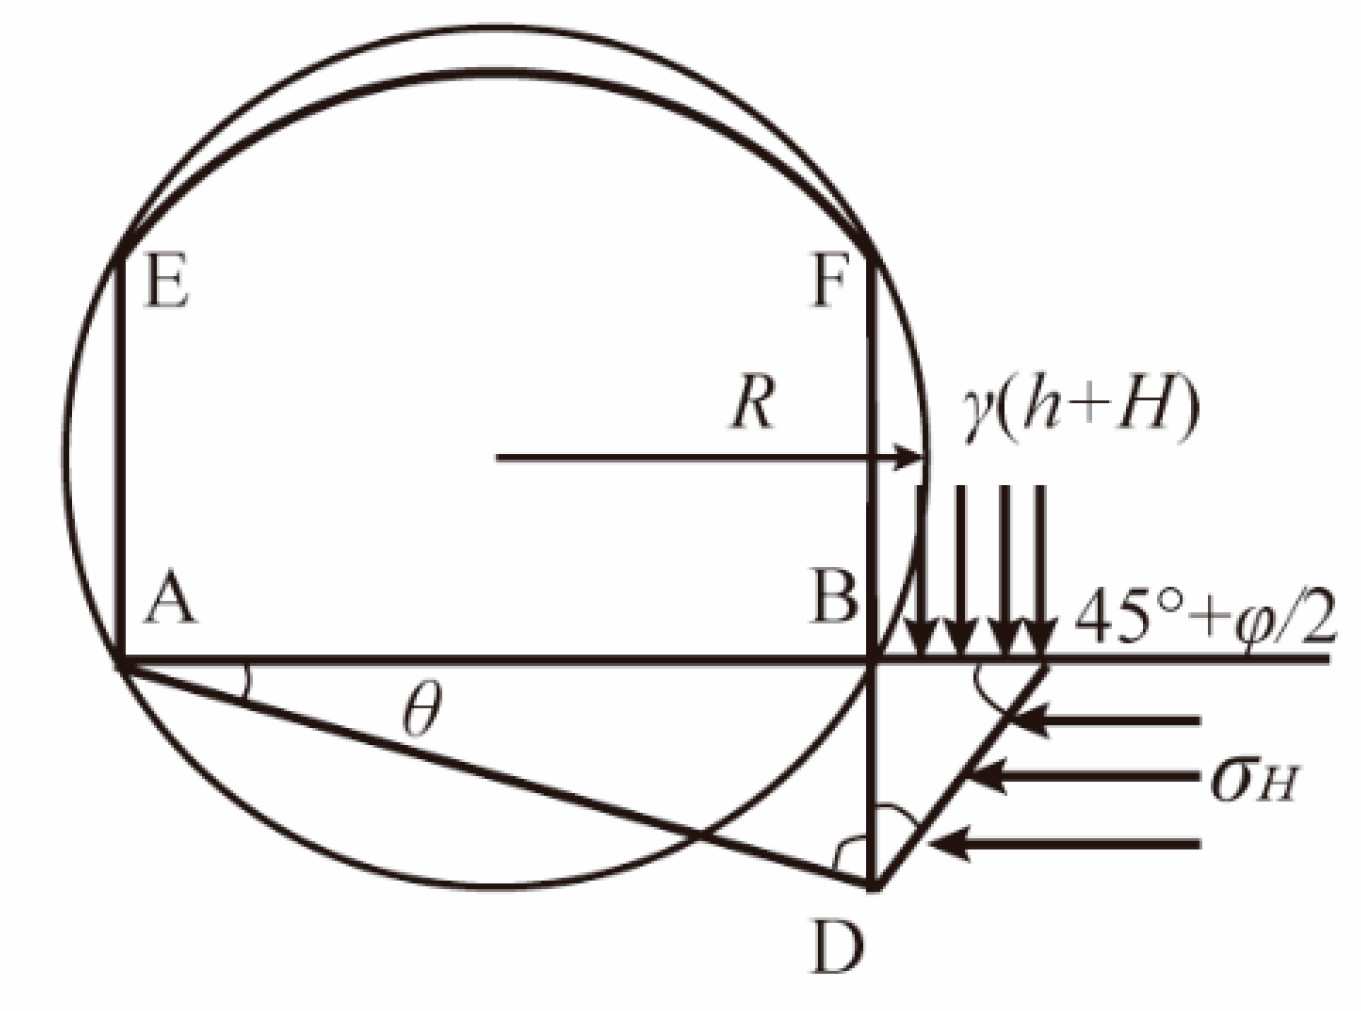
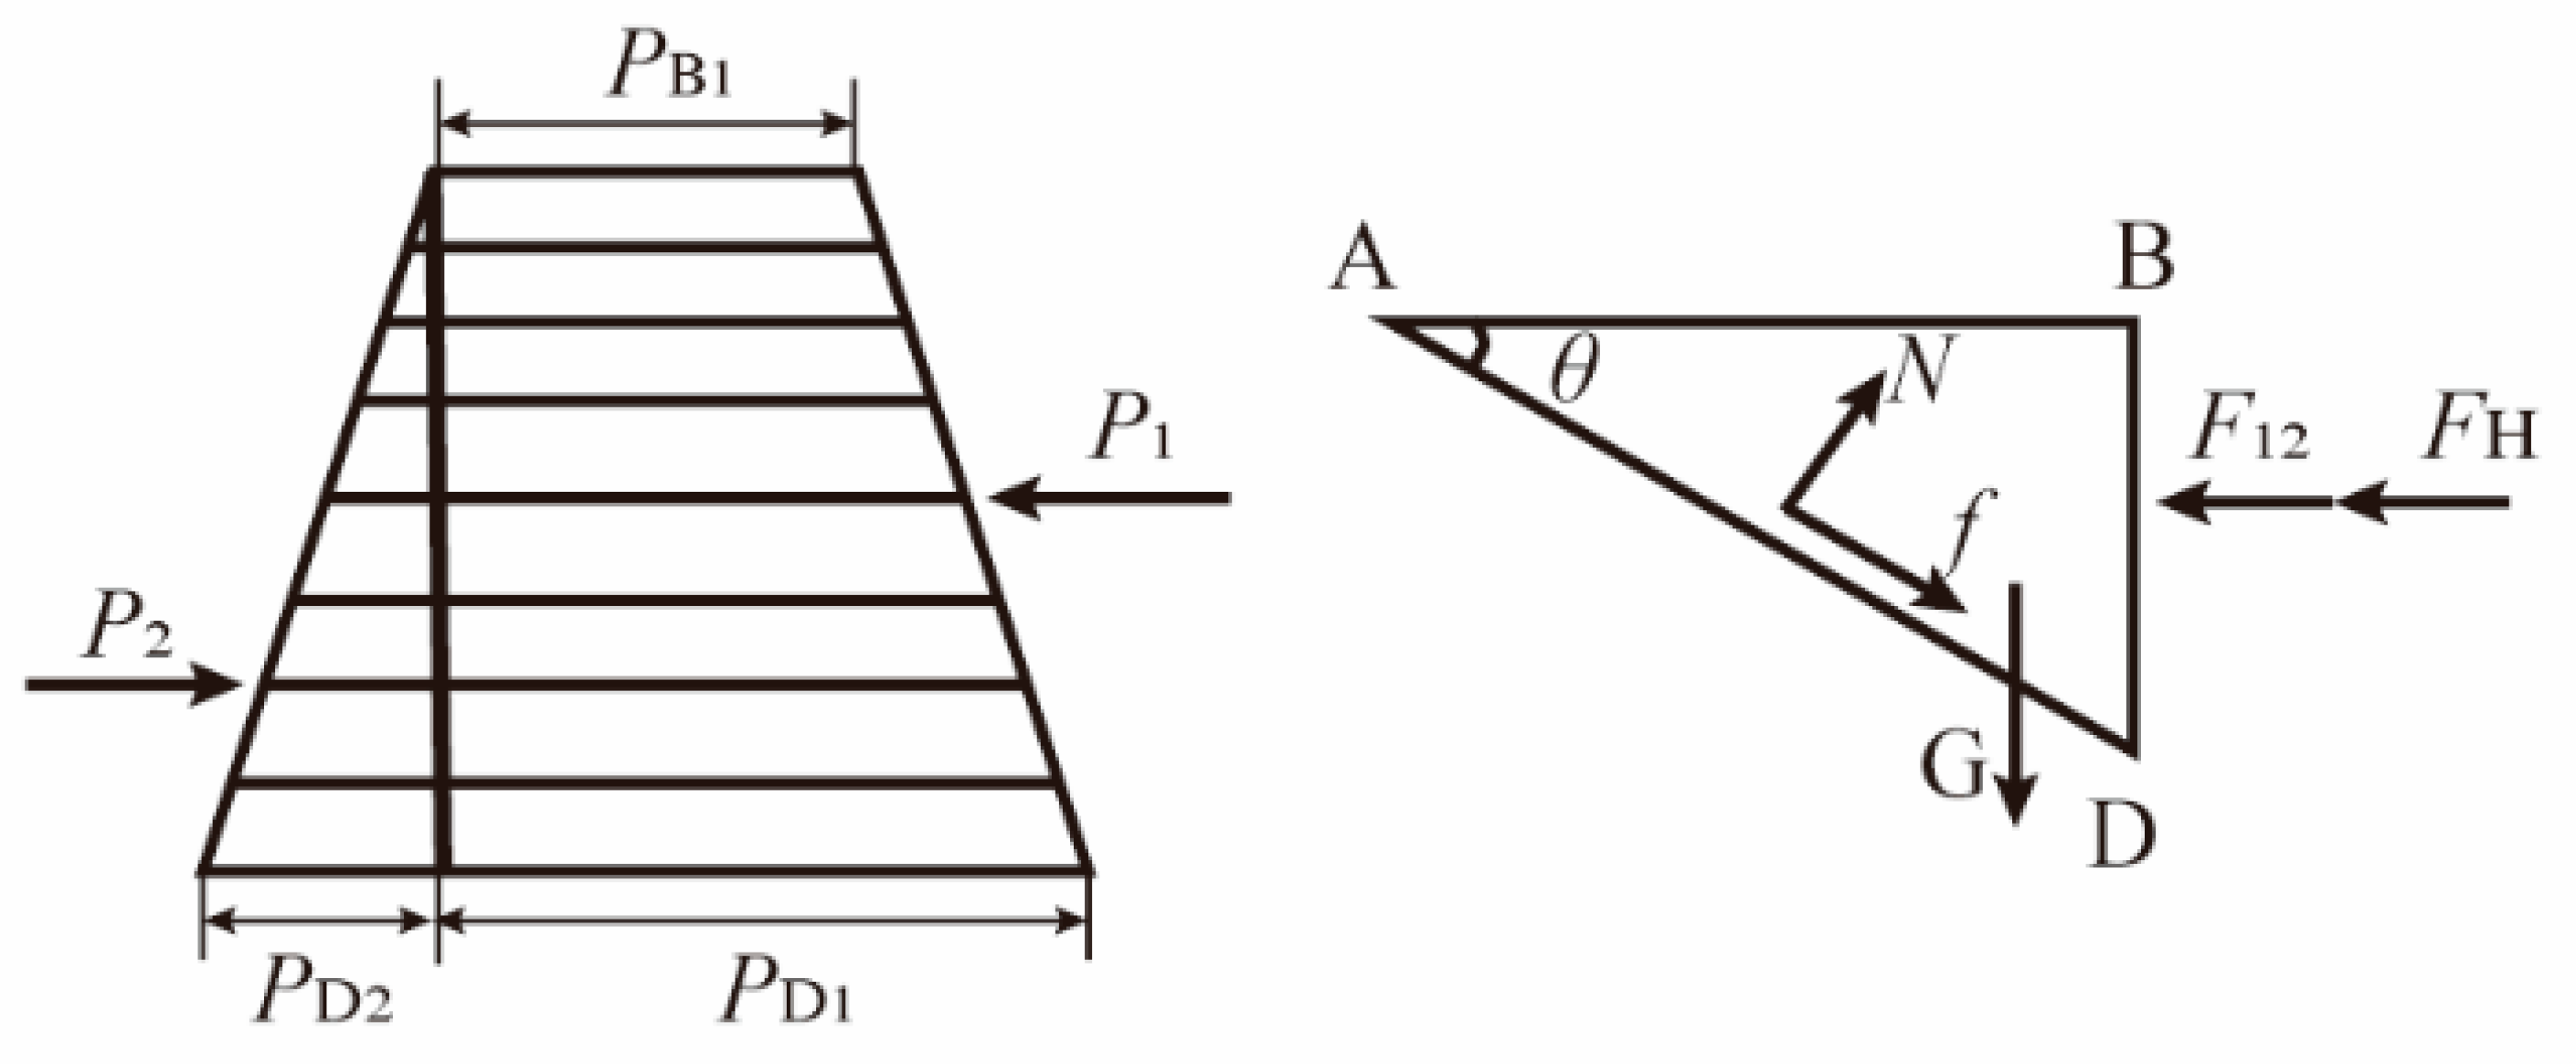
Based on the circumcircle theory of tunneling and the principles of active and passive earth pressure, a mechanical model of tunnel floor heave in inclined rock strata has been developed (as illustrated in Figure 17). According to this theory, the tunnel cross-section can be approximated as circular. Rankine’s earth pressure theory indicates that the surrounding rock at the tunnel floor generates both active and passive plastic stress. Specifically, the rock mass in zone BCD is subjected to active plastic pressure, while zone ABD is influenced by passive plastic pressure. When the rock mass in the ABD zone reaches a passive plastic state, horizontal ground stress, compounded by the effects of time, causes the tunnel floor at AB to bulge upward, leading to floor heave.
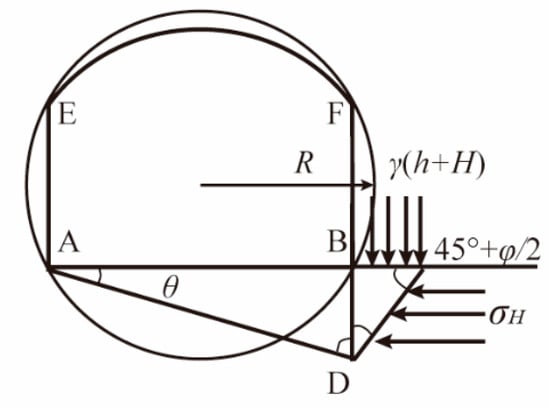
Figure 17.
Mechanical model of floor heave of inclined rock tunnel.
The angle between the slip surface CD of the active plastic zone of the tunnel floor and the plane AB of the floor is equal to , and the angle between the passive plastic zone and the horizontal plane is due to the influence of the weak surface AD of the rock contact. According to the theory of a pressure arch, regarding the vertical pressure from the BC surface to the surrounding rock in the pressure arch, is the height of the tunnel, is the height of the pressure arch, and is the active slip surface subjected to horizontal in situ stress. When the tunnel floor is in the limit equilibrium state, the active plastic body BCD generates a horizontal left active pressure on the right side of BD (BD = Z). The passive plastic body ABD generates a horizontal rightward active pressure on the left side of BD, where
The difference between the active force and the passive force on the BD surface is the actual force that drives the ABD to slip to the left, and the horizontal in situ stress also acts on the BD surface (as shown in Figure 18).
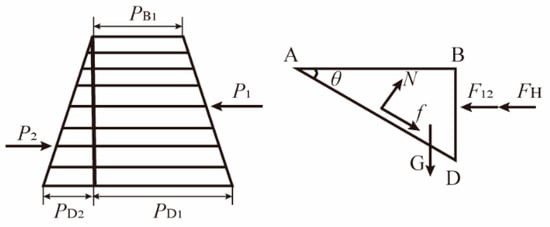
Figure 18.
Force analysis of passive plastic zone.
When the surrounding rock pressure of the tunnel floor is greater than the strength of the surrounding rock (), the stress instability of the tunnel floor occurs; that is, the floor heave occurs. In order to control the floor heave of the tunnel, it is necessary to use the support force () to balance the surrounding rock pressure of the tunnel floor and have a certain safety factor, a, to ensure the stability of the tunnel floor; that is,
In the formula, is the uniaxial compressive strength of rock; is tunnel floor area per unit length along the axial direction.
5.2. Relationship between Stress and Displacement of Surrounding Rock Based on Nishihara Model
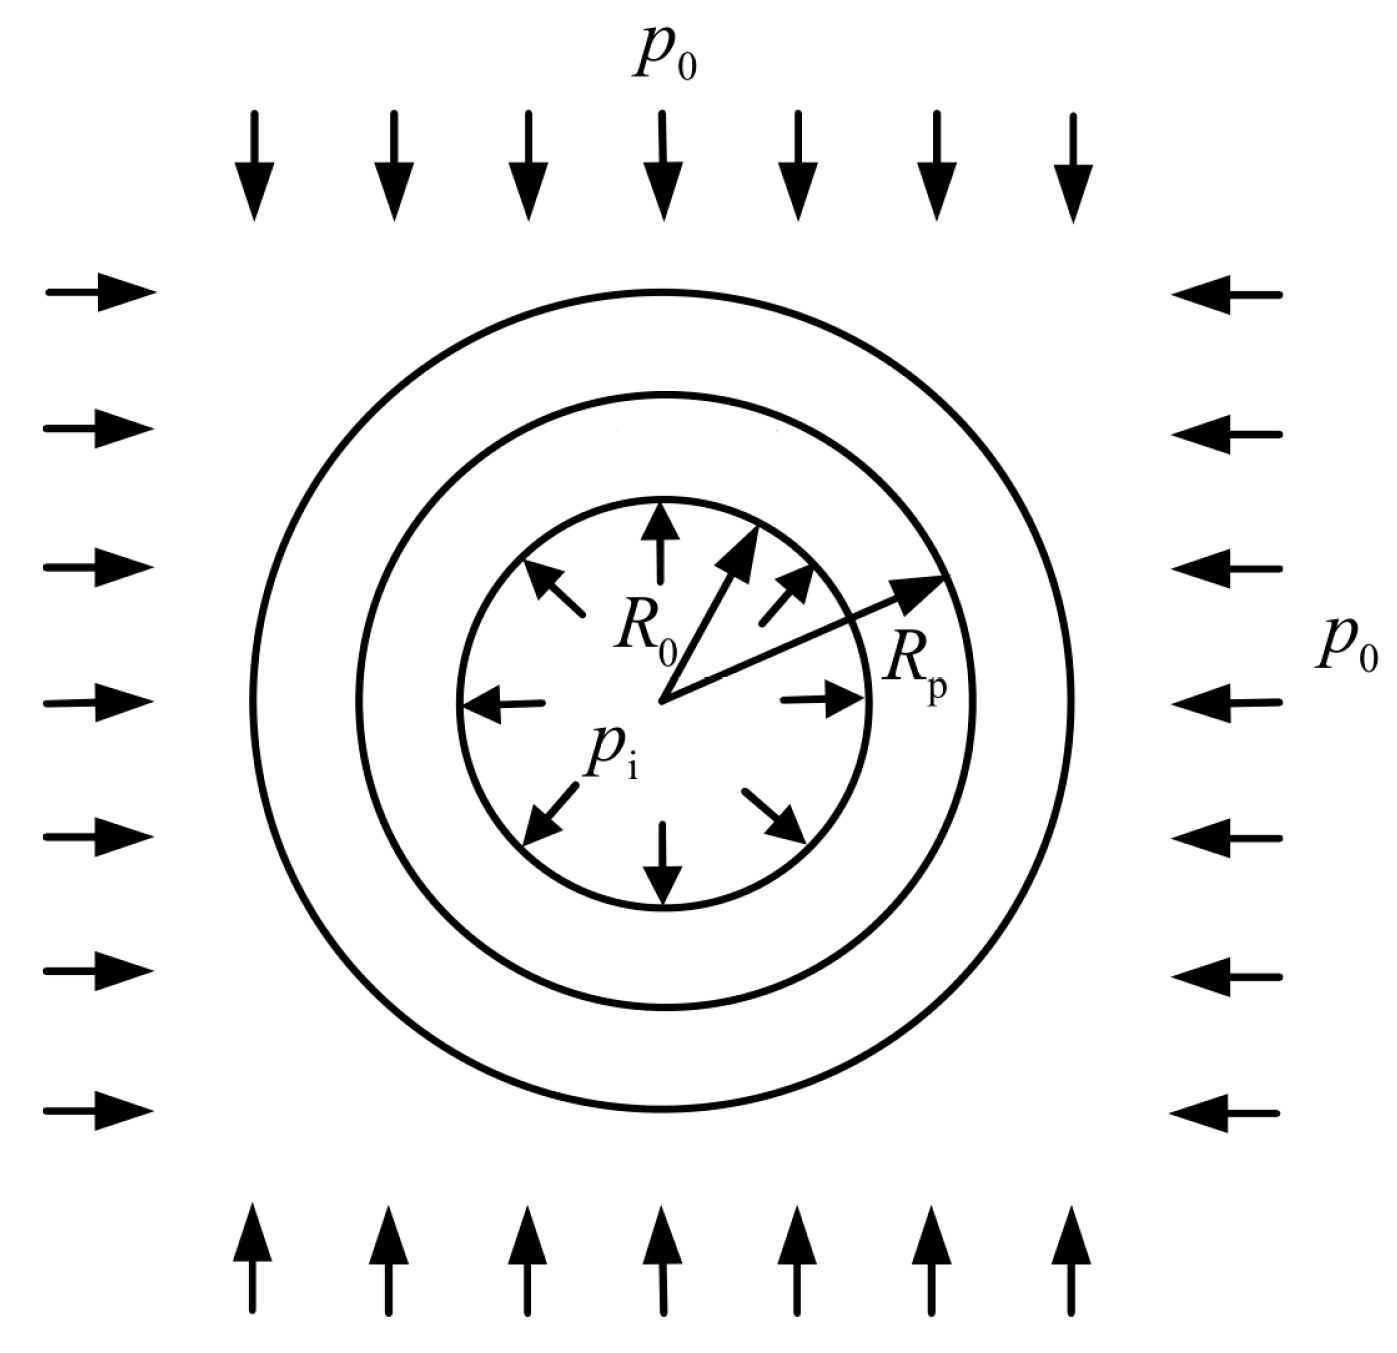
The tunnel mechanical model shown in Figure 19 is established. Suppose that (1) the tunnel is under hydrostatic pressure, and the original rock stress is ; (2) the tunnel section is circular and the radius is ; (3) the surrounding rock of the tunnel is a continuous, uniform, and isotropic viscoelastic–viscoplastic body, the radius of the viscoplastic zone is , and the deviatoric stress conforms to the Nishihara model; (4) the resistance of the supporting structure acting on the surrounding rock is , assuming that is constant; (5) it is assumed that the volumetric strain does not occur in the viscoelastic zone and the viscoplastic zone, and the dilatancy effect caused by the development and expansion of cracks after the yield of surrounding rock is not considered; (6) in the calculation, it is stipulated that the compression of surrounding rock is positive, the corresponding strain is also positive, and the internal development direction of the displacement orientation tunnel is positive [28].

Figure 19.
Mechanical model of tunnel.
It is assumed that the deviatoric stress conforms to the Nishihara model, as shown in Figure 20. The model consists of three parts: the elastomer, viscoelastic body, and viscoplastic body. Among them, is the shear modulus of the elastomer, is the shear modulus of the viscoelastic body, is the viscosity coefficient of the viscoelastic body, is the viscosity coefficient of the viscoplastic body, and is the yield stress of the viscoplastic body.
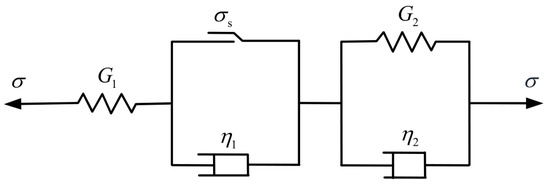
Figure 20.
Nishihara model.
It is assumed that the strength criterion conforms to the Mohr–Coulomb strength criterion:
In the formula, is the radial stress of surrounding rock; is the tangential stress of surrounding rock; and is the distance between the analysis point and the center of the circle in polar coordinates. ; ; is the cohesion of surrounding rock; and is the internal friction angle of surrounding rock.
The relationship between the radius of the viscoplastic zone and the supporting force , and the time , is obtained.
By substituting () into the displacement formula of the viscoplastic zone, the expression of the displacement at the hole wall is obtained as follows:
Among them, ; through the above formula, the relationship between the supporting force and the displacement and time at the wall can be obtained.
An Algorithm 1 was developed in MATLAB (2022b) to verify the aforementioned formula. The algorithm’s results illustrate the relationship between the surrounding rock’s support force, displacement, and time. As shown in Figure 21, when employing strong support, such as a combination of initial and secondary lining with higher stiffness, the support characteristic curve appears as a straight line with a steeper slope. This indicates that the surrounding rock enters a viscoelastic state due to the increased support force. However, this method is costly, and the support force continues to escalate rapidly over time, which may compromise the stability of the support structure. To balance effectiveness and cost, a yielding support strategy can be employed. The initial support can satisfy early construction demands, while the combination of initial support deformation with subsequent higher stiffness support can accommodate the viscoplastic behavior of the surrounding rock, thereby ensuring the stability of both the surrounding rock and the support structure.
| Algorithm 1: The solution of support force relationship. | |
| Input: R0, k, w, G_1, G_2, n_1, n_2, a, p, t, lb, ub | |
| Output: u0, Rp | |
| /*Initialization*/ | |
| 1: | tol: f64 = 0.01;//Initialize allowable tolerance for the solution. |
| 2: | iter: uzise = 1 + (((ub − lb)/tol).log2()).floor() as usize;//Initialize maximum iteration. |
| 3: | iter0: uzise = 0;//Initialize current iteration. |
| /*Main Program*/ | |
| 4: | flb: f64 = solving_f(R0, k, w, G_1, G_2, n_1, n_2, a, p, t, lb);//Calculate minimum value of the parameter f. |
| 5: | fub: f64 = solving_f(R0, k, w, G_1, G_2, n_1, n_2, a, p, t, ub);//Calculate maximum value of the parameter f. |
| 6: | if flb ×fub > 0.0 then |
| 7: | print (“There is no solution within the given interval.”); |
| 8: | break; |
| 9: | else |
| 10: | while iter0 < iter − 1, do |
| 11: | xtry: f64 = 0.5 × (lb + ub); |
| 12: | ftry: f64 = solving_f(R0, k, w, G_1, G_2, n_1, n_2, a, p, t, xtry); |
| 13: | fb: f64 = solving_f(R0, k, w, G_1, G_2, n_1, n_2, a, p, t, lb); |
| 14: | if fb × ftry > 0.0 then |
| 15: | lb = xtry; |
| 16: | else |
| 17: | ub = xtry; |
| 18: | end |
| 19: | iter0 += 1; |
| 20: | end |
| 21: | Rp: f64 = xtry; |
| 22: | u0: f64 = solving_u0(t, R0, k, w, G_1, G_2, n_2, a, Rp); |
| 23: | end |
| 24: | returnu0, Rp |
| /* User-defined Functions*/ | |
| 25: | fn solving_f(R0: f64, k: f64, w: f64, G_1: f64, G_2: f64, n_1: f64, n_2: f64, a: f64, p: f64, t: f64, Rp: f64) → f64 |
| 26: | { |
| 27: | Solve Equations (1)–(10) to obtain the value of parameter f; |
| 28: | return f |
| 29: | } |
| 30: | fn solving_u0(t: f64, R0: f64, k: f64, w: f64, G_1: f64, G_2: f64, n_2: f64, a: f64, Rp: f64) → f64 |
| 31: | { |
| 32: | r = ((2.0/(1.0 + k)) × (w + a)) − a; |
| 32: | y = 1.0 − (r/w); |
| 33: | Solve Equation (21) to obtain the value of parameter u0; |
| 34: | return u0; |
| 35: | } |
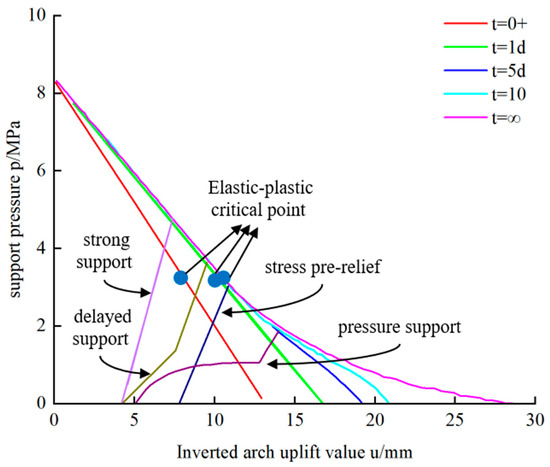
Figure 21.
The relationship between surrounding rock supporting force and displacement and time is solved.
5.3. Estimation of Tunnel Floor Heave Based on Deformation Statistics
In this paper, under the condition of IIIb-, IVb-, Va-, and Vb-grade gently inclined thin-layered surrounding rock, six kinds of surrounding rock dip angles (0°, 5°, 10°, 15°, 20°, 25°), five kinds of lateral pressure coefficients (0.5, 1.0, 1.5, 2.0, 3.0), and seven kinds of calculation spans (8.83 m, 13.0 m, 9.15 m, 10.0 m, 13.22 m, 9.37 m, 13.6 m), a total of 270 working conditions are numerically simulated. The results are shown in Table 5.
Table 5.
The value of tunnel floor heave under different conditions (mm).
According to the data in Table 5, combined with the structural statics calculation formula and the previous research results, the maximum floor heave calculation formula can be written as
In the formula,
is the maximum floor heave value of the tunnel (mm);
is the uniform load acting on the tunnel bottom structure (kN/m);
is the calculation of the span (m) for the tunnel inverted arch structure;
is the elastic modulus of tunnel lining (MPa);
is the tunnel lining section inertia moment (m4);
is the equivalent coefficient.
Using Matlab software, based on Table 5 data, the equivalent coefficient is fitted, and the following calculation formulas are obtained:
In the formula, is the grade of surrounding rock; is the side pressure coefficient; and is the rock dip angle.
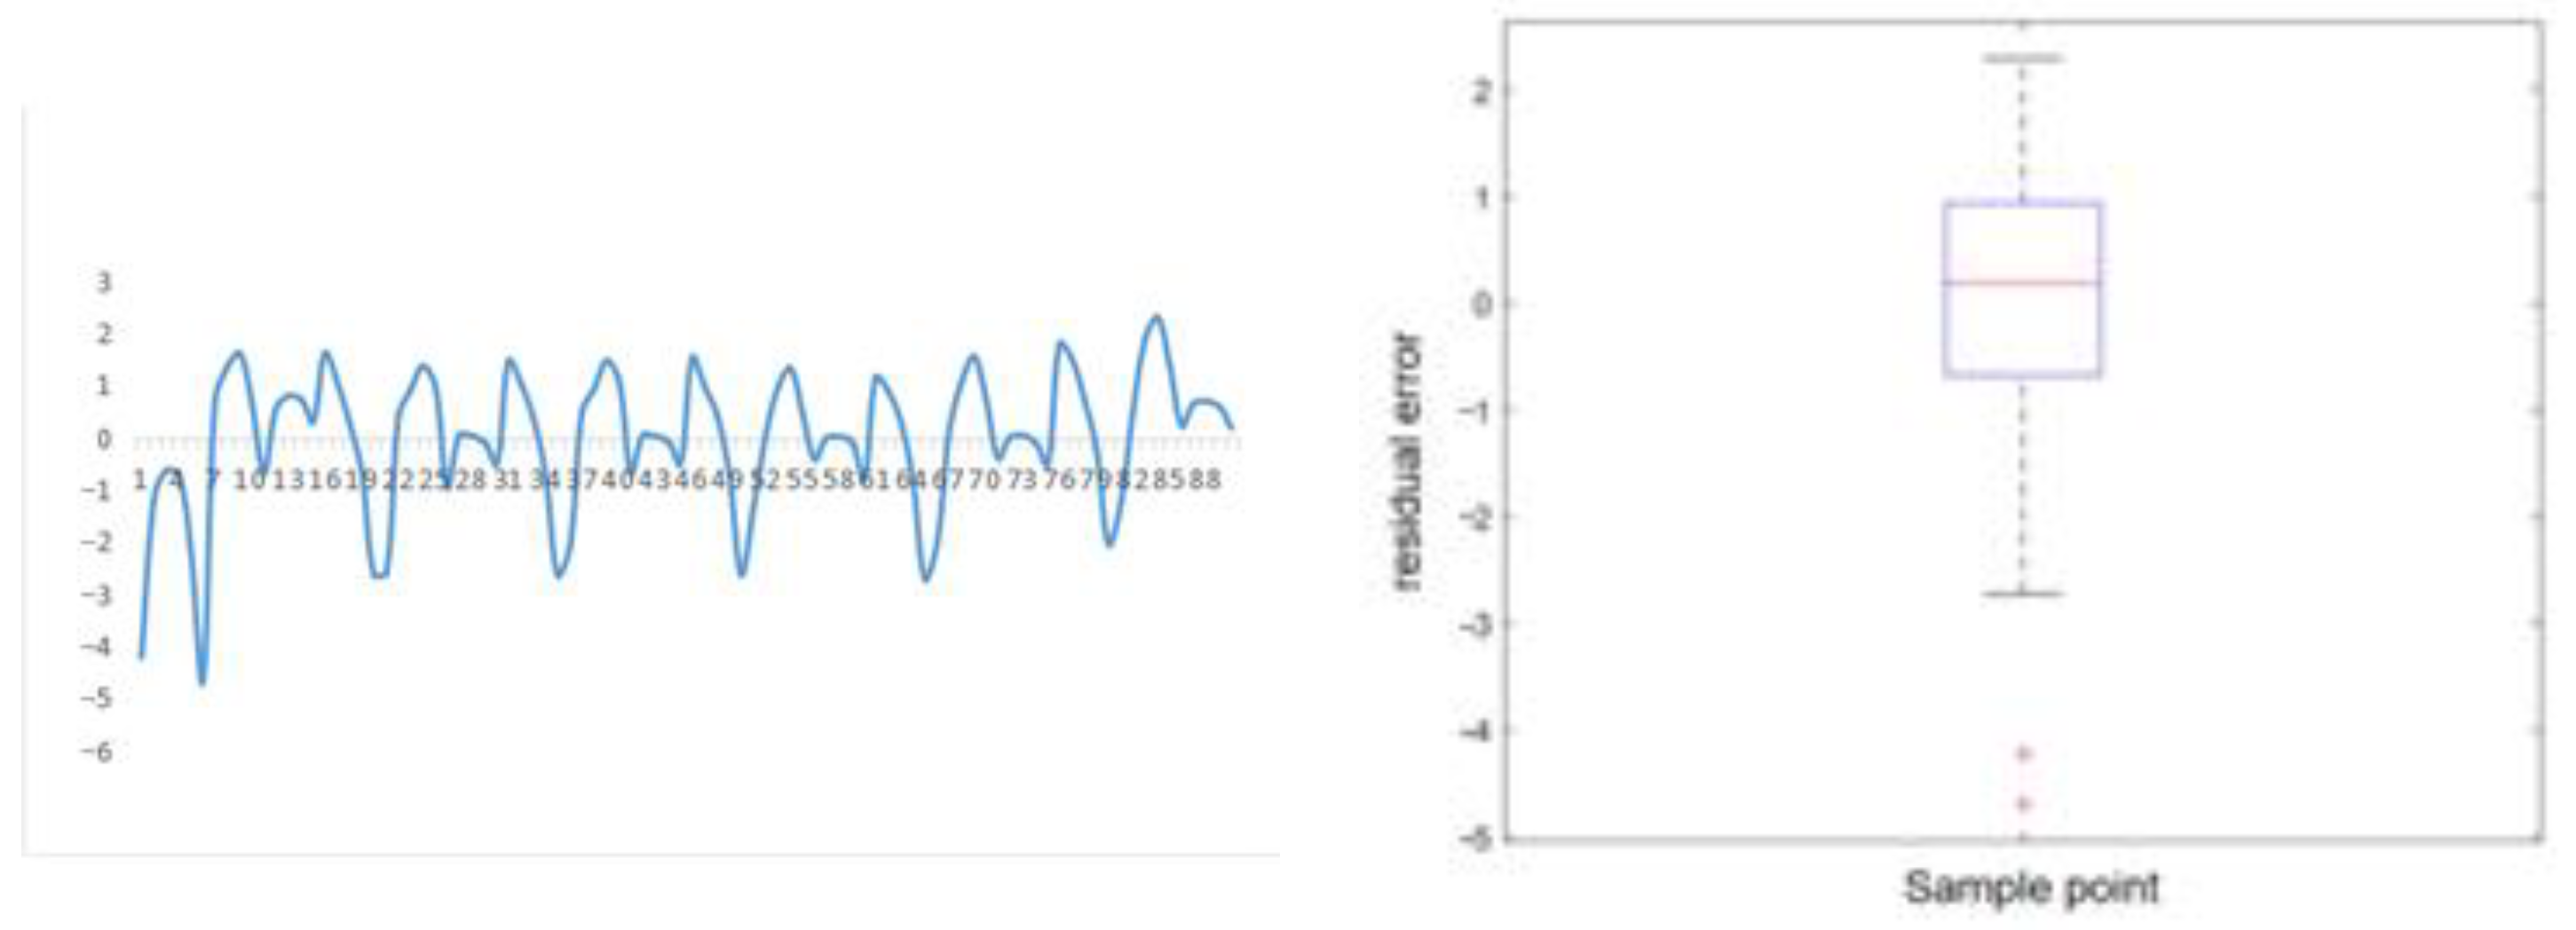
This estimation formula has high accuracy after fitting . Randomly testing 90 groups of data, the residual is shown in Figure 22.

Figure 22.
Residual plot.
Formula (18) is transformed to obtain the calculation formula of tunnel floor heave load as follows:
The above method is used to estimate and predict the tunnel floor heave, which is consistent with the actual situation, as shown in Figure 23.

Figure 23.
Prediction and deformation of tunnel floor heave based on deformation statistics.
5.4. Intelligent Prediction Model of Tunnel Bottom Drum Based on BP Algorithm
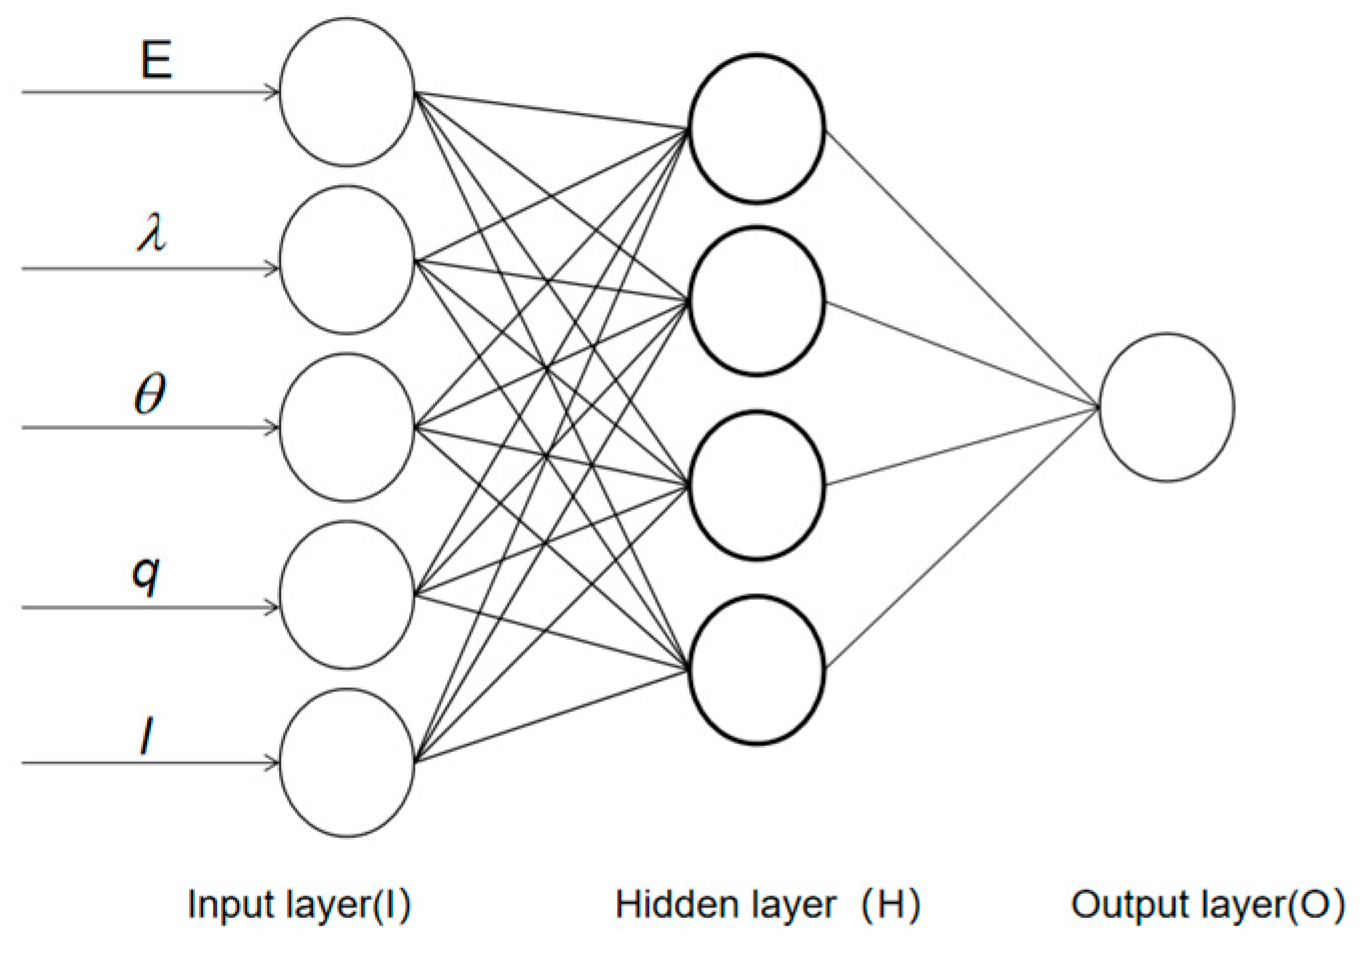
The neural network model mainly includes the input layer, the hidden layer, and the output layer. In the numerical test, elastic modulus , lateral pressure coefficient , rock dip angle , tunnel bottom drum load , and inverted arch calculation span are used as five microscopic variables. In the construction of the BP neural network model, five variables are used as input variables to construct the input layer of the network model. In the training and prediction of the network model, five variables are input into the network model through the input layer nodes. In addition, the tunnel floor heave in the test results is used as the output variable to construct the output layer of the network model. Finally, the simulation and prediction results are output through the output layer nodes. A three-layer BP neural network model is constructed by using Python programming, as shown in Figure 24 and Formula (19): it can be seen from the figure that the established BP neural network model has five input layer nodes, one output layer node, and four hidden layer nodes.
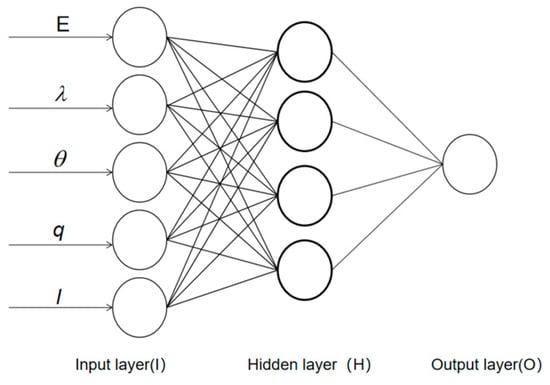
Figure 24.
BP neural network model.
In the formula, is a 20 × 7 matrix; is a 1 × 20 matrix; is a 20 × 1 matrix; is a 1 × 1 matrix; and is .
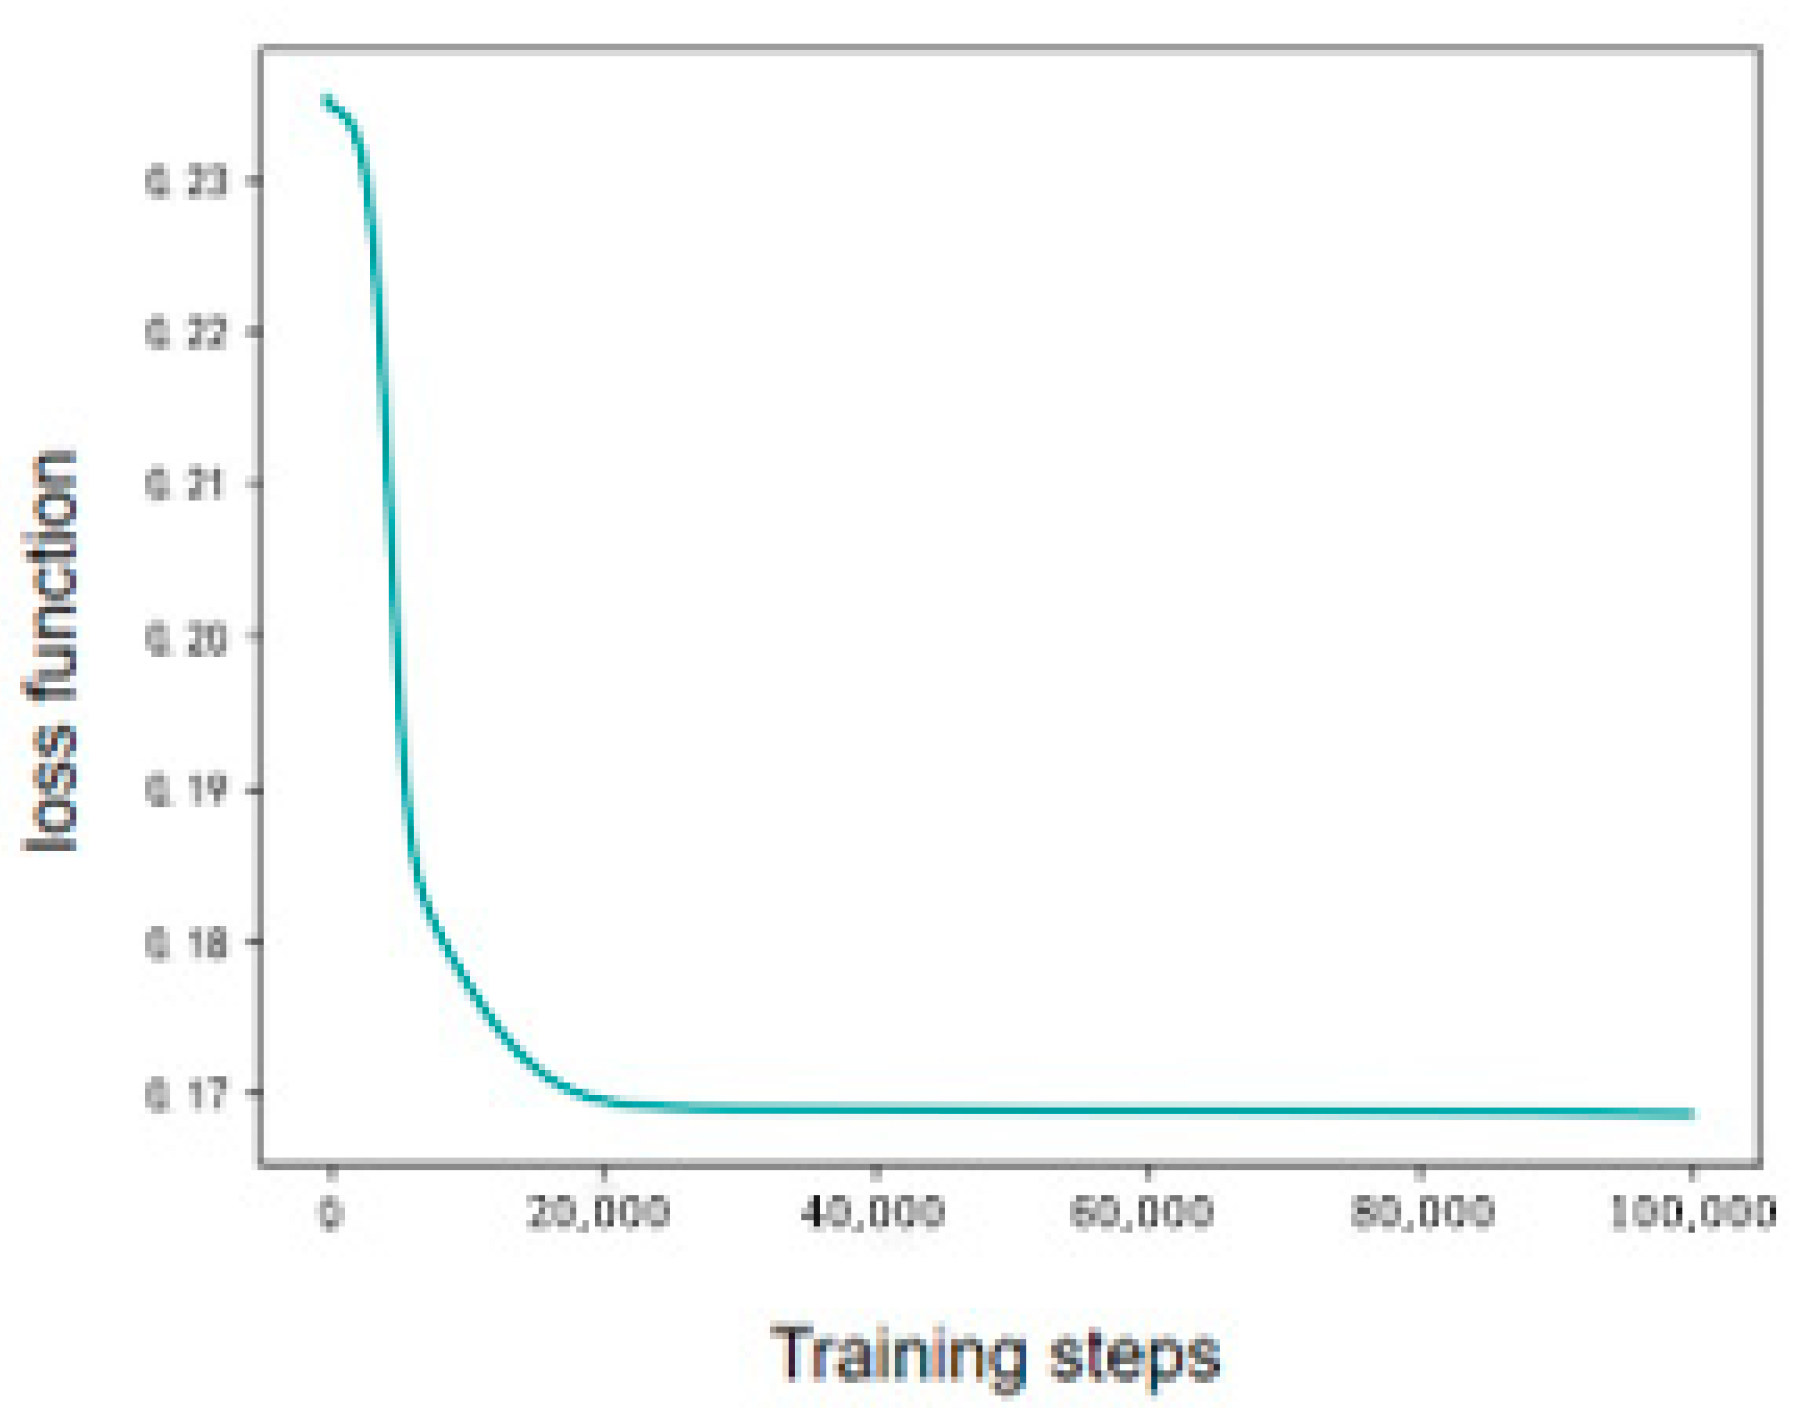
During training, the target error is set to 0.01, with a learning rate of 0.01. The error variations throughout the training process are depicted in Figure 25. The model error falls within the specified range after approximately 100,000 iterations. The developed BP neural network model meets the required accuracy. Using the above model combined with the actual situation of the tunnel face (as shown in Figure 26), the amount of inverted arch uplift is predicted, which is consistent with the actual situation on site, as shown in Figure 27.
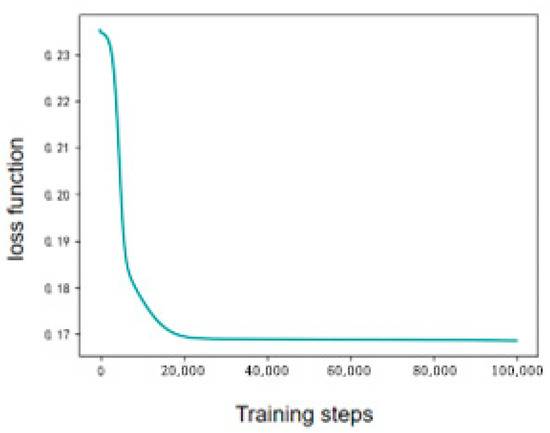
Figure 25.
The evolution of error during the training process of the BP neutral model.
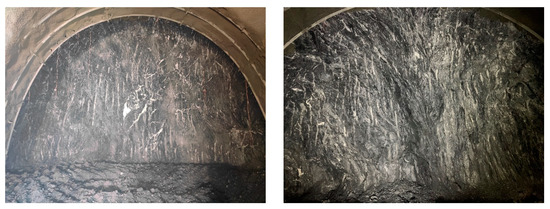
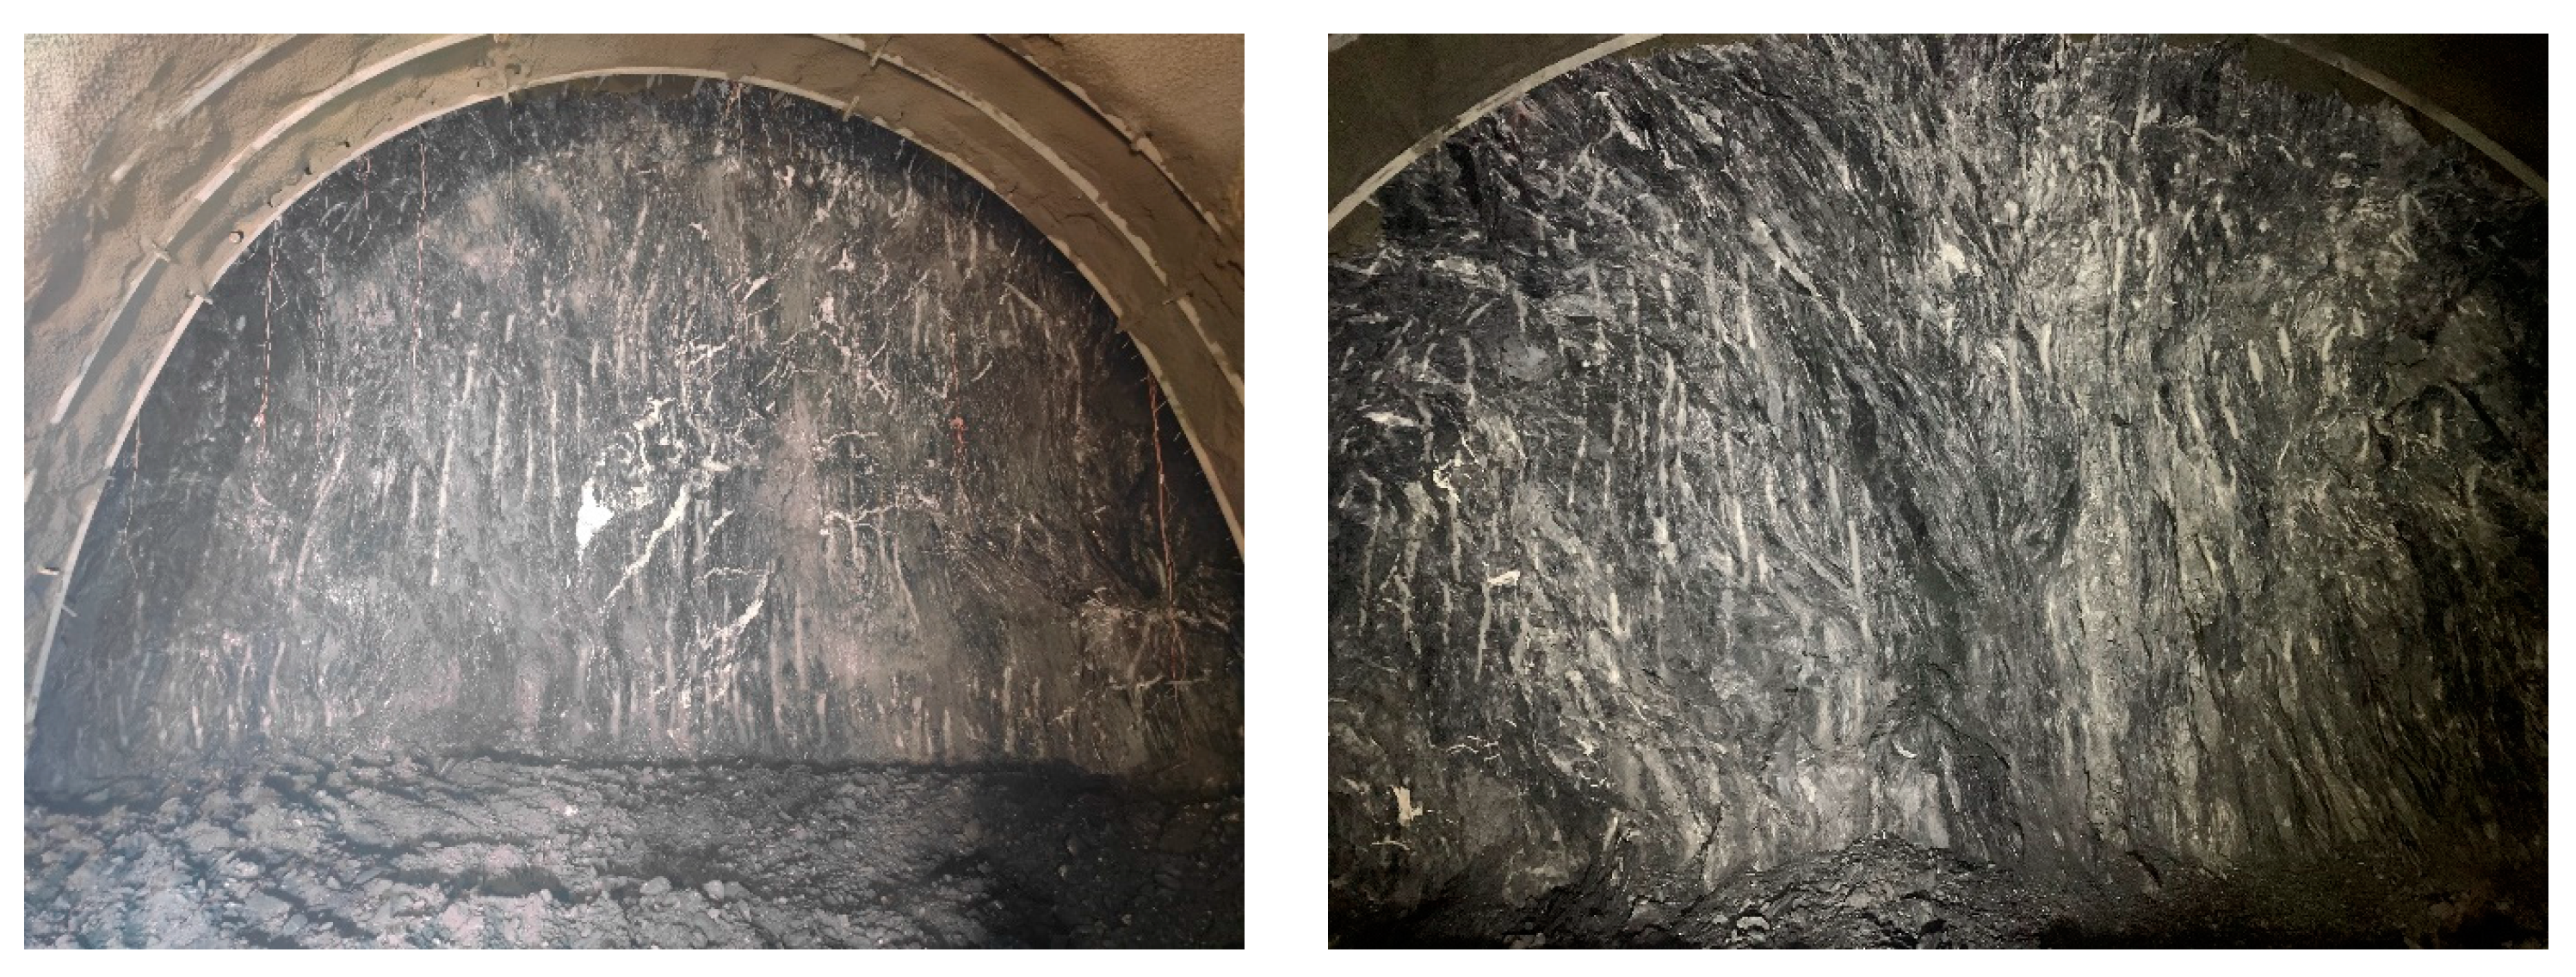
Figure 26.
Tunnel face situation.
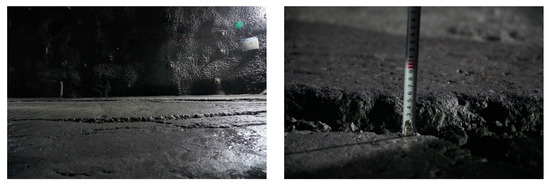
Figure 27.
Estimation and prediction of tunnel floor heave based on BP algorithm.
6. Discussion
The implications of this study are broad, offering both theoretical and practical contributions to the field of tunneling. The validated models and findings provide a robust framework for predicting and mitigating tunnel floor heave in future projects, particularly in challenging geological settings. In conclusion, this study fills a critical gap in the existing literature on tunnel floor heave, offering new insights and validated models that enhance our understanding of this complex phenomenon. The findings have practical implications for tunnel design and construction, providing engineers with the tools and knowledge needed to anticipate and address floor heave in a variety of geological settings. The key innovations of this paper are outlined as follows:
- (1)
- This study is grounded in extensive on-site investigations and long-term monitoring data, elements often lacking or overlooked in the existing literature. The findings indicate that during both the construction and operation stages, gently inclined thin rock masses are the primary cause of tunnel floor heave. This discovery marks a significant advancement in understanding tunnel floor heave and further deepens the insights from previous research. Consequently, this study focuses on the dynamic interaction between the gently inclined thin rock mass structure and the tunnel structure, exploring the mechanisms of their interaction and the progressive failure processes. These aspects are addressed in greater scientific detail than in previous studies.
- (2)
- To analyze the factors influencing tunnel floor heave in gently inclined thin rock masses, this study incorporates a broader range of variables using field monitoring data, numerical simulations, and orthogonal testing. Building on previous research, this study evaluates both single-factor and multi-factor interactions to rank the influencing factors of tunnel floor heave. This approach enhances the scientific rigor, accuracy, and applicability of the findings. Additionally, this study examines the dynamic coordination between surrounding rock and support systems through a comprehensive system analysis. The results are validated against field investigations and monitoring, offering new insights not covered in earlier studies and contributing to the advancement in this field.
- (3)
- A mechanical model for gently inclined thin-layered rock masses is developed based on the circumcircle theory of tunnels and the principles of active and passive rock and soil pressures. This model, building on previous research, elucidates the dynamic relationship between the ultimate load capacity and the deformation limits of the tunnel floor, thereby offering a more comprehensive understanding of stress redistribution in gently inclined rock strata. Additionally, using the Nishihara model, this study characterizes the viscoelastic–viscoplastic mechanical behavior of the tunnel floor under varying stress conditions, addressing a significant gap in the field.
- (4)
- While the application of load-displacement inversion formulas and intelligent models in tunnel engineering has been extensively studied, significant challenges remain, particularly due to the complexity of tunnel construction parameters and the variability of influencing factors. Consequently, these mechanical formulas and intelligent prediction models have not achieved the desired success rate in practice and have struggled to effectively guide real-world applications. However, the load-displacement inversion formula and intelligent prediction model for tunnel floor heave introduced in this paper have been validated and widely implemented in numerous practical projects, representing a substantial advancement in the field.
- (5)
- The numerical analyses conducted using FLAC3D and ANSYS corroborate the findings of Liu et al. [1], Sakhno et al. [2], and Perry et al. [3], who demonstrated the significant impact of construction schemes, rock moisture content, and control measures on tunnel floor heave. Our study builds on these foundational works by incorporating a broader range of variables and by focusing specifically on the most vulnerable rock formations. In particular, this study’s exploration of the dynamic interplay between tunnel floor load capacity, deformation limits, and surrounding rock support provides a more comprehensive understanding of the stress redistribution that occurs in gently inclined rock strata, as highlighted in earlier studies [9,10,11,12,13].
- (6)
- Furthermore, our research underscores the limitations of current artificial intelligence applications in predicting mechanical behavior in tunnel engineering. While machine learning models, such as those developed by Lu et al. [17] and Min et al. [19], have shown promise in geomechanics, this study reveals the challenges of directly applying these models to practical engineering projects. Specifically, the complex interactions between geological variables and construction parameters in real-world scenarios necessitate a more nuanced approach than current AI models can offer.
- (7)
- This study’s use of advanced analytical models, including the application of the Nishihara model and the development of new creep constitutive equations, represents a significant step forward in understanding the viscoelastic–viscoplastic behavior of tunnel floors under varying stress conditions. These findings extend the work of Gao et al. [26], Zhu et al. [27], and Xia et al. [28] by offering refined models that better capture the behavior of soft rock in tunnel environments.
7. Conclusions
This paper conducts extensive investigation on the engineering issue of tunnel floor heave, identifying gently inclined thin-layered rock masses as the primary cause of this phenomenon. Through a combination of a theoretical analysis, numerical simulation, and field testing based on actual project conditions, this study systematically examines the influencing factors, mechanical models, and deformation mechanisms involved in tunnel floor heave. Additionally, an intelligent prediction method tailored for gently inclined thin-layered rock mass conditions is developed. The primary conclusions are as follows:
- (1)
- Through an extensive investigation and statistical analysis, it has been observed that tunnel floor heave deformation is significantly influenced by the interplay of multiple fields, particularly the stress and seepage fields. This phenomenon is prevalent in both railway tunnels during construction and operational phases, especially when the surrounding rock consists of gently inclined, thin-layered formations. The effectiveness of repair measures in such conditions remains unsatisfactory, indicating a need for further study and improvement.
- (2)
- Based on comprehensive field monitoring and numerical simulations, an analysis of the engineering characteristics of gently inclined, thin-layered rock masses was conducted. Through both single-factor and multi-factor analyses, six primary factors influencing floor heave in tunnels with such surrounding rock were identified: the lateral pressure coefficient, rock layer dip angle, hard rock layer thickness, thin layer thickness, elastic modulus of surrounding rock, and tunnel burial depth. The ranking of these factors in order of importance is as follows: tunnel burial depth > lateral pressure coefficient > thin layer thickness > surrounding rock elastic modulus > rock layer dip angle > hard rock layer thickness. A further analysis of the support system’s mechanical behavior revealed that tunnel floor heave predominantly occurs in tunnels with grade III and IV surrounding rock. In contrast, tunnels with grade V surrounding rock experience subsidence at the floor due to the combined effects of high ground stress, tectonic stress, deviatoric stress, and the timing of support application. Compared to primary support structures, the combination of primary support and secondary lining can more effectively mitigate tunnel floor heave.
- (3)
- Grounded in the theory of a tunnel circumcircle and the principles of active and passive pressures in rock and soil, this study examines the structure and long-term stability of tunnel floors. This research uncovers the deformation mechanisms and ultimate bearing capacity of tunnel floors under the conditions of gently inclined, thin-layered stratification. Additionally, using the Nishihara model, a novel creep constitutive equation has been developed to elucidate the dynamic interaction between the tunnel floor structure and the surrounding rock support forces.
- (4)
- A formula for estimating tunnel floor heave was developed using a combination of on-site monitoring, statistical analysis, numerical simulation, and BP neural network techniques. After refinement, the formula achieved a coefficient of determination (R2) of 0.95, closely aligning with actual values. This formula is capable of not only estimating the extent of tunnel floor heave but also inverting the load at the tunnel base. Additionally, an intelligent prediction model for tunnel floor heave was established using the BP neural network algorithm. Following 100,000 training iterations, the loss function value reached 0.17, enabling highly accurate predictions of tunnel floor deformation. This research has been successfully applied and promoted in practical engineering, offering a robust theoretical foundation and technical support for future tunnel construction projects.
- (5)
- Future research should focus on the following three areas:
Advancing the Integration of Artificial Intelligence and Geomechanical Modeling: The further exploration of integrating AI with geomechanical models is essential to develop more precise and dependable prediction tools for tunnel engineering.
Conducting Large-Scale Model Experiments: Large-scale model experiments are needed to uncover the progressive failure mechanisms of tunnel inverts within gently inclined, thin-layered rock masses. These experiments, in conjunction with the mechanical model discussed in this paper, will help elucidate the catastrophic processes involved.
Enhancing On-Site Monitoring and Classification Methods: Ongoing on-site monitoring should be continued, and in combination with this study’s findings, a refined classification and grading system for tunnel floor heave should be developed.
Author Contributions
Conceptualization, R.F. and T.C.; Methodology, R.F.; Software, H.J.; Validation, R.F., T.C., S.W., H.J. and X.Y.; Formal analysis, S.W.; Writing—original draft, R.F.; Writing—review & editing, T.C., S.W., H.J. and X.Y.; Visualization, X.Y.; Supervision, T.C.; Project administration, R.F. All authors have read and agreed to the published version of the manuscript.
Funding
This research received no external funding.
Institutional Review Board Statement
Not applicable.
Informed Consent Statement
Not applicable.
Data Availability Statement
The original contributions presented in the study are included in the article, further inquiries can be directed to the corresponding author.
Conflicts of Interest
The authors declare no conflict of interest.
References
- Liu, H.; Li, P.; Liu, J. Numerical investigation of underlying tunnel heave during a new tunnel construction. Tunn. Undergr. Space Technol. 2011, 26, 276–283. [Google Scholar] [CrossRef]
- Mo, S.; Ramandi, H.L.; Oh, J.; Masoumi, H.; Canbulat, I.; Hebblewhite, B.; Saydam, S. A new coal mine floor rating system and its application to assess the potential of floor heave. Int. J. Rock Mech. Min. Sci. 2020, 128, 104241. [Google Scholar] [CrossRef]
- Yang, J.; Zhou, K.; Cheng, Y.; Gao, Y.; Wei, Q.; Hu, Y. Mechanism and Control of Roadway Floor Heave in the Paleogene Soft Rock Surroundings. Geotech. Geol. Eng. 2019, 37, 5167–5185. [Google Scholar] [CrossRef]
- Sakhno, I.; Sakhno, S. Numerical studies of floor heave mechanism and the effectiveness of grouting reinforcement of roadway in soft rock containing the mine water. Int. J. Rock Mech. Min. Sci. 2023, 170, 105484. [Google Scholar] [CrossRef]
- Perry, K.; Bradley, J.; Unrug, K.; Klimek, M. Mitigation of floor heave in West Kentucky Coal Mine. Int. J. Min. Sci. Technol. 2016, 26, 521–525. [Google Scholar] [CrossRef]
- Mo, S.; Tutuk, K.; Saydam, S. Management of floor heave at Bulga Underground Operations—A case study. Int. J. Min. Sci. Technol. 2019, 29, 73–78. [Google Scholar] [CrossRef]
- Afrouz, A. Methods to reduce floor heave and sides closure along the arched gate roads. Min. Sci. Technol. 1990, 10, 253–263. [Google Scholar] [CrossRef]
- Cicek, S.; Tulu, I.B.; Van Dyke, M.; Klemetti, T.; Wickline, J. Application of the coal mine floor rating (CMFR) to assess the floor stability in a Central Appalachian Coal Mine. Int. J. Min. Sci. Technol. 2021, 31, 83–89. [Google Scholar] [CrossRef]
- Xiao, P.; Yang, X.; Li, B.; Zhou, X.; Sun, Y.; Ding, X.; Xu, N. Roof arch collapse of underground cavern in fractured rock mass: In situ monitoring and numerical modeling. J. Rock Mech. Geotech. Eng. 2024. [Google Scholar] [CrossRef]
- Zhang, J.; Du, R.; Zhang, X.; Huang, Z.; Zhang, W. The deformation and failure characteristics of tunnels in layered rock with gentle dip angles after freeze-thaw cycles: Physical model tests and numerical investigation. Tunn. Undergr. Space Technol. 2024, 144, 105527. [Google Scholar] [CrossRef]
- Zhou, X.; Meng, F.; Xiu, Z.; Yue, Z.; Wang, W.; Cui, G.; Wang, Z. Study on the influence of dip angle of tunnel surrounding rock structural plane on induced rockburst. J. Water Resour. Archit. Eng. 2023, 21, 94–100. [Google Scholar]
- Liu, Y.; Chen, B.; Zhang, Z. Deformation and crack development law of tunnel bottom structure in gently inclined layered rock mass. Railw. Eng. 2023, 63, 104–108. [Google Scholar]
- Zhang, P. Experimental Study on Tension-Compression Characteristics and Failure Law of Gently Inclined Layered Rock; 2022.
- Schumacker, R.; Tomek, S. F-Test. In Understanding Statistics Using R; Springer: New York, NY, USA, 2013; Available online: https://link.cnki.net/doi/10.27661/d.cnki.gzhnu.2022.004720 (accessed on 29 August 2024).
- Li, J.; Cheng, J.-H.; Shi, J.-Y.; Huang, F. Brief Introduction of Back Propagation (BP) Neural Network Algorithm and Its Improvement. In Advances in Computer Science and Information Engineering; Springer: Berlin/Heidelberg, Germany, 2012. [Google Scholar]
- Li, C. Research on Floor Heave Prediction and Support Countermeasures of Soft Rock Roadway. Coal Sci. Technol. Mag. 2021, 42, 24–27. [Google Scholar] [CrossRef]
- Lu, J.; Xiao, Z.; Yu, Y.; Yuan, W. Study on creep parameter inversion method of surrounding rock in floor heave section of railway tunnel. J. Railw. Eng. Soc. 2021, 38, 66–71. [Google Scholar]
- Huang, H.; Wu, C.; Zhou, M.; Chen, J.; Han, T.; Zhang, L. Rock mass quality prediction on tunnel faces with incomplete multi-source dataset via tree-augmented naive Bayesian network. Int. J. Min. Sci. Technol. 2024, 34, 323–337. [Google Scholar] [CrossRef]
- Min, B.; Zhang, X.; Zhang, C.; Zhang, X. Prediction of bearing capacity of cracked asymmetrical double-arch tunnels using the artificial neural networks. Eng. Fail. Anal. 2024, 156, 107805. [Google Scholar] [CrossRef]
- Savvides, A.-A.; Antoniou, A.A.; Papadopoulos, L.; Monia, A.; Kofina, K. An Estimation of Clayey-Oriented Rock Mass Material Properties, Sited in Koropi, Athens, Greece, through Feed-Forward Neural Networks. Geotechnics 2023, 3, 975–988. [Google Scholar] [CrossRef]
- Chung, J.; Ahmad, R.; Sun, W.; Cai, W.; Mukerji, T. Prediction of effective elastic moduli of rocks using Graph Neural Networks. Comput. Methods Appl. Mech. Eng. 2024, 421, 116780. [Google Scholar] [CrossRef]
- Zhang, P.; Yin, Z.-Y.; Sheil, B. Interpretable data-driven constitutive modelling of soils with sparse data. Comput. Geotech. 2023, 160, 105511. [Google Scholar] [CrossRef]
- Savvides, A.A.; Papadopoulos, L. A neural network approach for the reliability analysis on failure of shallow foundations on cohesive soils. Int. J. Geo-Eng. 2024, 15, 15. [Google Scholar] [CrossRef]
- Fu, R.-c.; Wang, H.-n.; Jiang, M.-j. Exact analytical solution for deep tunnels in viscoelastic–plastic rock considering the actual loading path. Appl. Math. Model. 2024, 128, 370–391. [Google Scholar] [CrossRef]
- Ahn, K.-h.; Pouya, A. Analytical solution of circular tunnel-lining interaction with elastic contact. Tunn. Undergr. Space Technol. 2023, 140, 105311. [Google Scholar] [CrossRef]
- Gao, X.; Hu, T.; Su, Z. Nonlinear Nishihara model of soft rock based on damage mechanics and its parameter identification. Mater. Today Commun. 2024, 39, 108715. [Google Scholar] [CrossRef]
- Zhu, Z.-y.; Luo, F.; Zhang, Y.-z.; Zhang, D.-j.; He, J.-l. A creep model for frozen sand of Qinghai-Tibet based on Nishihara model. Cold Reg. Sci. Technol. 2019, 167, 102843. [Google Scholar] [CrossRef]
- Xia, C.; Liu, Y.; Wu, F.; Xu, C.; Deng, Y. Viscoelastic-viscoplastic analytical solution of circular tunnel based on Nishihara model. Rock Soil Mech. 2019, 40, 1638–1648. [Google Scholar] [CrossRef]
- Wu, L. Theory of Plates and Shells; Shanghai Jiao Tong University Press: Shanghai, China, 1989. [Google Scholar]
- Luepsen, H. ANOVA with binary variables: The F-test and some alternatives. Commun. Stat. Simul. Comput. 2023, 52, 745–769. [Google Scholar] [CrossRef]


Disclaimer/Publisher’s Note: The statements, opinions and data contained in all publications are solely those of the individual author(s) and contributor(s) and not of MDPI and/or the editor(s). MDPI and/or the editor(s) disclaim responsibility for any injury to people or property resulting from any ideas, methods, instructions or products referred to in the content. |
© 2024 by the authors. Licensee MDPI, Basel, Switzerland. This article is an open access article distributed under the terms and conditions of the Creative Commons Attribution (CC BY) license (https://creativecommons.org/licenses/by/4.0/).