Article

Low Stress Level and Low Stress Amplitude Fatigue Loading Simulation of Concrete Components Containing Cold Joints under Fatigue Loading

1
School of Civil Engineering, Central South University, Changsha 410075, China
2
National Engineering Laboratory for Construction Technology of High-Speed Railway, Central South University, Changsha 410075, China
*
Author to whom correspondence should be addressed.
Appl. Sci. 2024, 14(17), 7709; https://doi.org/10.3390/app14177709 (registering DOI)
Submission received: 2 August 2024 / Revised: 28 August 2024 / Accepted: 29 August 2024 / Published: 31 August 2024
(This article belongs to the Special Issue Advances in Sustainable Geotechnical Engineering: 2nd Edition)

Abstract

:
Concrete linings containing cold joint defects may crack or detach under the aerodynamic fatigue loading generated by high-speed train operation, which posing a serious threat to the normal operation of high-speed trains. However, there is currently no simulation method specifically for fatigue damage of concrete linings containing cold joints. Based on the Roe-Siegmund cycle cohesive force model, a cohesive force fatigue damage elements were developed. A large dataset was constructed through numerical simulation software to build a BP neural network for back-calculated parameter of cohesive force fatigue damage elements. By combining experimental data, fatigue damage parameters corresponding to different pouring interval cold joints were back-calculated. These back-calculated parameters were then incorporated into the numerical model to compare simulation results with experimental results to validate the applicability of cohesive force fatigue damage elements and back propagation neural networks (BP neural network). The research results show that the difference between the fatigue life and fracture process calculated by numerical simulation and experimental data is small, verifying the applicability of the method proposed in this paper. The pouring interval directly affects the initial strength of the cold joint interface and the starting conditions of fatigue damage. The possibility of fatigue damage and fracture of concrete components containing cold joints increases with the increase of pouring interval, while the variability of fatigue life decreases with the increase of pouring interval. Interface strength and thickness are the main factors affecting the possibility of fatigue damage occurrence and the variability of fatigue life. The research results can be used to analyze the damage and cracking status of concrete linings containing cold joints under aerodynamic fatigue loading.

1. Introduction

Concrete, as the most commonly used building material, finds widespread application in various types of engineering structures. These structures endure not only constant loads but also variable loads, among which fatigue loading is a typical representative. Fatigue loading includes train vibration loads, tidal loads, high-speed train aerodynamic loads, etc. Although the intensity of these loads may be much lower than that of constant loads, they can easily lead to fatigue damage or even cracking in concrete structures over the long term [1,2,3]. Therefore, the issue of fatigue damage in concrete has always been a research focus for scholars. Indoor experiments and numerical simulations are important means for scholars to study fatigue damage in concrete. Liu et al. [4] conducted fatigue tests on precast crack plain concrete beams and rubber concrete beams, studying the crack propagation process and damage mechanism of rubber concrete under fatigue loads. Yadav and Thapa [5] have developed a concrete fatigue damage model based on the continuous damage mechanics theory of concrete materials under fatigue loads combined with the internal variable theory of thermodynamics. The developed theoretical model can predict the fatigue life and damage evolution of concrete materials under uniaxial compression loads. Riyar et al. [6] reviewed the fatigue behavior of plain concrete and reinforced concrete, identifying various research gaps and unresolved issues at present, which points out that further research is needed on the fatigue response of concrete with defects. Al-Saoudi et al. [7] conducted indoor experiments to study the fatigue life of fiber-reinforced polymer reinforced concrete structures. Kasu et al. [8] conducted bending fatigue experiments on concrete beams to study the effect of aggregate particle size on the bending fatigue response of concrete. Accornero et al. [9] conducted ultra-low cycle fatigue experiments on fiber-reinforced concrete beams and discussed the effect of fiber toughening efficiency on the hysteresis constitutive method. Previous studies have analyzed the fatigue damage of specific engineering structures or concrete components. Meanwhile, In the on-site construction process, initial defects occur in concrete structures with extremely high frequency. Therefore, it is very necessary to study the influence of initial defects on fatigue damage and fatigue life of concrete. Vicente et al. [10] analyzed the fatigue compression response of 60 cubic concrete specimens and established an empirical relationship between porosity morphology parameters and fatigue life; Chandrappa and Biligiri [11] conducted fatigue experiments on permeable concrete and established a stiffness damage evolution model; Wu and Jin [12] studied the uniaxial compressive fatigue performance of composite concrete (CC) made from fresh concrete (FC) and demolished concrete lumps (DCLs) and proposed a linear formula to describe the relationship between secondary strain rate and fatigue life; Sun et al. [13] proposed a method for predicting the corrosion fatigue life of concrete reinforcement based on fatigue crack propagation and equivalent initial defect size (EIFS).
Cold joints are weak interface in concrete structures, and interruptions during pouring or insufficient mixing are direct causes of cold joint formation. In complex construction environments, the frequency of cold joint defects is significantly increased, Deng et al. [14] conducted inspections on more than 180 high-speed railway tunnels in Hunan Province, China. The results showed that a total of 79 tunnels in areas with good surrounding rock conditions (with a grade of III or higher) had obvious cracking, accounting for 65% of the total. Cold joints were the main cause of tunnel lining cracking in areas with good surrounding rock conditions. Cold joints have high concealment and can degrade the load-bearing capacity of structures [14,15,16]. An incident reported by Asakura and Kojima [17] on the Shinkansen line in Japan illustrates a typical case where cold joints and initial micro-cracks in the lining expanded and eventually interconnected under the aerodynamic loading generated by high-speed train operation, leading to the overall detachment of concrete blocks in the lining and causing substantial economic losses. Similarly, numerous similar incidents have occurred in high-speed railway tunnels in China. Hence, scholars have begun to pay attention to initial defects in tunnel linings, especially cold joint defects. Our research team conducted fatigue fracture experiments on concrete components containing cold joints under low stress level and low stress amplitude fatigue loading [18]. The experimental background was the damage and cracking situation of linings containing cold joints caused by aerodynamic fatigue loading from high-speed trains. The experimental results indicate that under conditions of low stress level and low fatigue amplitude, aerodynamic fatigue loading significantly reduces the load-bearing capacity of concrete components containing cold joints. This suggests that aerodynamic fatigue loading induces fatigue damage in cold joint defects, and with an increase in the number of fatigue loading cycles, concrete components containing cold joints will eventually fracture. This experiment proves that aerodynamic fatigue loading generated by high-speed train operation will lead to a decrease in the load-bearing capacity of linings containing cold joint defects and eventually cause them to crack. This research conclusion can serve as an explanation for the cracking of plain concrete sections in high-speed railway tunnels, as plain concrete linings sections usually have stable surrounding rock conditions and external environments, making it difficult to determine the cause of their cracking. However, there is currently no method to analyze the damage and cracking status of linings containing cold joint defects under the aerodynamic fatigue loading generated by high-speed trains.
Analyzing the damage and cracking status of linings containing cold joint defects under aerodynamic fatigue loading from high-speed trains through indoor experiments requires a significant amount of time and financial support [19]. However, numerical simulation methods can greatly improve analysis efficiency based on the powerful computational capabilities of computers, thereby overcoming the challenges faced by indoor experiments. In previous research work, the researchers of this study have already verified the applicability of using cohesive force elements to simulate cold joints. However, the cohesive force elements used in previous research are only applicable to simulate the fracture of concrete containing cold joint defects under monotonic loading conditions. Currently, there is no research on numerical simulation of fatigue damage in concrete containing cold joint defects. Some studies have proposed and applied cohesive force fatigue damage elements, providing reference experience for simulating fatigue damage in concrete containing cold joint defects. Nguyen et al. [20] first proposed a fatigue cohesive force model, describing the evolution of fatigue damage as the softening of the cohesive zone envelope and assuming that a series of softened envelopes are independent of each other. Based on the exponential monotonic cohesive force model proposed by Needleman [21], Roe and Siegmund [22] further proposed an improved cyclic cohesive force model, in which they redefined the loading and unloading paths in the irreversible model and introduced an external variable D to describe fatigue damage. Li et al. [23] proposed an improved Roe Siegmund model to solve the problem of fatigue crack propagation in elastic fracture mechanics, and conducted mixed mode fracture fatigue tests on austenitic stainless steel to verify the proposed improved cyclic cohesion model. Choi et al. [24] proposed a fatigue crack propagation model based on cohesive zone by combining Park-Paulino-Roesler (PPR) traction-separation relationship and conducted computational simulations on the proposed fatigue crack propagation model. Although research on cohesive force fatigue damage elements is relatively abundant, there is still no research experience specifically addressing fatigue damage at cold joint interfaces. This research gap undoubtedly poses significant challenges to the assessment of the safety status and prediction of the timing of cracking in concrete linings containing cold joints.
In the context of the above research, this paper conducts the following four parts of work based on the fatigue fracture experiment of concrete components with cold joints under low stress levels and low stress amplitudes fatigue loads. Part 1: Derive the calculation formula for the fatigue damage of cohesive units under cyclic loads, and describe the implementation method of the cohesive fatigue damage unit constitutive model in numerical calculation software. Part 2: Constructing a numerical calculation model for three-point bending fracture experiments. Part 3: Based on the values of parameters in the fatigue damage constitutive model, multiple sets of data are constructed and substituted into the numerical calculation model to calculate the dataset required for the inversion of cohesive fatigue damage unit parameters. Then, a BP neural network for the inversion of fatigue damage parameters is constructed, and the fatigue damage parameters corresponding to different pouring intervals of cold joints are calculated using experimental data. Part 4: Compare the numerical simulation results with experimental data to verify the correctness of the cohesive fatigue damage element and BP neural network. Finally, analyze the damage and cracking process of concrete components with cold joints under fatigue loads.

2. The Cohesive Force Fatigue Damage Constitutive Model

2.1. Damage Calculation

The cohesive force model is established on the basis of damage mechanics, assuming the existence of small-sized cohesive zones near the crack tip, within which micro-cracks initiate, propagate, and eventually coalesce, promoting crack tip advancement and eventually forming macroscopic cracks [25,26]. The cohesive force model does not fully simulate the actual physical cracking process but rather idealizes the crack tip as a region where cohesive forces prevent crack propagation, as illustrated in Figure 1. This model defines the relationship between the cohesive force σ on the crack surface and the crack opening displacement δ as the Traction-Separation Law (TSL), while the energy released by the cohesive zones during the cracking process is defined as fracture energy.
The Traction-Separation Law encompasses various forms such as bilinear traction-separation law, exponential traction-separation law, polynomial traction-separation law, etc. The choice of traction-separation law depends on the application. Among these, the bilinear traction-separation law has the widest applicability. The complete process of the bilinear traction-separation law can be divided into three stages: elastic, damage, and failure, as illustrated in Figure 2.
In the Figure 2, σn represents the normal cohesive forces, σmax represents the maximum normal cohesive forces, k0 represents the normal initial stiffness, kn initial unloading stiffness, Gnf represents the normal fracture energy, δmax represents the normal critical separation, δ0 represents the normal opening displacement.
The constitutive relationship between cohesive force and opening displacement under cyclic loading for the bilinear traction-separation law is depicted in Figure 3. Under cyclic loading, the initial stiffness of the cohesive force element continuously degrades. This phenomenon is reflected in Figure 3 as the decreasing slope of the loading curve, eventually leading to the complete failure of the cohesive force element when the stiffness degrades to 0. During unloading in the cyclic loading phase, the cohesive force element model exhibits a linear relationship between traction and unloading deformation. Additionally, the unloading curve points towards the loading origin, indicating the absence of plastic deformation in the cohesive force element.
According to the relationship in Figure 3, the initial cohesive strength parameter σmax was used to establish the constitutive relationship of CZM for cumulative damage under cyclic loading. Within this framework, the current cohesion strength is defined as:
σ max = σ max , 0 ( 1 D )
where: σmax is the strength of the cohesive force unit in the current state; σmax,0 is the initial strength of the cohesive unit; D represents the amount of damage in the current state.
During the cyclic loading process, the cohesive force element experiences both cyclic loading-induced damage Dc and monotonic loading-induced damage Dm. According to the cyclic damage evolution model of cohesive force elements proposed by Roe and Siegmund [22], the calculation formula for damage Dc induced by cyclic loading is as follows:
D C = | Δ u ¯ ˙ | δ Σ T ¯ σ max C f H Δ u ¯ δ 0
where: Δ u ¯ ˙ represents the increment of effective separation displacement at a certain time, Δ u ¯ ˙ = Δ u ¯ t Δ u ¯ t Δ t , Δ u ¯ t represents the effective separation displacement at time t, Δ u ¯ t Δ t represents the effective separation displacement at time t-Δt; δ Σ denotes the accumulated cohesive force length, used for normalizing the increase in effective displacement of cohesive force elements, typically being a multiple of the initial cohesive force length δ0; H represents the Heaviside function, which takes a value of 1 when the cumulative displacement Δ u ¯ exceeds the initial cohesive force length δ0, and 0 when Δ u ¯ is less than δ0. Through the Heaviside function, we define the onset of damage accumulation, namely when the cumulative displacement Δ u ¯ exceeds the initial cohesive force length δ0, fatigue damage begins to accumulate; The initial cohesive force length δ0 corresponds to the separation displacement of the cohesive force element when the load reaches σmax,0; T ¯ represents the equivalent traction force of the cohesive force element model, and its calculation formula is:
T ¯ = T n 2 + T t 2 / 2 e q 2
Cf represents the fatigue limit, which defines the ratio of the cohesive force fatigue limit strength σf to the initial cohesive strength σmax,0. Below this level, the material can withstand an infinite number of cyclic loads without failure, while damage accumulates only when the stress level exceeds the fatigue endurance limit. The calculation formula for the fatigue limit Cf is:
C f = σ f σ max , 0
Equation (4) illustrates that the fatigue limit Cf falls within the range of 0 to 1.
The calculation formula for damage Dm under monotonic loading is:
D m = max Δ u ¯ t max Δ u ¯ t Δ t 4 δ 0
The total damage of the cohesive force element under cyclic loading is composed of the damage induced by cyclic loading, Dc, and the damage induced by monotonic loading, Dm. Its calculation is given by:
D = max ( D m , D c ) d t
In fatigue experiments, due to the low stress levels and cyclic loading intensity, the cumulative fatigue damage caused by each loading is relatively small. If calculated according to actual conditions, the slow accumulation of fatigue damage will result in very low computational efficiency. Ural et al. [27] proposes the use of a damage amplification factor A to accelerate the process of fatigue accumulation, allowing N/A cycles of fatigue loading to substitute for N cycles. Relevant studies have verified the applicability of the damage amplification factor [28]. Therefore, in the subsequent research, this paper uses the damage amplification factor to improve computational efficiency. The calculation formula for damage Dc induced by cyclic loading with the addition of the damage amplification factor is:
D C = A * | Δ u ¯ ˙ | δ Σ T σ max C f H Δ u ¯ δ 0
Under fatigue loading, the working states of cohesive force elements include four types: loading, unloading, contact, and compression, as shown in Figure 4. Here, “contact” refers to the condition where the cohesive force element undergoes complete damage after a certain number of cycles, and consequently, the cohesive force element no longer functions, leading neighboring elements to transition into a state of pure contact.

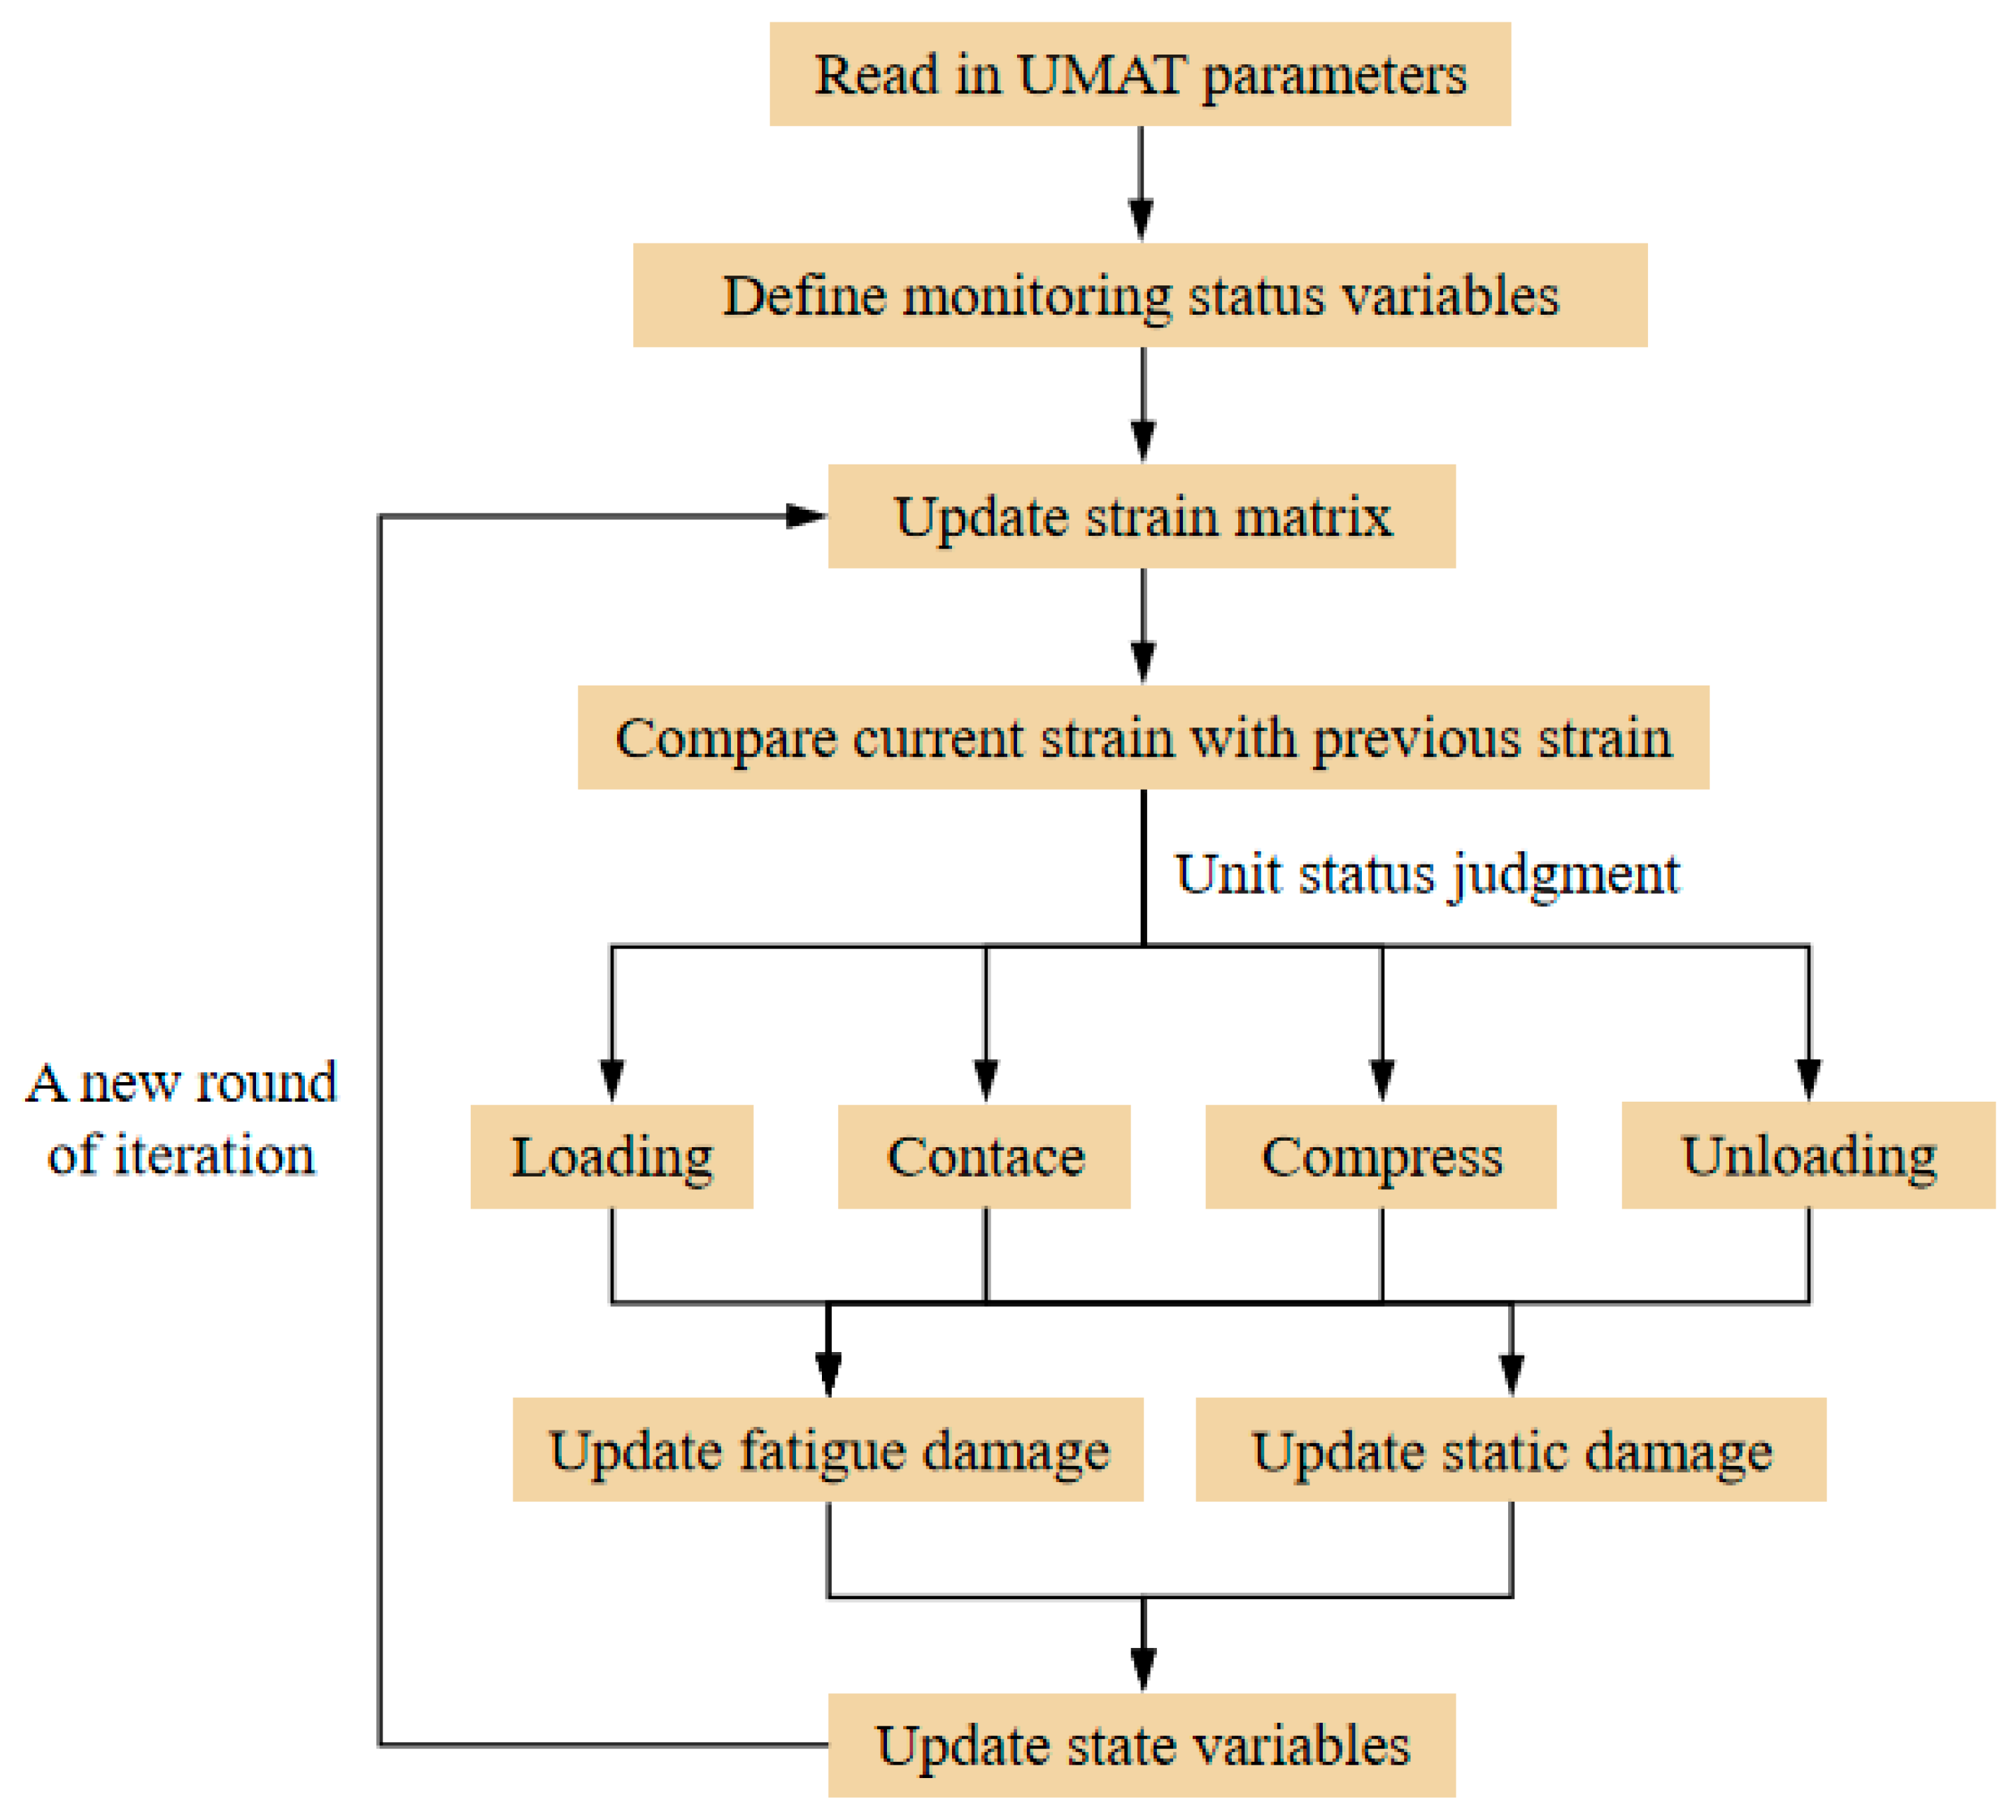
2.2. Implementation Process

The UMAT subroutine is a FORTRAN program interface provided by the Abaqus computational software (2020) to allow users to customize material properties. Using the UMAT subroutine, users can define material constitutive relationships according to their requirements, thus enabling the computation of user-defined materials. Based on the cohesive force element damage constitutive model in Section 2.1, a UMAT subroutine is developed. Subsequently, by importing the developed UMAT subroutine into the Abaqus software, the cohesive force fatigue damage element model is completed. The compilation process of the UMAT subroutine for the cohesive force fatigue damage element model is illustrated in Figure 5.
Step 1: Read in material parameters, which include the initial cohesive force normal strength σmax,0 under monotonic loading conditions; the separation corresponding to the initial cohesive force normal strength δ0 and the fatigue limit Cf.
Step 2: Define the state variables needed, including: damage D; current maximum normal separation Δun,max; separation at the last iteration step Δut-Δt; current separation Δu; and accumulated separation δM.
Step 3: Update the separation matrix.
Step 4: Compare the sizes of Δu and Δun,max to determine the corresponding state of the element at this time. If Δu is greater than Δun,max, the cohesive force element is in the loading state. If Δu is less than 0 and D equals 1, the cohesive force element is in the contact state. If Δu is less than 0 and D is less than 1, the cohesive force element is in the compression state. In all other cases, the cohesive force element is in the unloading state.
Step 5: Update the state variables defined in step 2, completing this computation and starting the next iterative computation.
Step 6: Stop the iterative computation when the set number of iterations is reached or when a certain state variable reaches a preset value.

3. Numerical Calculation Models

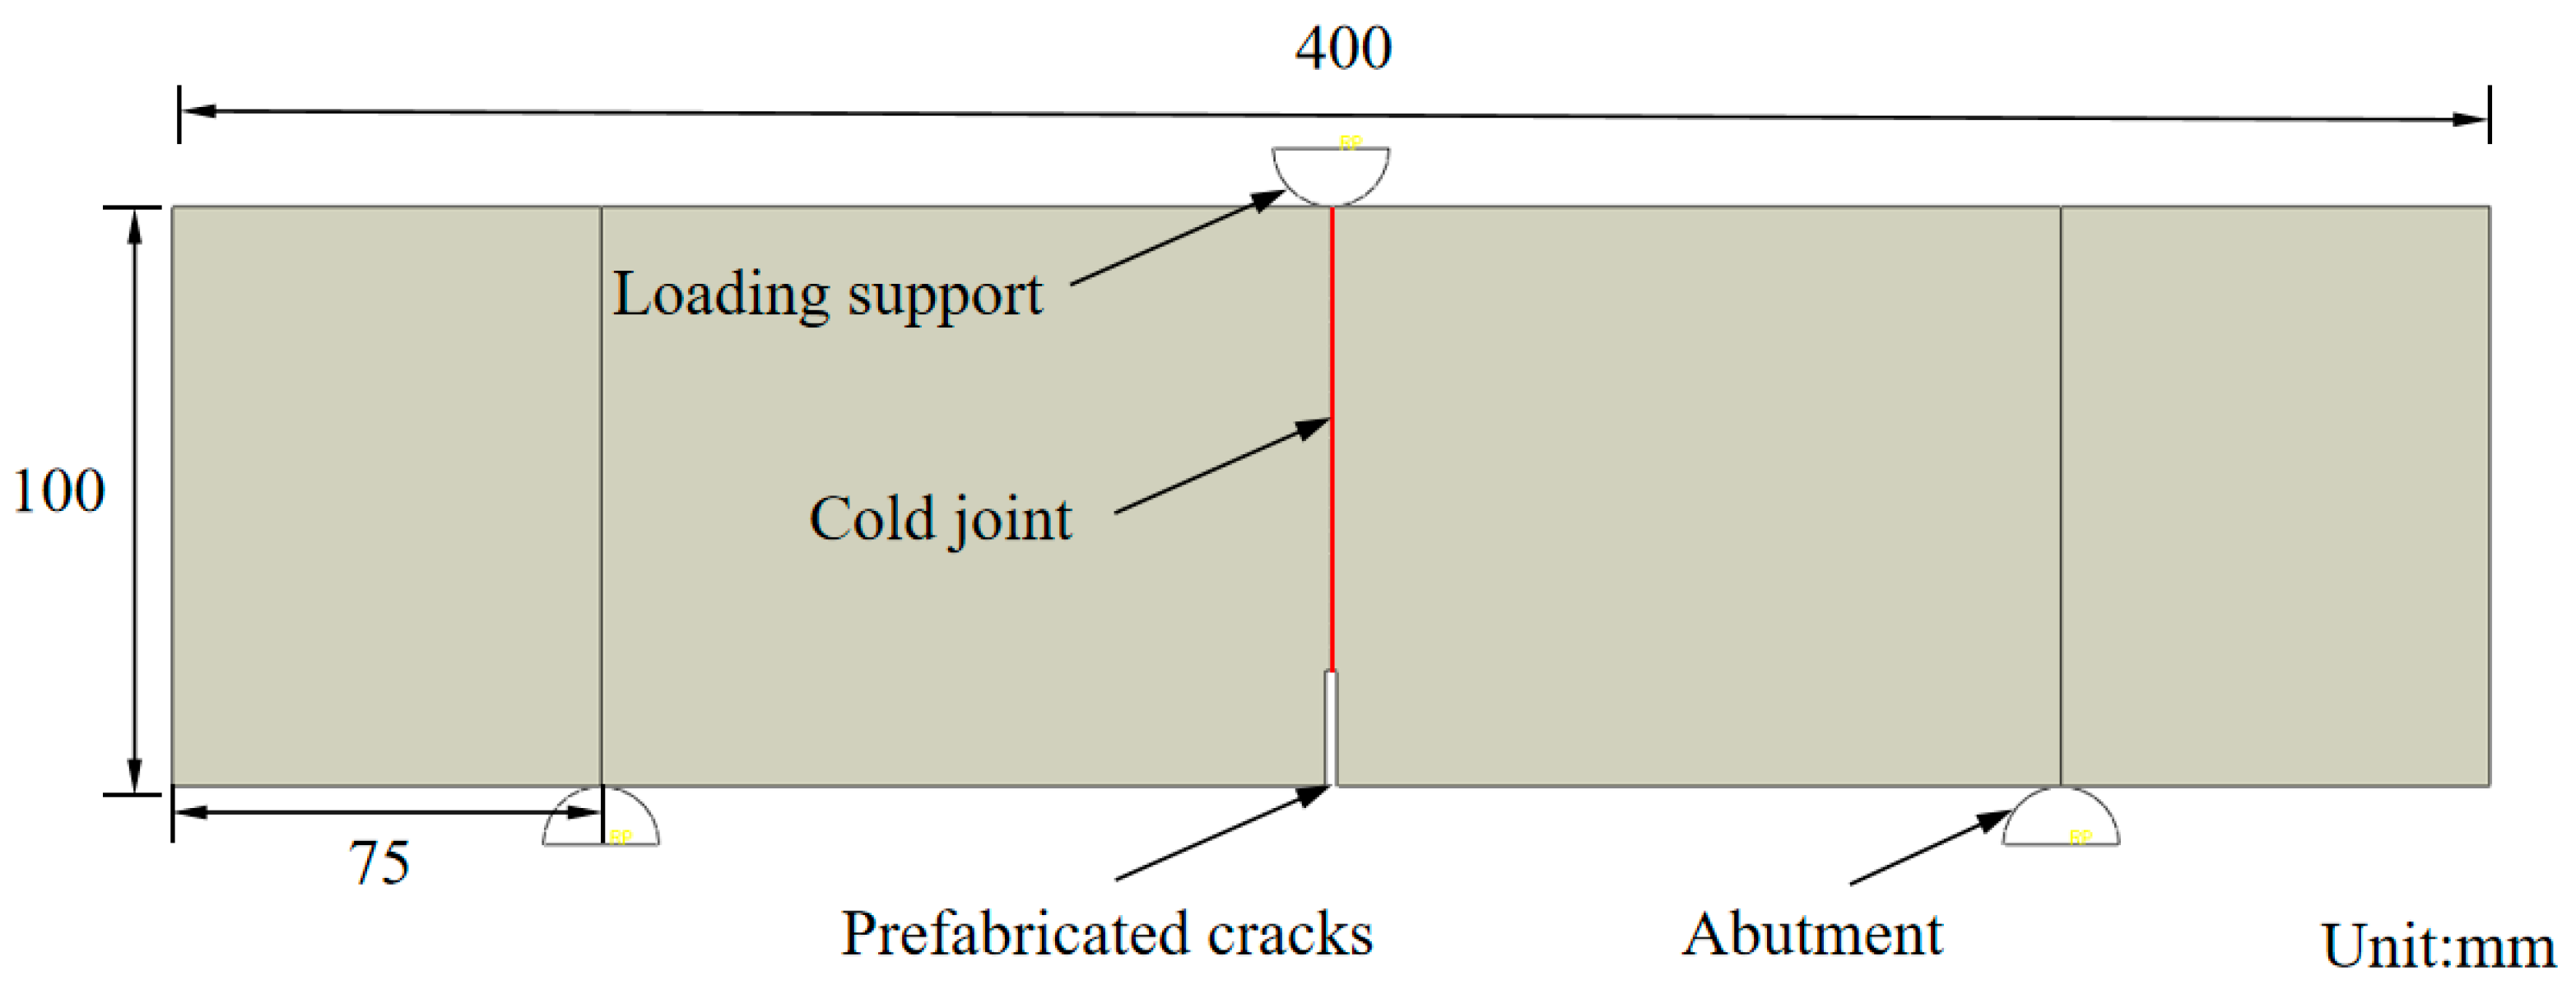
3.1. Model Dimensions

The researchers in this study conducted numerical simulations of concrete components with cold joints under monotonic loading [29]. When simulating the three-point bending fracture of components with cold joints under monotonic loading, the distribution of aggregates and mortar in the concrete was considered. Previous research findings indicated that the strength of the cold joint interface is much lower than that of the mortar-concrete interface and the mortar-aggregate interface. However, the focus of this study is on the damage and fracture behavior of components with cold joints under low-stress and low-stress amplitude fatigue loading. The loads applied to the components are much smaller than those in monotonic loading, so there is no need to consider the damage and fracture issues of the mortar interface and the mortar-aggregate interface. To improve computational efficiency, the numerical model in this study does not consider the distribution of aggregates and particles in the concrete component model, as shown in Figure 6.

3.2. Material Parameters

In the model, the cold joint interface adopts a pre-compiled cohesive fatigue damage element, while other regions use the Concrete Damaged Plasticity (CDP) model. The CDP model describes the non-elastic behavior of concrete by combining damage elasticity under isotropic conditions with tensile and compressive plasticity [30,31,32]. It is commonly used to analyze the mechanical response and deformation of concrete structures under cyclic and dynamic loading conditions. The elastic and plastic parameters input into the CDP model in the computational software are as follows: Elastic modulus E0 = 30000 MPa, Poisson’s ratio v = 0.2, Dilatation angle j = 38°, Eccentricity e = 0.1, Ratio of biaxial compressive strength to uniaxial compressive strength fb0/fc0 = 1.16, Invariable stress ratio K = 0.667, Viscous parameter α = 0.00005.

3.3. Boundary Conditions and Loading Steps

The model utilizes three discrete rigid bodies with a radius of 10 mm as supports and loading points. The supports are fixed constraint boundaries, while the loading point supports use load-controlled loading.
According to the experimental conditions, the loading process of the entire experiment is divided into two steps. First, the specimen is loaded to the initial stress level, and then cyclic loading is applied. Therefore, in the numerical simulation, two calculation steps are also used. The first step is to apply the initial stress level by loading the specimen to the initial stress level through an incremental step. The second step is to apply cyclic loading. In the experiment, it was assumed that if the specimen did not fracture after 200,000 cycles of loading, it would be considered to have an infinite life. Therefore, in the numerical simulation, only 200,000 cycles of cyclic loading are considered. The number of 200,000 cycles of cyclic loading is set by analyzing the steps, damage amplification factor, and loading steps together. In the cyclic loading calculation step, twenty incremental steps are set, and the cycle of cyclic loading in each incremental step is 0.1. This means that 10 cycles of loading occur in each incremental step. The damage amplification factor is set to 1000. Thus, 20 cycles of cyclic loading are simulated through 20 incremental steps. This significantly improves the computational efficiency of the software.

4. Inversion of Fatigue Damage Parameters

In the cohesive fatigue damage constitutive model, there are three material parameters that need to be provided to the UMAT subroutine, namely the initial normal strength σmax,0, the corresponding separation displacement δ0 of the initial normal strength, and the fatigue limit Cf. The initial normal strength can be calculated using the following formula:
σ n max = S 2 B D 2 ( 3 P max + 1 2 m g )
where: Pmax represents the maximum load applied to the specimen (N); m is the mass of the specimen at midspan (kg); g is the acceleration due to gravity (m/s2); B is the width of the specimen (m); D is the height of the specimen (m); and S is the span length (m).
Currently, there is no direct method to measure the corresponding separation distance for normal strength and the fatigue limit. Typically, an inverse calculation method is employed to determine the values of these two parameters. However, this method is inefficient and requires extensive trial and error for each case. In this study, inspired by neural network principles, we use numerical simulations to build a large dataset. Subsequently, we construct a BP neural network for the inversion of parameters of the cohesive fatigue damage unit. By utilizing this neural network, the fatigue damage parameters for different pouring intervals with cold joint defects can be obtained computationally, thus circumventing the need for extensive trial and error calculations.

4.1. Experiment

The specific experimental process and analysis of experimental results can refer to the research results previously published by our research team [18].

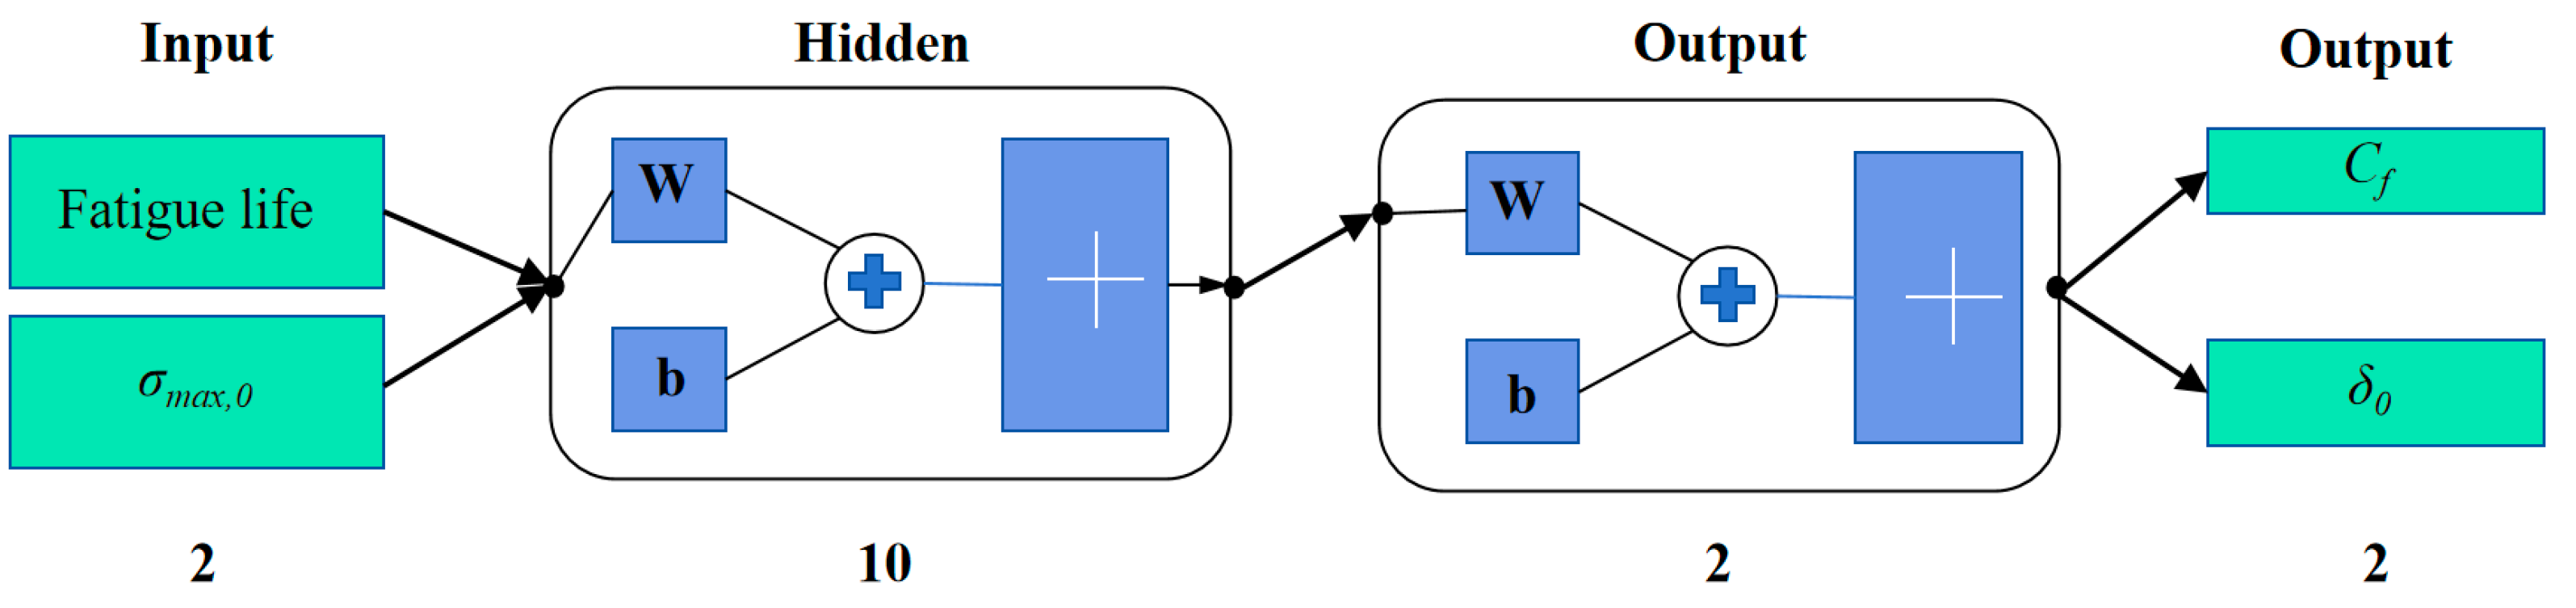
4.2. BP Neural Network

The BP neural network, short for backpropagation neural network, is a widely used model in machine learning and deep learning. It consists of multiple layers of neurons, including input, hidden, and output layers. The BP neural network undergoes training and optimization through two stages: forward propagation and backpropagation. During forward propagation, input data propagate through the network layer by layer, undergoing weighted summation and activation function processing, ultimately producing output. Then, using the backpropagation algorithm, the network parameters are adjusted based on the error between the network output and the true labels, aiming to minimize the error and continuously improve network performance [33,34,35]. The BP neural network is a typical nonlinear algorithm, comprising input, output, and one or more hidden layers, with several nodes in each layer. The connections between nodes in different layers are represented by weights. The determination of the number of neurons in the hidden layer directly influences the training performance of the neural network. If the number of neurons in the hidden layer is too small, it may fail to achieve the desired training accuracy, while too many neurons may lead to overfitting. Mackiewicz and Szydło [35] provided an upper bound on the number of hidden layers:
k = m / a × ( i + j )
where i and j are the neuron’s numbers in the output and input layers respectively. m is the number of datasets. a is a constant in the range [5,10]. In this study, 10 neurons are used in hidden layer.
The purpose of using neural network methodology in this study is to infer the fatigue limit Cf and the corresponding initial cohesive force strength δ0 of the cohesive elements. Therefore, these two parameters correspond to the output layer of the neural network. The focus of this research is to determine the cracking initiation time of concrete components with cold joints under aerodynamic fatigue loading, i.e., the fatigue life of the components. Therefore, the fatigue life is used as the input layer for inferring the fatigue parameters. The initial cohesive force strength is used to distinguish between cohesive elements with different pouring interval cold joints, and thus it is also included as part of the input layer. Based on the above analysis, the BP neural network constructed in this paper is illustrated in Figure 7.
In the Figure 7, W represents the weight parameters in the neural network, and b represents the bias function in the neural network.

4.3. Dataset Construction

Since there is no existing research on the fatigue limit Cf and the corresponding initial cohesive force separation δ0 for concrete material cohesive elements, a large-scale dataset needs to be constructed to ensure the reliability of the dataset. Combining current research on fatigue parameters of cohesive force models [36,37,38], this paper proposes a range for the fatigue limit Cf from 0.15 to 0.85, and a range for the corresponding initial cohesive force separation δ0 from 0.0001 to 0.002. The increment for the fatigue limit Cf is set to 0.05, and for the separation δ0 is set to 0.0001. Consequently, the dataset comprises 840 data points. Among them, 70% of the data is used for training the BP neural network, 15% for evaluating the generalization ability of the neural network, and the remaining 15% for final assessment of the neural network’s performance.
Generally speaking, the inverse calculation process of concrete fatigue damage parameters can utilize experimental data from existing studies. However, the fatigue experimental data from existing studies is not suitable for the calculation in this paper. There are two specific reasons: 1. The research object of this paper is concrete containing cold joints, and the existence of cold joints has not been considered in previous studies. Cold joints are equivalent to inserting initial defects into the original concrete, so there are differences between the experimental samples and existing studies; 2. The loading conditions in this article are low stress levels and low cyclic load strength. Under these loading conditions, intact concrete components will not experience fatigue damage, so there is no available loading data. At the same time, during the loading process, the cold joint is the location where fatigue damage occurs rather than other areas. The concrete bearing capacity in other areas is much greater than that of the cold joint interface, so the location where fatigue damage occurs is only the cold joint interface.

4.4. Parameter Inversion

Figure 8 illustrates the relationship curve between the number of training iterations and the training mean square error of the neural network. It is evident that during the third training iteration, the mean square error of the validation set reached the minimum value of 0.0026236, with an accuracy of the validation set reaching 0.986. The corresponding relationship function at this point is selected as the hidden layer function of the neural network. After constructing the corresponding BP neural network, the experimentally obtained fatigue life and initial normal strength are input into the neural network, and the fatigue damage parameters corresponding to different pouring interval cold joints are inversely calculated, as presented in Table 1.
From Table 1, it can be observed that the initial cohesive strength σmax,0, fatigue limit Cf, and initial cohesive strength corresponding separation quantity δ0 of the cold joint interface decrease with the increase of pouring interval. The pouring interval not only affects the initial strength of the cold joint interface but also influences the starting conditions of fatigue damage on the cold joint interface. Therefore, for cold joint components with longer pouring intervals, the effect of fatigue loading needs to be taken into account, as even minimal fatigue loading may lead to damage or even cracking of the cold joint interface.

5. Analysis of Calculation Results

5.1. Fatigue Life

Figure 9 illustrates the variation of fatigue life with cyclic strength for cold joint components with casting intervals of 2, 4, and 8 h under initial stress levels of 3.6 kN, 2.4 kN, and 1.8 kN, respectively. From Figure 9, we can see that:
(1)
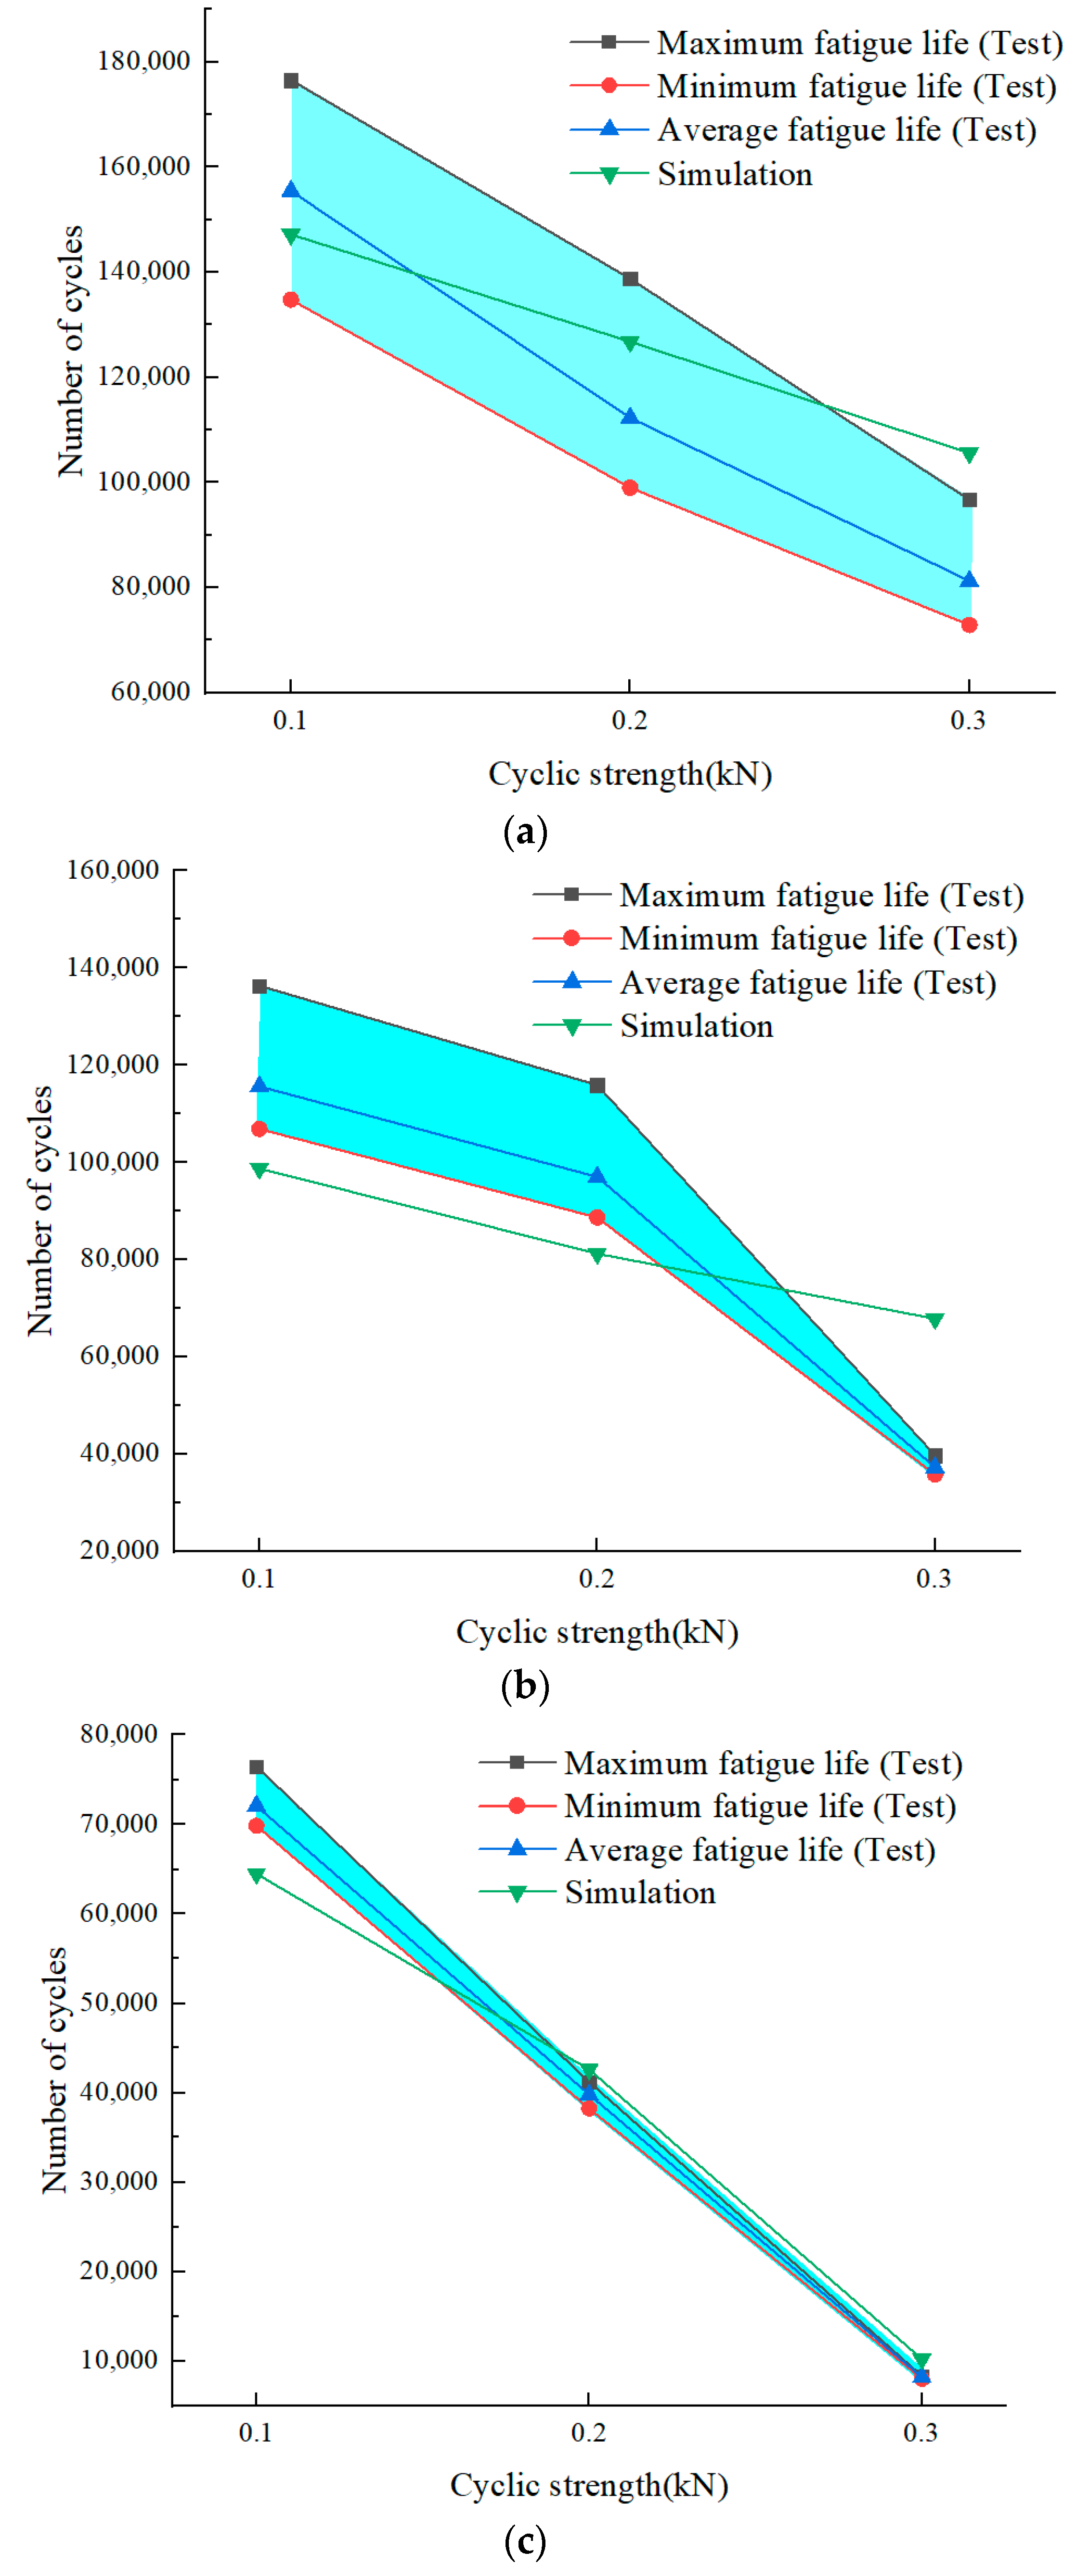
The predicted values of fatigue life from the numerical model for each group of specimens fall between the maximum and minimum measured fatigue life values, and are close to the average fatigue life. This closeness to experimental results validates the reliability of the cohesive fatigue damage elements and the parameters inversely calculated by the BP neural network. The developed cohesive fatigue damage elements and the inversely calculated material parameters can be extended for analyzing the damage of concrete structures with cold joints under aerodynamic fatigue loads of high-speed trains and predicting the crack initiation time of cold joint interfaces.
(2)
When the initial stress level is low, the cold joint components do not experience fatigue fracture at any cyclic strength, validating the assumption regarding the cohesive fatigue limit made earlier. Below the fatigue limit, the material can undergo an infinite number of cycles without failure. With increasing initial stress level, the components with an 8-h pouring interval are the first to experience fatigue fracture, and their fatigue life gradually decreases with increasing cyclic strength. Next are the components with a 4-h pouring interval, and those with a 2-h pouring interval experience fatigue fracture last. The pouring interval is the primary factor affecting the strength of the cold joint interface, and the strength of the cold joint interface determines the bearing capacity of the concrete components with cold joints. Therefore, the starting conditions for fatigue damage for cold joints with pouring intervals of 8 h and 4 h are much lower than those for cold joints with a pouring interval of 2 h.
(3)
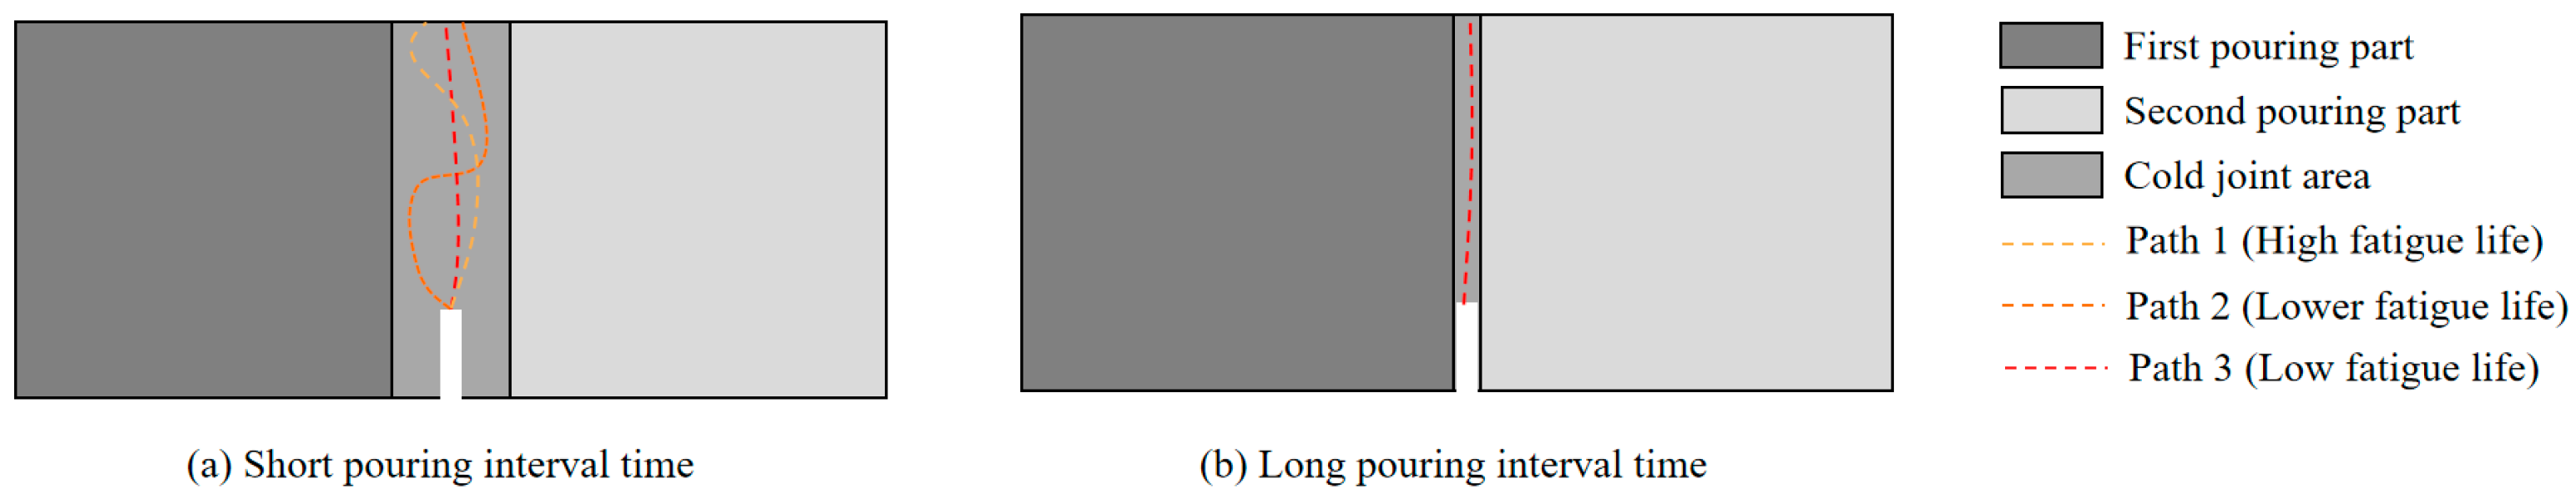
As the casting interval increases, the area enclosed by the polygon formed by the maximum and minimum cycle counts gradually decreases, indicating a reduction in the dispersion of component fatigue life with increasing casting interval. Combined with nanoindentation experimental results, when the casting interval is short, the hydration between the first and subsequent castings is very strong. As a result, the interface strength is high and the thickness is large, leading to a high degree of randomness in the crack propagation path under fatigue loading, thus resulting in a large dispersion of fatigue life, as shown in Figure 10a. With increasing casting interval, the hydration at the surface of the first casting gradually diminishes, resulting in weaker and thinner interface regions. Consequently, the randomness of crack propagation paths decreases, leading to a smaller dispersion of fatigue life, as illustrated in Figure 10b [18]. The influence of cold joint interface thickness on fatigue damage and life dispersion was not considered in the numerical simulation. Hence, the fatigue life is a deterministic value. Further research can be conducted in subsequent work to investigate the effect of cold joint interface thickness on cold joint fatigue damage and life dispersion.

5.2. Cracking Process and Cold Joint Damage

Figure 11 depicts the entire process of fatigue cracking and cold joint damage states of cold joint components with a casting interval of 8 h (stress level of 1.8 kN, cyclic strength of 0.1 kN). From the figure, it can be observed that:
(1)
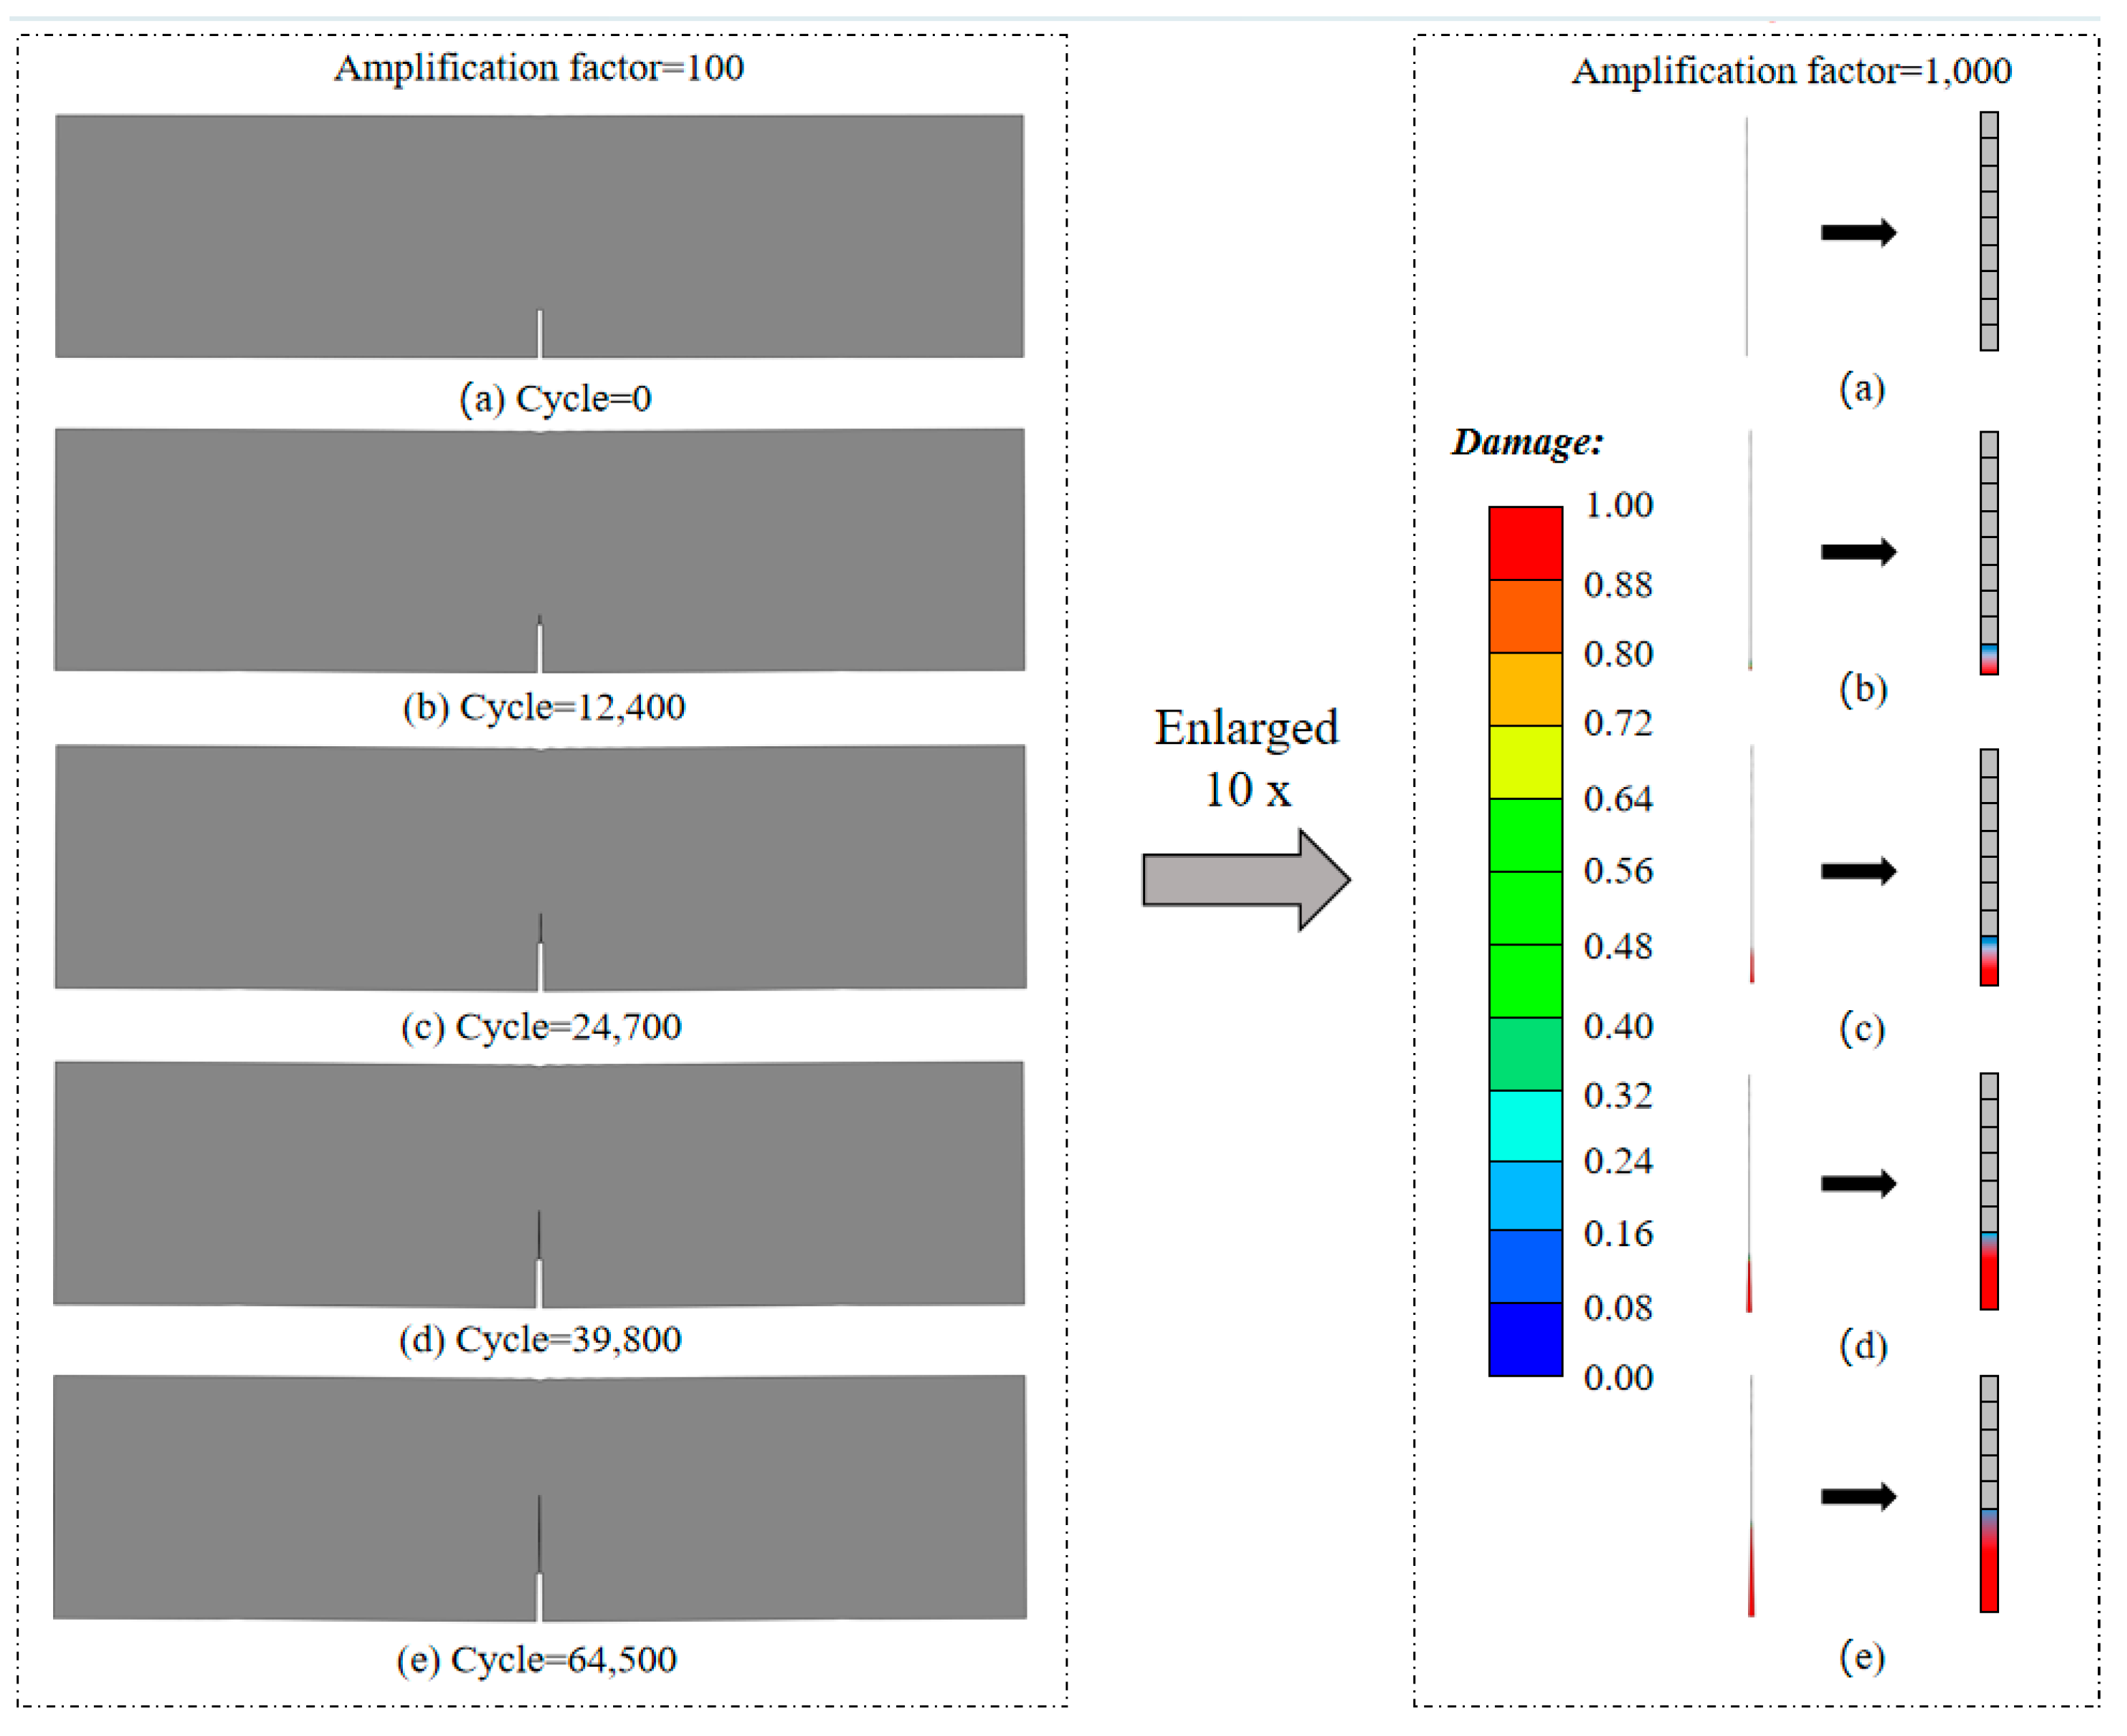
The developed cohesive fatigue damage element and inverse parameters can effectively simulate the cracking behavior of cold joint components under cyclic loading conditions. When initial stress is applied to the model, no cracking occurs at the cold joint interface. At this stage, only static damage is present at the cold joint interface, and the total damage is less than 1. Subsequently, fatigue loading is applied to the model, and after reaching a certain number of cycles, fatigue damage starts to appear in the cohesive elements. When the accumulated value of static and fatigue damage reaches 1, the corresponding element fails and is automatically removed, resulting in the generation of macroscopic cracks in the model.
(2)
With an increase in the number of cycles, the cold joint interface elements first experience fatigue damage failure near the pre-existing crack, followed by gradual fatigue damage failure of subsequent elements. This is manifested in the model by a gradual increase in the length of macroscopic cracks. When the macroscopic crack extends to a certain length, the component can no longer withstand static and fatigue loads. At this point, the numerical simulation software indicates a computational error and automatically stops the calculation.

6. Conclusions

This study developed cohesive fatigue damage elements and subsequently constructed a BP neural network to invert the parameters of cohesive fatigue damage elements corresponding to cold joints with different casting intervals. Finally, the fatigue fracture process of concrete components with cold joints under low stress amplitude fatigue loading was simulated. The research results demonstrate that:
(1)
The developed cohesive fatigue damage elements are suitable for simulating the fatigue fracture behavior of concrete components with cold joints under low stress amplitude fatigue loading. The small error between the fatigue life calculated based on the fatigue damage element parameters obtained from the inverse process using the BP neural network and the experimental results verifies the reliability of the cohesive fatigue damage elements and the inverse parameters using the BP neural network. The developed cohesive fatigue damage elements and the corresponding fatigue damage parameters can be used to analyze the damage of concrete lining with cold joints under aerodynamic fatigue loading and predict the timing of cold joint cracking.
(2)
For cold joints with casting intervals of 2, 4, and 8 h, the corresponding initial normal strengths are 0.58 MPa, 0.36 MPa, and 0.28 MPa, respectively. The fatigue limits are 0.48, 0.42, and 0.34, respectively. The initial cohesive lengths are 0.0007 mm, 0.0004 mm, and 0.0002 mm, respectively. The initial strength and fatigue damage initiation conditions of the cold joint interface decrease with the increase of pouring interval.
(3)
The variability of fatigue life of concrete components with cold joints decreases with the increase of casting interval. The thickness of the cold joint interface is the main factor affecting the variability of fatigue life. Subsequent research can investigate the influence of interface thickness on the fatigue life of concrete components with cold joints.
Cold joint interface elements first suffer damage near the pre-existing cracks. With the increase in the number of fatigue loading cycles, the damage value of cohesive elements gradually increases to 1. At this point, the cohesive elements completely fail and macroscopic cracks occur. When the cracks extend to a certain extent, the component reaches its fatigue life and cannot withstand the load anymore.

Author Contributions

H.-L.F.: Methodology, Software, Data processing, Writing, original draft. H.-S.D.: Conceptualization, Methodology, Supervision, Project administration. Y.-M.W.: Validation, Formal analysis, Writing—review & editing. Y.-B.Z.: Validation, Formal analysis, Writing—review & editing. C.-D.X.: language problem check. All authors have read and agreed to the published version of the manuscript.

Funding

This study was financially supported by the National Natural Science Foundation of China (Grant Nos. 51978668, 52108367 and 52478424) and the Key Science and Technology Projects of Hunan Provincial Department of Education (23A0014).

Institutional Review Board Statement

Not applicable.

Informed Consent Statement

Not applicable.

Data Availability Statement

Data will be made available on request.

Acknowledgments

The authors thank the Advanced Research Center, Central South University, for providing the experiment conditions. The authors also express special thanks to the editors and anonymous reviewers for their constructive comments.

Conflicts of Interest

The authors declare that they have no known competing financial interests or personal relationships that could have appeared to influence the work reported in this paper.

References

  1. Kachkouch, F.Z.; Noberto, C.C.; de Albuquerque Lima Babadopulos, L.F.; Melo, A.R.S.; Machado, A.M.L.; Sebaibi, N.; Boukhelf, F.; El Mendili, Y. Fatigue behavior of concrete: A literature review on the main relevant parameters. Constr. Build. Mater. 2022, 338, 127510. [Google Scholar] [CrossRef]
  2. Fan, J.; Jiang, D.; Chen, J.; Liu, W.; Tiedeu Ngaha, W.; Chen, J. Fatigue performance of ordinary concrete under discontinuous cyclic loading. Constr. Build. Mater. 2018, 166, 974–981. [Google Scholar] [CrossRef]
  3. Gao, R.; He, J. Seismic performance assessment of concrete bridges with traffic-induced fatigue damage. Eng. Fail. Anal. 2022, 134, 106042. [Google Scholar] [CrossRef]
  4. Liu, M.; Lu, J.; Jiang, W.; Ming, P. Study on fatigue damage and fatigue crack propagation of rubber concrete. J. Build. Eng. 2023, 65, 105718. [Google Scholar] [CrossRef]
  5. Yadav, I.N.; Thapa, K.B. Fatigue damage model of concrete materials. Theor. Appl. Fract. Mech. 2020, 108, 102578. [Google Scholar] [CrossRef]
  6. Riyar, R.L.; Mansi; Bhowmik, S. Fatigue behaviour of plain and reinforced concrete: A systematic review. Theor. Appl. Fract. Mech. 2023, 125, 103867. [Google Scholar] [CrossRef]
  7. Al-Saoudi, A.; Kalfat, R.; Al-Mahaidi, R. Investigation into the fatigue life of FRP strengthened concrete structures. Mater. Struct. 2021, 55, 6. [Google Scholar] [CrossRef]
  8. Kasu, S.R.; Deb, S.; Mitra, N.; Muppireddy, A.R.; Kusam, S.R. Influence of aggregate size on flexural fatigue response of concrete. Constr. Build. Mater. 2019, 229, 116922. [Google Scholar] [CrossRef]
  9. Accornero, F.; Rubino, A.; Carpinteri, A. Ultra-low cycle fatigue (ULCF) in fibre-reinforced concrete beams. Theor. Appl. Fract. Mech. 2022, 120, 103392. [Google Scholar] [CrossRef]
  10. Vicente, M.A.; González, D.C.; Mínguez, J.; Tarifa, M.A.; Ruiz, G.; Hindi, R. Influence of the pore morphology of high strength concrete on its fatigue life. Int. J. Fatigue 2018, 112, 106–116. [Google Scholar] [CrossRef]
  11. Chandrappa, A.K.; Biligiri, K.P. Effect of pore structure on fatigue of pervious concrete. Road Mater. Pavement Des. 2019, 20, 1525–1547. [Google Scholar] [CrossRef]
  12. Wu, B.; Jin, H. Compressive fatigue behavior of compound concrete containing demolished concrete lumps. Constr. Build. Mater. 2019, 210, 140–156. [Google Scholar] [CrossRef]
  13. Sun, J.; Ding, Z.; Huang, Q. Corrosion fatigue life prediction for steel bar in concrete based on fatigue crack propagation and equivalent initial flaw size. Constr. Build. Mater. 2019, 195, 208–217. [Google Scholar] [CrossRef]
  14. Deng, H.-S.; Fu, H.-L.; Wu, Y.-M.; Zhao, Y.-B.; Yi, H.-D. Numerical simulation method and deterioration analysis of load-bearing performance of tunnel linings containing cold joints in plain concrete. Tunn. Undergr. Space Technol. 2024, 144, 105561. [Google Scholar] [CrossRef]
  15. Fu, H.-L.; Deng, H.-S.; Zhang, J.; Shi, Y.; Huang, X. Experimental analysis of influence of pouring interval on fracture performance of concrete structures with cold joints. Theor. Appl. Fract. Mech. 2022, 118, 103289. [Google Scholar] [CrossRef]
  16. Deng, H.-S.; Fu, H.-L.; Chen, W.; Zhao, Y.-B.; Yi, H.-D. Study on deterioration, cracking mechanism and treatment measures of plain concrete lining with cold joints in high-speed railroad tunnel. Case Stud. Constr. Mater. 2023, 18, e01895. [Google Scholar] [CrossRef]
  17. Asakura, T.; Kojima, Y. Tunnel maintenance in Japan. Tunn. Undergr. Space Technol. 2003, 18, 161–169. [Google Scholar] [CrossRef]
  18. Deng, H.-S.; Fu, H.-L.; Wu, Y.-M.; Zhao, Y.-B.; Yi, H.-D. Fatigue fracture experiment of concrete members with cold joints under low stress and low stress amplitude fatigue load. Theor. Appl. Fract. Mech. 2023, 127, 104041. [Google Scholar] [CrossRef]
  19. Wang, Q.; Hu, Z.; Liang, X.; Wu, Y.; Zhou, W.; Yang, Y.; Xu, X.; Wang, S. Experimental simulation of alternating aerodynamic loads induced by high-speed trains passing in tunnels. Proc. Inst. Mech. Eng. Part F J. Rail Rapid Transit 2023, 237, 1176–1184. [Google Scholar] [CrossRef]
  20. Nguyen, O.; Repetto, E.; Ortiz, M.; Radovitzky, R. A cohesive model of fatigue crack growth. Int. J. Fract. 2001, 110, 351–369. [Google Scholar] [CrossRef]
  21. Needleman, A. An analysis of tensile decohesion along an interface. J. Mech. Phys. Solids 1990, 38, 289–324. [Google Scholar] [CrossRef]
  22. Roe, K.L.; Siegmund, T. An irreversible cohesive zone model for interface fatigue crack growth simulation. Eng. Fract. Mech. 2003, 70, 209–232. [Google Scholar] [CrossRef]
  23. Li, H.; Li, C.; Yuan, H. Prediction of fatigue crack growth retardation using a cyclic cohesive zone model. Arch. Appl. Mech. 2017, 87, 1061–1075. [Google Scholar] [CrossRef]
  24. Choi, H.; Park, K.; Paulino, G.H. Mixed-mode fatigue crack growth using cohesive zone modeling. Eng. Fract. Mech. 2020, 240, 107234. [Google Scholar] [CrossRef]
  25. Barenblatt, G.I. The Mechanical Theory of Equilibrium Cracks in Brittle Fracture. Adv. Appl. Mech. 1962, 7, 55–129. [Google Scholar]
  26. Hillerborg, A.; Modéer, M.; Petersson, P.-E. Analysis of crack formation and crack growth in concrete by means of fracture mechanics and finite elements. Cem. Concr. Res. 1976, 6, 773–781. [Google Scholar] [CrossRef]
  27. Ural, A.; Krishnan, V.R.; Papoulia, K.D. A cohesive zone model for fatigue crack growth allowing for crack retardation. Int. J. Solids Struct. 2009, 46, 2453–2462. [Google Scholar] [CrossRef]
  28. Zhang, W.; Tabiei, A. Improvement of an Exponential Cohesive Zone Model for Fatigue Analysis. J. Fail. Anal. Prev. 2018, 18, 607–618. [Google Scholar] [CrossRef]
  29. Deng, H.-S.; Fu, H.-L.; Li, H.; Shi, Y.; Huang, Z. Fracture performance and fracture characteristics of concrete members with cold joints: Numerical simulation. Theor. Appl. Fract. Mech. 2023, 125, 103868. [Google Scholar] [CrossRef]
  30. Le Minh, H.; Khatir, S.; Abdel Wahab, M.; Cuong-Le, T. A concrete damage plasticity model for predicting the effects of compressive high-strength concrete under static and dynamic loads. J. Build. Eng. 2021, 44, 103239. [Google Scholar] [CrossRef]
  31. Li, X.-X. Parametric study on numerical simulation of missile punching test using concrete damaged plasticity (CDP) model. Int. J. Impact Eng. 2020, 144, 103652. [Google Scholar] [CrossRef]
  32. Othman, H.; Marzouk, H. Applicability of damage plasticity constitutive model for ultra-high performance fibre-reinforced concrete under impact loads. Int. J. Impact Eng. 2018, 114, 20–31. [Google Scholar] [CrossRef]
  33. Patino-Ramirez, F.; Wang, Z.J.; Chau, D.H.; Arson, C. Back-calculation of soil parameters from displacement-controlled cavity expansion under geostatic stress by FEM and machine learning. Acta Geotech. 2023, 18, 1755–1768. [Google Scholar] [CrossRef]
  34. Huang, C.-C. Back-calculating strength parameters and predicting displacements of deep-seated sliding surface comprising weathered rocks. Int. J. Rock Mech. Min. Sci. 2016, 88, 98–104. [Google Scholar] [CrossRef]
  35. Mackiewicz, P.; Szydło, A. Viscoelastic Parameters of Asphalt Mixtures Identified in Static and Dynamic Tests. Materials 2019, 12, 2084. [Google Scholar] [CrossRef] [PubMed]
  36. Dávila, C.G. From S-N to the Paris law with a new mixed-mode cohesive fatigue model for delamination in composites. Theor. Appl. Fract. Mech. 2020, 106, 102499. [Google Scholar] [CrossRef]
  37. Zhao, G.; Zhong, J.; Feng, C.; Liang, Z. Simulation of ultra-low cycle fatigue cracking of coiled tubing steel based on cohesive zone model. Eng. Fract. Mech. 2020, 235, 107201. [Google Scholar] [CrossRef]
  38. Leciñana, I.; Zurbitu, J.; Renart, J.; Turon, A. A robust fatigue parameter determination method for a local fatigue cohesive zone model. Int. J. Fatigue 2023, 171, 107582. [Google Scholar] [CrossRef]
Figure 1. Cohesive zone model (CZM).
Applsci 14 07709 g001
Figure 2. Bilinear traction separation law.
Applsci 14 07709 g002
Figure 3. Bilinear traction separation law under cyclic loading.
Applsci 14 07709 g003
Figure 4. State of cohesive force unit under cyclic load.
Applsci 14 07709 g004
Figure 5. Compilation ideas for cohesive fatigue damage model.
Applsci 14 07709 g005
Figure 6. Numerical Calculation Model.
Applsci 14 07709 g006
Figure 7. BP neural network.
Applsci 14 07709 g007
Figure 8. Neural Network Training Results.
Applsci 14 07709 g008
Figure 9. Changes in fatigue life with cyclic strength. (a) 2 h. (b) 4 h. (c) 8 h.
Applsci 14 07709 g009
Figure 10. Reasons for discrete fatigue life of different pouring intervals.
Applsci 14 07709 g010
Figure 11. Fatigue cracking process and cold joint damage status.
Applsci 14 07709 g011
Table 1. Fatigue damage parameters corresponding to cold joints at different pouring intervals.
Interval Timeσmax,0Cfδ0
2 h0.58 MPa0.480.0007 mm
4 h0.36 MPa0.420.0004 mm
8 h0.28 MPa0.340.0002 mm
Disclaimer/Publisher’s Note: The statements, opinions and data contained in all publications are solely those of the individual author(s) and contributor(s) and not of MDPI and/or the editor(s). MDPI and/or the editor(s) disclaim responsibility for any injury to people or property resulting from any ideas, methods, instructions or products referred to in the content.

