
Development of Functional Muffins with Fruits of the Chilean Forest (Calafate and Maqui) and Supplemented with Prebiotic Fiber


Abstract
:1. Introduction
2. Materials and Methods
2.1. Determination of the Nutritional Composition
2.1.1. Moisture
2.1.2. Inorganic Matter
2.1.3. Determination of Energy
2.1.4. Determination of Protein
2.1.5. Determination of Carbohydrates
2.1.6. Determination of Fat
2.1.7. Determination of Folate
2.1.8. Determination of Dietary Fiber
2.1.9. Antioxidant Capacity
2.2. Colorimetry of Products
2.3. Statistical Analysis
3. Results
3.1. Composition of the Product
3.2. Determination of Macronutrients
3.3. Dietary Fiber
3.4. Determination of Antioxidant Activity
3.5. Phenolic Compounds
3.6. Folate Content
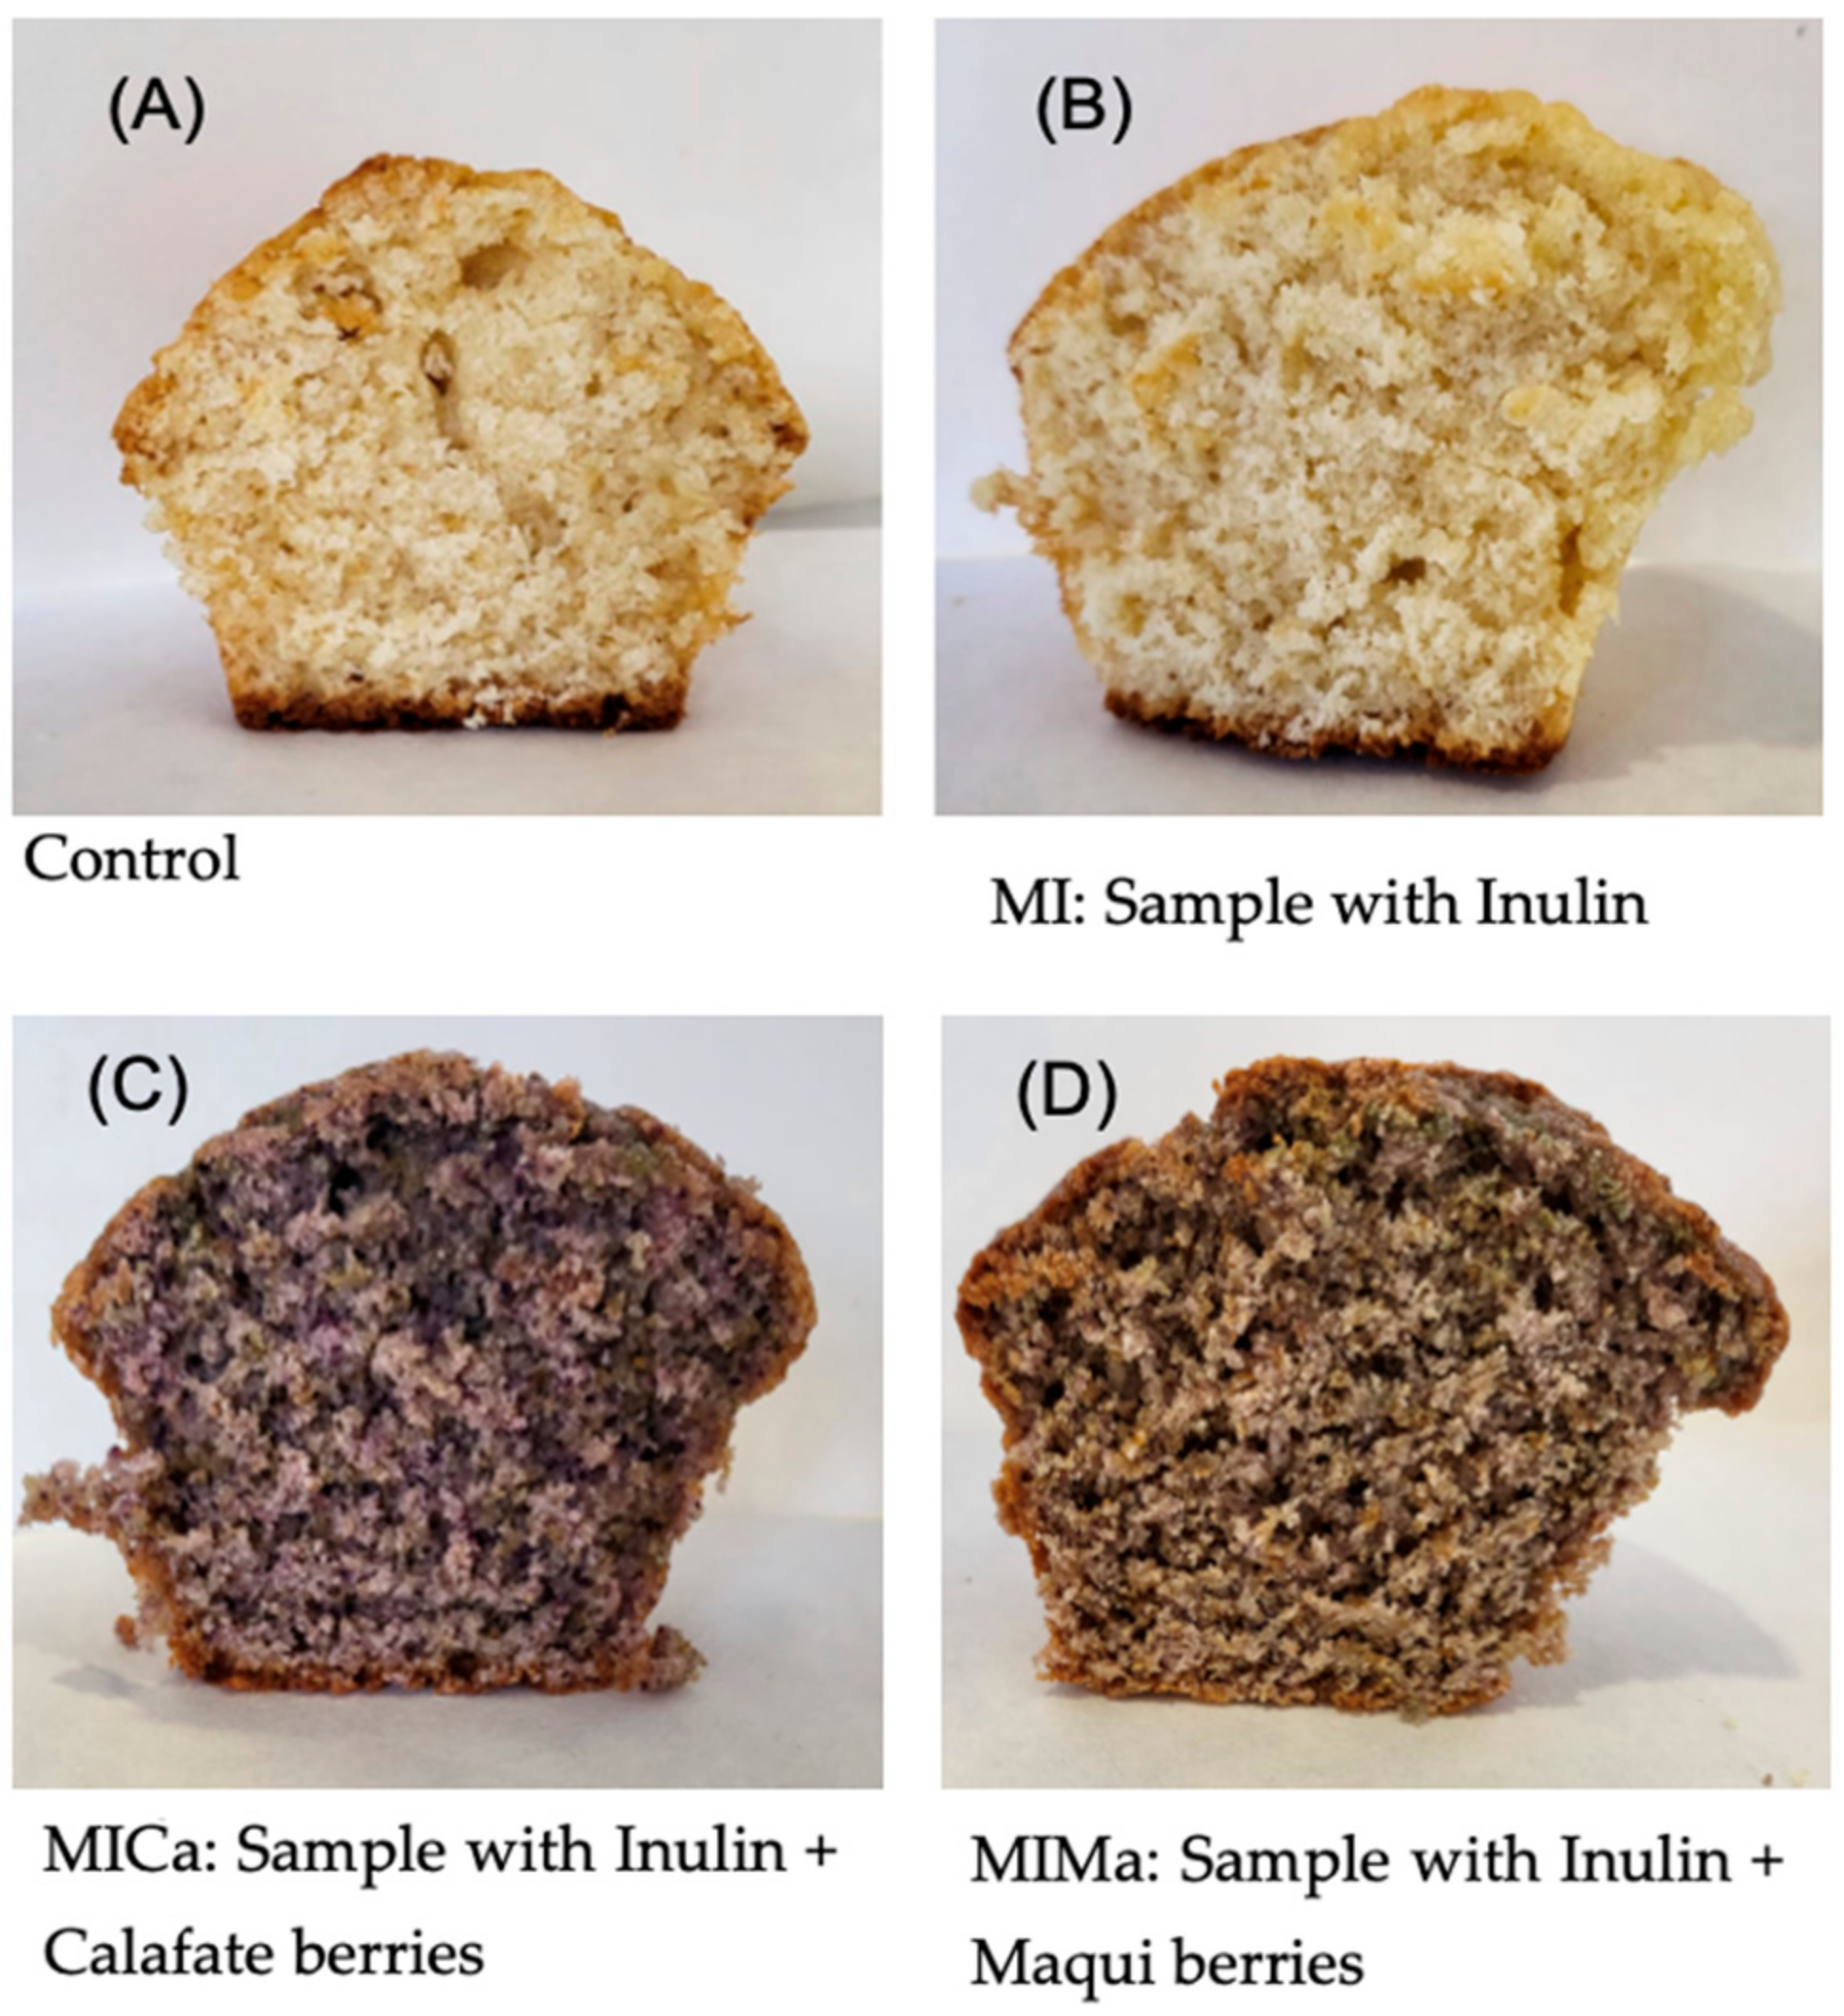
3.7. Colorimetry
4. Discussion
5. Conclusions
Author Contributions
Funding
Institutional Review Board Statement
Informed Consent Statement
Data Availability Statement
Conflicts of Interest
References
- Ortiz Escarza, J.M.; Medina López, M.E. Estrés oxidativo ¿un asesino silencioso? Educ. Química 2020, 31, 2. [Google Scholar] [CrossRef]
- Elejalde Guerra, J.I. Estrés oxidativo, enfermedades y tratamientos antioxidantes. An. Med. Interna. 2001, 18, 50–59. Available online: http://scielo.isciii.es/scielo.php?script=sci_arttext&pid=S0212-71992001000600010&lng=es (accessed on 22 March 2024). [CrossRef]
- He, L.; He, T.; Farrar, S.; Ji, L.; Liu, T.; Ma, X. Antioxidants Maintain Cellular Redox Homeostasis by Elimination of Reactive Oxygen Species. Cell. Physiol. Biochem. 2017, 44, 532–553. [Google Scholar] [CrossRef] [PubMed]
- Bailo, P.S.; Martín, E.L.; Calmarza, P.; Breva, S.M.; Gómez, A.B.; Giráldez, A.P.; Callau, J.J.S.-P.; Santamaría, J.M.V.; Khialani, A.D.; Micó, C.C.; et al. The role of oxidative stress in neurodegenerative diseases and potential antioxidant therapies. Adv. Lab. Med. 2022, 3, 342–350. [Google Scholar] [PubMed]
- Ortiz, G.G.; Moisés, F.P.P.; Mireles-Ramírez, M.; Flores-Alvarado, L.J.; González-Usigli, H.; Sánchez-González, V.J.; Sánchez-López, A.L.; Sánchez-Romero, L.; Díaz-Barba, E.I.; Santoscoy-Gutiérrez, J.F.; et al. Oxidative Stress: Love and Hate History in Central Nervous System. Adv. Protein Chem. Struct. Biol. 2017, 108, 1–31. [Google Scholar] [PubMed]
- Sies, H. Oxidative stress: A concept in redox biology and medicine. Redox Biol. 2015, 4, 180–183. [Google Scholar] [CrossRef]
- Sies, H.; Stahl, W.; Sevanian, A. Nutritional, dietary and postprandial oxidative stress. J. Nutr. 2005, 135, 969–972. [Google Scholar] [CrossRef]
- Ursini, F.; Sevanian, A. Postprandial Oxidative Stress. Biol. Chem. 2002, 383, 599–605. [Google Scholar] [CrossRef]
- Nieto, G.; Bañón, S.; Garrido, M.D. Incorporation of thyme leaves in the diet of pregnant and lactating ewes: Effect on the fatty acid profile of lamb. Small Rumin. Res. 2012, 105, 140–147. [Google Scholar] [CrossRef]
- Schmeda-Hirschmann, G.; Jiménez-Aspee, F.; Theoduloz, C.; Ladio, A. Patagonian berries as native food and medicine. J. Ethnopharmacol. 2019, 241, 111979. [Google Scholar] [CrossRef]
- Salehi, B.; Sharifi-Rad, J.; Herrera-Bravo, J.; Salazar, L.A.; Delporte, C.; Barra, G.V.; Ramirez, M.-E.C.; López, M.D.; Ramírez-Alarcón, K.; Cruz-Martins, N.; et al. Ethnopharmacology, Phytochemistry and Biological Activities of Native Chilean Plants. Curr. Pharm. Des. 2021, 27, 953–970. [Google Scholar] [CrossRef]
- Fuentes, L.; Figueroa, C.; Valdenegro, M.; Vinet, R. Patagonian Berries: Healthy Potential and the Path to Becoming Functional Foods. Foods 2019, 8, 289. [Google Scholar] [CrossRef] [PubMed]
- Speisky, H.; López-Alarcón, C.; Gómez, M.; Fuentes, J.; Sandoval-Acuña, C. First Web-Based Database on Total Phenolics and Oxygen Radical Absorbance Capacity (ORAC) of Fruits Produced and Consumed within the South Andes Region of South America. J. Agric. Food Chem. 2012, 60, 8851–8859. [Google Scholar] [CrossRef] [PubMed]
- Ruiz, A.; Hermosín-Gutiérrez, I.; Mardones, C.; Vergara, C.; Herlitz, E.; Vega, M.; Dorau, C.; Winterhalter, P.; Von Baer, D. Polyphenols and Antioxidant Activity of Calafate (Berberis microphylla) Fruits and Other Native Berries from Southern Chile. J. Agric. Food Chem. 2010, 58, 6081–6089. [Google Scholar] [CrossRef] [PubMed]
- Vega-Galvez, A.; Rodríguez, A.; Stucken, K. Antioxidant, functional properties, and health-promoting potential of native South American berries: A review. J. Sci. Food Agric. 2021, 101, 364–378. [Google Scholar] [CrossRef] [PubMed]
- Pérez-Burillo, S.; Navajas-Porras, B.; López-Maldonado, A.; Hinojosa-Nogueira, D.; Pastoriza, S.; Rufián-Henares, J.Á. Green Tea and Its Relation to Human Gut Microbiome. Molecules 2021, 26, 3907. [Google Scholar] [CrossRef] [PubMed]
- Scazzocchio, B.; Minghetti, L.; D’archivio, M. Interaction between Gut Microbiota and Curcumin: A New Key of Understanding for the Health Effects of Curcumin. Nutrients 2020, 12, 2499. [Google Scholar] [CrossRef] [PubMed]
- Shandilya, S.; Kumar, S.; Kumar Jha, N.; Kumar Kesari, K.; Ruokolainen, J. Interplay of gut microbiota and oxidative stress: Perspective on neurodegeneration and neuroprotection. J. Adv. Res. 2021, 38, 223–244. [Google Scholar] [CrossRef] [PubMed]
- Vásquez, E.C.; Pereira, T.M.C.; Campos-Toimil, M.; Baldo, M.P.; Peotta, V.A. Gut Microbiota, Diet, and Chronic Diseases: The Role Played by Oxidative Stress. Oxid. Med. Cell. Longev. 2019, 2019, 7092032. [Google Scholar] [CrossRef]
- Bhanja, A.; Sutar, P.P.; Mishra, M. Inulin-A polysaccharide: Review on its functional and prebiotic efficacy. J. Food Biochem. 2022, 46, e14386. [Google Scholar] [CrossRef]
- Quitral, V.; Torres, M.; Velásquez, M.; Bobadilla, M. Efecto de inulina en la saciedad en humanos. Perspect. Nutr. Humana 2018, 20, 79–89. [Google Scholar] [CrossRef]
- Armas Ramos, R.A.; Martínez García, D.; Pérez Cruz, E.R. Fructanos tipo inulina: Efecto en la microbiota intestinal, la obesidad y la saciedad. Gac. Méd. Spirit 2019, 21, 134–145. Available online: http://scielo.sld.cu/scielo.php?script=sci_arttext&pid=S1608-89212019000200134 (accessed on 21 August 2024).
- García-Milla, P.; Peñalver, R.; Nieto, G. Formulation and Physical-Chemical Analysis of Functional Muffin Made with Inulin, Moringa, and Cacao Adapted for Elderly People with Parkinson’s Disease. Antioxidants 2024, 13, 683. [Google Scholar] [CrossRef] [PubMed]
- Food and Agriculture Organization of the United Nations. Metodos Analiticos Para La Determinacion De Humedad, Alcohol, Energia, Materia Grasa Y Colesterol En Alimentos. Available online: https://www.fao.org/3/ah833s/Ah833s16.htm#:~:text=La%20determinaci%C3%B3n%20de%20humedad%20es,base%20tal%20como%20se%20recibi%C3%B3 (accessed on 25 October 2023).
- Association of Official Analytical Chemists (AOAC). Official Methods of Analysis of Official Analytical Chemists. Available online: https://law.resource.org/pub/us/cfr/ibr/002/aoac.methods.1.1990.pdf (accessed on 25 October 2023).
- Greenfield, H.; Southgate, D.A.T. Datos de Composición de Alimentos: Obtención, Gestión y Utilización; FAO: Rome, Italy, 2003. [Google Scholar]
- Raymond, E. Métodos Aplicados Análisis Ley 20606 Etiquetado Nutricional. Available online: https://www.achipia.gob.cl/wp-content/uploads/2016/06/2-ISP-Salud-Ambiental-Ing.-Emilia-Raymond-.pdf (accessed on 25 October 2023).
- Konings, E.J.M. A Validated Liquid Chromatographic Method for Determining Folates in Vegetables, Milk Powder, Liver, and Flour. J. AOAC Int. 1999, 82, 119–127. [Google Scholar] [CrossRef] [PubMed]
- Pfeiffer, C.M.; Rogers, L.M.; Gregory, J.F. Determination of Folate in Cereal-Grain Food Products Using Trienzyme Extraction and Combined Affinity and Reversed-Phase Liquid Chromatography. J. Agric. Food Chem. 1997, 45, 407–413. [Google Scholar] [CrossRef]
- Tornero, E.M. Análisis de Folatos en Muestras Alimentarias Mediante Técnicas Cromatográficas de Alta Resolución. Available online: https://dehesa.unex.es/bitstream/10662/15229/1/978-84-697-4644-8_257.pdf (accessed on 29 October 2023).
- Vahteristo, L.T.; Ollilainen, V.; Koivistoinen, P.E.; Varo, P. Improvements in the Analysis of Reduced Folate Monoglutamates and Folic Acid in Food by High-Performance Liquid Chromatography. J. Agric. Food Chem. 1996, 44, 477–482. [Google Scholar] [CrossRef]
- Prosky, L.; Asp, N.G.; Furda, I.; DeVries, J.W.; Schweizer, T.F.; Harland, B.F. Determination of Total Dietary Fiber in Foods and Food Products: Collaborative Study. J. AOAC Int. 1985, 68, 677–679. [Google Scholar] [CrossRef]
- Ehlenfeldt, M.K.; Prior, R.L. Oxygen Radical Absorbance Capacity (ORAC) and Phenolic and Anthocyanin Concentrations in Fruit and Leaf Tissues of Highbush Blueberry. J. Agric. Food Chem. 2001, 49, 2222–2227. [Google Scholar] [CrossRef]
- Laurri, A.; Saura-Calixto, F.; Sanchez-Moreno, C. Un procedimiento para medir la eficacia antirradical de los polifenoles. J. Cienc. Aliment. Agric. 1998, 76, 270–276. [Google Scholar]
- Brand-Williams, W.; Cuvelier, M.E.; Berset, C. Use of a free radical method to evaluate antioxidant activity. LWT Food Sci. Technol. 1995, 28, 25–30. [Google Scholar] [CrossRef]
- Mathias-Rettig, K.; Ah-Hen, K. El color en los alimentos un criterio de calidad medible. Agro Sur 2014, 42, 57–66. [Google Scholar] [CrossRef]
- Madrigal, L.; Sangronis, E. La Inulina y Derivados Como Ingredientes Claves en Alimentos Funcionales. 2007. Available online: https://www.alanrevista.org/ediciones/2007/4/art-12/ (accessed on 16 November 2023).
- Rodríguez García, J. Reformulación de Productos Horneados Para Disminuir el Contenido en Grasa y Azúcar Mediante Sustitución con Inulina. Efectos Sobre la Estructura y Propiedades Físicas. Ph.D. Thesis, Universitat Politècnica de València, Valencia, Spain, 2014. [Google Scholar]
- Gutiérrez-Luna, K.; Astiasarán, I.; Ansorena, D. Gels as fat replacers in bakery products: A review. Crit. Rev. Food Sci. Nutr. 2022, 62, 3768–3781. [Google Scholar] [CrossRef]
- Wacewicz-Muczyńska, M.; Moskwa, J.; Puścion-Jakubik, A.; Naliwajko, S.K.; Niczyporuk, M.; Socha, K. Antioxidant Properties of Maqui Berry Extract (Aristotelia chilensis (Mol.) Stuntz) and Its Potential Photoprotective Role on Human Skin Fibroblasts. Molecules 2023, 28, 7802. [Google Scholar] [CrossRef] [PubMed]
- Shang, H.M.; Zhou, H.Z.; Yang, J.Y.; Li, R.; Song, H.; Wu, H.X. In vitro and in vivo antioxidant activities of inulin. PLoS ONE 2018, 13, e0192273. [Google Scholar] [CrossRef] [PubMed] [PubMed Central]
- Pasqualetti, V.; Altomare, A.; Guarino, M.P.L.; Locato, V.; Cocca, S.; Cimini, S.; Palma, R.; Alloni, R.; De Gara, L.; Cicala, M. Antioxidant Activity of Inulin and Its Role in the Prevention of Human Colonic Muscle Cell Impairment Induced by Lipopolysaccharide Mucosal Exposure. PLoS ONE 2014, 9, e98031. [Google Scholar] [CrossRef] [PubMed] [PubMed Central]
- Rodríguez-García, J.; Puig, A.; Salvador, A.; Hernando, I. Optimization of a sponge cake formulation with inulin as fat replacer: Structure, physicochemical, and sensory properties. J. Food Sci. 2012, 77, C189–C197. [Google Scholar] [CrossRef] [PubMed]
- Zahn, S.; Pepke, F.; Rohm, H. Effect of inulin as a fat replacer on texture and sensory properties of muffins. Int. J. Food Sci. Technol. 2010, 45, 2531–2537. [Google Scholar] [CrossRef]
- Rodríguez, J.P. Evaluación de Inulina Como Reemplazante de Grasa en Tortas de Bajo Contenido Calórico a Través de la Vida Útil; Universidad Nacional de Colombia: Bogotá, Colombia, 2016; Available online: https://repositorio.unal.edu.co/handle/unal/57928 (accessed on 28 July 2024).
- Doménech-Asensi, G.; Merola, N.; López-Fernández, A.; Ros-Berruezo, G.; Frontela-Saseta, C. Influence of the reformulation of ingredients in bakery products on healthy characteristics and acceptability of consumers. Int. J. Food Sci. Nutr. 2016, 67, 74–82. [Google Scholar] [CrossRef]
- Islas-Rubio, A.R.; Hernández-Zepeda, A.; Calderón de la Barca, A.M.; Ballesteros-Vásquez, M.N.; Granados-Nevárez, M.d.C.; Vásquez-Lara, F. Formulación y elaboración de pastelillos tipo brownies con más fibra y menos calorías que los convencionales. Arch. Latinoam. Nutr. 2012, 62, 185–191. Available online: http://ve.scielo.org/scielo.php?script=sci_arttext&pid=S0004-06222012000200013&lng=es&nrm=iso&tlng=es (accessed on 21 January 2024).
- Munekata, P.E.S.; Pateiro, M.; Domínguez, R.; Nieto, G.; Kumar, M.; Dhama, K.; Lorenzo, J.M. Bioactive Compounds from Fruits as Preservatives. Foods 2023, 12, 343. [Google Scholar] [CrossRef]
- Martínez-Zamora, L.; Peñalver, R.; Ros, G.; Nieto, G. Substitution of synthetic nitrates and antioxidants by spices, fruits and vegetables in Clean label Spanish chorizo. Food Res. Int. 2021, 139, 109835. [Google Scholar] [CrossRef] [PubMed]
- Praznik, W.; Cieślik, E.; Filipiak-Florkiewicz, A. Soluble dietary fibres in Jerusalem artichoke powders: Composition and application in bread. Food/Nahrung 2002, 46, 151–157. [Google Scholar] [CrossRef] [PubMed]
- Gironés-Vilaplana, A.; Calín-Sánchez, Á.; Moreno, D.A.; Carbonell-Barrachina, Á.A.; García-Viguera, C. Novel maqui liquor using traditional pacharán processing. Food Chem. 2015, 173, 1228–1235. [Google Scholar] [CrossRef] [PubMed]
- Agulló, V.; García-Viguera, C.; Domínguez-Perles, R. Beverages Based on Second Quality Citrus Fruits and Maqui Berry, a Source of Bioactive (Poly)phenols: Sorting Out Urine Metabolites upon a Longitudinal Study. Nutrients 2021, 13, 312. [Google Scholar] [CrossRef] [PubMed]
- Brauch, J.E.; Buchweitz, M.; Schweiggert, R.M.; Carle, R. Detailed analyses of fresh and dried maqui (Aristotelia chilensis (Mol.) Stuntz) berries and juice. Food Chem. 2016, 190, 308–316. [Google Scholar] [CrossRef]
- Gironés-Vilaplana, A.; Villaño, D.; Moreno, D.A.; García-Viguera, C. New isotonic drinks with antioxidant and biological capacities from berries (maqui, açaí and blackthorn) and lemon juice. Int. J. Food Sci. Nutr. 2013, 64, 897–906. [Google Scholar] [CrossRef] [PubMed]
- Pizarro, F.; Riquelme, R. El Pan Nuestro de Cada Día: Su Historia Y Fortificación. 2022. Available online: https://inta.uchile.cl/noticias/201109/el-pan-nuestro-de-cada-dia-su-historia-y-fortificacion (accessed on 18 February 2024).
- Ministerios de Salud del Gobierno de Chile. Reglamento Sanitario de los Alimentos; Ministerios de Salud del Gobierno de Chile: Santiago, Chile, 2013.
- Organización Panamericana de la Salud (OPS). Nutrición y Vida Avtice: Del Conocimiento a La Acción; Wilma, F., Ed.; Organización Panamericana de la Salud: Washington, DC, USA, 2006; pp. 99–107. Available online: https://books.google.cl/books?hl=es&lr=&id=D6qbM8XRomoC&oi=fnd&pg=PA99&dq=acido+folico+en+pan&ots=sT1yaYkXKB&sig=RyhrImbmcsFwSRZav8ZwC8lkY3Q&redir_esc=y#v=onepage&q=acido%20folico%20en%20pan&f=false (accessed on 18 February 2024).
- Muller, H. Determination of the folic acid content of grain, cereal products, baked goods and legumes using high-performance liquid chromatography (HPLC). Z. Leb. Unters. Forsch. 1993, 197, 573–577. [Google Scholar]

| Samples | Flour (g) | Baking Powder (g) | Sugar (g) | Eggs (units) | Semi-Skimmed Milk (g) | Olive Oil (g) | Inulin (g) | Calafate (g) | Maqui (g) |
|---|---|---|---|---|---|---|---|---|---|
| Control | 150 | 5 | 100 | 1 | 115 | 50 | 0 | 0 | 0 |
| MI | 150 | 5 | 100 | 1 | 115 | 20 | 30 | 0 | 0 |
| MICa | 150 | 5 | 100 | 1 | 115 | 20 | 30 | 6 | 0 |
| MIMa | 150 | 5 | 100 | 1 | 115 | 20 | 30 | 0 | 6 |
| Samples | ||||
|---|---|---|---|---|
| Control | MI | MICa | MIMa | |
| Moisture | 23.44 ± 0.16 (ns) | 23.55 ± 0.25 (ns) | 23.67 ± 1.02 (ns) | 24.01 ± 1.27 (ns) |
| Energy | 367.02 ± 13.60 (ns) | 339.91 ± 4.06 (ns) | 302.56 ± 44.75 (ns) | 303.83 ± 4.71 (ns) |
| Proteins | 6.48 ± 0.19 (ns) | 7.08 ± 0.55 (ns) | 6.46 ± 1.18 (ns) | 7.13 ± 0.35 (ns) |
| Carbohydrates | 43.23 ± 4.67 (ns) | 46.53 ± 0.53 (ns) | 54.40 ± 7.43 (ns) | 52.53 ± 0.91 (ns) |
| Fat | 18.69 ± 3.67 * | 13.94 ± 0.45 * | 7.10 ± 5.40 * | 7.24 ± 0.77 * |
| Ash | 0.93 ± 0.13 (ns) | 1.15 ± 0.11 (ns) | 1.01 ± 0.09 (ns) | 1.05 ± 0.11 (ns) |
| Samples | ||||
|---|---|---|---|---|
| Control | MI | MICa | MIMa | |
| Insoluble Fiber | 0.87 ± 0.41 (ns) | 0.95 ± 0.05 (ns) | 0.85 ± 1.15 (ns) | 1.10 ± 0.40 (ns) |
| Soluble Fiber | 6.35 ± 0.68 (ns) | 6.80 ± 0.18 (ns) | 6.49 ± 0.90 (ns) | 6.34 ± 0.34 (ns) |
| Total Fiber | 6.45 ± 1.09 (ns) | 7.59 ± 0.22 (ns) | 8.80 ± 2.05 (ns) | 7.70 ± 0.75 (ns) |
| Samples | Assay | |||
|---|---|---|---|---|
| DPPH (%) | ABTS (%) | ORAC (μmol TE/g) | FRAP (μmol TE/g) | |
| Control | 579.92 ± 33.03 | 2446.39 ± 723.34 | 44.58 ± 6.97 ** | 2.16 ± 0.28 ** |
| MI | 661.14 ± 104.15 | 2835.81 ± 723.34 | 67.92 ± 5.84 ** | 3.18 ± 0.10 ** |
| MICa | 742.67 ± 70.67 | 3600.12 ± 969.93 | 100.89 ± 2.00 ** | 12.03 ± 4.48 ** |
| MIMa | 905.74 ± 360.79 | 4130.49 ± 1321.33 | 90.69 ± 5.41 ** | 12.03 ± 1.13 ** |
| Mean/Standard Deviation | ABTS (μmol TE/g) | DPPH (μmol TE/g) |
|---|---|---|
| Inulin | 262.5728 ± 34.74 | 9.092518 ± 10.43 |
| Parameters | Samples | |||
|---|---|---|---|---|
| Control | MI | MICa | MIMa | |
| Folin (mg gallic acid/g sample) | 2.35 ± 0.03 ** | 3.28 ± 0.22 ** | 8.91 ± 0.07 ** | 8.75 ± 0.18 ** |
| Samples (n = 4) | Folic Acid | THF | 5M-THF | 5F-THF | Total |
|---|---|---|---|---|---|
| Control | 18.98 ± 1.52 ** | 148.00 ± 10.15 ** | 70.97 ± 0.16 ** | 374.27 ± 2.85 ** | 612.22 ± 5.95 ** |
| MI | 34.46 ± 1.25 ** | 8.43 ± 1.83 ** | 73.16 ± 1.11 ** | 172.20 ± 3.87 ** | 288.25 ± 3.33 ** |
| MICa | 44.77 ± 0.67 ** | 42.66± 0.58 ** | 101.55 ± 1.04 ** | 398.11 ± 1.86 ** | 587.09 ± 1.17 ** |
| MIMa | 45.84 ± 0.63 ** | 49.11 ± 3.32 ** | 91.43 ± 1.01 ** | 362.30 ± 2.65 ** | 548.68 ± 6.35 ** |
| Samples (n = 4) | Colorimetry | ||||
|---|---|---|---|---|---|
| C | L | a | b | h | |
| Control | 29.12 ± 2.35 ** | 61.55 ± 2.11 ** | 4.70 ± 0.66 | 28.72 ± 2.30 ** | 80.74 ± 0.61 ** |
| MI | 28.30 ± 1.83 ** | 60.66 ± 0.85 ** | 5.70 ± 0.50 | 27.73 ± 1.79 ** | 78.37 ± 0.87 ** |
| MICa | 6.63 ± 0.59 ** | 35.29 ± 0.87 ** | 5.43 ± 0.30 | 3.81 ± 0.60 ** | 34.85 ± 2.83 ** |
| MIMa | 8.42 ± 0.33 ** | 34.06 ± 0.66 ** | 5.54 ± 0.17 | 6.34 ± 0.29 ** | 48.89 ± 0.44 ** |
| Samples | Appearance | Aroma | Texture | Flavor | Overall Color | Purchase Intention | Overall Acceptability |
|---|---|---|---|---|---|---|---|
| Average ± SD | |||||||
| Control | 4.00 ± 0.74 | 3.74 ± 0.86 | 3.32 ± 0.99 | 4.00 ± 0.93 | 4.09 ± 0.92 | 3.36 ± 1.26 | 3.95 ± 0.72 |
| MI | 4.04 ± 1.11 | 3.13 ± 1.25 | 3.39 ± 0.99 | 3.83 ± 1.11 | 4.09 ± 0.92 | 3.22 ± 1.44 | 3.61 ± 1.03 |
| MICa | 3.26 ± 1.21 | 3.17 ± 1.07 | 3.18 ± 1.30 | 3.23 ± 1.38 | 3.26 ± 1.32 | 3.30 ± 1.43 | 3.61 ± 1.20 |
| MIMa | 3.48 ± 1.34 | 3.13 ± 1.22 | 3.26 ± 1.10 | 3.39 ± 1.27 | 3.48 ± 1.38 | 3.39 ± 1.34 | 3.57 ± 1.20 |
Disclaimer/Publisher’s Note: The statements, opinions and data contained in all publications are solely those of the individual author(s) and contributor(s) and not of MDPI and/or the editor(s). MDPI and/or the editor(s) disclaim responsibility for any injury to people or property resulting from any ideas, methods, instructions or products referred to in the content. |
© 2024 by the authors. Licensee MDPI, Basel, Switzerland. This article is an open access article distributed under the terms and conditions of the Creative Commons Attribution (CC BY) license (https://creativecommons.org/licenses/by/4.0/).
Share and Cite
García-Milla, P.; Peñalver, R.; Nieto, G. Development of Functional Muffins with Fruits of the Chilean Forest (Calafate and Maqui) and Supplemented with Prebiotic Fiber. Appl. Sci. 2024, 14, 7757. https://doi.org/10.3390/app14177757
García-Milla P, Peñalver R, Nieto G. Development of Functional Muffins with Fruits of the Chilean Forest (Calafate and Maqui) and Supplemented with Prebiotic Fiber. Applied Sciences. 2024; 14(17):7757. https://doi.org/10.3390/app14177757
Chicago/Turabian StyleGarcía-Milla, Paula, Rocío Peñalver, and Gema Nieto. 2024. "Development of Functional Muffins with Fruits of the Chilean Forest (Calafate and Maqui) and Supplemented with Prebiotic Fiber" Applied Sciences 14, no. 17: 7757. https://doi.org/10.3390/app14177757