Article

Hormonal Balance and Cardiovascular Health: Exploring the Interconnection between Menopause, Body Composition, and Thyroid Function in a Cohort of Hypertensive Women

1
Division of Cardiology, Department of Clinical and Molecular Medicine, University of Rome Sapienza, Sant’Andrea Hospital, 00189 Rome, Italy
2
Department of Translational Medicine and Surgery, Catholic University of the Sacred Heart, 00168 Rome, Italy
3
Fondazione Policlinico Universitario A. Gemelli, Istituto di Ricovero e Cura a Carattere Scientifico (IRCCS), 00168 Rome, Italy
4
Section of Clinical Nutrition and Nutrigenomic, Department of Biomedicine and Prevention, University of Rome Tor Vergata, Via Montpellier 1, 00133 Rome, Italy
5
School of Specialization in Food Science, University of Rome Tor Vergata, 00133 Rome, Italy
6
Ph.D. School of Applied Medical-Surgical Sciences, University of Tor Vergata, Via Montpellier 1, 00133 Rome, Italy
*
Authors to whom correspondence should be addressed.
Appl. Sci. 2024, 14(17), 7772; https://doi.org/10.3390/app14177772
Submission received: 20 July 2024 / Revised: 27 August 2024 / Accepted: 31 August 2024 / Published: 3 September 2024

Abstract

:
Background. The rise in global obesity has worsened the prevalence of metabolic syndrome and related cardiovascular complications, particularly among post-menopausal women. Dysfunctions in thyroid hormone activity, critical for metabolic regulation, are often implicated in obesity and its associated conditions. This study evaluated the interactions between thyroid function, body composition, and cardiovascular health in post-menopausal women. Material and Methods. We conducted an observational, prospective, open-label clinical study, involving post-menopausal women, stratified into two groups based on weight changes after menopause: the Menopausal Weight Gain Group (MWGG) and the Menopausal Weight Maintenance Group (MWMG). We included 12 cases (MWGG) and 8 control (MWMG) women. Participants underwent cardio-metabolic assessments, including evaluations of thyroid function, blood pressure, arterial stiffness, body composition, and cardiovascular risk profiles. The statistical analysis employed t-tests and Pearson correlations. Results. The MWGG showed significant increases in both the Augmentation Index (AI@75) and adiposity markers (BMI, total fat mass, in percentage and kg, and lean–to–fat mass ratio) compared to the MWMG. A notable decrease in FT3 and the FT3/FT4 ratio was observed in the MWGG. Moreover, discrepancies in Cholesterol levels and insulinemia were reported between groups. Moreover, differences in cholesterol levels and insulinemia were reported between groups. We analyzed the correlation between blood pressure, cardiovascular stiffness, and body composition parameters; notably, there was a strong correlation between AI@75 and weight, BMI, and total fat mass, and a strong negative correlation with the lean–to–fat mass ratio. Conclusions. The MWGG presented a higher BMI, greater total fat mass (kg) and a higher percentage of total fat mass compared to the MWMG. Interestingly, we reported a significant difference in intramuscular adipose tissue between the groups. These results highlight the importance of further research to elucidate the mechanisms involved and to develop targeted interventions for managing menopause-related cardio-metabolic risks.

1. Background

The global rise in obesity is linked to a concurrent increase in the prevalence of metabolic syndrome and its cardiovascular sequelae [1]. This trend is particularly pronounced among post-menopausal women [2], who exhibit a higher prevalence of obesity due to menopause-related shifts in energy metabolism, including diminished fat oxidation and decreased spontaneous physical activity [3,4], leading to a decline in overall energy expenditure [3]. Additionally, the deficiency in estrogen production during menopause contributes to the loss of muscle mass and the increase in fat mass, particularly in central areas of the body, such as the abdomen and visceral regions. Consequently, this redistribution of body fat increases the risk of cardiovascular diseases [5,6].
Thyroid hormones play a pivotal role in governing metabolic processes, encompassing energy expenditure and thermogenesis, as well as the regulation of protein, carbohydrate, and lipid metabolism, and thyroid dysfunction has the potential to precipitate obesity or give rise to conditions associated with it [7]. Thyroid impairment or dysfunction, such as hypothyroidism, can mimic metabolic syndrome characteristics, including weight gain and altered body composition, and can potentially elevate cardiovascular risk through associations with insulin resistance and dyslipidemia [7,8].
Focusing on thyroid function, total and free thyroid hormones, (including free-triiodothyronine (FT3) and free-thyroxine (FT4) levels and the FT3/FT4 ratio) higher serum thyroid-stimulating hormone (TSH) concentrations and low serum FT4 levels were reported in obese individuals in comparison to non-obese ones. Observational studies reported abnormal thyroid hormone levels in obesity, suggesting increased deiodinase activity and a compensatory mechanism in total triiodothyronine (TT3) levels to counteract obesity-related fat accumulation [7]. It should be noted that the observed increase in FT3 levels among obese individuals, which govern both resting metabolic rate and thermogenesis, could potentially represent a compensatory mechanism aimed at addressing the heightened central fat accumulation associated with this condition [9,10]: to facilitate fat-burning through the elevation of basal metabolic rate and the stimulation of brown adipose tissue production [7]. However, the interplay between thyroid function and age-related hormonal and adipose changes, particularly at a time when women are undergoing a transition towards an increased cardiovascular risk, such as during menopause, remains inadequately understood [7,9].
The relative inconsistency of research findings necessitates further exploration into how societal and health factors can influence fat remodeling and cardiovascular risk mitigation in post-menopausal women. This has been recently reaffirmed in a milestone article published in The Lancet [11]. Based on these considerations, our study aimed to conduct a detailed metabolic assessment of post-menopausal women within 2 to 8 years post-menopause, focusing on thyroid function, blood pressure (BP), arterial stiffness, body composition, and cardiovascular risk. Our population sample was stratified into two groups, comparing those who have gained weight (menopausal weight gain group—MWGG) to those who have maintained weight (menopausal weight maintenance group—MWMG).
We further explored the potential correlation between cardiovascular parameters and physical and metabolic changes in our selected menopausal women with arterial hypertension.

2. Material and Methods

2.1. Participants and Study Design

The study was designed as an observational, prospective, open-label clinical study conducted at the Hypertension Unit, Division of Cardiology, Sant’Andrea Hospital, Sapienza University of Rome, for BP evaluation and CV risk assessment, and at the Section of Clinical Nutrition and Nutrigenomics, Department of Biomedicine and Prevention, University of Rome Tor Vergata, for nutritional and medical examinations, between 4 December 2023 and 28 March 2024.
The study participants were post-menopausal women (n = 20), who were consistently followed at our hypertension unit at the Division of Cardiology, Sant’Andrea Hospital, Sapienza University of Rome. The participants were divided into two groups. The detailed characteristics of the study participants are included in Table 1.
The inclusion criteria required participants: to be female; to have post-menopause by at least two years; to report either a weight increase or maintenance (categorized as MWGG for the menopausal weight gain group or MWMG for the menopausal weight maintenance group); to have a confirmed diagnosis of uncomplicated essential hypertension; to provide signature for informed consent. Exclusion criteria encompassed hormonal replacement therapy, active cancer within the past five years, a history of mental diseases including depression before menopause, drug and alcohol addiction, and unwillingness to undergo joint evaluations at both universities.

2.2. Study Procedures

Demographic and clinical data were systematically collected for all participants. Anthropometric measurements, including height, weight, body mass index (BMI), and waist and hip circumference (WC and HC), were meticulously recorded. BMI was calculated using the formula: body weight in kilograms divided by the square of height in meters [12]. The categorization followed the guidelines established by the World Health Organization (WHO). Additionally, the waist–to–hip circumference ratio (WHR) was assessed, with a WHR value exceeding 0.85 considered indicative of risk in women [12,13].
Non-invasive measurements of clinic systolic/diastolic brachial and central (aortic) BP levels, and heart rate were conducted using a validated cuff-based oscillometric device (Mobil-O-Graph PWA Monitor, I.E.M. GmbH, Stolberg, Germany), as previously described [14]. Briefly, three consecutive BP measurements were taken at 1-min intervals, with the average of the three considered the reference value for clinical BP. The central aortic BP was measured following a 30-s interval after the last clinic BP measurement, using appropriately sized cuffs or larger or smaller cuffs for obese or thin subjects, respectively, according to European guidelines [15].
All participants underwent a resting 12-lead electrocardiogram (ECG) while in the supine position, utilizing a Mortara Eli 350 ECG device (Milwaukee, WI, USA). The ECGs were recorded with a paper speed of 25 mm/s and a calibration of 1 mV/cm. Each ECG was then scanned at 600 dpi, allowing for both conventional and novel ECG parameters to be analyzed on a high-resolution computer monitor. We assessed heart rate (HR) and conventional ECG parameters, including PR interval, QRS duration, QT and QTc intervals, and left ventricular hypertrophy (LVH) indexes, as recommended by current European guidelines [15] and as applied in previous studies [14].
After a 8-h overnight fast, all subjects underwent whole-body and segmental fat mass (measured in kilograms) assessment, employing Dual-Energy X-ray Absorptiometry (DXA) scans, a Primus X-ray densitometer, and software version 1.2.2 (Osteosys Co., Ltd., Guro-gu, Seoul, Korea). All individuals were instructed to remove their clothes (except underwear), shoes, and any metal object before being measured. The total fat mass percentage (%FM) was determined by dividing the total body fat mass (Total FM) by the combined mass of all tissues, including the total body bone (TBBone). The formula used for this calculation is as follows [16]:
%FM = (Total FM/(Total FM + Total Lean Mass (LM) + TBBone)) × 100
Subsequently, following a fasting period of at least 8 h, an array of metabolic markers, including fasting blood glucose (FBG), insulin levels, total cholesterol, triglycerides, high-density lipoprotein cholesterol (HDL-C), low-density lipoprotein cholesterol (LDL-C), TSH, FT3, and FT4, were comprehensively analyzed.
For each patient, blood samples were drawn in the morning between 8:00 and 10:00 a.m. from the antecubital vein while the patient was seated and in a fasting state. Samples were collected using BD Vacutainer tubes (Franklin Lakes, NJ, USA), either without anticoagulants or with anticoagulants (trisodium citrate, 3.8%, 1/10 (v/v) or 7.2 EDTA).
All patients consistently adhered to their baseline antihypertensive therapy without any modifications prior to the diagnostic tests.

2.3. Statistical Analysis

Normality of the data distribution was assessed using the Shapiro–Wilk test. Categorical variables were compared using Fisher’s exact test and the Chi-square test. Continuous variables were presented as either median (interquartile range, IQR) or mean (± standard deviation, SD) based on their distribution. Comparisons between groups were made using either a paired sample t-test for normally distributed data or the Mann–Whitney U test for non-normally distributed data. Specifically, variables with a normal distribution were reported as mean ± SD, and analyses included the t-test and Pearson correlation. For variables that did not follow a normal distribution, the Mann–Whitney U test and Spearman correlation were applied.
To assess significant differences within the MWGG and MWMG groups, t-tests were employed. The Pearson correlation coefficient (denoted as “r”) was calculated to evaluate the linear relationship between continuous variables, with correlation values ranging between −1 and 1. Additionally, we visually inspected the scatterplot to verify linearity. A p-value below 0.05 was considered statistically significant. All analyses were conducted using Stata version 16.0 (StataCorp, College Station, TX, USA).

3. Results

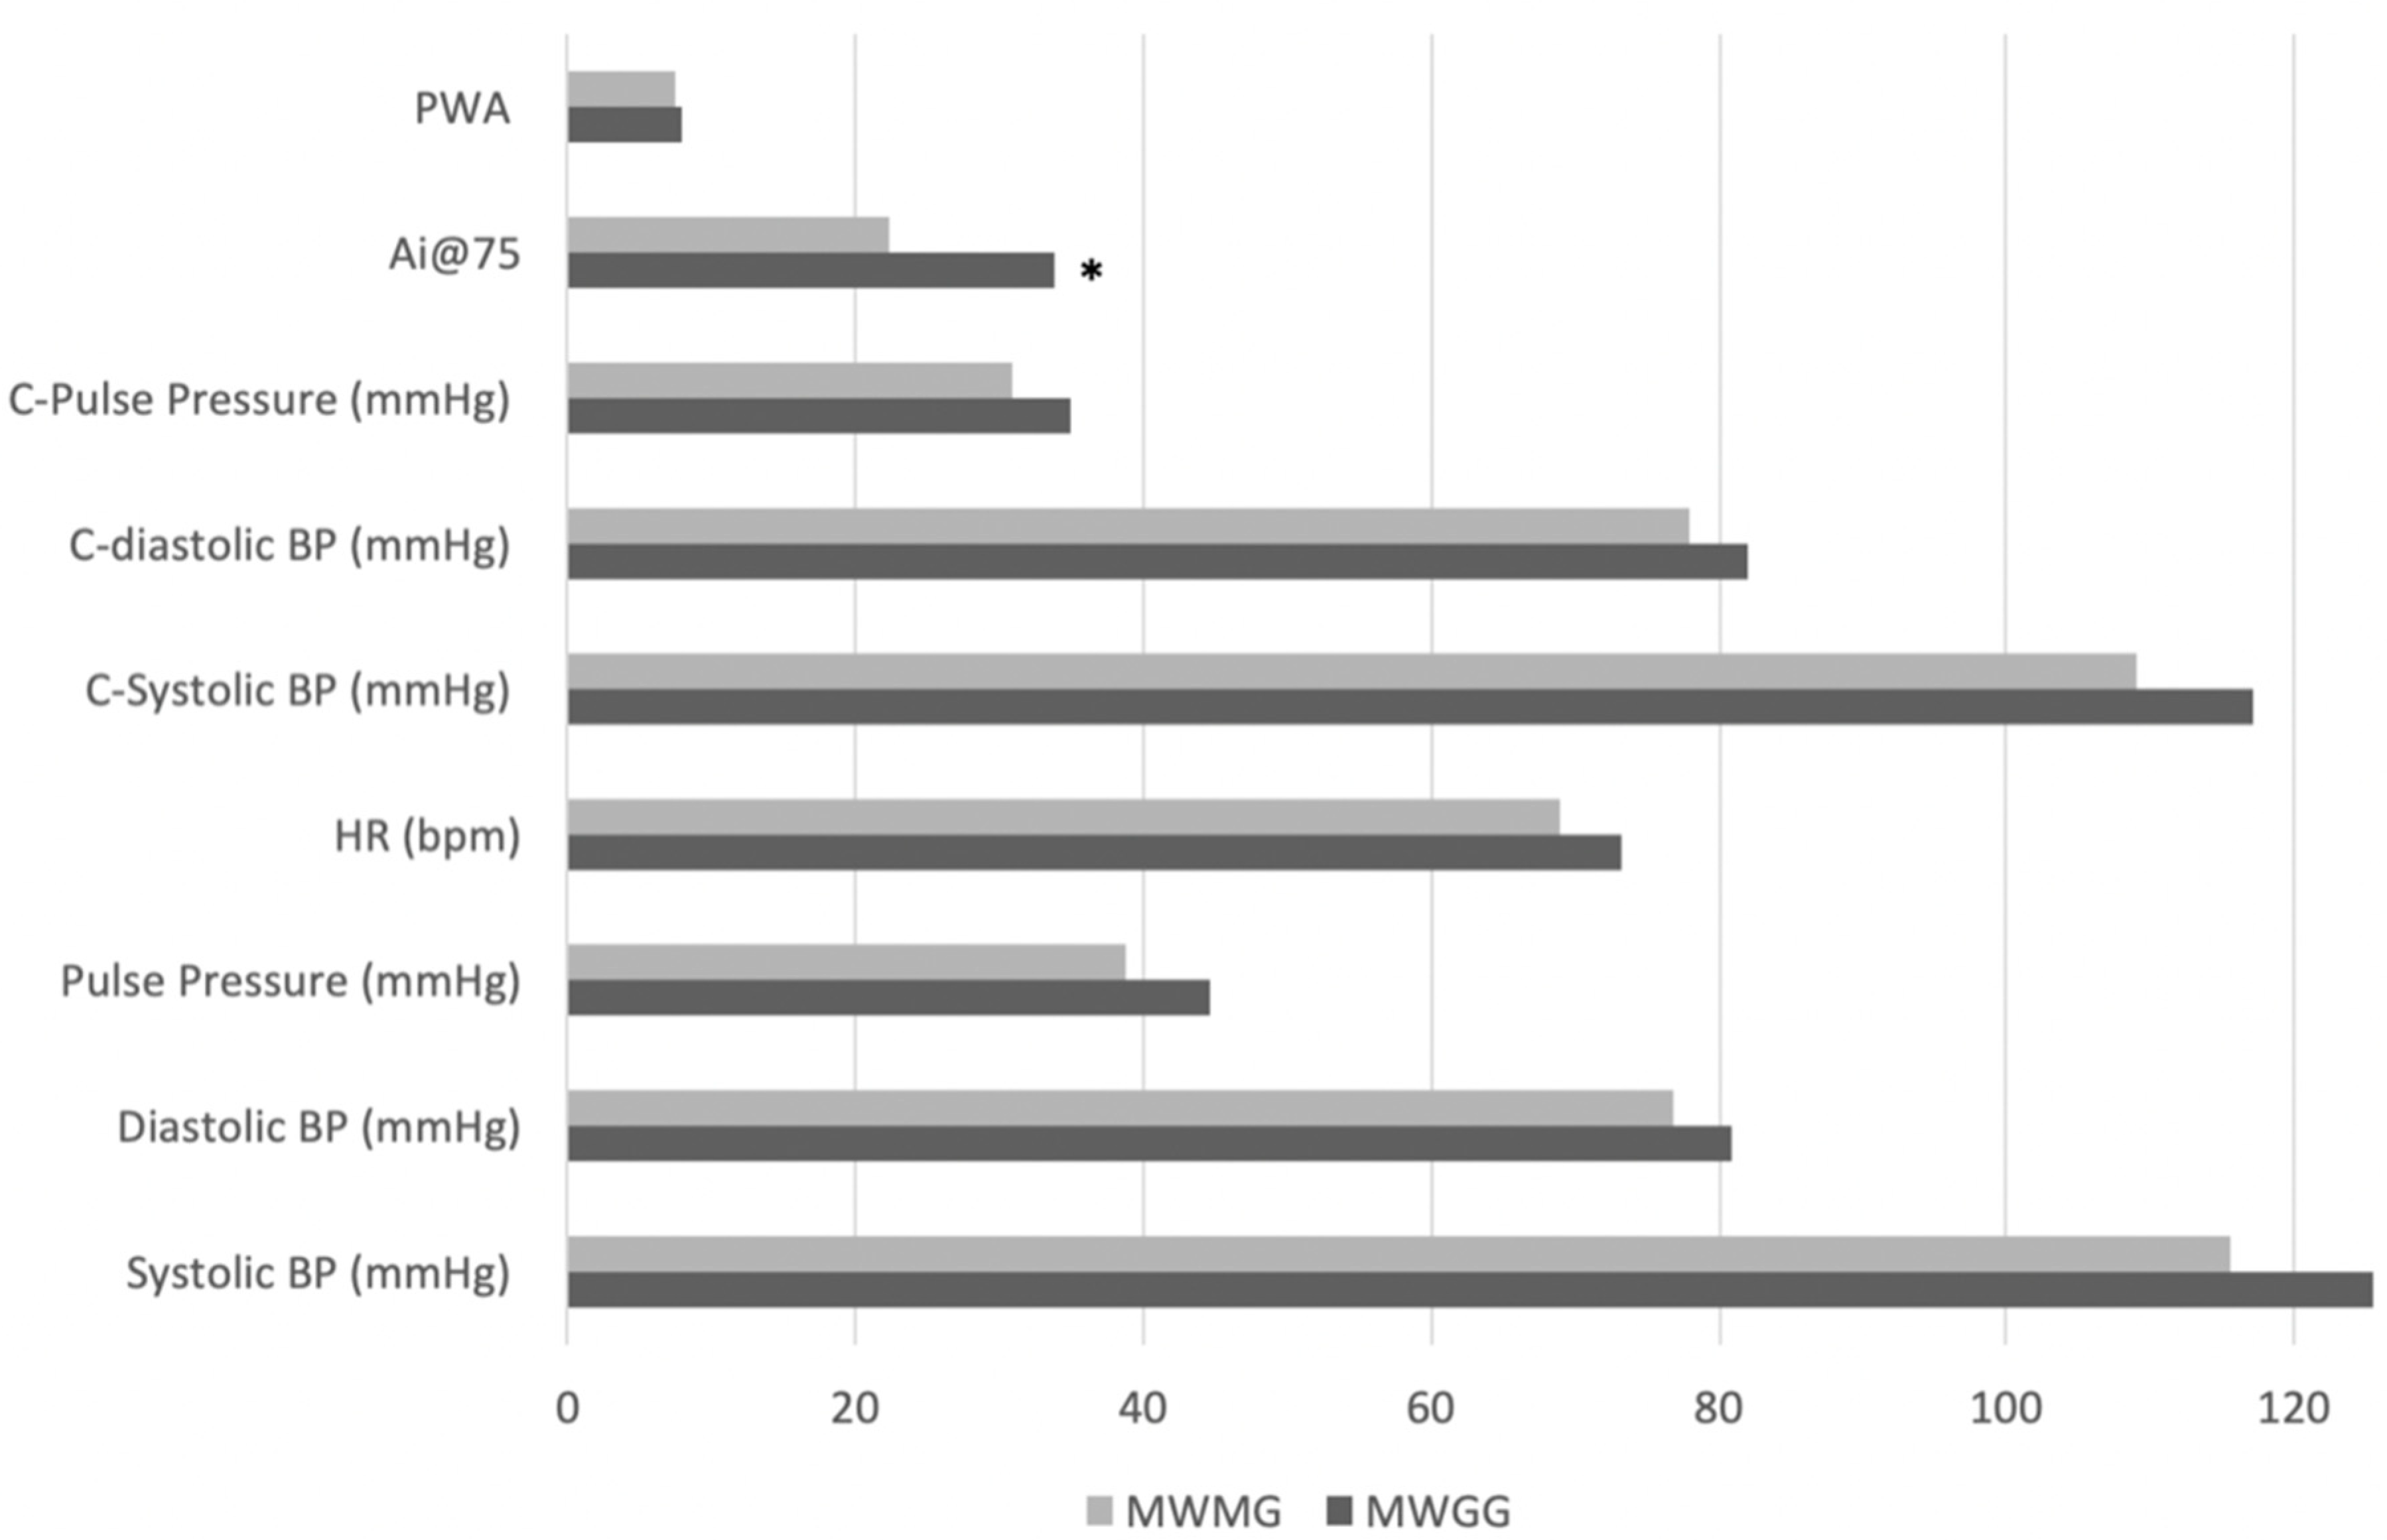
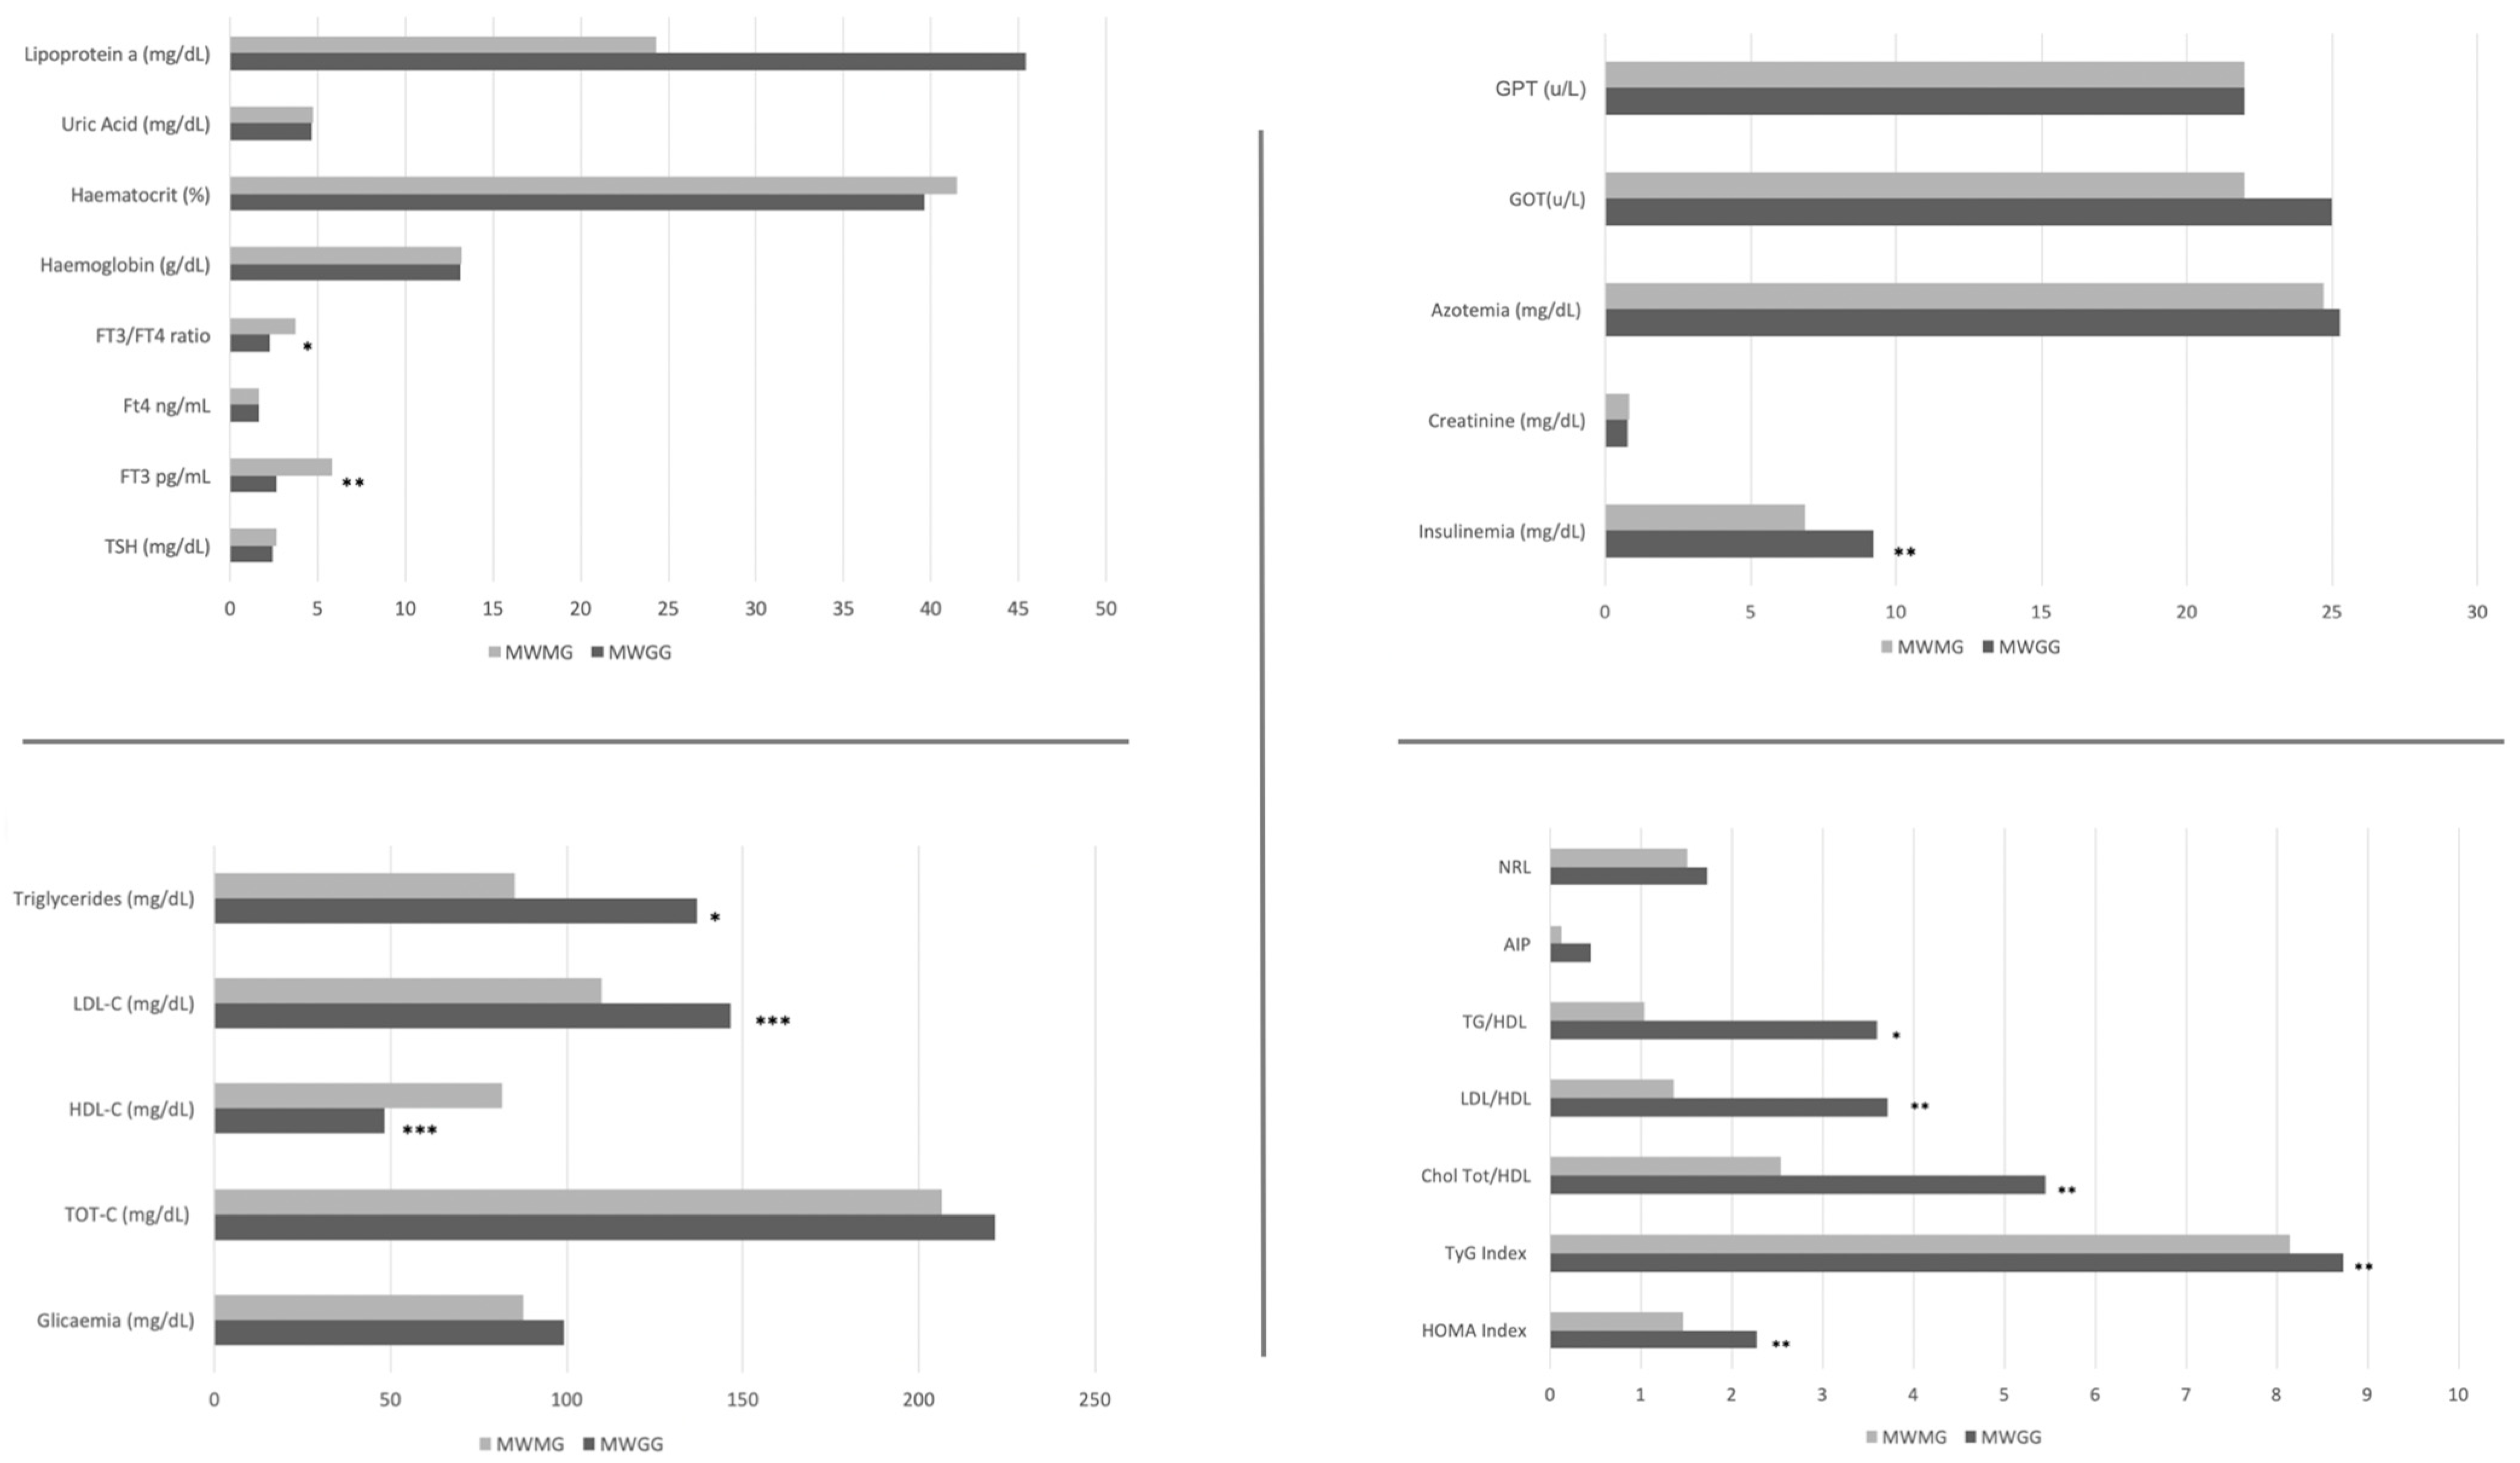
3.1. Comparison of Cardiovascular and Body Composition Parameters between Menopausal Weight Gain and Menopausal Weight Maintenance Groups

General characteristics of the study population are reported in Table 1.
The comparison of physiological parameters between the MWGG and MWMG revealed no statistically significant differences in brachial and central, systolic, and diastolic BP levels, as well as in heart rate. There was no significant difference in the pulse wave analysis (PWA) between the two groups. However, the augmentation index (Ai@75) resulted as significantly higher in the MWGG compared to the MWMG (33.90 ± 2.63 vs. 22.42 ± 5.27, p = 0.04) (Figure 1).
MWGG women presented with a higher BMI (29.00 ± 1.03 vs. 23.46 ± 1.16, p = 0.003), greater total fat mass (Kg) (28.19 ± 1.56 vs. 17.58 ± 2.02, p < 0.001), and higher percentage of total fat mass (38.71 ± 1.24 vs. 28.62 ± 2.48, p < 0.001) than MWMG ones. Additionally, patients in the MWGG showed a lower lean–to–fat mass ratio (1.53 ± 0.08 vs. 2.52 ± 0.29, p = 0.001) than those in the MWMG. However, there were no significant differences in waist–hip ratio, visceral adipose tissue (VAT), or appendicular skeletal muscle mass index (ASMI) between the two groups (p > 0.05).
Interestingly, we also reported a significant difference of intermuscular adipose tissue (IMAT) between groups (1.14 ± 0.09 vs. 0.62 ± 0.09, p = 0.001) (Figure 2).
MWGG women showed significantly higher levels of insulinemia, LDL-C, triglycerides, FT3, FT3/FT4 ratio, Homeostatic Model Assessment for Insulin Resistance (HOMA index), TyG index, Chol Tot/HDL ratio, LDL/HDL ratio, and TG/HDL ratio (9.21 ± 0.38 vs. 6.86 ± 0.79, p < 0.007; 146.41 ± 7.43 vs. 109.74 ± 10.38, p = 0.001; 137.08 ± 16.31 vs. 85.14 ± 13.73, p = 0.04; 2.29 ± 0.37 vs. 3.70 ± 0.25, p = 0.02; 2,28 ± 0,17 vs. 1.45 ± 0.14, p = 0.005; 8.73 ± 0.11 vs. 8.14 ± 0.15, p = 0.007; 5.46 ± 0.74 vs. 2.54 ± 0.17, p = 0.009; 3.71 ± 0.58 vs. 1.36 ± 0.14, p = 0.008; 3.60 ± 0.71 vs. 1.04 ± 1.75, p = 0.01, respectively) and lower levels of HDL-C than MWMG patients (48.15 ± 5.26 vs. 81.85 ± 3.81, p < 0.001) (Figure 3).

3.2. Correlations between Blood Pressure Parameters and Body Composition

The results of these analyses are reported in Table 2.
There were some significant correlations observed. Waist–Hip Ratio (WHR) showed a significant correlation with brachial systolic and diastolic blood pressure, central systolic and diastolic blood pressure, and arterial stiffness as measured by AI@75. Additionally, VAT had significant correlations with brachial and central systolic blood pressure, brachial diastolic blood pressure, and AI@75. AI@75 was also significantly correlated with total fat mass, lean/fat mass ratio, and IMAT.
In contrast, several correlations did not reach statistical significance. Specifically, weight, BMI, and total fat mass (FM) did not show significant correlations with most of the cardiovascular parameters, including brachial systolic and diastolic blood pressure, heart rate, central systolic and diastolic blood pressure, and pulse wave analysis (PWA). Similarly, lean/fat mass ratio and IMAT also had mostly non-significant correlations with the cardiovascular parameters.

3.3. Correlations between Cardiovascular and Cardiometabolic Risk Indices and Blood Pressure and Body Composition Parameters

The results of these analyses are reported in Table 3.
We showed moderate to strong positive correlations with brachial and central systolic BP with the HOMA Index (r = 0.65, p < 0.01; r = 0.57, p = 0.01, respectively), TyG index (r = 0.56, p < 0.01; r = 0.52, p = 0.02, respectively), and atherogenic index of plasma (AIP) (r = 0.51, p = 0.02; r = 0.48, p = 0.04, respectively).
Peripheral arterial stiffness, as measured by PWA, correlates with the HOMA Index (r = 0.49, p = 0.04) and the neutrophil–to–lymphocyte ratio (N/L Ratio) (r = 0.54, p = 0.01).
Metabolic syndrome and cardiovascular risk indices such as the triglycerides to HDL ratio (TG/HDL) and BMI (r = 0.47, p = 0.03).
Moreover, the HOMA index showed a strong positive correlation with VAT (r = 0.59, p = 0.01) and WHR (r = 0.50, p = 0.03).

3.4. Correlation between Endocrine-Metabolic Setting and Blood Pressure and Body Composition

The results of these analyses are reported in Table 4.
Glucose levels exhibit correlations with body composition parameters, particularly WHR (r = 0.52, p = 0.02) and VAT (r = 0.61, p = 0.01) and insulinemia correlates with brachial systolic BP (r = 0.50, p = 0.03) and Ai@75 (r = 0.56, p = 0.01). HDL-C emerged as a central connection between BP and body composition, with a significant negative correlation observed with systolic BP, both central (r = −0.48, p = 0.04) and brachial (r = 0.47, p = 0.04,) and BMI (r = −0.46, p = 0.04). Triglycerides moderately correlate with weight (r = 0.47, p = 0.04) and BMI (r = 0.48, p = 0.03).
There were no consistent correlations observed between BP, arterial stiffness parameters, and thyroid function markers except for the FT3/FT4 ratio, which correlates with heart rate (r = −0.05, p = 0.03). Moreover, the FT3/FT4 ratio consistently correlates negatively with weight (r = −0.58, p = 0.01), BMI (r = −0.59, p = 0.009), and total FM% (r = −0.63, p < 0.01), and IMAT (r = −0.68, p <0.01) and positively with lean mass ratio (r = 0.61, p = 0.009) (Table 5).
Minimal, non-significant influence of TSH is reported on BP measurements (as described by Liu D and colleagues [17]: heart rate and body composition parameters. FT3 and FT4 levels demonstrate weak to negligible correlations with the variables measured in the study, suggesting a limited influence on blood pressure regulation and body composition. Table 5.
We recognized the limitations posed by the small sample size and emphasize the need for caution in interpreting these findings. We confirmed our results using both the Mann–Whitney U test and Spearman’s correlation.

4. Discussion

The data presented offer a compelling foundation for investigating the correlations between body composition and BP, highlighting the importance of considering body composition as a factor influencing BP. Despite the limited sample size of our population, the observed correlations reveal weak, yet significant relationships between specific anthropometric measures and BP. These preliminary findings emphasize the necessity for further research with a larger population, to explore these relationships in greater depth. Moreover, the results suggest that body composition could serve as a valuable marker for identifying individuals at risk of hypertension or other BP-related disorders, especially in post-menopausal women. Integrating measurements of body composition with routine BP assessments may enhance our understanding of the pathophysiology underlying cardiovascular diseases and facilitate the development of more personalized preventive and therapeutic strategies.
The findings of our study reveal pronounced differences in physiological parameters between the MWGG and MWMG. Notably a significant increase in AI@75 was observed in the MWGG compared to the MWMG, thus suggesting a condition of increased arterial stiffness and potentially elevated cardiovascular risk among women experiencing menopausal weight gain. Previous studies focusing on arterial stiffness in the context of obesity have rarely included assessments of peripheral wave reflection, such as AI@75, thus highlighting an emerging interest in the role of these parameters in evaluating arterial health in obese individuals [18]. While PWV relies on aortic wall stiffness and lumen diameter, AI@75-gauge peripheral wave reflection delineates central pressure wave characteristics within the aorta. Specifically, AI@75 denotes the proportion of central pulse pressure attributable to the late systolic pressure increase resulting from the convergence of forward and reflected pressure waves [19].
Our findings indicate that MWGG is strongly correlated with increased adiposity, as evidenced by higher BMI, total fat mass, and percentage of total fat mass evaluated with DEXA. These results align with previous research linking menopausal transition with alterations in body composition, marked by an increase in adiposity [20]. Interestingly, the MWGG was also associated with a reduced lean–to–fat mass ratio, suggesting a shift towards less favorable body composition characterized by decreased muscle mass relative to fat mass even if we did not observe significant differences in the ASMI. While menopausal weight gain is associated with changes in overall adiposity and metabolic parameters, it may not necessarily affect muscle mass distribution in this cohort significantly.
Furthermore, our study highlights significant metabolic changes associated with the MWGG, including higher levels of insulinemia, LDL-C, triglycerides, and unfavorable lipid ratios such as Tyg Index, Chol Tot/HDL, LDL/HDL, and TG/HDL, coupled with lower levels of HDL-C. These findings confirm a dysregulation in lipid metabolism and insulin sensitivity among women experiencing menopausal weight gain, a phenomenon extensively documented in the literature [21,22] that may contribute to increased cardiovascular risk in this population. This emphasizes the necessity for targeted prevention efforts during this vulnerable phase of women’s lives (menopause transition), when a close monitoring is important to prevent these sequelae
Thyroid hormones play a crucial role in regulating metabolism, and alterations in thyroid function can have significant metabolic consequences, including changes in energy expenditure and lipid metabolism. The significative decrease in FT3 and thyroid hormone conversion and metabolic activity (FT3/FT4 ratio) in the MWGG, suggests a reduced peripheral conversion of T4 to the more metabolically active T3 hormone [23,24]. This may indicate impaired thyroid hormone metabolism, potentially contributing to the metabolic disturbances observed with weight gain during menopause and confirming our initial hypothesis, as well as increasing cardiovascular risk (low FT3/FT4 ratio) [23].
Investigating the correlations between BP and body composition, WHR, and VAT evaluation emerge as the parameters most strongly correlated with BP characteristics. This encourages the inclusion of at least WHR as a vital control parameter for BP monitoring. Additionally, the AI@75 not only showed an association with FBP, consistent with recent findings by Melo and colleagues [25], but also established itself as a significant link between anthropometric measures such as BMI and weight, and the assessment of fat mass using DEXA.
On the other hand, according to our data, PWA correlates with WHR and the HOMA index, emphasizing the importance of focusing on abdominal circumference, metabolic syndrome, insulin resistance, and arterial stiffness [26,27]. Therefore, these laboratory and anthropometric parameters could also serve as indirect markers of initial vascular damage.
Moreover, from the DEXA assessment, we observed a strong positive correlation between Ai@75 and IMAT, which indicates the amount of fat accumulated between muscle fibers or in muscle cells. These results are in line with Therkelsen and colleagues [28], who observed that intramuscular fat accumulation is associated with metabolic risk factors, and particularly in women with metabolic syndrome, in which the most frequent component is the increase of BP [29]. Our cohort reports a significant difference in IMAT, with a strong increase in the MWGG, which reports significative metabolic changes, compared with the MWMG.
Our results illuminate the multifaceted nature of the relationship between body composition, metabolic markers, and cardiovascular risk factors with BP. They underscore the importance of considering various metabolic and anthropometric parameters in assessing cardiovascular risk and suggest that alterations in these accessible parameters may underlie relevant cardiometabolic changes.
Once again, the HOMA index and cardiovascular risk indices, particularly the TyG index, become predictors of vascular remodeling.
The data underscore the intricate interplay among metabolic markers, lipid profiles, body composition, and blood pressure regulation. They emphasize the cruciality of considering multiple physiological factors in cardiovascular risk assessment and the development of tailored interventions. Such interventions could include supporting thyroid function and promoting a healthy diet, especially for menopausal women at heightened risk of hypertension and metabolic disorders.
From our data, significant correlations emerge between HDL and systolic blood pressure, as well as between BMI and Total Fat Mass and Lean/Fat Mass. These correlations underline the importance of interventions that encourage proper HDL intake in the lifestyle of menopausal women.
Furthermore, the findings reveal a complex relationship between thyroid function markers, heart rate, body composition, and BP regulation. During clinical evaluations, special attention should be paid to heart palpitations, commonly reported by menopausal women and part of a range of symptoms that significantly affect their quality of life.

Potential Limitations

Our study is constrained by several factors that may limit the generalizability and robustness of our findings. Indeed, one of the main limitations of our study is the small sample size and the heterogeneity of the study population. We opted for a smaller sample size because even within this limited cohort, we observed significant differences. We plan to confirm our findings in a larger cohort of patients in the future. Additionally, we did not extract data from a broader database, which could have provided a much larger sample size; instead, we observed the data in a non-selected population of consecutively enrolled patients, making the sample entirely random. We intend to validate our findings in a larger population, using both prospective and retrospective approaches.
Moreover, our study included limited thyroid function tests that were conducted without the inclusion of ultrasound parameters, which might have provided deeper insights into thyroid health and its correlation with metabolic factors. Additionally, we did not assess the plasma concentrations of the proteins responsible for transporting T3 and T4 in the bloodstream, such as thyroxine-binding globulin (TBG) and transthyretin.
Furthermore, our study captures only initial post-menopausal stages without considering detailed dietary habits, which are crucial for a comprehensive understanding of cardiometabolic health. This omission could skew the understanding of the interplay between diet, metabolism, and cardiovascular risk in this specific population.

5. Conclusions

In conclusion, our findings highlight the complex relationship between menopausal weight gain, body composition, and cardiometabolic health: the MWGG exhibited a higher BMI, along with greater total fat mass in kilograms and a higher percentage of total fat mass, compared to the MWMG. Notably, we also observed a significant difference in the amount of intramuscular adipose tissue between the two groups. Integrating measurements of body composition with routine BP assessments may enhance our understanding of the pathophysiology underlying cardiovascular diseases and facilitate the development of more personalized preventive and therapeutic strategies. This approach could foster increased awareness and encourage the adaptation of clinical practices aimed at identifying and managing patients at risk of cardiovascular diseases, thereby enhancing preventive healthcare measures for menopausal women.

Author Contributions

Conceptualization B.P. and L.D.R.; methodology, investigation, data curation B.P., G.T., G.N., E.B., P.G. and G.F.; writing, original draft preparation B.P. and L.D.R.; writing, review, and editing, B.P., G.T, R.C. and L.D.R. All authors have read and agreed to the published version of the manuscript.

Funding

This research was funded by the Italian Ministry of Health, Project T5-AN-08, n259, 3 February 2023.

Institutional Review Board Statement

The study was conducted in accordance with the Declaration of Helsinki, and approved by the Calabria Region Ethics committee (n. 97, 20 April 2023).

Informed Consent Statement

Informed consent for participation was obtained from all subjects involved in the study.

Data Availability Statement

The original contributions presented in the study are included in the article, further inquiries can be directed to the corresponding authors.

Acknowledgments

We express our sincere gratitude to all the authors who made pivotal contributions to this article.

Conflicts of Interest

The authors declare no conflicts of interest.

References

  1. Tarcin, O.; Abanonu, G.B.; Yazic, D.; Tarcin, O. Association of metabolic syndrome parameters with TT3 and FT3/FT4 ratio in obese Turkish population. Metab. Syndr. Relat. Disord. 2012, 10, 137–142. [Google Scholar] [CrossRef]
  2. Dupuit, M.; Rance, M.; Morel, C.; Bouillon, P.; Boscaro, A.; Martin, V.; Vazeille, E.; Barnich, N.; Chassaing, B.; Boisseau, N. Effect of Concurrent Training on Body Composition and Gut Microbiota in Postmenopausal Women with Overweight or Obesity. Med. Sci. Sports Exerc. 2022, 54, 517–529. [Google Scholar] [CrossRef] [PubMed]
  3. Abildgaard, J.; Pedersen, A.T.; Green, C.J.; Harder-Lauridsen, N.M.; Solomon, T.P.; Thomsen, C.; Juul, A.; Pedersen, M.; Pedersen, J.T.; Mortensen, O.H.; et al. Menopause is associated with decreased whole body fat oxidation during exercise. Am. J. Physiol. Endocrinol. Metab. 2013, 304, E1227–E1236. [Google Scholar] [CrossRef]
  4. Davis, S.R.; Castelo-Branco, C.; Chedraui, P.; Lumsden, M.A.; Nappi, R.E.; Shah, D.; Villaseca, P.; Writing Group of the International Menopause Society for World Menopause Day 2012. Understanding weight gain at menopause. Climacteric 2012, 15, 419–429. [Google Scholar] [CrossRef]
  5. Palmer, B.F.; Clegg, D.J. The sexual dimorphism of obesity. Mol. Cell Endocrinol. 2015, 402, 113–119. [Google Scholar] [CrossRef] [PubMed]
  6. Manrique-Acevedo, C.; Chinnakotla, B.; Padilla, J.; Martinez-Lemus, L.A.; Gozal, D. Obesity and cardiovascular disease in women. Int. J. Obes. 2020, 44, 1210–1226. [Google Scholar] [CrossRef] [PubMed]
  7. Du, F.M.; Kuang, H.Y.; Duan, B.H.; Liu, D.N.; Yu, X.Y. Effects of thyroid hormone and depression on common components of central obesity. J. Int. Med. Res. 2019, 47, 3040–3049. [Google Scholar] [CrossRef]
  8. Bakker, S.J.; ter Maaten, J.C.; Popp-Snijders, C.; Slaets, J.P.; Heine, R.J.; Gans, R.O. The relationship between thyrotropin and low density lipoprotein cholesterol is modified by insulin sensitivity in healthy euthyroid subjects. J. Clin. Endocrinol. Metab. 2001, 86, 1206–1211. [Google Scholar] [CrossRef]
  9. De Pergola, G.; Ciampolillo, A.; Paolotti, S.; Trerotoli, P.; Giorgino, R. Free triiodothyronine and thyroid stimulating hormone are directly associated with waist circumference, independently of insulin resistance, metabolic parameters and blood pressure in overweight and obese women. Clin. Endocrinol. 2007, 67, 265–269. [Google Scholar] [CrossRef]
  10. Yang, Q.; Wan, Y.H.; Hu, S.; Cao, Y.H. Associations between the levels of thyroid hormones and abdominal obesity in euthyroid post-menopausal women. Endokrynol. Pol. 2020, 71, 299–305. [Google Scholar] [CrossRef]
  11. Vogel, B.; Acevedo, M.; Appelman, Y.; Bairey Merz, C.N.; Chieffo, A.; Figtree, G.A.; Guerrero, M.; Kunadian, V.; Lam, C.S.P.; Maas, A.H.E.M.; et al. The Lancet women and cardiovascular disease Commission: Reducing the global burden by 2030. Lancet 2021, 397, 2385–2438. [Google Scholar] [CrossRef] [PubMed]
  12. World Health Organization. Obesity: Preventing and Managing the Global Epidemic. Report of a WHO Consultation; World Health Organization: Geneva, Switzerland, 2000; Volume 252, Available online: https://iris.who.int/handle/10665/42330 (accessed on 17 May 2024).
  13. Yusuf, S.; Hawken, S.; Ôunpuu, S.; Bautista, L.; Franzosi, M.G.; Commerford, P.; Lang, C.C.; Rumboldt, Z.; Onen, C.L.; Lisheng, L.; et al. Obesity and the Risk of Myocardial Infarction in 27,000 Participants from 52 Countries: A Case-Control Study. Lancet 2005, 366, 1640–1649. [Google Scholar] [CrossRef]
  14. Tocci, G.; Biondi-Zoccai, G.; Forte, M.; Gallo, G.; Nardoianni, G.; Fiori, E.; D‘Ambrosio, L.; Di Pietro, R.; Stefanini, G.; Cannata, F.; et al. Effects of two-month treatment with a mixture of natural activators of autophagy on oxidative stress and arterial stiffness in patients with essential hypertension: A pilot study. Nutr. Metab. Cardiovasc. Dis. 2023, 33, 2287–2293. [Google Scholar] [CrossRef]
  15. Mancia, G.; Kreutz, R.; Brunström, M.; Burnier, M.; Grassi, G.; Januszewicz, A.; Muiesan, M.L.; Tsioufis, K.; Agabiti-Rosei, E.; Algharably, E.A.E.; et al. 2023 ESH Guidelines for the management of arterial hypertension The Task Force for the management of arterial hypertension of the European Society of Hypertension: Endorsed by the International Society of Hypertension (ISH) and the European Renal Association (ERA). J. Hypertens. 2023, 41, 1874–2071. [Google Scholar] [PubMed]
  16. De Lorenzo, A.; Romano, L.; Di Renzo, L.; Di Lorenzo, N.; Cenname, G.; Gualtieri, P. Obesity: A Preventable, Treatable, but Relapsing Disease. Nutrition 2020, 71, 1106–1115. [Google Scholar] [CrossRef]
  17. Liu, D.; Jiang, F.; Shan, Z.; Wang, B.; Wang, J.; Lai, Y.; Chen, Y.; Li, M.; Liu, H.; Li, C.; et al. A cross-sectional survey of relationship between serum TSH level and blood pressure. J. Hum. Hypertens. 2010, 24, 1348. [Google Scholar] [CrossRef]
  18. Eikås, J.G.; Gerdts, E.; Halland, H.; Midtbø, H.; Cramariuc, D.; Kringeland, E. Arterial Stiffness in Overweight and Obesity: Association with Sex, Age, and Blood Pressure. High. Blood Press. Cardiovasc. Prev. 2023, 30, 435–443. [Google Scholar] [CrossRef] [PubMed]
  19. Kaess, B.M.; Rong, J.; Larson, M.G.; Hamburg, N.M.; Vita, J.A.; Levy, D.; Benjamin, E.J.; Vasan, R.S.; Mitchell, G.F. Aortic stiffness, blood pressure progression, and incident hypertension. JAMA 2012, 308, 875–881. [Google Scholar] [CrossRef]
  20. Kodoth, V.; Scaccia, S.; Aggarwal, B. Adverse Changes in Body Composition During the Menopausal Transition and Relation to Cardiovascular Risk: A Contemporary Review. Womens Health Rep. 2022, 3, 573–581. [Google Scholar] [CrossRef]
  21. Ko, S.H.; Jung, Y. Energy Metabolism Changes and Dysregulated Lipid Metabolism in Postmenopausal Women. Nutrients 2021, 13, 4556. [Google Scholar] [CrossRef]
  22. Ko, S.H.; Kim, H.S. Menopause-Associated Lipid Metabolic Disorders and Foods Beneficial for Postmenopausal Women. Nutrients 2020, 12, 202. [Google Scholar] [CrossRef]
  23. Lang, X.; Li, Y.; Zhang, D.; Zhang, Y.; Wu, N.; Zhang, Y. FT3/FT4 ratio is correlated with all-cause mortality, cardiovascular mortality, and cardiovascular disease risk: NHANES 2007-2012. Front. Endocrinol. 2022, 13, 964822. [Google Scholar] [CrossRef]
  24. Gao, S.; Ma, W.; Huang, S.; Lin, X.; Yu, M. Predictive Value of Free Triiodothyronine to Free Thyroxine Ratio in Euthyroid Patients With Myocardial Infarction With Nonobstructive Coronary Arteries. Front. Endocrinol. 2021, 12, 708216. [Google Scholar] [CrossRef] [PubMed]
  25. Melo E Silva, F.V.; Almonfrey, F.B.; Freitas, C.M.N.; Fonte, F.K.; Sepulvida, M.B.C.; Almada-Filho, C.M.; Cendoroglo, M.S.; Quadrado, E.B.; Amodeo, C.; Povoa, R.; et al. Association of Body Composition with Arterial Stiffness in Long-lived People. Arq. Bras. Cardiol. 2021, 117, 457–462. [Google Scholar] [PubMed]
  26. Cao, Q.; Fan, C.; Fei, Y.; Zhang, S.; Shen, T.; Meng, H. Waist-to-Height Ratio Is a Better Predictor of Hypertension in Women during Recovery from Anesthesia Compared to BMI, Waist-to-Hip Ratio, and Waist Circumference. Heliyon 2024, 10, e28297. [Google Scholar] [CrossRef] [PubMed]
  27. Ataee, Z.; Aghaee, A.; Sobhani, S.R.; Ebrahimi Miandehi, E.; Pirzadeh, P.; Alinezhad-Namaghi, M.; Eslami, S.; Sobhani, S. Evaluation of Arterial Stiffness and Its Relation to Innovative Anthropometric Indices in Persian Adults. Int. J. Hypertens. 2023, 2023, 2180923. [Google Scholar] [CrossRef]
  28. Therkelsen, K.E.; Pedley, A.; Speliotes, E.K.; Massaro, J.M.; Murabito, J.; Hoffmann, U.; Fox, C.S. Intramuscular fat and associations with metabolic risk factors in the Framingham Heart Study. Arter. Thromb. Vasc. Biol. 2013, 33, 863–870. [Google Scholar] [CrossRef]
  29. Katsimardou, A.; Imprialos, K.; Stavropoulos, K.; Sachinidis, A.; Doumas, M.; Athyros, V. Hypertension in Metabolic Syndrome: Novel Insights. Curr. Hypertens. Rev. 2020, 16, 12–18. [Google Scholar]
Figure 1. Blood Pressure Parameters. t-test performed for statistical analysis. Patients were categorized as MWGG for the menopausal weight gain group or MWMG for the menopausal weight maintenance group. Ai@75: Augmentation Index; PWA: Pulse wave velocity. t-test. p < 0.05 *.
Applsci 14 07772 g001
Figure 2. Body composition Parameters evaluated with DEXA (Total Fat % and Kg; Lean/fat mass ratio; VAT (g): visceral adipose tissue; IMAT (kg): intramuscular adipose tissue; ASMI: appendicular skeletal muscle mass index. t-test. p < 0.05 *; p < 0.01 **; p < 0.001 ***.
Applsci 14 07772 g002
Figure 3. Laboratory parameters. TOT-C: Total Cholesterol; High-density and low-density lipoprotein cholesterol, respectively, HDL-C; LDL-C; TSH: Thyroid Stimulating Hormone; FT3: Free Triiodothyronine; FT4:Free Thyroxine; HOMA Index: Homeostatic Model Assessment of Insulin Resistance; TyG Index: A newer marker assessing insulin resistance and metabolic syndrome; Chol Tot/HDL, LDL/HDL, TG/HDL Ratios: Ratios used to assess cardiovascular risk; AIP: Atherogenic Index of Plasma; A marker used to evaluate the risk of cardiovascular diseases; PRL: platelet-Lymphocyte ratio, NRL: neutrophil-lymphocyte ratios; GOT: Glutamate Oxaloacetate Transaminase; GPT: Glutamate Pyruvate Transaminase. t-test. p < 0.05 *; p < 0.01 **; p < 0.001 ***.
Applsci 14 07772 g003
Table 1. Characteristics of study participants. Patients were categorized as MWGG for the menopausal weight gain group or MWMG for the menopausal weight maintenance group.
MWGG (n = 12)Max-MinMWMG ( n = 8)Max-Min
Age (years)
(Mean ± SD, range)56.08 ± 4.9949–6554.85 ± 5.7546–60
Menarche years (years)
(Mean ± SD, range)11.58 ± 0.9910–1311.86 ± 1.0610–13
Menopause years (years)
(Mean ± SD, range)51.33 ± 3.2245–5650.00 ± 3.0644–54
Years since menopause (years)
(Mean ± SD, range)4.75 ± 2.892–94.86 ± 2.672–9
Menopausal Weight Gain (Kg)
(Mean ± SD, range)10.25 ± 2.922–132 ± 10–3
MWGG (n = 12) MWMG (n = 8)
Smoker (%)8.33 14.28
Diabetes (%)8.33 14.28
Dislipidemia (%)50.00 28.57
Anti-hypertensive Drugs (%)
08.33 14.28
1 50.00 71.44
225.00 14.28
3 or more16.67 0
Table 2. Blood pressure parameters correlations. Pearson’s coefficient correlation coefficient was used. Bold numbers represent significant correlations with p < 0.05. Ai@75: Augmentation Index; PWA: Pulse wave velocity; BMI: Body Mass Index; WHR: Waist–hip ratio; Total FM %: Total Fat Mass %; VAT: Visceral Adipose Tissue (g); IMAT: Intramuscular Adipose Tissue (Kg); ASMI: Appendicular Skeletal Muscle Mass Index. r = Pearson’s correlation coefficient; p = p value.
Brachial Systolic BPBrachial Diastolic BPHeart RateCentral
Systolic BP
Central
Diastolic BP
Ai@75PWA
rprprprprprprp
Weight (Kg)0.180.480.080.750.120.610.150.540.080.720.490.030.080.75
BMI (kg/m2)0.320.190.280.250.200.410.300.220.290.240.560.010.190.44
WHR0.550.010.470.04−0.010.900.470.040.480.040.170.490.470.04
Total FM (%)0.200.430.120.620.190.460.190.450.120.630.610.0080.130.61
Lean/Fat Mass−0.190.44−0.090.74−0.130.61−0.190.46−0.080.75−0.630.006−0.160.53
VAT (g)0.620.010.540.040.170.550.590.020.540.040.260.350.250.37
IMAT (Kg)0.210.440.090.710.210.410.190.480.100.710.670.0040.160.65
ASMI0.190.470.140.600.200.450.120.650.160.540.010.950.170.53
Table 3. Cardiovascular index correlations. Pearson’s coefficient correlation coefficient was used. Bold numbers represent significant correlations with p < 0.05. BP: Blood Pressure; B-Systolic blood pressure: Brachial Systolic Blood Pressure; B-Diastolic blood pressure: Brachial Diastolic Blood Pressure; C-Systolic blood pressure: Central Systolic Blood Pressure; C-Diastolic blood pressure: Central Diastolic Blood Pressure; HOMA Index: Homeostatic Model Assessment Index; TyG Index: Triglyceride-Glucose Index; TG/HDL: Triglycerides to High-Density Lipoprotein Ratio; Ctot/HDL: Total Cholesterol to High-Density Lipoprotein Ratio; LDL/HDL: Low-Density Lipoprotein to High-Density Lipoprotein Ratio; CV Risk: AIP: Atherogenic Index of Plasma; N/L Ratio: Neutrophil to Lymphocyte Ratio. r = Pearson’s correlation coefficient; p = p value.
CorrelationsHOMA IndexTyG IndexTG/hdl Ctot/hdlLDL/HDLCV Risk: AIPN/L Ratio
rprprprprprprp
B-Systolic BP (mmHg)0.650.0040.560.010.420.080.420.080.420.070.510.020.420.08
B-Diastolic BP (mmHg)0.420.070.420.080.370.120.360.160.320.180.370.120.410.09
HR (bpm)0.500.810.390.190.380.110.300.270.240.320.340.150.050.83
C-Systolic BP (mmHg)0.570.010.520.020.390.100.410.080.410.080.480.040.400.06
C-Diastolic BP (mmHg)0.430.070.430.070.370.120.360.130.330.170.370.120.400.09
AI@750.460.050.210.390.250.300.230.350.230.350.270.260.280.24
PWA0.490.040.180.470.080.730.150.560.180.450.180.450.540.01
Weight (Kg)0.250.290.410.070.410.080.270.250.230.330.380.100.280.23
BMI (Kg/m2)0.240.310.430.060.470.030.360.120.320.170.440.050.360.13
WHR0.500.030.370.110.220.360.110.640.080.730.210.380.220.35
Total FM (%)0.350.150.200.400.270.270.230.350.280.400.240.320.200.42
Lean/Fat Mass−0.350.14−0.160.51−0.280.26−0.260.29−0.240.32−0.240.32−0.170.48
VAT (g)0.590.010.440.080.310.240.200.440.160.540.280.280.470.06
IMAT (Kg)0.360.140.330.190.310.230.190.440.160.520.290.240.250.32
ASMI−0.160.510.320.190.210.400.100.670.100.700.240.350.190.46
Table 4. Lipid laboratory profile correlations. Pearson’s coefficient correlation coefficient was used. Bold numbers represent significant correlations with p < 0.05. r = Pearson’s correlation coefficient; p = p value.
CorrelationsGlicaemiaInsulinemia TotColesterol HDLLDLTG
rprprprprprp
B-Systolic BP (mmHg)0.460.050.500.030.190.45−0.480.040.360.140.400.09
B-Diastolic BP (mmHg)0.330.180.280.250.330.17−0.300.170.300.210.310.20
HR (bpm)0.060.800.090.700.420.07−0.250.310.340.160.410.08
C-Systolic BP (mmHg)0.440.060.420.080.160.52−0.470.040.320.190.350.16
C-Diastolic BP (mmHg)0.330.170.290.23−0.340.16−0.300.210.310.200.320.18
AI@750.140.560.560.010.100.67−0.350.150.090.700.200.40
PWA0.310.200.430.69−0.210.40−0.260.300.010.930.020.92
Weight (Kg)0.160.500.230.270.090.69−0.350.120.160.490.470.04
BMI (Kg/m2)0.170.470.230.340.100.67−0.460.040.220.360.480.03
WHR0.520.020.300.20−0.000.99−0.180.440.030.910.270.26
Total FM (%)0.320.180.310.19−0.120.62−0.400.090.070.750.180.46
Lean/Fat Mass−0.320.18−0.330.180.180.470.440.06−0.060.79−0.140.57
VAT (g)0.610.010.420.100.040.86−0.240.360.060.820.280.28
IMAT (Kg)0.350.170.320.19−0.050.85−0.370.140.110.650.310.21
ASMI−0.080.76−0.240.340.350.16−0.050.830.270.270.430.08
Table 5. Thyroid laboratory profile correlations. Pearson’s coefficient correlation coefficient was used. Bold numbers represent significant correlations with p < 0.05. TSH: Thyroid-Stimulating Hormone; FT3: Free Triiodothyronine; FT4: Free Thyroxine. r = Pearson’s correlation coefficient; p = p value.
CorrelationsTSHFT3FT4FT3/FT4 Ratio
rprprpRp
B-Systolic BP (mmHg)−0.070.770.110.650.090.720.130.62
B-Diastolic BP (mmHg)−0.110.67−0.040.880.210.40−0.010.96
HR (bpm)−0.210.41−0.380.120.370.14−0.500.03
C-Systolic BP (mmHg)−0.150.560.160.530.150.570.080.76
C-Diastolic BP (mmHg)−0.010.68−0.040.900.200.430.000.97
AI@750.220.39−0.270.28−0.070.80−0.150.54
PWA0.000.990.170.51−0.250.320.310.21
Weight (Kg)−0.160.52−0.410.080.300.22−0.580.01
BMI (Kg/m2)−0.400.09−0.430.070.330.17−0.590.009
WHR0.020.91−0.050.830.160.51−0.100.68
Total FM (%)−0.040.87−0.450.060.230.37−0.630.006
Lean/Fat Mass−0.030.900.390.11−0.230.360.610.009
VAT (g)−0.100.70−0.170.530.310.25−0.320.23
IMAT (Kg)−0.080.74−0.490.050.220.41−0.680.003
ASMI−0.620.01−0.000.99−0.050.860.170.53
Disclaimer/Publisher’s Note: The statements, opinions and data contained in all publications are solely those of the individual author(s) and contributor(s) and not of MDPI and/or the editor(s). MDPI and/or the editor(s) disclaim responsibility for any injury to people or property resulting from any ideas, methods, instructions or products referred to in the content.

