Abstract
Mass movements represent one of the most significant geohazards worldwide. The aim of this research is to highlight the potential and limitations of the European Ground Motion Service (EGMS) in detecting and monitoring mass movements at a local scale, especially in cases where data from in situ instrumental devices are unavailable. The study area corresponds to the La Miera landslide, located in Asturias (NW Spain). The multidisciplinary methodology applied involved the following steps: (1) downloading, acquiring, and analyzing Sentinel-1 A-DInSAR datasets (2015–2021) through the EGMS; (2) conducting a detailed geomorphological map and identifying evidence of movement; (3) classifying building damage by means of a damage inventory; (4) compiling and analyzing daily rainfall records with respect to deformation time series. Sentinel-1 A-DInSAR results revealed maximum LOS and East–West velocities of −11.6 and −7.9 mm/yr related to the landslide activity. Geomorphological mapping allowed for the updating of the landslide boundaries and its characterization as an active, complex movement. Registered building damage, which ranged from moderate to serious, was correlated with LOS and East–West velocities. The displacement recorded by the EGMS closely corresponds with rainfall periods, while periods of reduced rainfall coincide with the stabilization and recovery phases of displacement. This emphasizes a noteworthy quantitative correlation between rainfall events and EGMS data, evident both spatially and temporally. This work highlights that areas in which the EGMS data indicate deformation but lack in situ instrumental records, geomorphological techniques, and building damage surveys can provide spatial validation of the EGMS displacement, while rainfall records can provide temporal validation.
1. Introduction
Landslides are one of the most widespread geohazards in the world, producing a significant social and economic impact. During the period between 1998 and 2017, more than 4.8 million people were affected by landslide incidents in the world, and of these 18,414 were fatalities [1]. In Europe, about 312 fatalities were caused by landslides between 1998 and 2009 [2] and the direct costs of these landslides were estimated to reach €48 billion. Asturias (NW Spain) represents a landslide-prone area in Southwest Europe. In this region, approximately 62 slope instabilities are recorded per year [3,4], with an annual direct cost of 66 million euros [5]. According to [6,7], rainfall and heavy rains are the most important physical processes for triggering landslides in Asturias, followed by human activities and other factors.
A geomorphological approach is a well-established method in Earth Sciences for examining surface processes and landscape evolution. Geomorphology, particularly geomorphological mapping, is widely used in various applied fields such as natural hazard assessment, environmental planning, and civil engineering, among others [8,9,10].
Traditionally, assessing slope movement relied on geomorphological knowledge, utilizing evidence observed through field campaigns and aerial photography [6,11]. Establishing the features, size, and evidence of movement is crucial for ensuring accurate geomorphological mapping of mass movements at a local scale. Subsequently, instruments like inclinometers, GPS, and piezometers enabled precise and quantitative measurements, allowing continuous monitoring to determine slope stability [12]. Today, remote techniques and geophysical methods offer high-resolution surface and deep characterization of mass movements, marking significant progress in ground movement studies [13,14,15]. However, validating the results of these remote techniques is crucial, as they may sometimes exaggerate or underestimate slope displacement due to various factors like reflector deficits or atmospheric conditions [14]. Instrumental techniques serve as a reliable means to validate remote data, but their applicability may be limited by factors like accessibility or cost. In such cases, traditional geomorphological techniques, relying on fieldwork or photointerpretation and not requiring sophisticated equipment, become the only available means to validate remote data. On the other hand, analyzing weather and climate data to study landslide activity and evolution has proven to be a reliable and effective method [16,17]. The climate approach encompasses simple rainfall–landslide relationships, multi-factor empirical assessment methods, distributed physically based models, and real-time warning systems [18].
During the last two decades, instrumental techniques based on Synthetic Aperture Radar (SAR) have been successfully used for detecting, modeling, and monitoring landslides [19,20,21,22]. These techniques calculate the ground surface displacement that occurs between two different radar images, collected by sensors aboard a satellite [23]. A progressive comparison of the images during a certain period (usually years) allows a multi-temporal analysis of the displacement, from which time series of surface displacement and annual mean velocities can be obtained. Moreover, these advanced interferometric techniques allow the monitoring of large areas of land (about 10,000 km2) with millimeter accuracy [24,25,26,27]. Particularly, the SAR data provided by Sentinel-1A/B satellite constellations have shown a high applicability in the detection and monitoring of landslides due to: (1) high spatial resolution (14 × 4 m) and wavelength (5.5 cm); (2) temporal resolution (12 and 6 days); (3) free access to SAR data and current development of tools such as the Geohazard Exploitation Platform (GEP) [28,29,30] and the European Ground Motion Service (EGMS) [31,32,33].
The main studies involving the EGMS have been designed to: (1) describe certain deformation examples detected in Europe at a continental and regional scale and their validation [34,35]; (2) demonstrate the EGMS products, processing chain, and results based on point density, data quality, and ground motion validation [36,37]; (3) develop new tools and software to exploit the extensive EGMS products quickly and appropriately [33]; (4) compare the EGMS results with other European A-DInSAR services such as the German Ground Motion Service [38]. The most recent applications of the EGMS have been the analysis of active ground motion in mining areas [39,40], infrastructure monitoring [41], and landslide activity [42]. These works are based on the validation of the EGMS results and the monitoring accuracy using geological–geomorphological, hydrogeological, and geotechnical data, PS and DS datasets by using SARscape processing, and X-Band COSMO-SkyMed dataset. All these studies show the new EGMS is a powerful and novel tool. However, there is still an important lack of critical analysis to demonstrate the potential and limitations of the EGMS in the detection and monitoring of mass movements at the local scale.
The aim of this work is to demonstrate the potential and limitations of the EGMS to detect and monitor mass movements at a local scale, especially when data from in situ instrumental devices are not available. Therefore, the purpose of this research is to apply geomorphological and climate approaches to validate the EGMS in a landslide at a local scale. Particularly, it will contrast geomorphological evidence, building damage inventory and rainfall data with EGMS results from January 2015 to December 2021 around the La Miera landslide (Asturias, NW Spain).
2. Materials and Methods
2.1. Setting
La Miera landslide is in Asturias (NW Spain) to the East of the town of Pola de Lena (lat: 43.155212, long: −5.821555) (Figure 1). This landslide was previously mapped by the Spanish Geological Survey at 1:50,000 scale in 1973 [43,44] and by the Institute of Natural Resources and Land Planning (INDUROT) of the University of Oviedo at a scale of 1:25,000 between 1989 and 1998 [45]. As deduced from this previous work this landslide is characterized by an extent of 0.48 km2, a perimeter of 2.7 km, and an average slope of <30°. The minimum and maximum altitudes of the La Miera landslide are 300 and 465 m a.s.l and its main orientation is W-SW. The entire landslide is covered by forest, meadows, and pastures together with two settlements, La Miera and Los Campos, which are composed of dozens of houses and other buildings. To the North of the landslide boundary is El Valle village, with several dozen houses and buildings (Figure 1). The houses and buildings of these three villages were constructed between the end of the 19th century and the 2010s [46]. In addition, there is a paved road that connects Pola de Lena with these villages and two power lines that cross the landslide area from South to North (Figure 1).
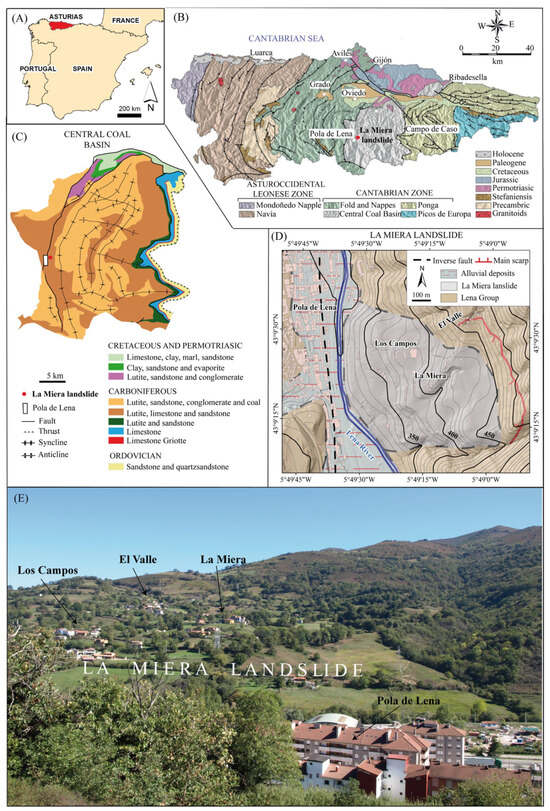
Figure 1.
(A) Location of Asturias in the North of Spain. (B) Location of the La Miera landslide in Asturias Region and regional geology. (C) Geological map of the Central Coal Basin and location of the La Miera landslide and the town of Pola de Lena. (D) Geological map of the La Miera landslide taken from [43,44,45]. (E) La Miera landslide views. Photo taken from Pola de Lena, showing the clear and inferred boundary of the landslide area.
From a geological point of view, the La Miera landslide is located in the Central Coal Basin (Cantabrian Zone) [47] (Figure 1A–C). The bedrock consists of Upper Carboniferous lutite, limestone, sandstone, and the scarce coal layers of the Lena Group [48]. The most important geological structure in the area is a reverse fault following a mainly N-S direction, conditioning the trend of the alluvial plain (Figure 1D). Landscape evolution in the area is conditioned by the fluvial activity of the Lena River, which runs at the foot of the landslide (Figure 1D), and gravitational mass movement processes with a variety of sizes: slides, flows, and rockfalls [4]. The Lena River, due to the high mobility of its channel (of the order of hundreds of meters), was channelized in 1955 so that at present, there is no channel migration. La Miera landslide is an ancient mass movement mainly composed of heterometric fragments of lutite, limestone, and sandstone embedded in a clayey matrix [43,44,45] (Figure 1D). The thickness of the landslide is unknown because no drilling or geophysical techniques have ever been applied to this mass movement. As mentioned above, previous studies were only focused on the landslide contour mapping. There are no previous investigations in which motion rates have been measured [43,44,45]. Currently, the landslide exhibits signs of geomorphological activity and evidence of building damage. The age proposed by the geological mapping conducted in 1973 is inaccurate, with an estimation ranging between the Pleistocene and the Holocene [43,44].
2.2. Sentinel-1 A-DInSAR by Means of European Ground Motion Service
The new EGMS service processes all Sentinel-1 data over most of Europe and it is implemented by the European Space Agency (ESA) [49]. The service provides, for registered users, visualization, data exploration, and preliminary analysis of the Sentinel-1 A-DInSAR products from 2015 to 2021, based on the SAR data provided by Sentinel-1A/B satellite constellations. This service identifies and processes sets of measurement points (MP): Persistent Scatterers [25] and Distributed Scatterers [26,50] by using all acquisitions, both ascending and descending orbits. According to [32], three EGMS products are available: level 2a, level 2b, and level 3. Level 2a corresponds to basic products of deformation velocity and deformation time series measured in both ascending and descending orbits and in the Line of Sight (LOS) direction at full Sentinel-1 resolution. The time series are associated with each MP. The velocity and displacement deformation are relative, being referred to as a stable virtual reference point chosen during the processing of the SAR Sentinel-1 image stacks on a frame-by-frame basis. Level 2b includes basic products calibrated by using a Global Navigation Satellite System (GNSS) reference network at full Sentinel-1 resolution. After the calibration procedure, LOS measurements are no longer relative to a local reference point and they are absolute values. Level 3 (ortho) corresponds to East–West component (horizontal motion) and vertical component (vertical ground motion) derived from level 2b products at 100 × 100 m pixel (Copernicus DEM resolution). The estimation process of horizontal and vertical motion consists of the decomposition of the Calibrated (L2b) product to provide two discrete geospatial layers containing purely vertical and purely East–West displacements resampled to a 100 m grid. The horizontal and vertical MP are defined from all ascending and descending MP within each cell. Then, they are separately averaged, with the resulting time series referenced to the center of the cell. All three product levels have an acceleration field. This attribute consists of a single given value (mm/yr2) for each detected point. However, we have observed that for the four datasets, the values of acceleration are not significant and are redundant for this study. Since there is only one value for each MP, this value cannot be correlated with the acceleration and recuperation intervals observed and studied in Section 3.4. All these data have been managed with a Geographical Information System (GIS) environment.
The theoretical algorithm basis can be found in the technical documentation on the EGMS website [51]. Four different processing chains contribute to the generation of the EGMS products: E-GEOS, TRE ALTAMIRA, NORCE, and GAF/DLR [50,51,52]. The main processing steps of these chains are as follows: (1) reference image selection, co-registration, and interferogram generation; (2) selection of MP candidates; (3) multi-interferogram phase unwrapping; (4) estimation of the atmospheric phase screen; (5) generation of displacement time series for each MP; (6) geocoding. Co-registration involves resampling all secondary images onto the grid of the primary image to ensure pixel-to-pixel alignment. To avoid phase artifacts between bursts, an azimuth co-registration accuracy better than 0.001 pixels is necessary [51,53]. Once all wrapped differential interferograms are ready, the EGMS processing chains identify a set of MP. The selection of MP candidates is based on amplitude and phase estimators. For amplitude, low values of the amplitude dispersion index (DA) help identify coherent scatterers within the SAR scene. The pixels with DA values lower than 0.25 are considered good MP [51]. For phase, the spatial coherence map of each differential interferogram is computed. Coherence maps are then averaged and those pixels exceeding a certain threshold (tipically above 0.7) are selected as MP [26,27,50]. During the multi-interferogram unwrapping step, two families of algorithms are used in the EGMS: network flow and iterative Lp-norm optimizations algorithms [54]. The atmospheric filtering differs across processing chains. They are based on the removal of polynomial functions and stratified components after phase unwrapping and kriging of the phase residuals of the identified primary network [51].
With respect to the interpretation of the negative or positive values of the MP, it depends on each dataset. In the case of the LOS MP, the sign indicates a movement towards the satellite if the value is positive; if the value is negative, the movement is away from the satellite. In the case of East–West component, negative values represent a westward movement while positive values represent eastward movements. Negative vertical motion can mean subsidence movement, while positive values can be associated with uplift phenomena.
In this research, four datasets from level 2b and level 3 were downloaded and exported to a GIS (Table 1): (1) 001 ascending track from 10 March 2015 to 27 December 2021 with 359 acquisitions and 052 descending track from 6 February 2015 to 31 December 2021 with 345 acquisitions, and (2) horizontal and vertical ground deformation from 5 January 2016 to 16 December 2021, both with 363 acquisitions.

Table 1.
Sentinel-1 A-DInSAR datasets were used in this study. Time period, number of acquisitions, and product code are shown.
2.3. Geomorphological Mapping
The geomorphological mapping approach of the landslide area involved photointerpretation and a comprehensive field survey. Detailed photointerpretation included identifying the landslide boundaries and geomorphological features such as lobe accumulation, main and secondary scarps, minor slope deposits, and movement evidence. This analysis was conducted using the available digital data in a GIS environment. The data, freely obtained from the Instituto Geográfico Nacional (IGN) website [55], included orthophotos from 1956, 2003, 2014, 2017, and 2021 with pixel resolutions of 0.25 and 0.5 m, and 2021 LiDAR data with a pixel resolution of 0.25 m. The field campaign, carried out during September 2023, was a critical stage for validating and refining the photointerpretation. During this campaign, indicators of movement (e.g., tension cracks, damage in roads), slope instability deposits, and the shape and boundaries of unstable areas were identified and mapped. Additionally, locations with active EGMS deformations were visited and studied in order to validate the EGMS results. In addition, a damage inventory map was carried out (see below). Thus, a detailed geomorphological map of the landslide at 1:5000 was made to illustrate the landslide features (see Section 3.2).
2.4. Damage Inventory Map
During the field survey, the building damage was described and inventoried according to the classification proposed by [56]. This author separates structural damage related to landslide activity and subsidence phenomena into seven categories: from 1-very slight to 7-total collapse. This classification was applied to all buildings in Los Campos, La Miera, and El Valle neighborhoods. The inventoried buildings allowed us to relate damage with Sentinel-1 A-DInSAR measurements. The results of damage inventory mapping are shown and described in Section 3.2.
2.5. Collection and Analysis of Climatic Data
The present research used climatic records from the Pola de Lena meteorological station (Ronzón, lat: 43.132706, long: −5.822275), which is 2.2 km from La Miera landslide and gathers daily data. This meteorological station was installed on 8 July 2009 and is managed by the AEMET (Agencia Estatal de Meteorología-Spanish Meteorological Agency) [57], monitoring temperature, precipitation, and wind data. The precipitation data were analyzed daily between January 2015 and December 2021. Also, daily rainfall records and the accumulated rainfall (l/m2) were statistically compared with 12- and 6-day deformation time series obtained from the Sentinel-1 A-DInSAR dataset. The main purpose was to establish the correlation between precipitation and observed displacement.
3. Results
3.1. Sentinel-1 A-DInSAR Measurements
Sentinel-1 A-DInSAR datasets showed varying degrees of ground displacement in the La Miera landslide (Figure 2). When comparing ground movement rates, active PS values were considered to be those above ±4.0 mm/year. This threshold was selected according to the standard deviation of LOS velocities. Firstly, with the ascending track, 27 MP were detected. They showed only stable MP, with LOS velocity (VLOS) rates ranging from −2.0 to 3.6 mm/year (Figure 2A). Stable MP were detected in the landslide area, in the town of Pola de Lena, and in El Valle village (Figure 2A). In the case of the descending track, a total of 148 MP were detected, with VLOS rates ranging from −9.7 to 1.2 mm/year (Figure 2B). The maximum VLOS velocity of −9.7 mm/year was detected in the La Miera neighborhood. All unstable MP (≤4.0 mm/year) were measured in buildings in Los Campos, La Miera, and El Valle village (Figure 2B). In El Valle village, a maximum VLOS of −11.6 mm/year was detected (Figure 2B). Pola de Lena town and the eastern boundary of the landslide were identified as stable areas (Figure 2B). As to horizontal and vertical datasets, 23 MP were measured, whose horizontal velocities ranged from −7.9 to −0.2 mm/year, while vertical velocity ranged from −5.3 to −1.0 mm/year (Figure 2C,D). A maximum horizontal displacement of −7.9 mm/year was measured in the Los Campos neighborhood and in El Valle village (Figure 2C). Some areas in Los Campos, La Miera, and El Valle were identified as unstable, with horizontal velocities higher than −4.0 mm/year (Figure 2C). These negative rates suggest a predominance of westward ground motion downslope of the landslide (Figure 2C). Although a maximum vertical velocity of −5.3 mm/year was detected in a building located in the north of the Los Campos neighborhood (Figure 2D), the rest of the vertical MP presented stable velocities (−4.0–4.0 mm/year) (Figure 2D).
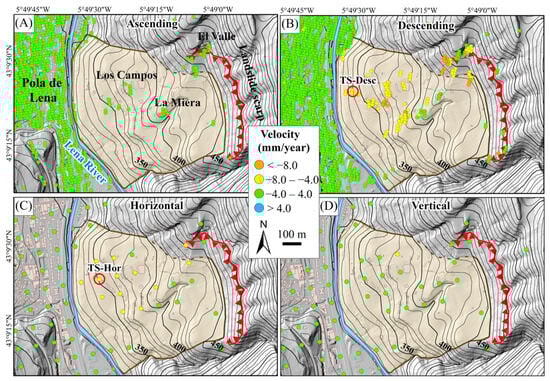
Figure 2.
Sentinel-1 A-DInSAR detected in the La Miera landslide. (A) Ascending LOS velocity detected at Sentinel-1 full resolution. (B) Descending LOS velocity measured at Sentinel-1 full resolution. (C) Horizontal velocity estimated at 100 m pixel size. (D) Vertical velocity is estimated with a pixel resolution of 100 m. Red circles show location of deformation time series (Figure 3).
Regarding the Deformation Time Series (TS) (Figure 3), these were only observed from descending (TS-Desc) and horizontal (TS-Hor) tracks (Figure 2B,C). Only TS-Desc and TS-Hor have been selected because the ascending and vertical data present a stable pattern with high noise, and they were not relevant to the analysis. In general, both TS present linear patterns of rising deformation from January 2015–2016 to December 2021 (Figure 3). In the case of TS-Desc (Figure 3A), the maximum accumulated displacement was −44.7 mm while the maximum accumulated displacement in the TS-Hor was −41.9 mm (Figure 3B). In the TS-Desc, a period of acceleration of displacement can be observed between January and August 2021 followed by a recuperation of deformation until December 2021 (Figure 3A). In the TS-Hor can be observed a higher fluctuation of displacement, with rising deformation periods followed by episodes of recuperation and stabilization of displacement (Figure 3B).
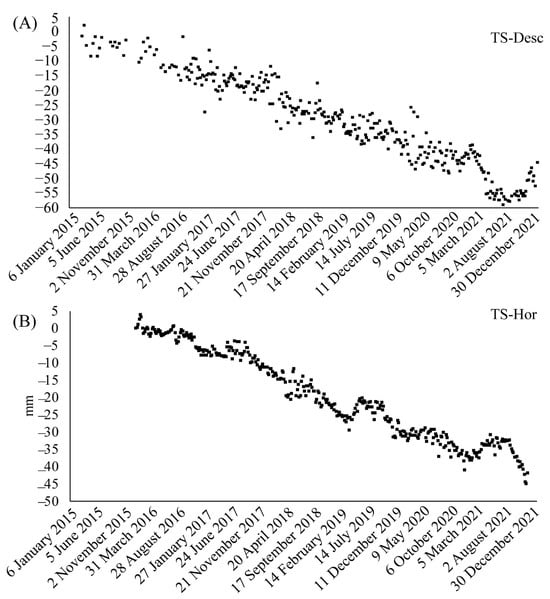
Figure 3.
Deformation time series (TS) observed in the La Miera landslide. (A) Time series from descending track (TS-Desc). (B) Time series measured in horizontal motion track (TS-Hor). See TS locations in Figure 2B,C.
3.2. Geomorphological Features and Sentinel-1 A-DInSAR
Figure 4 shows different geomorphological features mapped during photointerpretation and field survey. Also, it is accompanied by the building damage inventory and the descending VLOS and horizontal velocity detected. This geomorphological map updates the previous cartography carried out by the IGME and by the INDUROT [43,44,45] used as context in Figure 2. First, the landslide limits were modified, especially at the southernmost boundary (Figure 4). Secondly, different surficial deposits that remained unidentified were also identified and mapped. The mass movement presents a main scarp of 0.9 km, which crosses the village of El Valle in a W-E direction and subsequently, assumes an N-S direction. At the head, some creep movements and colluvium deposits, extending over 0.04 km2, were mapped. These can be found above the La Miera landslide and across El Valle village. In this village, a flow deposit with an area of 0.04 km2 was also mapped, where the descending VLOS detected ranged from −11.6 to −1.7 mm/year. The horizontal velocities observed in El Valle village ranged from −7.2 to −2.5 mm/year. Within the landslide area, three flow deposits with areas of 0.013, 0.05 km2, and 0.01 km2 were mapped, although ground motion could not be detected using the EGMS. They present creep phenomena, and they may be directly related to erosion of secondary scarps. Within the landslide sector, a total of seven secondary scarps were differentiated. Furthermore, four accumulation lobes of material were mapped. The neighborhood of Los Campos is located on three of these accumulation lobes, where VLOS of −9.7 mm/year was measured. The northernmost and southernmost sectors of the La Miera landslide are strongly eroded by the effects of runoff, generating very steep slopes and facilitating the development of slope instabilities of reduced size (flows).
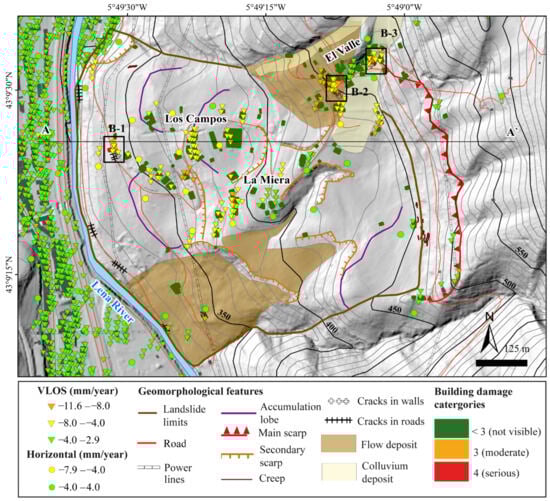
Figure 4.
La Miera landslide with the new geomorphological features of activity, building damage inventory [56] and the updated landslide limits. Digital terrain model with a 5 × 5 m pixel resolution. B-1, B-2, and B-3 squares are the buildings with observed damage. Line A-A’ indicates the position of the W-E cross-section of the landslide.
3.3. Buildings Damage and Sentinel-1 A-DInSAR
Most of the buildings in the La Miera landslide area showed damage below the level of category 3 because they presented no visible landslide ground damage. However, two buildings presented damage within category 3 (moderate), and only one building presented category 4 (serious) damage (Figure 4 and Figure 5A,B). These buildings are in the west of the landslide near the access road to Los Campos, La Miera, and El Valle neighborhoods (Figure 4, B-1). They were built in 1941. The damage consisted of vertical open cracks with a width of various centimeters (Figure 5A,B). Furthermore, in the building with category 4, the damage had already been repaired, but cracks of several meters in length and several centimeters in width had developed again (Figure 5B). In this same sector, some tension cracks several meters long and >10 mm in width were observed in the access road and in walls (Figure 4 and Figure 5C). Here, the descending VLOS detected displacement velocities of −7.1 to −7.9 mm/year and a horizontal velocity of −7.2 mm/year (westward direction).
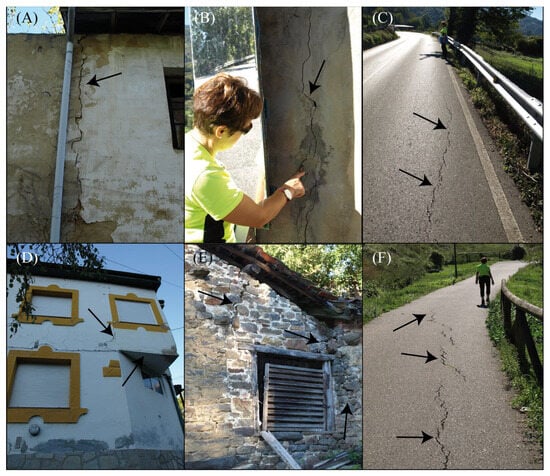
Figure 5.
Damage evidence was observed in buildings and in roads with categories 3 and 4 (black arrows). (A) Vertical crack with several centimeters width in a house located in Los Campos neighborhood (Category 3). (B) New cracks with some centimeters width in a repaired facade in Los Campos neighborhood (Category 4). (C) Tension cracks in the road near damaged houses in Los Campos neighborhood. (D) Millimeter cracks were observed in the facade of a house located in the El Valle village (Category 3). (E) Centimeter open cracks in an old building in El Valle village (Category 3). (F) Tension cracks were observed in a path located at the foot of the landslide.
In the village of El Valle, the damage to most of the buildings did not reach category 3 (Figure 4). Only four buildings presented category 3 (moderate) levels of damage (Figure 4, B-2, and B-3). They were built in the first half of the 20th century. They presented some open cracks with widths between 1 and 5 cm in facades and in walls (Figure 5D,E). The maximum VLOS detected in these buildings was −11.6 mm/year, while the maximum horizontal velocity detected was −7.2 mm/year (westward direction) (Figure 4).
3.4. Daily Rainfall Records vs. Sentinel-1 A-DInSAR
The analysis of the rainfall series (2015–2021) shows an average annual precipitation of 1255 l/m2. Maximum accumulated rainfall for all periods of study was 6065.8 l/m2. The daily rainfall records were compared with the deformation time series (Figure 6) and if the TS-Desc (Figure 6A) and the TS-Hor (Figure 6B) are observed in detail, it is possible to identify acceleration periods that can be explained by analyzing rainfall records.
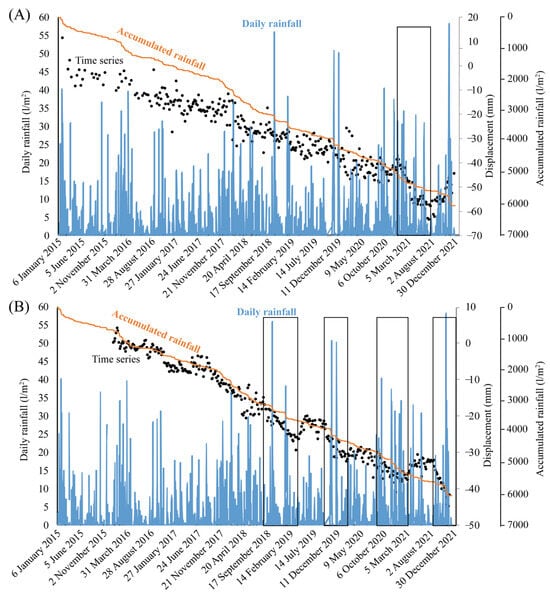
Figure 6.
Daily rainfall records vs deformation time series. (A) Comparison between daily rainfall and descending deformation time series (TS-Desc). (B) Comparison between daily rainfall and horizontal deformation time series (TS-Hor). The vertical bars indicate a coincidence between periods of deformation and heavy rainfall events.
In the case of the TS-Desc (Figure 6A and Table 2), the period between January 2015 and January 2021 coincided with the accumulated rainfall trend. The observed period of rising deformation identified between January and August 2021 (from −38.8 to −58.0 mm) matched with rainfall records between December 2020 and June 2021. These rainfall episodes recorded values from 30.8 to 40.4 l/m2 (Figure 6A and Table 2).
Table 2.
Correlation between deformation detected and rainfall episodes. It summarizes the Sentinel-1 A-DInSAR dataset, deformation period, accumulated displacement detected (mm), accumulated rainfall (l/m2), maximum rainfall registered (l/m2), and coefficient correlation (R2).
On the other hand, in the TS-Hor (Figure 6B and Table 2), four periods of rising deformation can be directly related to precipitation events. The first period of deformation was from October 2018 to April 2019 (displacement increased from −19.1 to −26.4 mm). Two rainfall episodes were identified in this period: In October 2018 (56.0 l/m2) and in January 2019 (38.2 l/m2). The second period of deformation was from November 2019 to January 2020 (recorded displacement increased from −21.5 to −31.2 mm). During this period, there were two rainy episodes: the first in November 2019 (50.8 l/m2) and the second in December 2019 (50.2 l/m2). The third episode of deformation was recorded between October 2020 and March 2021 (displacements rose from −30.0 to −38.1 mm). During this time, rainfall episodes with peaks from 24.0 to 40.4 l/m2 were recorded. Lastly, the fourth deformation period (September-December 2021), with displacements from −32.3 to −41.9 mm, coincided with rainy periods registered in November 2021 (58.2 l/m2) (Figure 6B and Table 2).
4. Discussion
In this section, results are analyzed and discussed in order to establish the potential and limitations of the EGMS to detect and monitor landslides at a local scale by comparing it with (1) spatial and qualitative data (geomorphological evidence and building damage inventory) and (2) quantitative temporal rainfall data.
4.1. La Miera Landslide Characterization
In relation to the characterization of the spatial distribution and temporal evolution of the La Miera landslide activity, the new EGMS has been successfully applied, since it has been possible to: (1) Monitor the landslide activity between 2015 and 2021; (2) Compare Sentinel-1 A-DInSAR measurements with a building damage inventory [56], detailed geomorphological mapping carried out at 1: 5000, and daily rainfall records. The obtained results are compatible with the building damage and movement evidence observed in the western area of the La Miera landslide and in the El Valle village (Figure 2, Figure 3, Figure 4 and Figure 5). In the case of the western area of La Miera landslide, the damaged buildings consist of three empty houses built in 1941 [46] with damage categories of 3 and 4 [56] (Figure 5A–C); in the rest of the landslide area, no evidence of movement or damage has been observed (categories <3), although mean velocities detected ranged from −9.7 to −4.0 mm/year (Figure 2 and Figure 4). This may be because the velocities detected in the Los Campos and in the La Miera neighborhoods are too low to produce visible evidence in modern dwellings that were built between the 1970s and 2010s [46]. This difference of damage in buildings could be due to difference in construction standards between the structures built in the 1940s and the 1970s-2010s. This landslide, which currently presents different active slope movement typologies, can be classified as an active complex and extremely slow (<16.0 mm/year) landslide, according to the classification of [58]. From the Sentinel-1 A-DInSAR measurements (maximum horizontal motion detected was −7.9 mm/year) and field evidence (Figure 2, Figure 4, Figure 5, and Figure 7), we can assert that this landslide has a predominantly horizontal component, with a westerly direction and practically no vertical movement. This is consistent with the orientation of the landslide slope, mainly W-E. Moreover, the dip of bedrock layers (Lena Group), which reaches 70° dip (23), may condition the movement of the landslide (Figure 7). The ascending LOS velocity results do not show significant deformation values while descending LOS velocities present significant active MP. This is consistent with the main orientation of the slope with respect to the ascending and descending orbit geometries (Figure 2). Figure 7 shows a conceptual section from West to East of the La Miera landslide (position is shown in Figure 4), based on topographic, geological, and geomorphological criteria. Since there is no previous work that has defined the thickness of the landslide, the contact between the landslide mass and the bedrock is uncertain. A-DInSAR measurements are also shown. B1 is the location where damage to categories 3–4 was observed (Figure 7).
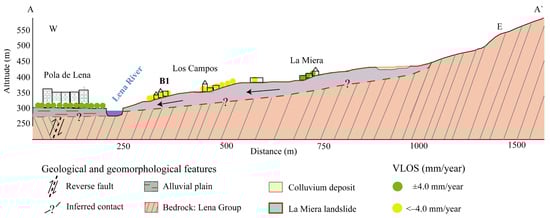
Figure 7.
Conceptual geological cross-section of the La Miera landslide from W to E (see Figure 4), showing the MP detected and the location of Pola de Lena town and Los Campos and La Miera neighborhood.
The geomorphological mapping at scale 1: 5000 carried out during this research has made it possible to validate and check the Sentinel-1 A-DInSAR measurements. Thus, Sentinel-1 A-DInSAR measurements, geomorphological evidence, and building damage reveal both active and stable areas. In the case of El Valle village, four buildings built before the 1950s [46] have presented a damage category of 3 [56] (Figure 5D,E). The damage observed is compatible with active ground motion, who’s maximum VLOS and horizontal velocity detected were −11.6 and −7.2 mm/year. Therefore, this would demonstrate a spatial correlation between geomorphological evidence, building damage, and EGMS data.
Previous studies demonstrate the influence of meteorological factors, particularly daily rainfall, on landslide activity evolution. Thus, rainfall causes acceleration once pore-water pressures have increased to sufficient levels in the landslide body and deceleration occurs when the pore-water pressures drop [59]; this is caused by groundwater level changes in the landslide body due to rainfall [60]. Therefore, landslides can slow down or stop moving during dry periods and reactivate or fail catastrophically during wet periods [61]. In Asturias, [4] pointed out that most of the landslide activity recorded (1232 events of 1455 between 1980 and 2015) was registered during periods of high monthly rainfall. Moreover, studies by [3,7,62] established meteorological patterns and rainfall episodes as the main landslide-triggering factors in Asturias, especially in the Central Coal Basin [6]. As shown in Figure 6, the displacement measured by the EGMS is directly related to rainfall periods (Table 2), while stabilization and recovery periods of displacement match with periods of scarce rainfall. Deformation periods analyzed between rainfall and displacements present correlation coefficients between 0.45 and 0.91 (Table 2). This demonstrates a quantitative spatial and temporal direct correlation between rainfall and the EGMS. Furthermore, the proximity of the meteorological station to the La Miera landslide (only about 1.5 km away), ensures sufficient accuracy to perform an adequate and reliable analysis of the effects of rainfall on the La Miera Landslide.
4.2. Potential and Limitations of the EGMS
The potential advantages and limitations of the EGMS for detecting and monitoring landslides at a local scale are also evaluated in this research. We can state that the new EGMS proves to be a very useful and fast tool to apply in big and complex slope movements at a local scale. Thus, the main potential advantage of this platform is that the algorithms implemented in the EGMS [50,63,64,65] make it possible to detect and process MP (PS+DS) in both urban and non-urban areas. Also, another potential advantage is the high-resolution pixel products of levels 2a and 2b [32], which is the Sentinel-1 full resolution; this resolution allows detailed analysis of mass movements at a local scale. In addition, this service is a fast and easy-to-use tool for expert and non-expert users to apply and export in a GIS, where the EGMS products [32] can be cross-referenced with different geospatial layers. We also have proved that the deformation time series from the EGMS can be compared with daily rainfall data, providing accurate information on the role of meteorological conditions as triggering factors of mass movements. Based on the relationship between precipitation and mass movements, rainfall records can be used to validate the deformation records revealed by the EGMS. The combined studies of these data series with the building damage inventory represent the basis for future research into landslide hazards and mass movement risk reduction [66,67].
The main limitation of the EGMS is the null degree of selection, control, and manipulation of the input parameters for Sentinel-1 A-DInSAR processing. This condition prevents the reprocessing of SAR data in the areas of interest and, therefore, the improvement of the Sentinel-1 A-DInSAR measurements. Moreover, in the case of level 2a, the products refer to a local reference point established during Sentinel-1 processing on a frame-by-frame basis [33,51]. As a consequence, ground motion measurements are only meaningful within a small subset of the entire product, so it is not possible to compare the deformation of adjacent zones belonging to different processing units of the same level [33,51]. Regarding the limitations of the EGMS observed in this study, large areas of the landslide could not be monitored because there was no MP. These areas corresponded to the northern and southern sectors and at the foot of the landslide (Figure 2 and Figure 4). Furthermore, in the mapped flow deposits (Figure 4) ground motion could not be quantified (Figure 4), although they showed signs of recent activity (creep phenomena, Figure 4). This is due to the total lack of suitable reflectors and the orientation of these deposits with respect to the satellite orbit.
Future research in the La Miera landslide (and therefore in other reactivated landslides), can be addressed to the application of other remote sensing techniques and other A-DInSAR techniques. The first includes the application of remote sensing techniques, such as unmanned aerial vehicle (UAV) photogrammetry [68]; this technique, based on the construction of high-resolution digital elevation models, can identify depletion or accumulation of material, being useful to evaluate geomorphological features and to interpret the failure mechanism and the evolutionary behavior of instability process [69,70]. The second (other A-DInSAR techniques) could be also applied to corroborate and validate the MP and the velocity rates detected using robust software such as StaMPS version 4.1b1 [71], SPINUA [72], or Ground-Based SAR (GB-SAR) [73]. Also, the application of advanced SAR processing techniques could improve the accuracy of the Sentinel-1 A-DInSAR results by mitigating range ambiguity [74]. An alternative method to overcome the lack of suitable reflectors is to install passive or active corner reflectors. This approach would provide a group of suitable PS to detect and monitor ground motion related to landslide activity [75,76,77]. Finally, another monitoring way for future research on La Miera and similar landslides could be the application of a global navigation satellite system [78] or conventional topographic techniques [79]. These techniques can be useful to determine point displacements in the surrounding and into the landslide area and, therefore, to improve the characterization of the activity of the La Miera landslide, with all its implications. Finally, this work shows that, in those areas where EGMS data indicate deformation, but no in situ instrumental recording is available, the geomorphological approach, together with rainfall records and damage inventory, can be a good alternative to confirm or reject the EGMS data. The geomorphological techniques and building damage inventory would provide spatial validation of the movement, while the precipitation record would provide temporal validation.
5. Conclusions
This work demonstrates the usefulness of the new European Ground Motion Service at the local scale for detecting and monitoring an ancient mass movement with current activity when no in situ instrumental data was available.
This research included multidisciplinary approaches (detailed geomorphological mapping, building damage inventory, and analysis of daily meteorological data) to assess the results of remote sensing techniques using EGMS from January 2015 to December 2021.
Sentinel-1 A-DInSAR measurements revealed LOS and East–West maximum velocities of −11.6, −7.9, and −7.2 mm/year. Detailed geomorphological mapping allowed the spatial characterization of an active complex landslide and other surface processes, such as creep and other flow processes evidence. The activity of the landslide is also evidenced by the building damage inventory (moderate and serious damage). The EGMS-measured displacement aligns closely with rainfall periods, with stabilization and recovery phases of displacement coinciding with periods of reduced rainfall. This highlights a notable quantitative correlation between rainfall events and EGMS data, both spatially and temporally.
The EGMS has proven to be an excellent free tool for rapidly studying landslides at a local scale and high resolution. However, it does have one notable limitation, which is the impossibility of modifying input data for Sentinel-1 A-DInSAR processing, which prevents reprocessing to improve the results.
Finally, this work shows that, in those areas where EGMS data indicate deformation, but no in situ instrumental recording is available, the geomorphological approach, together with rainfall records and damage inventory, can be a good alternative to confirm or reject the EGMS data. The geomorphological techniques and building damage inventory would provide spatial validation of the movement, while the rainfall records would provide temporal validation.
Author Contributions
Conceptualization, J.C.-M.; methodology, J.C.-M.; software, J.C.-M.; validation, J.C.-M., and M.J.D.-C.; formal analysis, J.C.-M.; investigation, J.C.-M.; resources, J.C.-M.; data curation, J.C.-M. and M.J.D.-C.; writing—original draft preparation, J.C.-M.; writing—review and editing, J.C.-M., M.J.D.-C., and M.J.-S.; visualization, J.C.-M., M.J.D.-C. and M.J.-S.; supervision, J.C.-M.; project administration, M.J.-S.; funding acquisition, M.J.-S. All authors have read and agreed to the published version of the manuscript.
Funding
This research was funded by the GEOCANTABRICAE project, co-funded by the Foundation for the Promotion of Applied Scientific Research and Technology (FICYT), by the Government of the Principality of Asturias, by the European Union, and by the European Regional Development Found (ERDF) [Ref. SV-PA-21-AYUD/2021/51766] and the “RETROCLIFF” project, call 2021 for Knowledge Generation Projects founded by the Spanish Ministry of Science and Innovation, the Spanish Research Agency (AEI), and the European Regional Development Found (ERDF) [Ref. MCIU-22-PID2021-122472NB-100].
Institutional Review Board Statement
Not applicable.
Informed Consent Statement
Not applicable.
Data Availability Statement
This publication has been prepared using European Union’s Copernicus Land Monitoring Service information; Data used were: https://doi.org/10.2909/0a94b5d4-b414-4f2b-a6be-eea73094a0f5; https://doi.org/10.2909/b3f4fd3d-c2d1-4ee9-b2ee-286196a5d261 and https://doi.org/10.2909/bef2507a-13cf-44c0-a809-0a1566f27631.
Acknowledgments
We thank four anonymous reviewers for their comments and suggestions, which have served to substantially improve this manuscript.
Conflicts of Interest
The authors declare no conflicts of interest.
References
- Wallemacq, P.; House, R.; McClean, D.; Below, R. Economic Losses, Poverty and Disasters: 1998–2017; United Nations Office for Disaster Risk Reduction: Geneva, Switzerland, 2018; pp. 6–13. [Google Scholar]
- European Environment Agency (EEA). Mapping the Impacts of Natural Hazards and Technological Accidents in Europe: An overview of the Last Decade; EEA Technical report No 13/2010; European Environment Agency (EEA): Copenhagen, Denmark, 2010; pp. 81–93.
- Domínguez-Cuesta, M.J.; Jiménez-Sánchez, M.; Rodríguez García, A. Press archives as temporal records of landslides in the North of Spain: Relationships between rainfall and instability slope events. Geomorphology 1999, 30, 125–132. [Google Scholar] [CrossRef]
- Valenzuela, P.; Domínguez-Cuesta, M.J.; Mora García, M.A.; Jiménez-Sánchez, M. A spatio-temporal landslide inventory for the NW of Spain: BAPA database. Geomorphology 2017, 293, 11–23. [Google Scholar] [CrossRef]
- González Moradas, M.R.; Lima de Montes, Y. Cartografía del riesgo a los deslizamientos en la zona central del Principado de Asturias. Mapping 2001, 73, 6–14. [Google Scholar]
- Domínguez-Cuesta, M.J.; Jiménez-Sánchez, M.; Berrezueta, E. Landslides in the Central Coalfield (Cantabrian Mountains, NW Spain): Geomorphological features, conditioning factors and methodological implications in susceptibility assessment. Geomorphology 2007, 89, 358–369. [Google Scholar] [CrossRef]
- Valenzuela, P.; Iglesias, M.; Domínguez-Cuesta, M.; Mora García, M. Meteorological Patterns Linked to Landslide Triggering in Asturias (NW Spain): A Preliminary Analysis. Geosciences 2018, 8, 18. [Google Scholar] [CrossRef]
- Rączkowska, Z.; Zwoliński, Z. Digital geomorphological map of Poland. Geogr. Pol. 2015, 88, 205–210. [Google Scholar] [CrossRef]
- Chandler, B.M.P.; Lovell, H.; Boston, C.M.; Lukas, S.; Barr, I.D.; Benediktsson, I.O.; Benn, D.I.; Clark, C.D.; Darvill, C.M.; Evans, D.J.A.; et al. Glacial geomorphological mapping: A review of approaches and frameworks for best practice. Earth Sci. Rev. 2018, 185, 806–846. [Google Scholar] [CrossRef]
- Keller, E.; Adamaitis, C.; Alessio, P.; Anderson, S.; Goto, E.; Gray, S.; Gurrola, L.; Morell, K. Applications in geomorphology. Geomorphology 2020, 366, 106729. [Google Scholar] [CrossRef]
- Bruschi, V.M.; Coratza, P.; Piacentini, D.; Soldati, M. Geomorphological features of the Rio della Rocca valley (northern Apennines, Italy). J. Maps 2012, 8, 445–452. [Google Scholar] [CrossRef]
- Mikkelsen, P.E. Field Instrumentation. In Landslides: Investigation and Mitigation; Turner, A.K., Schuster, R.L., Eds.; Transportation Research Board, National Academy of Sciences: Washington, DC, USA, 1996; pp. 278–316. [Google Scholar]
- Jaboyedoff, M.; Oppikofer, T.; Abellán, A.; Derron, M.H.; Loye, A.; Metzger, R.; Pedrazzini, A. Use of LIDAR in lanslide investigations: A review. Nat. Hazards 2012, 61, 5–28. [Google Scholar] [CrossRef]
- Mondini, A.C.; Guzzetti, F.; Chang, K.T.; Monserrat, O.; Martha, T.R.; Manconi, A. Landslide failures detection and mapping using Synthetic Aperture Radar: Past, present and future. Earth Sci. Rev. 2021, 216, 103574. [Google Scholar] [CrossRef]
- Jongmans, D.; Garambois, S. Geophysical investigation of landslides: A review. Bull. Soc. Géol. Fr. 2007, 178, 101–112. [Google Scholar] [CrossRef]
- Domínguez-Cuesta, M.J.; Quintana, L.; Valenzuela, P.; Cuervas-Mons, J.; Alonso, J.L.; García Cortés, S. Evolution of a human-induced mass movement under the influence of rainfall and soil moisture. Landslides 2021, 18, 3685–3693. [Google Scholar] [CrossRef]
- Smith, H.G.; Neverman, A.J.; Betts, H.; Spiekermann, R. The influence of spatial patterns in rainfall on shallow landslides. Geomorphology 2023, 437, 108795. [Google Scholar] [CrossRef]
- Sidle, R.C. Using Weather and Climate Information for Landslide Prevention and Mitigation. In Climate and Land Degradation. Environmental Science and Engineering; Sivakumar, M.V.K., Ndiang’ui, N., Eds.; Springer: Berlin, Germany, 2007; pp. 285–307. [Google Scholar] [CrossRef]
- Fruneau, B.; Achache, J.; Delacourt, C. Observation and modelling of the Saint-Etienne-de-Tinée landslide using SAR interferometry. Tectonophysics 1996, 265, 181–190. [Google Scholar] [CrossRef]
- Herrera, G.; Notti, D.; García-Davalillo, J.C.; Mora, O.; Cooksley, G.; Sánchez, M.; Arnaud, A.; Crosetto, M. Analysis with C- and X-band satellite SAR data of the Portalet landslide area. Landslides 2011, 8, 195–206. [Google Scholar] [CrossRef]
- Mateos, R.M.; Ezquerro, P.; Azañón, J.M.; Gelabert, B.; Herrera, G.; Fernández-Merodo, J.A.; Spizzichino, D.; Sarro, R.; García-Moreno, I.; Béjar-Pizarro, M. Coastal lateral spreading in the world heritage site of the Tramuntana Range (Majorca, Spain). The use of PSInSAR monitoring to identify vulnerability. Landslides 2018, 15, 797–809. [Google Scholar] [CrossRef]
- Pedretti, L.; Bordoni, M.; Vivaldi, V.; Figini, S.; Parnigoni, M.; Grossi, A.; Lanteri, L.; Tararbra, M.; Negro, N.; Meisina, C. InterpolatiON of InSAR Time series for the dEtection of ground deforMatiOn eVEnts (ONtheMOVE): Application to slow-moving landslides. Landslides 2023, 20, 1797–1813. [Google Scholar] [CrossRef]
- Rott, H. Advances in interferometric synthetic aperture radar (InSAR) in earth system science. Prog. Phys. Geogr. Earth Environ. 2009, 33, 769–791. [Google Scholar] [CrossRef]
- Ferretti, A.; Prati, C.; Rocca, F. Nonlinear subsidence rate estimation using permanent scatterers in differential SAR interferometry. IEEE Trans. Geosci. Remote Sens. 2000, 38, 2202–2212. [Google Scholar] [CrossRef]
- Ferretti, A.; Prati, C.; Rocca, F. Permanent scatterers in SAR interferometry. IEEE Trans. Geosci. Remote Sens. 2001, 39, 1528–1530. [Google Scholar] [CrossRef]
- Berardino, P.; Fornaro, G.; Lanari, R.; Sansosti, E. A new algorithm for monitoring localized deformation phenomena based on small baseline differential SAR interferograms. IEEE Trans. Geosci. Remote Sens. 2002, 40, 2375–2383. [Google Scholar] [CrossRef]
- Mora, O.; Mallorqui, J.J.; Broquetas, A. Linear and Nonlinear Terrain Deformation Maps From a Reduced Set of Interferometric SAR Images. IEEE Trans. Geosci. Remote Sens. 2003, 41, 2243–2253. [Google Scholar] [CrossRef]
- Galve, J.P.; Pérez-Peña, J.V.; Azañón, J.M.; Closson, D.; Caló, F.; Reyes-Carmona, C.; Jabaloy, A.; Ruano, P.; Mateos, R.M.; Notti, D.; et al. Evaluation of the SBAS InSAR service of the European space Agency’s Geohazard Exploitation Platform (GEP). Remote Sens. 2017, 9, 1291. [Google Scholar] [CrossRef]
- Cigna, F.; Tapete, D. Sentinel-1 Big Data Processing with P-SBAS InSAR in the Geohazards Exploitation Platform: An Experiment on Coastal Land Subsidence and Landslides in Italy. Remote Sens. 2021, 13, 885. [Google Scholar] [CrossRef]
- Cuervas-Mons, J.; Zêzere, J.L.; Domínguez-Cuesta, M.J.; Barra, A.; Reyes-Carmona, C.; Monserrat, O.; Oliveira, S.C.; Melo, R. Assessment of Urban Subsidence in the Lisbon Metropolitan Area (Central-West of Portugal) Applying Sentinel-1 SAR Dataset and Active Deformation Areas Procedure. Remote Sens. 2022, 14, 4084. [Google Scholar] [CrossRef]
- Crosetto, M.; Solari, L.; Balasis-Levinsen, J. The Evolution of Wide-Area DInSAR: From Regional and National Services to the European Ground Motion Service. Remote Sens. 2020, 12, 2043. [Google Scholar] [CrossRef]
- Crosetto, M.; Solari, L.; Balasis-Levinsen, J.; Bateson, L.; Casagli, N.; Frei, M.; Oyen, A.; Moldestad, D.A.; Mróz, M. Deformation monitoring at European Scale: The Copernicus Ground Motion Service. In Proceedings of the International Archives of the Photogrammetry, Remote Sensing and Spatial Information Science, XXIV ISPRS Congress 2021, Nice, France, 5–9 July 2021; Volume XLIII-B3-2021, pp. 141–146. [Google Scholar]
- Festa, D.; Soldato, M. Del EGMStream, a Desktop App for EGMS Data Downstream. Remote Sens. 2023, 15, 2581. [Google Scholar] [CrossRef]
- Crosetto, M.; Solari, L.; Barra, A.; Monserrat, O.; Cuevas-González, M.; Palamà, R.; Wassie, Y.; Shahbazi, S.; Mirmazloumi, S.M.; Crippa, B.; et al. Analysis of the products of the Copernicus Ground Motion. In Proceedings of the International Archives of the Photogrammetry, Remote Sensing and Spatial Information Science, XXIV ISPRS Congress 2022, Nice, France, 5–9 July 2022; Volume XLIII-B3-2022, pp. 257–262. [Google Scholar] [CrossRef]
- Costantini, M.; Minati, F.; Trillo, F.; Ferretti, A.; Passera, E.; Rucci, A.; Dehls, J.; Larsen, Y.; Marinkovic, P.; Eineder, M.; et al. EGMS: Europe-Wide Ground Motion Monitoring based on Full Resolution Insar Processing of All Sentinel-1 Acquisitions. In Proceedings of the IGARSS 2022–2022 IEEE International Geoscience and Remote Sensing Symposium, Kuala Lumpur, Malaysia, 17–22 July 2022; pp. 5093–5096. [Google Scholar] [CrossRef]
- Siegmund, R.; Brcic, R.; Kotzerke, P.; Eineder, M. The European Ground Motion Service EGMS–Processing Central Europe with First Results on Quality and Point Densities. In Proceedings of the IGARSS 2022–2022 IEEE International Geoscience and Remote Sensing Symposium, Kuala Lumpur, Malaysia, 17–22 July 2022; pp. 5105–5108. [Google Scholar] [CrossRef]
- Dehls, J.F.; Kenyeres, A.; Tóth, S.; Larsen, Y.; Marinkovic, P. Towards Geodetically Robust Datum Connection of Large-Scale InSar Results–EGMS Perspective. In Proceedings of the IGARSS 2022–2022 IEEE International Geoscience and Remote Sensing Symposium, Kuala Lumpur, Malaysia, 17–22 July 2022; pp. 5097–5100. [Google Scholar] [CrossRef]
- Even, M.; Westerhaus, M.; Kutterer, H. German and European Ground Motion Service: A Comparison. PFG J. Photogramm. Remote Sens. Geoinf. Sci. 2024, 92, 253–270. [Google Scholar] [CrossRef]
- Yang, C.H.; Stemmler, C.; Müterthies, A. Ground movement analysis in post-mining city using MTInSAR with help of European Ground Motion Service. In Proceedings of the ISPRS Annals of the Photogrammetry, Remote Sensing and Spatial Information Sciences 2023, Cairo, Egypt, 2–7 September 2023; Volume X-1/W1-2023, pp. 739–745. [Google Scholar] [CrossRef]
- Tzampoglou, P.; Loupasakis, C. Hydrogeological Hazards in Open Pit Coal Mines–Investigating Triggering Mechanisms by Validating the European Ground Motion Service Product with Ground Truth Data. Water 2023, 15, 1474. [Google Scholar] [CrossRef]
- Eskandari, R.; Scaioni, M. European Ground Motion Service for bridge monitoring: Temporal and thermal deformation cross-check using Cosmo-SkyMed InSAR. In Proceedings of the International Archives of the Photogrammetry, Remote Sensing and Spatial Information Science 2023, Cairo, Egypt, 2–7 September 2023; Volume XLVIII-1/W2-2023, pp. 1235–1241. [Google Scholar] [CrossRef]
- Torre, D.; Galve, J.P.; Reyes-Carmona, C.; Alfonso-Jorde, D.; Ballesteros, D.; Menichetti, M.; Piacentini, D.; Troiani, F.; Azañón, J.M. Geomorphological assessment as basic complement of InSAR analysis for landslide processes understanding. Landslides 2024, 21, 1273–1292. [Google Scholar] [CrossRef]
- Instituto Geológico y Minero de España. Mapa Geológico de España. Pola de Lena 78 (13-06); Instituto Geológico y Minero de España: Madrid, Spain, 1973. [Google Scholar]
- Instituto Geológico y Minero de España Información Geocientífica del IGME. Visor Cartográfico 2023. Available online: http://info.igme.es/visor/ (accessed on 15 June 2023).
- Instituto de Recursos Naturales y Ordenación del Territorio (INDUROT) Cartografía Temática Ambiental del Principado de Asturias. Formaciones Superficiales 1:25,000. Available online: https://ideas.asturias.es/catalogo-de-metadatos/?uuid=spaGOPActa1990 (accessed on 15 June 2023).
- Ministerio de Hacienda y Función Pública. Gobierno de España. Sede Electrónica del Catastro. Buscador de Inmuebles y Visor Cartográfico. Available online: https://www.sedecatastro.gob.es/ (accessed on 1 September 2023).
- Pérez-Estaún, A.; Bastida, F.; Alonso, J.L.; Marquínez, J.; Aller, J.; Álvarez-Marrón, J.; Marcos, A.; Pulgar, J.A. A Thin-skinned Tectonics Model for an Arcuate Fold and Thrust Belt: The Cantabrian Zone (Variscan Ibero-Armorican Arc). Tectonics 1988, 7, 517–537. [Google Scholar] [CrossRef]
- García-Loygorri, A.; Ortuño, G.; De Liñan, C.C.; Gervilla, M.; Greber, C.; Feys, R. El Carbonífero de la Cuenca Central Asturiana. Trab. Geol. 1971, 3, 101–150. [Google Scholar]
- Shahbazi, S.; Crosetto, M.; Barra, A. Ground Deformation Analysis Using Basic Products of the Copernicus Ground Motion Service. In Proceedings of the International Archives of the Photogrammetry, Remote Sensing and Spatial Information Sciences, XXIV ISPRS Congress 2022, Nice, France, 5–9 July 2022; Volume XLIII-B3-2022, pp. 349–354. [Google Scholar] [CrossRef]
- Ferretti, A.; Fumagalli, A.; Novali, F.; Prati, C.; Rocca, F.; Rucci, A. A New Algorithm for Processing Interferometric Data-Stacks: SqueeSAR. IEEE Trans. Geosci. Remote Sens. 2011, 49, 3460–3470. [Google Scholar] [CrossRef]
- Ferretti, A.; Passera, E.; Capes, R. End-to-end implementation and operation of the European Ground Motion Servuce (EGMS). Algorithm Theoretical Basis Document. EGMS-SC1, 2023. Available online: https://land.copernicus.eu/user-corner/technical-library/egms-algorithm-theoretical-basis-document (accessed on 10 April 2023).
- Hrysiewicz, A.; Khoshlahjeh Azar, M.; Holohan, E.P. EGMS-toolkit: A set of Python scripts for improved access to datasets from the European Ground Motion Service. Earth Sci. Inform. 2024. [Google Scholar] [CrossRef]
- Scheiber, R.; Moreira, A. Coregistration of interferometric SAR images using spectral diversity. IEEE Trans. Geosci. Remote Sens. 2000, 38, 2179–2191. [Google Scholar] [CrossRef]
- Costantini, M. A novel phase unwrapping method based on network programming. IEEE Trans. Geosci. Remote Sens. 1998, 36, 813–821. [Google Scholar] [CrossRef]
- Instituto Geográfico Nacional Centro de Descargas. Organismo Autónomo Centro Nacional de Información Geográfica. Available online: https://centrodedescargas.cnig.es/CentroDescargas/index.jsp# (accessed on 15 June 2023).
- Cooper, A.H. The classification, recording, databasing and use of information about building damage caused by subsidence and landslides. Q. J. Eng. Geol. Hydrogeol. 2008, 41, 409–424. [Google Scholar] [CrossRef]
- Agencia Estatal de Meteorología (AEMET) AEMET OpenData 2023. Available online: https://www.aemet.es/es/datos_abiertos/AEMET_OpenData (accessed on 1 September 2023).
- Cruden, D.; Varnes, D. Landslide Types and Processes. In Landslides: Investigation and Mitigation; Turner, A.K., Schuster, R.L., Eds.; Transportation Research Board, National Academy of Sciences: Washington, DC, USA, 1996; pp. 36–75. [Google Scholar]
- Finnegan, N.J.; Perkins, J.P.; Nereson, A.L.; Handwerger, A.L. Unsaturated Flow Processes and the Onset of Seasonal Deformation in Slow-Moving Landslides. J. Geophys. Res. Earth Surf. 2021, 126, e2020JF005758. [Google Scholar] [CrossRef]
- Troncone, A.; Pugliese, L.; Lamanna, G.; Conte, E. Prediction of rainfall-induced landslide movements in the presence of stabilizing piles. Eng. Geol. 2021, 288, 106143. [Google Scholar] [CrossRef]
- Handwerger, A.L.; Fielding, E.J.; Sangha, S.S.; Bekaert, D.P.S. Landslide Sensitivity and Response to Precipitation Changes in Wet and Dry Climates. Geophys. Res. Lett. 2022, 49, e2022GL099499. [Google Scholar] [CrossRef] [PubMed]
- Valenzuela, P.; Domínguez-Cuesta, M.J.; Mora García, M.A.; Jiménez-Sánchez, M. Rainfall thresholds for the triggering of landslides considering previous soil moisture conditions (Asturias, NW Spain). Landslides 2018, 15, 273–282. [Google Scholar] [CrossRef]
- Prats-Iraola, P.; Scheiber, R.; Marotti, L.; Wollstadt, S.; Reigber, A. TOPS Interferometry With TerraSAR-X. IEEE Trans. Geosci. Remote Sens. 2012, 50, 3179–3188. [Google Scholar] [CrossRef]
- Costantini, M.; Falco, S.; Malvarosa, F.; Minati, F.; Trillo, F.; Vecchioli, F. Persistent Scatterer Pair Interferometry: Approach and Application to COSMO-SkyMed SAR Data. IEEE J. Sel. Top. Appl. Earth Obs. Remote Sens. 2014, 7, 2869–2879. [Google Scholar] [CrossRef]
- Yagüe-Martínez, N.; Prats-Iraola, P.; Member, S.; González, F.R.; Brcic, R.; Shau, R.; Member, S.; Geudtner, D.; Eineder, M.; Member, S.; et al. Interferometric Processing of Sentinel-1 TOPS Data. IEEE Trans. Geosci. Remote Sens. 2016, 54, 2220–2234. [Google Scholar] [CrossRef]
- Barra, A.; Reyes-Carmona, C.; Herrera, G.; Galve, J.P.; Solari, L.; Mateos, R.M.; Azañón, J.M.; Béjar-Pizarro, M.; López-Vinielles, J.; Palamà, R.; et al. From satellite interferometry displacements to potential damage maps: A tool for risk reduction and urban planning. Remote Sens. Environ. 2022, 282, 113294. [Google Scholar] [CrossRef]
- Esposito, C.; Mastrantoni, G.; Marmoni, G.M.; Antonielli, B.; Caprari, P.; Pica, A.; Schilirò, L.; Mazzanti, P.; Bozzano, F. From theory to practice: Optimisation of available information for landslide hazard assessment in Rome relying on official, fragmented data sources. Landslides 2023, 20, 2055–2073. [Google Scholar] [CrossRef]
- Hussain, Y.; Schlögel, R.; Innocenti, A.; Hamza, O.; Iannucci, R.; Martino, S.; Havenith, H. Review on the Geophysical and UAV-Based Methods Applied to Landslides. Remote Sens. 2022, 14, 4564. [Google Scholar] [CrossRef]
- Pellicani, R.; Argentiero, I.; Manzari, P.; Spilotro, G.; Marzo, C.; Ermini, R.; Apollonio, C. UAV and Airborne LiDAR Data for Interpreting Kinematic Evolution of Landslide Movements: The Case Study of the Montescaglioso Landslide. Geosciences 2019, 9, 248. [Google Scholar] [CrossRef]
- Domínguez-Cuesta, M.J.; Rodríguez-Rodríguez, L.; López-Fernández, C.; Pando, L.; Cuervas-Mons, J.; Olona, J.; González-Pumariega, P.; Serrano, J.; Valenzuela, P.; Jiménez-Sánchez, M. Using Remote Sensing Methods to Study Active Geomorphologic Processes on Cantabrian Coastal Cliffs. Remote Sens. 2022, 14, 5139. [Google Scholar] [CrossRef]
- Hooper, A. A multi-temporal InSAR method incorporating both persistent scatterer and small baseline approaches. Geophys. Res. Lett. 2008, 35, L16302. Available online: https://homepages.see.leeds.ac.uk/~earahoo/stamps/ (accessed on 15 January 2024). [CrossRef]
- Bovenga, F.; Nutricato, R.; Refice, A.; Guerriero, L.; Chiaradia, M.T. SPINUA: A flexible processing chain for ERS/ENVISAT long term interferometry. In Proceedings of the 2004 Envisat & ERS Symposium, Salzburg, Austria, 6–10 September 2004; Available online: https://github.com/khalidtijani/dcs-cnr-issia-spinua (accessed on 15 January 2024).
- Pieraccini, M.; Miccinesi, L. Ground-Based Radar Interferometry: A Bibliographic Review without. Remote Sens. 2019, 11, 1029. [Google Scholar] [CrossRef]
- Chang, S.; Deng, Y.; Zhang, Y.; Zhao, Q.; Wang, R.; Zhang, K. An Advanced Scheme for Range Ambiguity Suppression of Spaceborne SAR Based on Blind Source Separation. IEEE Trans. Geosci. Remote Sens. 2022, 60, 5230112. [Google Scholar] [CrossRef]
- Crosetto, M.; Gili, J.A.; Monserrat, O.; Cuevas-González, M.; Corominas, J.; Serral, D. Interferometric SAR monitoring of the Vallcebre landslide (Spain) using corner reflectors. Nat. Hazard Earth Syst. Sci. 2013, 13, 923–933. [Google Scholar] [CrossRef]
- Luzi, G.; Espín-López, P.F.; Pérez Mira, F.; Monserrat, O.; Crosetto, M. A Low-Cost Active Reflector for Interferometric Monitoring Based on Sentinel-1 SAR Images. Sensors 2021, 21, 2008. [Google Scholar] [CrossRef] [PubMed]
- Xia, Z.; Motagh, M.; Li, T. Performance Analysis of Dihedral Corner Reflectors for Slope Movements: A Case Study from Aniangzhai Landslide in China. IEEE Geosci. Remote Sens. Lett. 2022, 19, 4515606. [Google Scholar] [CrossRef]
- Huang, G.; Du, S.; Wang, D. GNSS techniques for real-time monitoring of landslides: A review. Satell. Navig. 2023, 4, 5. [Google Scholar] [CrossRef]
- Domínguez-Cuesta, M.J.; González-Pumariega, P.; Valenzuela, P.; López-Fernández, C.; Rodríguez-Rodríguez, L.; Ballesteros, D.; Mora, M.; Meléndez, M.; Herrera, F.; Marigil, M.A.; et al. Understanding the retreat of the Jurassic Cantabrian coast (N Spain): Comprehensive monitoring and 4D evolution model of the Tazones Lighthouse landslide. Mar. Geol. 2022, 449, 106836. [Google Scholar] [CrossRef]


Disclaimer/Publisher’s Note: The statements, opinions and data contained in all publications are solely those of the individual author(s) and contributor(s) and not of MDPI and/or the editor(s). MDPI and/or the editor(s) disclaim responsibility for any injury to people or property resulting from any ideas, methods, instructions or products referred to in the content. |
© 2024 by the authors. Licensee MDPI, Basel, Switzerland. This article is an open access article distributed under the terms and conditions of the Creative Commons Attribution (CC BY) license (https://creativecommons.org/licenses/by/4.0/).