Abstract
The aim of the study was to design microcapsules with a core of blueberry fruit extracts (Vaccinium myrtillus L.) using the ionotropic gelation method and then assess the effect of the type of extracts used and the combination of polymers on the profile of phenolic compounds, their in vitro bioavailability, stability during storage, as well as their antioxidant characteristics and cytotoxic activity against colon cancer cells while assessing biocompatibility against normal colon epithelial cells. Encapsulation efficiency (EE), ranging from 8.79 to 74.55%, significantly depended on the extract used and the type of carrier. It was shown that the addition of pectin (Pect) and whey protein isolate (WPI) to alginate (Alg) improved the efficiency of the encapsulation process. For this version of microcapsules, the highest antioxidant activity, phenolic compound content and their stability during storage were also demonstrated. The estimated content of phenolic compounds ranged from 0.48 to 40.07 mg/g, and the dominant compound was cyanidin 3-O-glucoside. In turn, the highest bioavailability of these compounds and the highest cytotoxic activity against cancer cells were characterized by microcapsules with Alg and WPI. Nevertheless, good biocompatibility with normal colon epithelial cells was demonstrated for all versions of microcapsules. The obtained data indicate that the tested variants of microcapsules protect the bioactive compounds of blueberry fruit extracts, which translates into maintaining their health-promoting properties.
1. Introduction
According to 2023 estimates, colorectal cancer (CRC) is the third most commonly diagnosed cancer and the third leading cause of cancer deaths worldwide [1]. CRC also belongs to the group of cancers where there is a strong correlation between incidence and lifestyle, which includes high alcohol consumption, smoking, excess body weight and an inappropriate diet [2]. In the context of diet, a factor that concerns every human being, numerous reports have shown the enormous potential of natural products rich in phenolic compounds. The use of phytochemicals in the prevention and/or treatment of cancer has been a subject of discussion for centuries. Currently, anticancer activities have been demonstrated for over 3 thousand plant species and 30 plant-derived compounds have been qualified for preclinical studies [3,4]. Plant secondary metabolites have been shown to activate and/or inhibit multiple signaling pathways that lead to CRC cell death [5]. Therefore, the purification of plant products from phenolic compounds and the demonstration of their activity in in vitro and in vivo models could lead to the development of effective methods of controlling and treating CRC. However, one of the greatest limitations of using the properties of phenolic compounds is the low bioavailability and limited tissue distribution [3,6].
To overcome the above-mentioned challenges, the use of microcapsules has been widely discussed in the last decade. The formation of microspheres via ionotropic gelation allows for the binding of phytochemicals, which ensures improved stability, increased bioavailability, and actual bioefficacy at the target site. In a study conducted by Sun et al. [7], pH-sensitive alginate microcapsules were developed, showing the highest degree of release of 5-fluorouracil (anticancer drug) in the large intestine, which proved that they could be effectively used for the targeted delivery of anticancer drugs to the colon. Natural polymers, such as alginate (Alg), are among the most commonly used carriers due to their properties, such as low cost of acquisition, low toxicity, ease of physicochemical modification, and high biocompatibility and biodegradability. The greater ability of Alg to bind phytochemicals can be achieved by adding, among others, pectin (Pect) [8], whey protein isolate (WPI) [9], chitosan [10], carrageenan [11], cellulose [12], gum Arabic [13], zein [14] and psyllium mucus [15]. The selection of the encapsulating mixture, as well as the form of core preparation, may play a key role in the encapsulation process, the bioavailability of compounds, and encapsulation efficiency.
In our previous studies, we showed that among the analyzed phenolic fractions isolated from 10 different berries, the highest CRC-targeting potential was demonstrated by the extract from blueberry fruit (Vaccinium myrtillus L.) [16]. Previous studies have shown the ability of blueberry extracts to inhibit CRC cells through DNA fragmentation, which indicates the promotion of cell apoptosis [17,18]. In the cited works, the proven activity against CRC cells was attributed to the content of phenolic compounds. In general, anthocyanins dominate in blueberry fruits, which can constitute up to 95% of all polyphenols identified in the quantitative profile. The dominant compounds of this group include cyanidin 3-O-glucoside, cyanidin 3-O-arabinoside and peonidin 3-O-galactoside. Other groups of compounds identified in blueberry fruit extracts include the following: flavonols (such as quercetin 3-O-glucoside) and phenolic acids (chlorogenic acid) [16,19]. The content of phenolic compounds in extracts depends significantly on the method used to obtain them, which may translate into their anticancer properties.
So far, microcapsules with blueberry fruit extracts have been obtained mainly via spray and freeze-drying [20,21,22,23]. However, there are a negligible number of reports on the production of microcapsules via ionotropic gelation. Only Bittencout et al. [24], Chen et al. [25], and Wang et al. [12] obtained Alg, chitosan, and cellulose-based microcapsules from blueberry pomace and isolated anthocyanin fractions; however, they did not attempt to assess the effect of using different forms of extract and carriers on changing the phenolic profile and health-promoting properties, including the anticancer properties of the obtained microcapsules.
Therefore, the aim of this study was to design microcapsules with a core of crude and purified blueberry fruit extract via ionotropic gelation and then evaluate the effect of the type of extracts and polymer combinations used on the qualitative and quantitative profile of phenolic compounds, their in vitro bioavailability, and anticancer activity against colon cancer cells while assessing biocompatibility against normal colon epithelial cells. Alg, Pect, WPI, and mixtures thereof were used as the coating materials. In addition, the resulting microcapsules were evaluated for antioxidant activity, swelling capacity in gastric, intestinal and colonic fluid environments, and the stability of phenolic compounds after 14 days of storage. It is hypothesized that coating blueberry fruit extracts with natural polymers will ensure the increased stability of bioactive compounds during digestion, thus maintaining their high concentration and their cytotoxic capacity when targeting colorectal cancer.
2. Materials and Methods
2.1. Reagents
ABTS (2,20-azino-bis-(3-ethylbenzothiazoline-6-sulfonic acid), TPTZ (2,4,6-tris-2,4,6-tripyridyl-2-triazine), gallic acid, cyanidin chloride, Trolox (6-hydroxy-2,5,7,8-tetramethylchromane-2-carboxylic acid), Dulbecco’s Modified Eagle Medium-GlutaMAX-1 (DMEM), 0.25% trypsin-EDTA, fetal bovine serum, phosphate-buffered saline, antibiotics (100 U/mL penicillin and streptomycin), cell lines, α-amylase (EC 3.2.1.1), porcine pepsin (EC 3.4.23.1), porcine trypsin (EC 3.4.21.4), bovine chymotrypsin (EC 3.4.21.1), porcine pancreatic α-amylase (EC 3.2.1.1), porcine pancreatic lipase (EC 3.1.1.3) and LiChroprep RP-18 bed, 40–63 µm) were purchased from Sigma-Aldrich (Steinheim, Germany). Sodium carbonate, iron (III) chloride, calcium chloride, Folin–Ciocalteu reagent, sodium hydroxide, methanol, ethanol, acetonitrile, acetic acid (glacial), hydrochloric acid, formic acid, and polymers were purchased from Chempur (Piekary Śląskie, Poland). Chromatographic standards were obtained from Extrasynthese (Lyon, France). CellTiter 96® AQueous Non-Radioactive Cell Proliferation Assay was purchased from Promega (Madison, WI, USA).
2.2. Plant Materials and Preparation of Extract
Blueberry fruits (Vaccinium myrtillus L.) were purchased from a local supplier (Podkarpacie, Poland). The fruits were fully ripe and lacked mechanical and microbiological damage. The extracts were prepared according to our previous reports [26,27]. The crude extract (CE) was obtained via the double extraction of crushed blueberries in 70% ethanol (with 1% formic acid) assisted by ultrasound (30 min, 30 °C, Sonic 10, Polsonic, Warsaw, Poland). After centrifugation (10 min, 10,000× g; Centrifuge 5430, Eppendorf, Hamburg, Germany), the obtained supernatant was concentrated (R-215 Rotavapor System, Buchi, Flawil, Switzerland). The purified extract (PE) was obtained by passing the CE through an RP-18 bed (LiChroprep RP-18 bed, 40–63 µm). The column was previously conditioned with methanol and equilibrated with water. After loading the extracts, the purified fraction was washed with water and reconcentrated on an evaporator. CE and PE were freeze-dried (ALPHA 1–2 LD plus, Osterode, Germany) and stored under refrigeration until encapsulation.
2.3. Preparation of Microcapsules
Four types of polymerization solutions were prepared:
- -
- 2% Alg solution in water;
- -
- 2% Alg solution in water with 1% Pect addition;
- -
- 2% Alg solution in water with 1% WPI addition;
- -
- 2% Alg solution in water with 0.5% Pect addition and 0.5% WPI addition.
The obtained solutions were subjected to ultrasound for 45 min at 30 °C. In the next step, the polymer solutions were combined with 0.05% freeze-dried CE and PE, obtaining 8 versions. Additionally, the control samples consisting of polymer solutions alone were prepared (12 versions in total) (Table 1). All microcapsules were obtained via ionotropic gelation using an encapsulator (B-390, BUCHI, Flawil, Switzerland). The microencapsulation process was carried out under the following parameters: pressure, 500 bar; nozzle diameter, 450 µm; electrode voltage, 650 V; and frequency, 400 Hz. The obtained microcapsules were complexed for 30 min in 5% CaCl2. After this time, the microcapsules were rinsed with distilled water and lyophilized.

Table 1.
Composition of microencapsulated blueberry extracts and encapsulation efficiency.
2.4. Microcapsule Extraction Procedure
In total, 3 g of microcapsules was suspended in 10 mL of 70% ethanol acidified with 1% formic acid. The samples were homogenized (T18 digital Ultra-Turrax, IKA, Warsow, Poland) and then extracted with ultrasound at 30 °C for 30 min. After this time, the extracts were centrifuged, and the obtained supernatants were used for analyses.
2.5. Determination of Total Phenolic Content (TPC) and Anthocyanins Content (TAC)
TPC and TAC determinations were performed on microcapsule extracts obtained at point 2.4. The TPC was determined according to the method reported by Gao et al. [28], while TAC was determined according to Lee et al. [29]. The results were expressed in mg of gallic acid per 1 g of dry weight (mg GAE/g d.w.) and mg of cyanidin 3-glucoside per 1 g (mg C3G/g d.w.), respectively.
2.6. Determination of Antioxidant Activity
The antioxidant activity was determined using the extracts from the microcapsules obtained at point 2.4. The antioxidant activity was assessed by measuring ABTS•+ radical scavenging activity [30], DPPH radicals [31], and ferric ion reduction via the FRAP method [32]. The results were expressed as Trolox Equivalent per 1 g (µmol TE/g d.w.).
2.7. Encapsulation Efficiency
To determine the encapsulation efficiency (EE), the total polyphenol content (according to point 2.5) was determined using the extract obtained at point 2.4. EE was calculated according to the equation below, where W0 is the amount of TPC in the extract added during the encapsulation process, while W1 is the amount of TPC in the obtained microcapsules.
2.8. Determination of Polyphenols Profile by UPLC-Q-TOF-MS
Phenolic compounds were identified using an ultra-performance liquid chromatograph equipped with a photodiode array detector, mass spectrometer, and an electrospray ionization source (UPLC-PDA-TQD-EPI, Waters, Milford, MA, USA) [31,33]. An UPLC BEH C18 column (100 × 2.1 mm, 1.7 µm, Waters, Warsaw, Poland) was used for the separation of phenols, which was maintained at 50 °C at a flow rate of 0.35 mL/min with an injection volume of 5 µL. The mobile phase consisting of solvent A (water with 1% formic acid solution) and solvent B (40% acetonitrile with 1% formic acid solution) was used for the separation of anthocyanins, while for the remaining phenolic compounds, solvent A (water) and solvent B (40% acetonitrile) were used. The data obtained from the identification were calculated using MassLynx v.4.1 software (Waters, Milford, MA, USA). The compounds were identified based on retention time, molecular weight, UV-VIS spectrum, MS/MS ions, and data in the literature. The quantification of polyphenolic compounds was performed using different internal standards. The concentrations of polyphenolic compounds were calculated by preparing a calibration curve of mass concentration versus peak area. The slope of the regression line and the correlation coefficient (R2) values for each standard curve were obtained using MS Excel 2019 software. The limits of detection (LOD) and limits of quantification (LOQ) were calculated for each sample in triplicate. The calibration curves were obtained sequentially by plotting the concentration versus peak area. The mean slope (S) and the standard deviation of the intercept (δ) were calculated from the standard curve of triplicates. The LOD and LOQ were calculated using the following equations:
LOD = 3.3 × (δ/S)
LOQ = 10 × (δ/S)
The intra- and interday variations were determined using relative standard deviation (RSD) values, which were <3.5% for all the analyzed compounds. The results were expressed in mg/g.
2.9. Stability during Storage
The stability of the microcapsules during storage was tested by assessing the content of phenolic compounds in the microcapsules left at 4 °C in a dark room for 14 days. After this time, the microcapsules were extracted (according to point 2.4), and the changes in the phenolic compound profile were assessed (according to point 2.8).
2.10. Bioavailability Index
In vitro gastrointestinal digestion was performed according to the report conducted by Minekus et al. [34]. Lyophilized microcapsules (0.5 g) were combined with 0.5 mL of phosphate buffer (pH 7.4) and 1.0 mL of simulated saliva and shaken at 37 °C. Then, 6 M HCl was added to adjust to pH 3.0 and shaken again at 37 °C. After gastric digestion, the samples were subjected to intestinal digestion for 120 min by adding 1 M NaOH and adjusting to pH 7.0. The following enzymes were used during the entire digestion process: human salivary α-amylase (EC 3.2.1.1, 2000 U/mL), porcine pepsin (EC 3.4.23.1, 2000 U/mL), porcine trypsin (EC 3.4.21.4, 100 U/mL), bovine chymotrypsin (EC 3.4.21.1, 25 U/mL), porcine pancreatic α-amylase (EC 3.2.1.1, 200 U/mL), and porcine pancreatic lipase (EC 3.1.1.3, 2000 U/mL). Their activity after the entire process was stopped using MeOH (1:1 ratio) and centrifuged (10 min, 4 °C, 11,000× g), and the obtained supernatant was lyophilized, and then the content of phenolic compounds was determined according to point 2.8. The bioavailability index (BI) of the phenolic compounds was calculated according to the equation below, where CFD is the content of phenolic compounds after in vitro digestion, while CFA is the content of phenolic compounds before digestion.
2.11. Swelling Experiments
The immersion method was used to measure the swelling ability of the microcapsules [7]. A weighed portion of microcapsules was allowed to swell in phosphate buffers (0.1 M) at pH 1.2, 6.8, and 7.4, simulating the environment of gastric fluid (SGF), intestinal fluid (SIF), and colonic fluid (SCF), respectively. The samples were kept at 37 °C, and the mass of the microcapsules was measured at five time points (0.5 h, 1 h, 2 h, 5 h, and 8 h). The degree of swelling was calculated according to the following equation, where Ws is the mass of swollen microcapsules at time t, while Wd is the initial mass of the microcapsules.
2.12. Color Measurement
The color analysis of the control and blueberry extract-containing microcapsules was performed in the CIE L*a*b* space using an UltraScan Vis spectrophotometer (HunterLab, Reston, VA, USA). The parameters L* (sample lightness), a* (red/green color), and b* (yellow/blue color) were measured. The ∆E (total color difference) and chroma (C) were also calculated according to the following equations:
2.13. Microscopic Analysis
The size of the freeze-dried microcapsules was assessed using light microscopy (Oxion Inverso, Euromex, Mataró, Spain) at 20× magnification. Images were taken using a sCMEX CMEX-10 PRO microscope camera (Euromex, Mataró, Spain). The size of the microcapsules was recorded using ImageJ 1.54i software.
2.14. Biocompatibility with Colonic Epithelial Cells
Colonic epithelial cells (CDD841CoN cell line) were cultured in DMEM medium supplemented with 10% fetal bovine serum and 1% antibiotics (penicillin/streptomycin). Cells were seeded on a 96-well plate at a density of 8.0 × 10⁴ cells/well and allowed to adhere for 24 h. After this time, the cells were added to microcapsule medium, previously irradiated with UV lamp for 2 h and washed 3 times with phosphate buffer before adding to the medium. A cell viability test (MTS test) was performed after 24 h of incubation [35]. The results were expressed as cell viability (%).
2.15. Cytotoxic Effect on Cancer Cells
Colorectal cancer cells (Caco-2, Ht-29, LS180, Dld-1 cell lines) were cultured in DMEM supplemented with 10% fetal bovine serum and 1% antibiotics (penicillin/streptomycin). After passage 4, the cells were seeded in 96-well plates at 8.0 × 10⁴ cells/well and after 24 h, they were treated with extracts and microcapsules prepared in 30% ethanol (according to point 2.4). After 24 h of culture, the cells were washed with phosphate buffer, a fresh medium lacking phenol red was added, and the viability was assessed using the MTS assay [35]. The results were expressed as cell viability (%).
2.16. Statistical Analysis
Biocompatibility assays were performed in four replicates, cytotoxicity assays in nine replicates, size assay in ten replicates, and all other assays in three replicates. The results were expressed as mean and standard deviation (SD). Statistical analysis, including one-way Duncan’s test (p < 0.05), t-student’s test (* < 0.05; ** < 0.001), and Pearson’s correlation (p < 0.05) were performed in Statistica 13.3 software (StatSoft, Krakow, Poland).
3. Results
3.1. Encapsulation Efficiency
The encapsulation efficiency is shown in Table 1. The value of this parameter was dependent on both the type of core and the carrier material. The encapsulation efficiency for microcapsules with a CE core ranged from 8.79 to 17.48%, with a PE core from 29.95 to 74.55%. As can be seen, the Alg + Pect + WPI carrier mixture favored a high blueberry extract–polymer affinity. With higher compound stability and lower transition to the aqueous phase during the crosslinking process, the PE–core microcapsules were characterized. So far, Alg, in combination with proteins or polysaccharides, has been shown to be more effective in binding phenolic compounds than Alg alone [13]. In the case of the addition of polysaccharides and WPI, this phenomenon could be due to a reduction in porosity and the interaction of proteins with phenolic compounds of the extracts, inhibiting their leaching during crosslinking. Moreover, the interactions between the COO− Alg and NH3+ groups of WPI could affect the encapsulation efficiency. According to Sun et al. [7], ionic interactions between carboxyl and amino groups in microcapsules allow for the formation of polyelectrolyte complexes with a better ability to control the swelling profile and drug release than Alg or chitosan alone. The differences in encapsulation efficiency can also be attributed to structural interactions in the resulting mixtures, where the hydroxyl groups of phenolic compounds present in blueberry extracts favor the formation of hydrogen bonds with the free carboxyl end groups of the added polysaccharides [36]. In contrast, the lower performance of CE–core microcapsules may have been due to the interaction of the carriers with ballast substances present in the extract, which may have led to the blocking of the binding of phenolic compounds.
In the available literature, there is a wide divergence in the results for the encapsulation efficiency of gel microcapsules, which mainly depend on the type of carrier materials used and their concentration, the type of core, the dose and phenolic profile, the complexation time, and the concentration of the crosslinking mixture. For plant extracts encapsulated with Alg, with the addition of polysaccharide and/or protein sources, these values range from 8.5 to 93.9% [9,13,15], which is consistent with our results. On the other hand, Chen et al. [25] obtained an encapsulation efficiency for blueberry anthocyanins of 87.2% using the response surface area method while concluding that the concentration of CaCl2 and the dose of anthocyanins in the Alg mixture had the highest effect on this parameter. For comparison, the encapsulation efficiency of blueberry extracts microencapsulated via spray-drying and freeze-drying methods ranged from 70 to 98% [21,22,37]. In these methods, maltodextrin, gum Arabic, and WPI were used as wall materials. Nevertheless, the high discrepancy in the results shown indicates the need for further research to, among other things, determine the appropriate concentration of polymers, extracts, and the time of the complexation of the microcapsules in order to maximize the efficiency of this process.
3.2. Total Polyphenols, Anthocyanins Content and Antioxidant Activity
The total polyphenol content (TPC), anthocyanins (TAC), and the antioxidant activity of microcapsules are presented in Table 2. Microcapsules with a PE core were characterized by a higher content of TPC and TAC compared to microcapsules with a CE core, which was also reflected in the content of these two groups of compounds in the extracts themselves. The PE was obtained via solid phase extraction (SPE), which allows for the removal of ballast substances, such as proteins or fats, from the matrix. This method allows for an increase in the concentration of phenolic compounds in the mass of the obtained powders, which translates into an increase in their possible bioactive properties at a low dose of the preparation [16].
Table 2.
Total polyphenol content, anthocyanin, and antioxidant activity of control microcapsules and those enriched with blueberry fruit extracts.
Analyzing the type of carrier material, both for microcapsules with CE and PE, the best carrier binding TPC and TAC was the mixture of Alg + Pect + WPI. In turn, the remaining carriers in this respect can be ranked in the following order Alg + Pect > Alg + WPI > Alg. For microcapsules Alg + Pect + WPI with CE and PE core, the content of TPC and TAC was shown to be higher by 1.6 (TPC) and 1.9 (TAC) times and 1.7 (TPC) and 2.0 (TAC) times, respectively, compared to microcapsules with Alg alone.
The demonstrated relationships were also reflected in the antioxidant activity assessed using the ABTS, DPPH and FRAP methods, where also using these three methods, the highest activity was shown for microcapsules with a PE core and the Alg + Pect + WPI carrier mixture. This is also confirmed by the correlation analysis, where a significant relationship (p < 0.05) was shown between the TPC and TAC content and the antioxidant activity (r < 0.889). A high relationship was also found between the distinguished parameters and the encapsulation efficiency (r < 0.998), which indicates that the mechanisms described in point 3.1 also affected the content of these two groups of compounds, as well as the antioxidant activity of the obtained microcapsules. The same effect was observed by Stach et al. [11], who found that the antioxidant activity of chokeberry juice and extract microencapsulated with Alg with the addition of Pect, chitosan, and carrageenan was largely influenced by polyphenolic compounds, mainly anthocyanins, and the obtained results also correlated with the extraction efficiency. The cited manuscript also showed that the enrichment of Alg with polysaccharides significantly increased the antioxidant activity and polyphenol content in microcapsules, which was also proven in our studies. Moreover, Ćorković et al. [8] found that the antioxidant activity of microcapsules with a chokeberry extract core was more significantly influenced by the type of carrier used (Alg; Alg + Pect), showing higher values for the time of 30 than 90 min. Overall, the enrichment of the wall material with Pect and WPI allowed for the enhanced retention of TPC, TAC and antioxidant activity of the core materials via better binding of phenolic compounds to the carriers and a reduction in the effective diffusivity by the complex microstructure of the hydrogels.
3.3. Phenols Profile and Storage Stability
The quantitative and qualitative profiles of the phenolic compounds identified in microcapsules with CE cores, PE, and in the extracts themselves are presented in Table 3 and Table 4. The obtained chromatograms revealed eighteen phenolic compounds, including ten anthocyanins, seven flavonols, and one phenolic acid. All of these compounds were identified in CE and PE, while thirteen compounds (eight anthocyanins, four flavonols, and one phenolic acid) were detected in the microcapsules. The total content of phenolic compounds in CE was 27.92 mg/g and in PE it was 109.28 mg/g, while in microcapsules with a CE core, it ranged from 0.48 (A) to 1.27 (D) mg/g, while in microcapsules with a PE core, it ranged from 12.03 (E) to 40.07 (H) mg/g.
Table 3.
Qualitative profile of phenolic compounds identified in microcapsules and extracts of blueberry fruit.
Table 4.
Quantitative profile of phenolic compounds (mg/g) identified in microcapsules and extracts of blueberry fruit.
Anthocyanins are the main phenolic compounds present in berries, responsible for their red, blue, and purple colors. As a result of SPE extraction, a 3.9-fold higher concentration of anthocyanins was identified in PE than in CE. The identified profile was consistent with previous reports [16,19]. In the case of microcapsules, the anthocyanin content ranged from 0.46 (A) to 1.19 (D) mg/g with a CE core, while in microcapsules with a PE core, it ranged from 11.38 (E) to 39.08 (H) mg/g. As in the analyses conducted so far, the highest anthocyanin binding capacity was characteristic of the Alg + Pect + WPI mixture, while the remaining mixtures can be arranged in the order Alg + Pect > Alg + WPI > Alg. For both microcapsules with CE and PE cores, the dominant compounds were cyanidin derivatives, such as cyanidin 3-O-glucoside, cyanidin 3-O-arabinoside and cyanidin 3-O-galactoside. These compounds were also present in the highest concentrations in fruit extracts. Only two anthocyanins present in the extracts (petunidin 3-O-pentoside, peonidin 3-O-glucoside) were not bound in the microcapsules, but their amount was very low (<0.5 mg/g in CE; <2.0 mg/g in PE) compared to the remaining anthocyanins, which could result in their diffusion during the curing process.
Other phenolic compounds detected in microcapsules include phenolic acids and flavonols. Their amount in microcapsules with a CE core was at very low levels of <0.01 and <0.07 mg/g, respectively. In turn, in microcapsules with PE, it was from 0.14 (E) to 0.33 mg/g (H) and from 0.51 (E) to 0.74 mg/g (F), respectively. Therefore, flavonols present in blueberry extracts showed a higher affinity for the Alg + WPI carrier mixture. Chlorogenic acid was among the detected acids, while quercetin 3-O-glycoside was among the dominant flavonols. However, three flavonols present in the extracts were not detected in microcapsules.
The 14-day storage of microcapsules at 4 °C in a dark room did not affect the quality profile of the phenolic compounds but decreased their concentration (Table 5). For microcapsules with a CE core, the phenolic compounds were reduced compared to the sample before storage by 8.92 (D) to 18.33% (C), while for microcapsules with a PE core by 11.79 (H) to 23.98% (F). The recorded values were lower compared to the extracts themselves—for CE, a decrease of 21.92%, and for PE, a decrease of 20.52%. In both cases, the highest stability of phenolic compounds was ensured by the crosslinking mixture Alg + Pect + WPI, while the lowest was seen in the case of Alg + Pect. The same pattern was observed in the group of dominant compounds present in the microcapsules—anthocyanins. After 14 days of storage, a decrease in the concentration of anthocyanins in the CE microcapsules was observed, ranging from 6.50 (B) to 18.37% (C) and from 11.60 (H) to 24.29% (F) for the PE microcapsules.
Table 5.
Quantitative profile of phenolic compounds (mg/g) identified in microcapsules and extracts of blueberry fruit after 14 days of storage.
The effect of the encapsulation process and storage of the finished microcapsules on the change in the phenolic profile of blueberry extracts has not been assessed so far. The cationic flavylium form of anthocyanins, the main phenolic fraction of blueberry fruit, is very sensitive to oxygen, time, light, temperature, and pH, quickly degrading into colorless aldehydes and phenolic acids [38]. Hence, there is a need to improve the stability of these compounds, which can be achieved, among others, via microencapsulation. It was previously found that the main reason for the reduced concentration of anthocyanins in microcapsules is their hardening and diffusion into the CaCl2 solution [8]. At the same time, it was suggested that the enrichment of Alg in polysaccharides and protein may result in better preservation of anthocyanins, which was achieved in this work after adding Pect and WPI. The diffusion of anthocyanins into the curing solution is mainly related to the porosity of microcapsules. Therefore, additional carboxyl and amino groups in the polymerization mixture led to an increase in the gelation rate of the polymers and a reduction in the diffusion of anthocyanins into the crosslinking solution due to the decreased porosity after the formation of the hydrogel. The same relationship was demonstrated by Tan et al. [39] for the commercial anthocyanin fraction of blueberries encapsulated with WPI and various polysaccharides. After 35 days of storing the microcapsules under refrigerated conditions, the lowest decrease in anthocyanin concentration was noted for the WPI and Pect complex (26%). These results indicate that the enrichment of Alg with protein and additional polysaccharides is an effective method of reducing the losses of phenolic compounds, mainly anthocyanins, both during the encapsulation process and subsequent storage of the finished product. However, in the works in which microcapsules were developed by spray drying, where maltodextrin, inulin and gum Arabic were used as the encapsulating agents of blueberry extract, a decrease in anthocyanin content was demonstrated in the range from 4.45 to 13.77% after 30 days of storage at different temperatures [21]. The cited data indicate a higher efficiency of maintaining anthocyanin stability in microcapsules obtained by spray drying than ionotropic gelation. Hence, there is a need to improve this method in order to reduce the losses of bioactive compounds during the storage of the obtained microcapsules.
3.4. Bioavailability after Simulated In Vitro Digestion
To better understand the relationships between the types of extracts and carrier mixtures used, the microcapsules were subjected to simulated in vitro digestion, and the bioavailability index of phenolic compounds was assessed. The obtained results are summarized in Table 6 and Table S1. In general, bioavailability defines the amount of an active ingredient released in the gastrointestinal tract from the product matrix that can be absorbed or is bioavailable [40]. The total content of phenolic compounds after digestion ranged from 0.12 (A) to 0.52 (D) mg/g for microcapsules with a CE core and from 3.94 (E) to 21.17 (H) mg/g for microcapsules with a PE core. For all matrices, lower values of phenolic compounds were noted compared to the sample before digestion. The profile of individual compounds was presented in the same way. The bioavailability index of all phenols calculated on this basis ranged from 150.74 (A) to 485.75% (C) and from 289.15 (E) to 845.43% (C), respectively, for microcapsules with CE and PE cores. In both cases, significantly higher bioavailability of phenolic compounds was characteristic for microcapsules obtained from the Alg + WPI mixture, while the lowest was characteristic for microcapsules with Alg.
Table 6.
Bioavailability index (%) of phenolic compounds identified in microcapsules with blueberry fruit extracts.
Analyzing the types of extracts, a significantly higher bioavailability index of phenolic compounds was noted for microcapsules with a PE core. Considering the composition of microcapsules for which the highest bioavailability was demonstrated, i.e., those obtained from the Alg + WPI mixture—with a PE core—had twice the total bioavailability of phenolic compounds than with a CE core. Nevertheless, it is worth noting that statistically significant differences (p < 0.05) are visible mainly in the bioavailability of other phenolic compounds, i.e., phenolic acids and flavonols, while the bioavailability of anthocyanins is maintained at a comparable level for both extracts. For microcapsules with a CE core from the group of other phenols, bioavailability was demonstrated only for quercetin 3-O-galactoside (0.72–95.70%). According to the authors [41], flavonoids, mainly quercetin derivatives, undergo autoxidation and degradation in an alkaline environment, which may explain their lack of bioavailability from the microcapsule matrix.
Interestingly, anthocyanins were characterized by generally high bioavailability. The highest values were shown for malvidin 3-O-glucoside (104.58%, B) and peonidin 3-O-galactoside (102.03%, D). According to the literature, this group of compounds is particularly sensitive to enzyme activity and pH of digestive fluids [8], which makes their very low bioavailability a great challenge. Generally, an increase in bioavailability is observed for them in the gastric phase, which can be attributed to low pH, stabilizing anthocyanins and increasing their solubility. However, Martinović et al. [42] showed anthocyanin bioavailability of 31.0–123.2% for microencapsulated grape pomace Alg. Analyzing the oral, gastric, and intestinal bioavailability simultaneously, the authors demonstrated high stability in the gastric phase and the highest release in the intestinal phase, i.e., the most desirable release profile. Moreover, for microcapsules obtained via spray drying, a better anthocyanin bioavailability was observed, which was explained by the effect of the carriers [43]. These observations may indicate that the polymer mixtures used allowed for the protection of anthocyanins under simulated in vitro digestion conditions. Thus, encapsulation had a positive effect on the stability of phenolic compounds during digestion, which may indicate the effectiveness of this method in preserving their bioactive properties. It is also worth noting that the chlorogenic acid bioavailability index was recorded only for microcapsules with a PE core, where the highest value (55.51%) was found for the Alg + Pect + WPI (H) mixture. The lack of chlorogenic acid in the remaining samples may be due to transformation into other chlorogenic acids, such as caffeic acid [44], or their general impaired absorption as a result of esterification [45].
3.5. Swelling Experiments
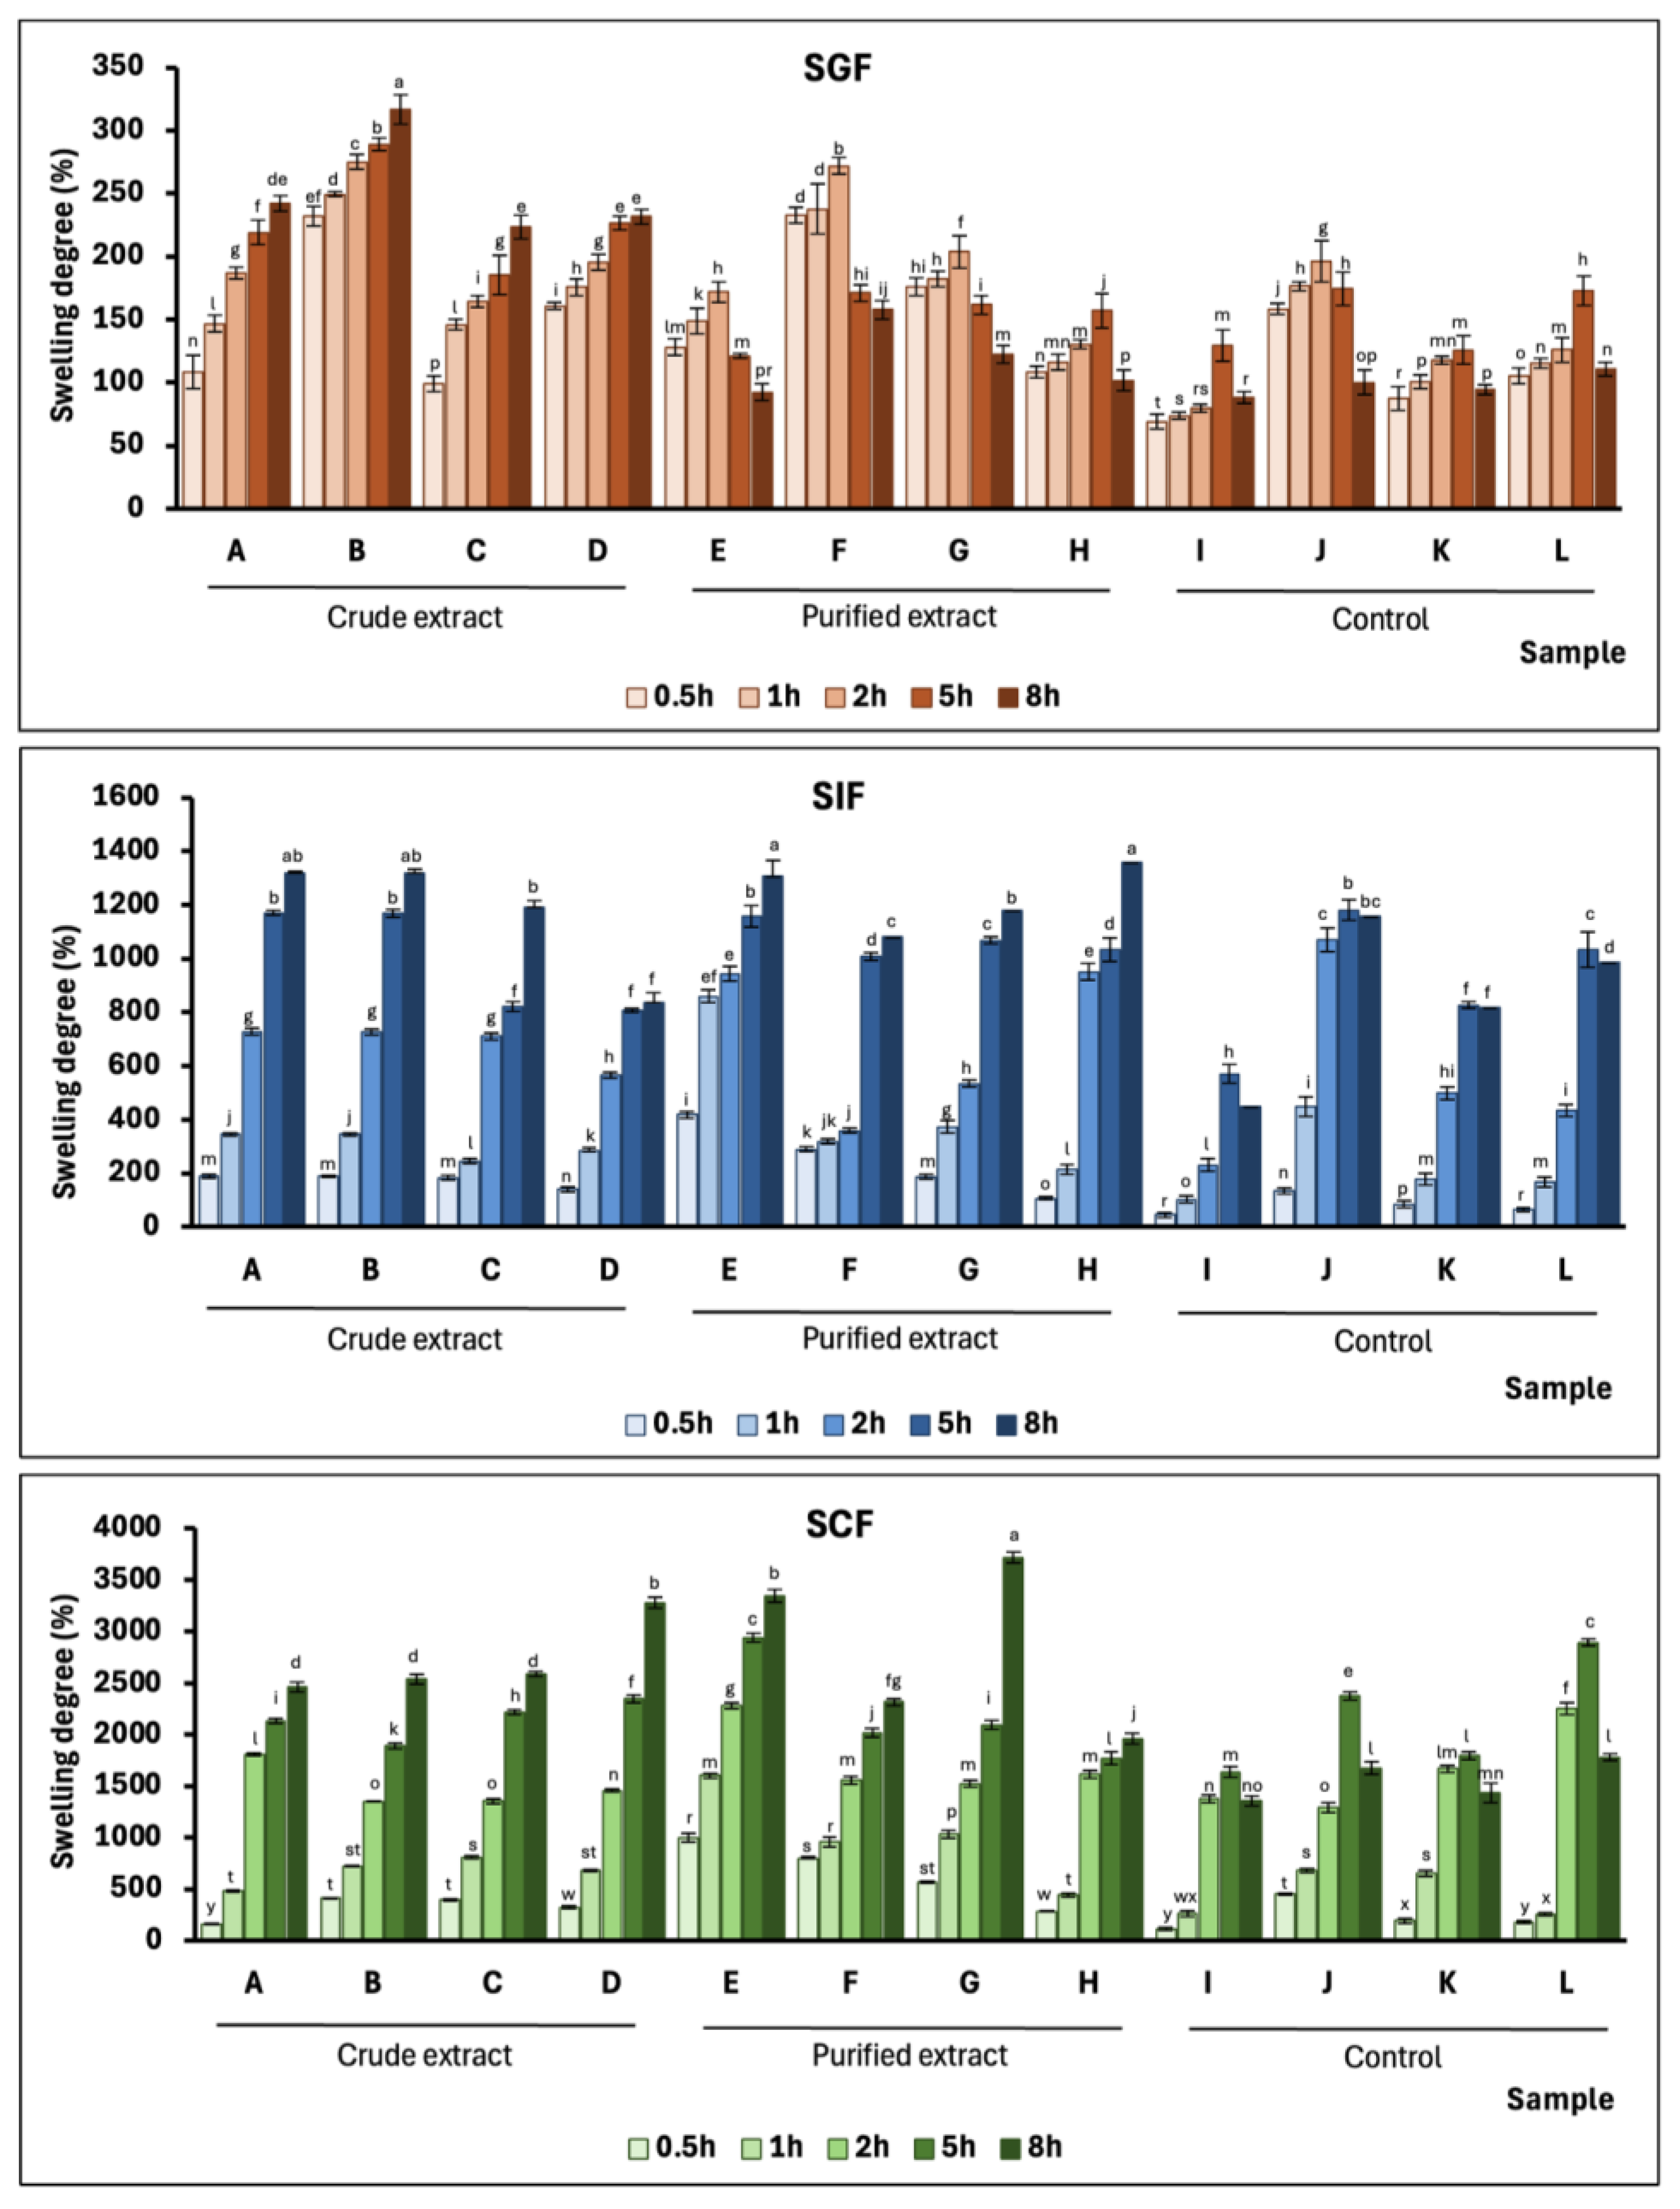
The ability of microcapsules to swell is shown in Figure 1. The value of this parameter was determined at five time points in an environment simulating gastric fluid (SGF), intestinal fluid (SIF), and colonic fluid (SCF). As can be seen, the swelling rate of microcapsules was the highest in SCF and the lowest in SGF. It was proven that Alg in an acidic buffer is converted into insoluble alginic acid [46]; hence, its significantly lower degree of swelling than in the SIF or SCF environment can be explained. In the acidic environment, only the microcapsules with a CE core retained their shape, and the swelling rate increased with time. In turn, for the microcapsules with a PE core, the degree of swelling increased with the reaction time up to 2 h and then slightly decreased. The same tendency was noted for the control microcapsules. This was most likely due to the fact that the higher content of polysaccharides in CE influenced the increasing degree of swelling of the microcapsules enriched with this extract and the preservation of their structure. This is also reflected in the analysis of the individual groups of microcapsules, where it can be seen that the Alg + Pect microcapsules, i.e., enriched with polysaccharides, are characterized by the highest degree of swelling. In turn, in PE microcapsules, a rapid release of anthocyanins could occur within the first two hours, which resulted in a reduced degree of swelling in an acidic environment in the subsequent hours of incubation. Such a relationship was suggested by Park et al. [47], who proved that the main factor for the rapid release of anthocyanins in SGF is the high compressive pressure, resulting in the termination of their release after an average of 2 h of incubation.
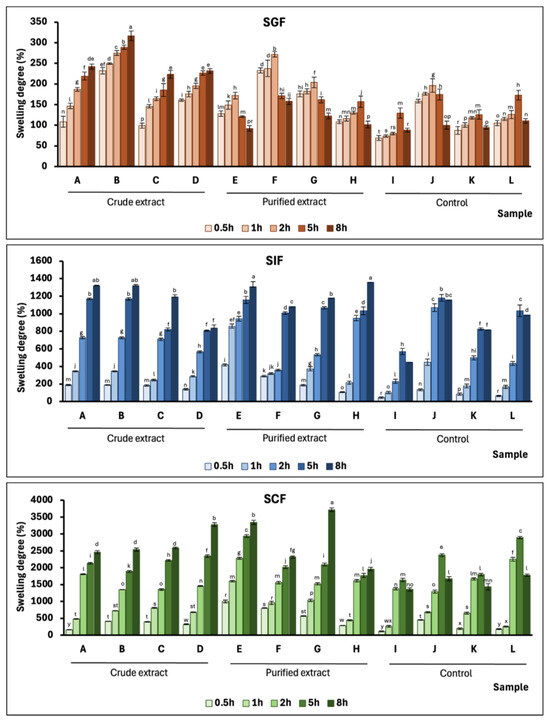
Figure 1.
Swelling profiles of microcapsules in three environments of pH 1.2 (SGF), pH 6.8 (SIF) and pH 7.2 (SCF). Abbreviations: A, microcapsules Alg + CE; B, microcapsules Alg + Pect + CE; C, microcapsules Alg + WPI + CE; D, microcapsules Alg + Pect + WPI + CE; E, microcapsules Alg + PE; F, microcapsules Alg + Pect + PE; G, microcapsules Alg + WPI + PE; H, microcapsules Alg + Pect + WPI + PE; I, microcapsules Alg; J, microcapsules Alg + Pect; K, microcapsules Alg + WPI; L, microcapsules Alg + Pect + WPI. Results are expressed as mean (n = 3) and SD. Statistically significant differences within a given parameter are marked with different letters (p < 0.05; Duncan’s test).
In the SIF and SCF environment, all of the microcapsules swelled rapidly with incubation time. In general, the increase in the mass of microcapsules in water is due to their porous structure, which allows them to absorb fluids to fill the voids in the polymer network until the equilibrium state is reached [13]. However, both in the SIF and SCF environment for the control samples, a decrease in the swelling degree can be observed at 8 h of incubation, which was unnoticeable in the case of CE and PE microcapsules. These results can be attributed to the fact that the polyphenolic compounds of the encapsulated extracts could have a stabilizing effect on the used carriers in a neutral environment. Similar behavior of Alg-based microcapsules was observed in other works [10,48]. For microcapsules of Alg and chitosan, Mohy et al. [10] showed that up to 3 h of reaction, the structure of the formed networks increased, thus the volume of the microcapsules increased. However, after this time, no COO− and NH3+ functional groups remained free, which resulted in the disintegration of the microcapsules. In turn, Omer et al. [48] noted the disintegration of Alg microcapsules in the SIF and SCF environment after 5 h of swelling. According to the authors, the disintegration of microspheres at high pH of the phosphate buffer results from the higher affinity of phosphate ions for calcium than for the Alg polymer, which ultimately leads to the disruption of the calcium alginate network and the disintegration of the microcapsules. Therefore, for the obtained microcapsules, no major differences in the degree of swelling were demonstrated depending on the encapsulation mixture used. However, the types of extracts used played an important role.
3.6. Color
The color of the microcapsules, assessed by measuring the parameters L*, a*, b*, chroma, and color change (ΔE), can provide useful data regarding the potential use as a food additive (Table 7). As can be seen, the color characteristics of the microcapsules were influenced by the type of core material as well as the type and concentration of the carrier material. Comparing the core material, lower L* values were observed for the PE microcapsules compared to CE and the highest brightness for the alginate microcapsules. Furthermore, the PE microcapsules have higher a* and b* values compared to those obtained from CE, indicating a higher proportion of red and blue colors. These microcapsules were also characterized by higher color saturation (higher value of the C parameter). In all cases, the color change was noticeable compared to the control (ΔE parameter). These differences can be explained by the higher concentration of anthocyanins in PE, the pigments responsible for the red, blue, and purple colors of blueberries. Our results are consistent with the data reported for microencapsulated anthocyanin-rich extract of jussara (Euterpe edulis Martius) in a maltodextrin/gum Arabic matrix [49], as well as anthocyanins from Natal plum (Carissa macrocarpa) encapsulated in a sodium alginate/pectin/xanthan gum/psyllium mucilage matrix [15].
Table 7.
Colorimetric parameters such as lightness (L*), green/red (a*), yellow/blue (b*), saturation (chroma), and color change (ΔE) of control microcapsules and those enriched with blueberry fruit extracts.
3.7. Microcapsules Size
The dimensions of the lyophilized microcapsules are presented in Table 1 and Figure S1. The diameter of the microcapsules ranged from 607.06 (A) to 690.09 µm (D) for the microcapsules with the CE core and from 562.91 (E) to 720.73 µm (H) with the PE core. In both cases, the lowest values were shown for the microcapsules obtained from Alg alone, while the highest was for the Alg + Pect + WPI microcapsules. The same tendency was noted for the control samples. Therefore, it can be concluded that the type of core had no effect on the diameter of the microcapsules, while the factor determining this parameter was the type of polymers used. The distribution of microparticle sizes was similar in other works [9,10,11,50].
3.8. Biocompatibility with Colon Epithelial Cells
The biocompatibility of the microcapsules was confirmed in a culture assay with colonic epithelial cells (CCD841CoN). The cells were treated with microcapsules with CE and PE cores given at three concentrations, as well as their counterparts without extract (Figure 2). After 24 h incubation, the cell viability ranged from 101.8 (A) to 120.4% (K), from 90.2 (E) to 109.1% (K), and from 73.4 (G) to 105.2% (D) in the control group and the groups with microcapsules given at concentrations of 100, 1000 and 5000 µg/mL, respectively. This means that the cells proliferated properly in contact with the microcapsules, indicating their good biocompatibility. Analyzing the individual groups of microcapsules, microcapsules with CE, at the highest concentration given, inhibited cell viability by 5.3% (C, Alg + WPI). In turn, the addition of Pect and WPI increased cell viability by 5.2% (D). The same tendency was noted for microcapsules with PE, where also microcapsules Alg + WPI (G) inhibited cell proliferation to the greatest extent (by 26.5%). In this group, the addition of Pect and WPI (H) also had a positive effect on cell growth. The same relationship was observed for the control sample.
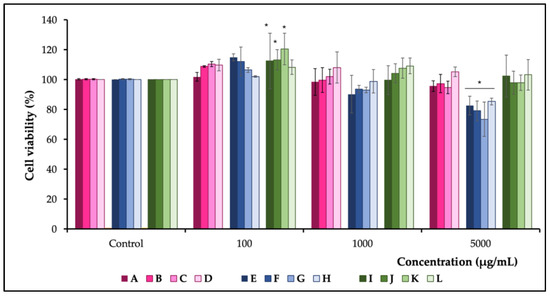
Figure 2.
Biocompatibility of microcapsules with crude extract (CE), purified extract (PE), and control samples against normal colon epithelial cells (CCD841CoN). Abbreviations: A, microcapsules Alg + CE; B, microcapsules Alg + Pect + CE; C, microcapsules Alg + WPI + CE; D, microcapsules Alg + Pect + WPI + CE; E, microcapsules Alg + PE; F, microcapsules Alg + Pect + PE; G, microcapsules Alg + WPI + PE; H, microcapsules Alg + Pect + WPI + PE; I, microcapsules Alg; J, microcapsules Alg + Pect; K, microcapsules Alg + WPI; L, microcapsules Alg + Pect + WPI. Results are expressed as mean (n = 4) and SD. Significant differences (* < 0.05) were assessed using the t-student’s test.
The demonstrated relationships can be explained by the composition of the carrier mixture, where the simultaneous addition of Alg, Pect, and WPI to the culture medium, i.e., enrichment of the culture medium with polysaccharides and protein, allowed the creation of an environment suitable for the growth of colonic epithelial cells. This fact is confirmed by the studies of Wu et al. [51], who, in vivo studies, demonstrated the ability of Alg and Pect oligosaccharides to protect the integrity of intestinal epithelial cells while reducing the permeability and the possibility of using them as agents alleviating ulcerative colitis. Furthermore, for microencapsulated (chitosan and carrageenan) 5-aminosalicylic acid, a drug used in the therapy of inflammatory bowel diseases, Stavarache et al. [52] noted a slight increase in cell proliferation after 7 days of exposure to microcapsules compared to the control in the biocompatibility test with CCD841CoN cells. Moreover, a prolonged phenotype was demonstrated for cells treated with microcapsules, confirming their low cytotoxicity and no negative effect on their proliferation. In turn, Trivedi et al. [53] assessed the cytocompatibility of microcapsules (chitosan and cellulose) used for engineering soft and hard tissues and revealed that the free amino groups of chitosan have the most positive effect on the growth of osteoblast cells (CRL-11372). However, in the same study, an increase in the concentration of chitosan was observed; therefore, amino groups can also potentially lead to a higher surface charge, which results in the inhibition of cell viability. This can also explain the lower cell viability demonstrated in this work after treatment with Alg + WPI microcapsules, in comparison to the carrier mixture consisting of Alg + Pect + WPI. Overall, the biocompatibility assessment showed that the prepared microcapsules are good candidates as carriers of phenolic compounds without a significant effect on the proliferation of healthy cells.
3.9. Cytotoxic Activity against Cancer Cells
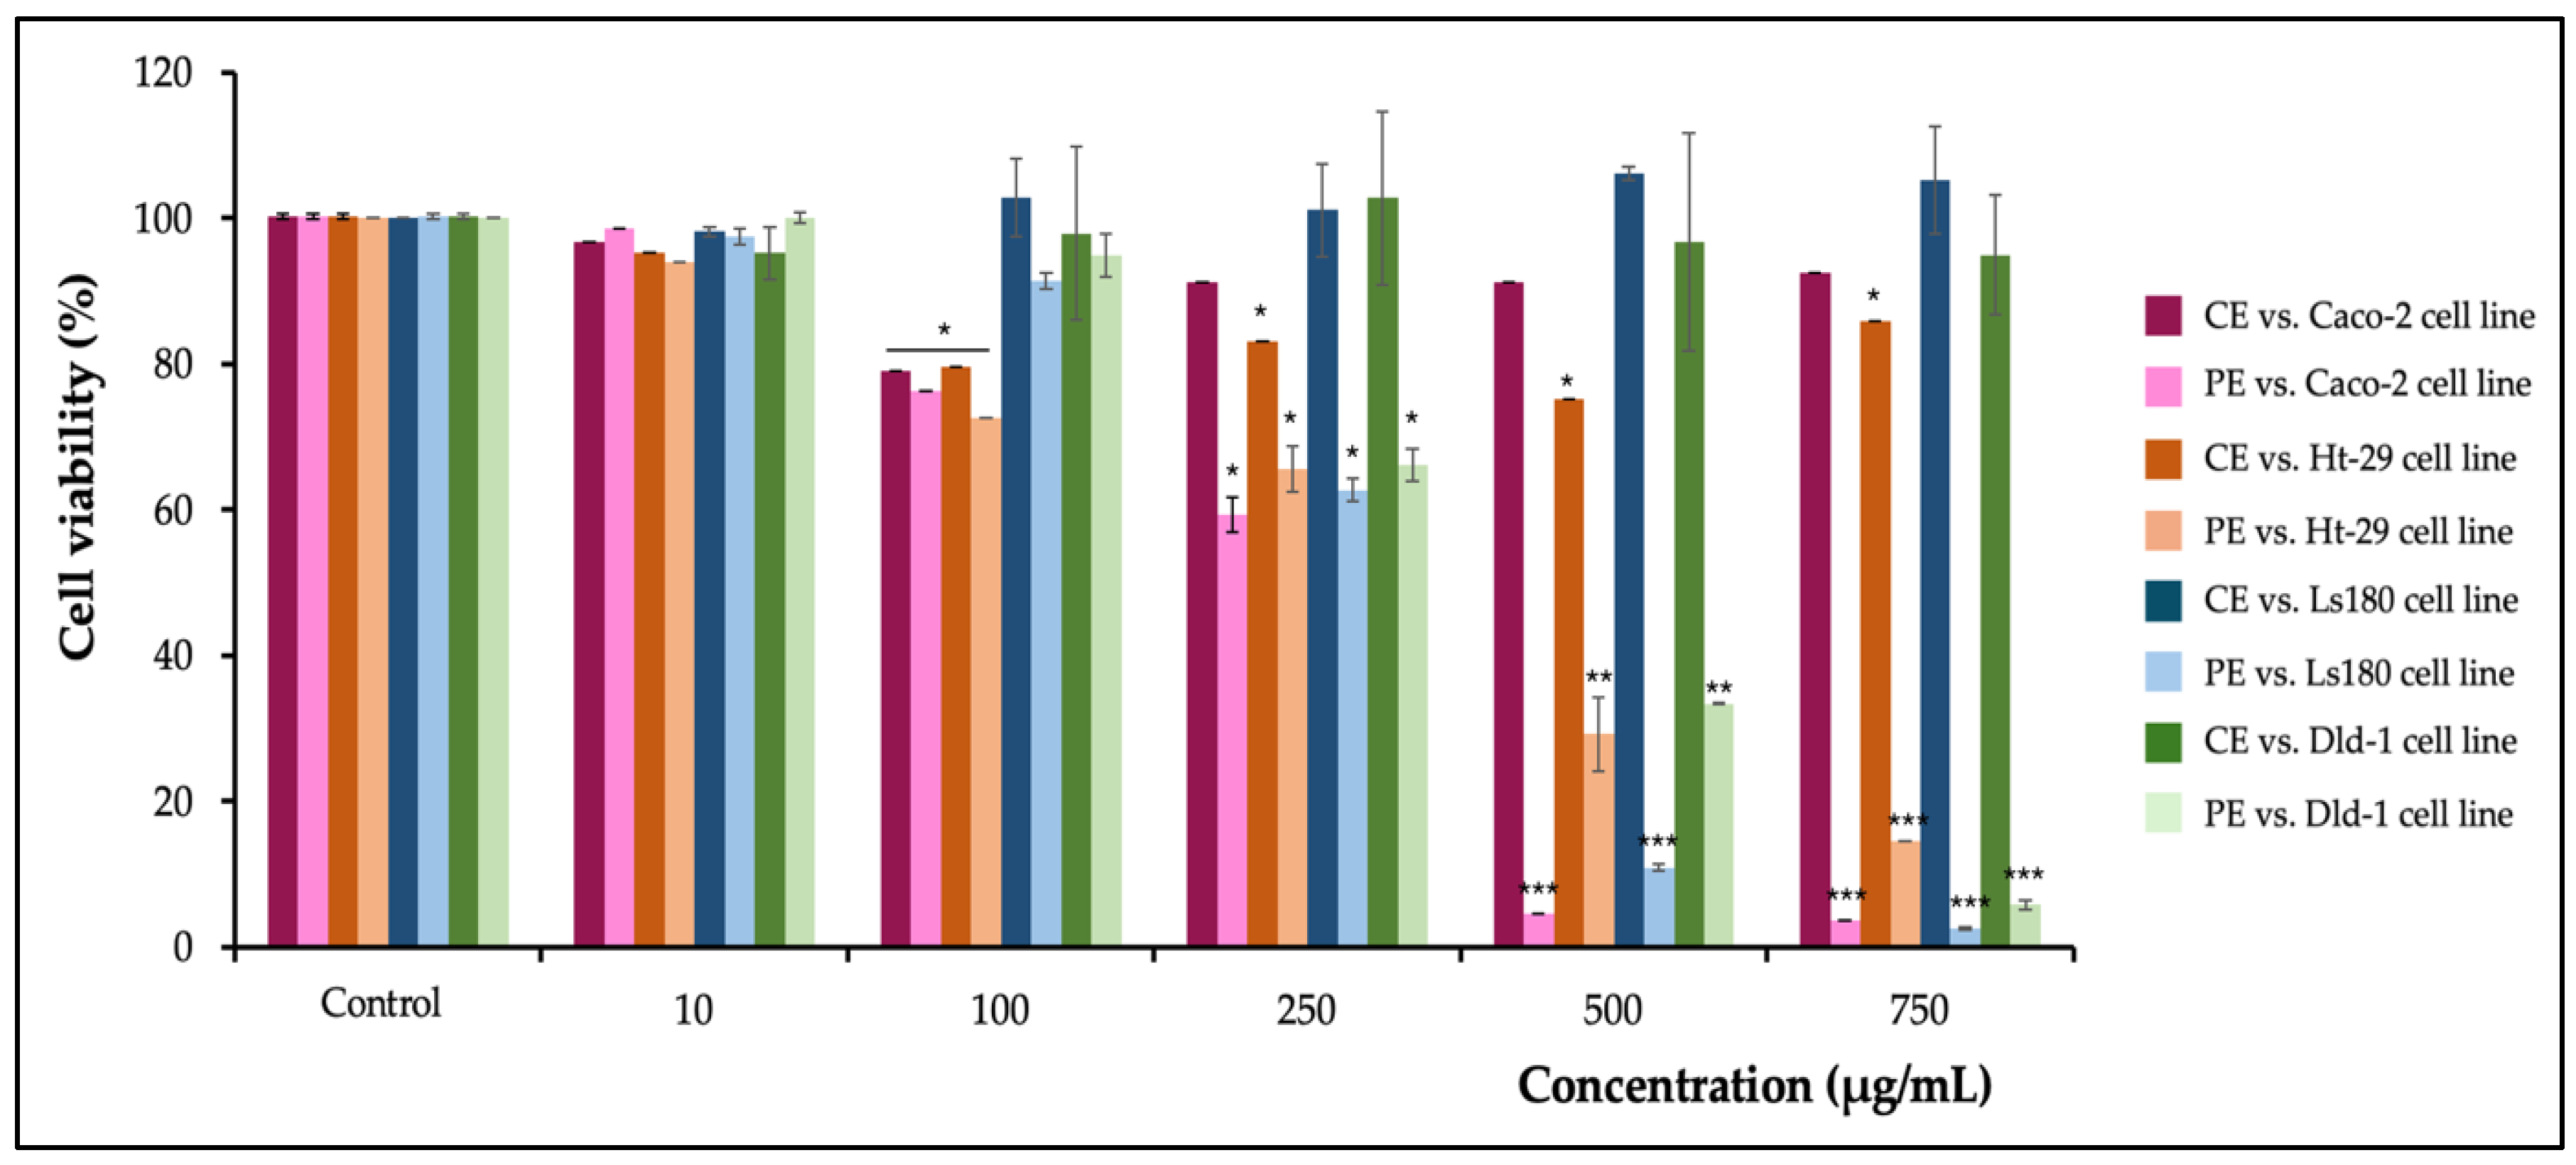
The cytotoxic activity of the extracts and microcapsules was assessed against four colon cancer cell lines (Caco-2, Ht-29, Ls180, and Dld-1). In the first part of the assay, the cytotoxic activity of CE and PE alone was assessed. As can be seen in Figure 3, only PE was capable of inhibiting cancer cell viability. The estimated cytotoxicity was significantly (p < 0.05) dose-dependent. At the highest administered PE concentration of 500 µg/mL, the cell viability of Caco-2, Ht-29, Ls180, and Dld-1 was 3.62, 14.56, 2.50, and 5.84%, respectively, compared to the control. The highest sensitivity to the extract assessed was characteristic of Caco-2 and Ls180 lines. The obtained values are consistent with the previous results regarding the anticancer activity of blueberry fruit extracts [16,17,18]. The lack of cytotoxic effect of CE is probably due to the presence of ballast substances in the extract, which could stimulate the growth of cancer cells, as well as the low concentration of bioactive compounds compared to PE.
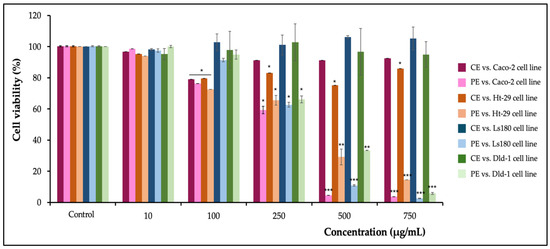
Figure 3.
Cytotoxic activity of crude (CE) and purified (PE) extracts against 4 colon cancer cell lines (Caco-2, Ht-29, Ls180, Dld-1). Results are expressed as mean (n = 9) and SD. Significant differences (* < 0.05; ** < 0.01; *** < 0.001) were assessed using the t-student’s test.
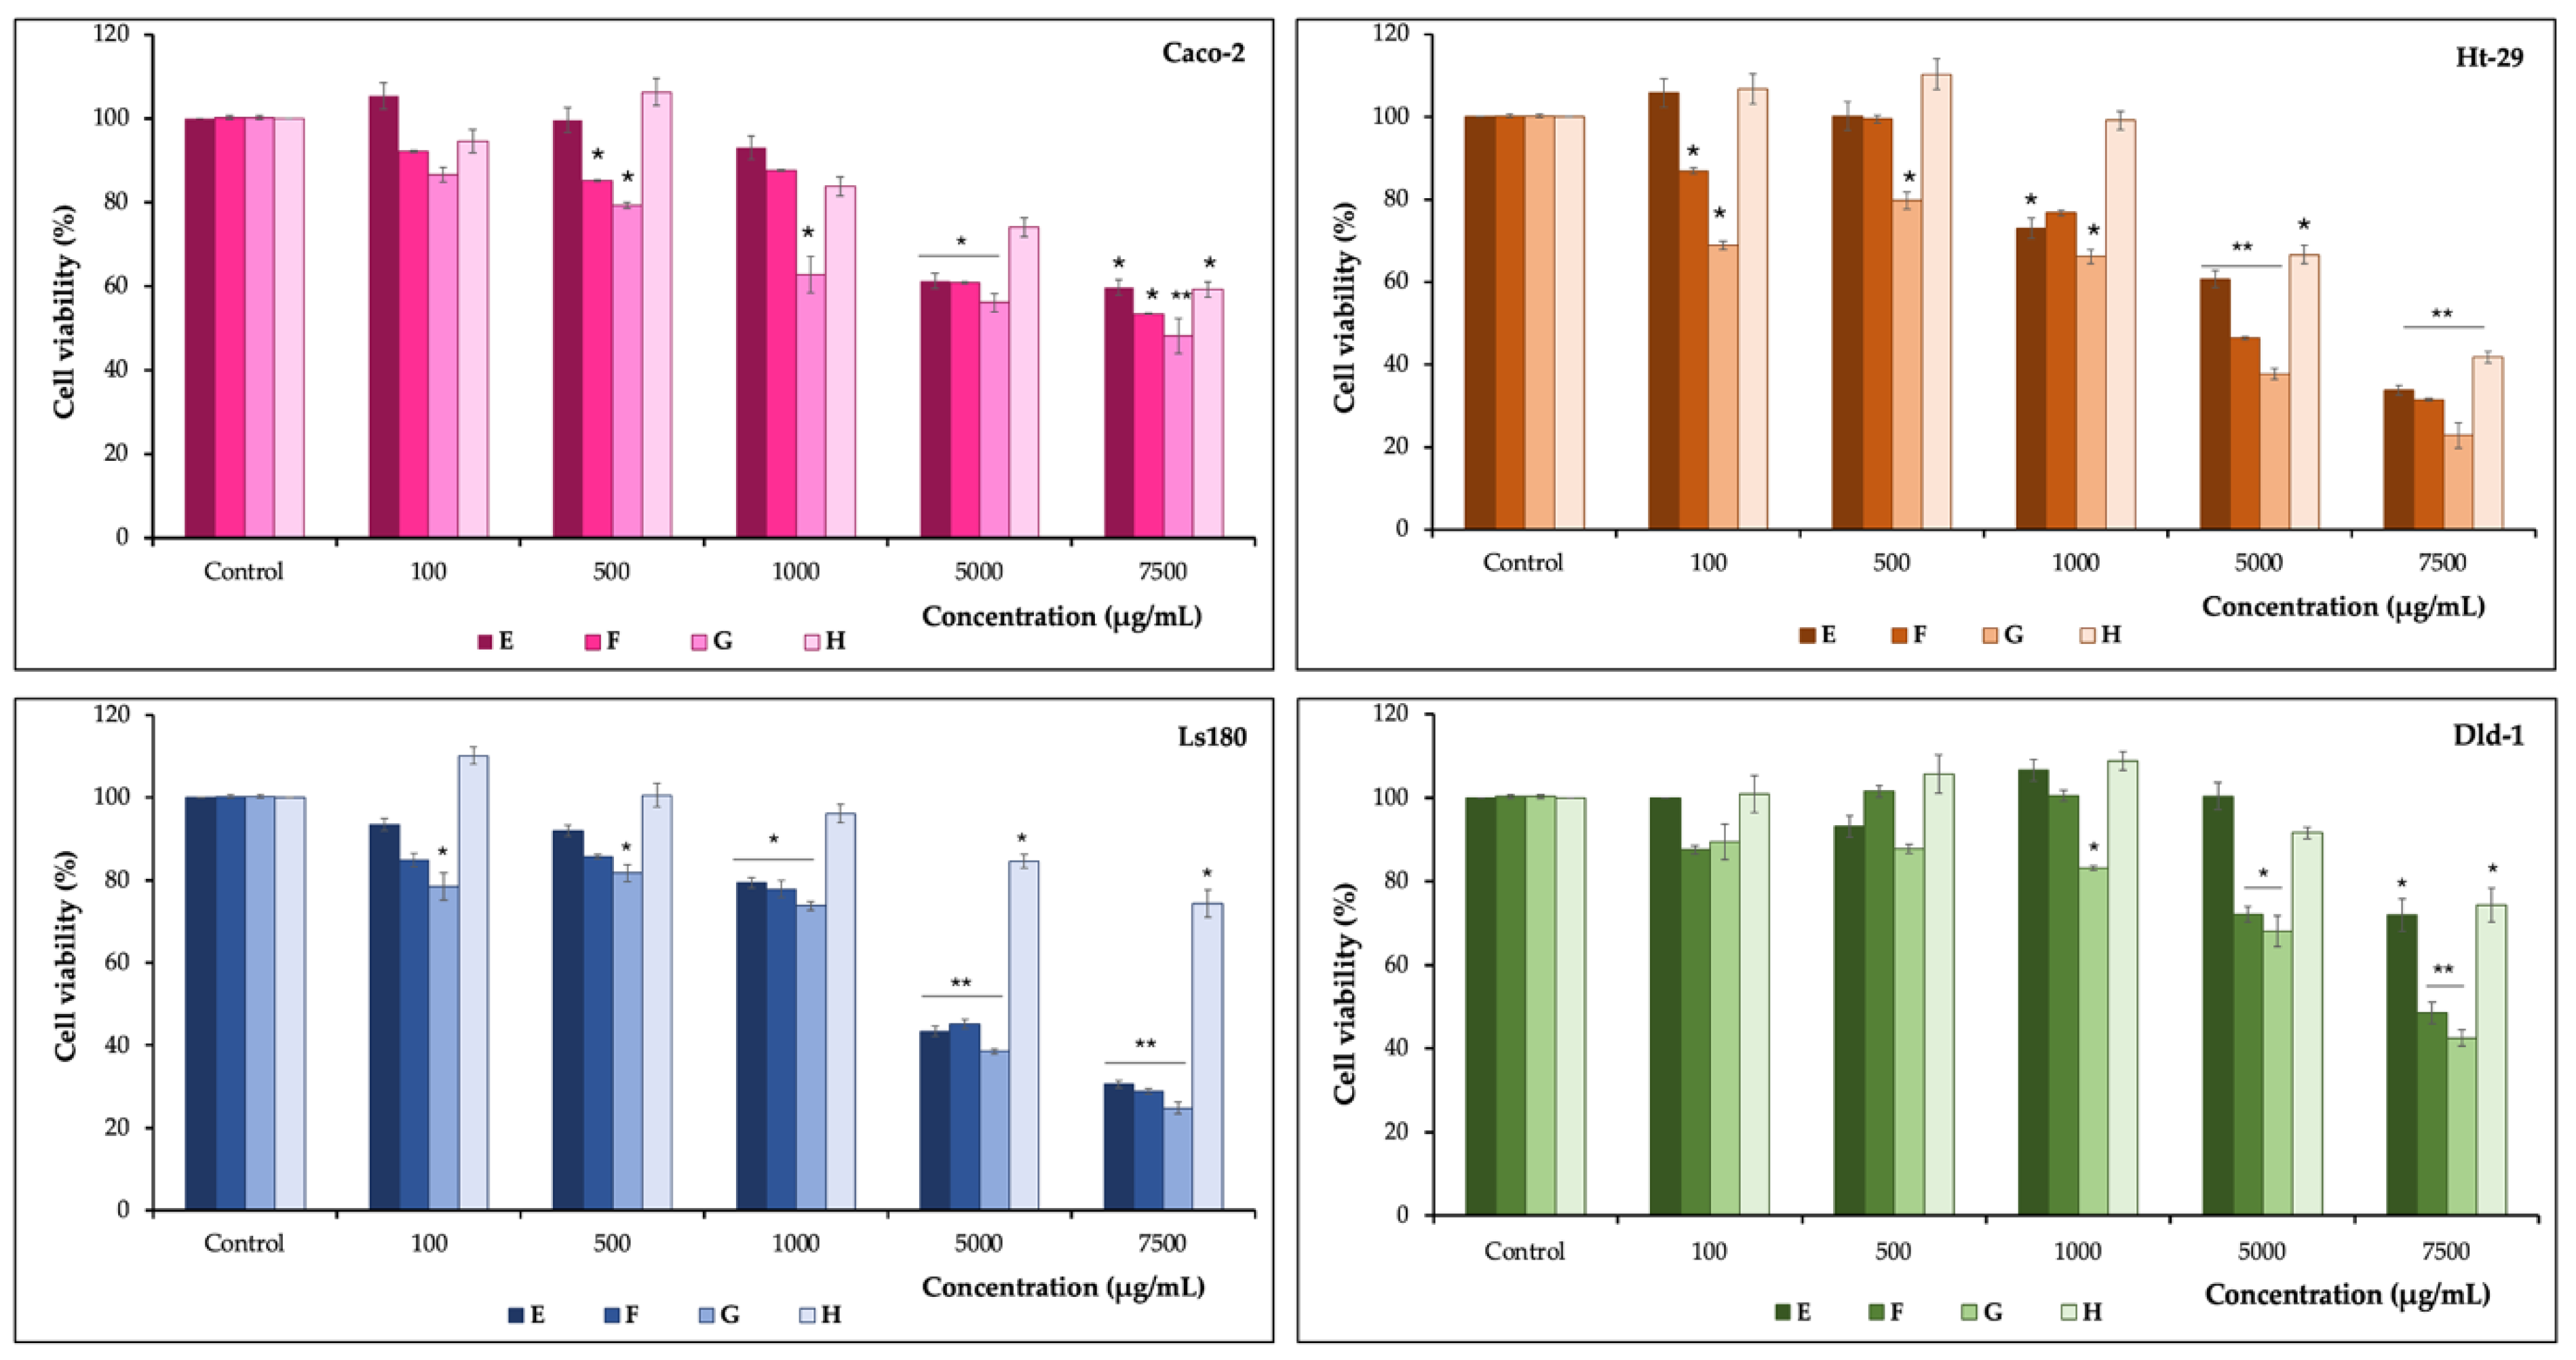
Due to the demonstration of anticancer activity only for PE, microcapsules with this core were selected for the evaluation of cytotoxic activity against four colon cancer cell lines. All of the tested microcapsules caused a dose-dependent decrease in cancer cell viability (Figure 4). Analyzing the types of carrier materials, the highest cytotoxic activity against Caco-2, Ht-29, Ls180, and Dld-1 lines was demonstrated for G microcapsules (Alg + WPI). At the highest concentration, cell viability was inhibited by 51.8% (for Caco-2 line), 77.1% (Ht-29), 75.2% (Ls180), and 57.5% (Dld-1). On the other hand, the lowest cell sensitivity was demonstrated after their treatment with H microcapsules (Alg + Pect + WPI) despite the demonstrated highest content of phenolic compounds. Therefore, just like in the biocompatibility test, it can be seen that the simultaneous enrichment of Alg with polysaccharides and proteins has a beneficial effect on the growth of both normal and cancer cells.

Figure 4.
Cytotoxic activity of microcapsules with purified extract (PE) against 4 colon cancer cell lines (Caco-2, Ht-29, Ls180, Dld-1). Abbreviations: E, Alg + PE microcapsules; F, Alg + Pect + PE microcapsules; G, Alg + WPI + PE microcapsules; H, Alg + Pect + WPI + PE microcapsules. Results are expressed as mean (n = 9) and SD. Significant differences (* < 0.05; ** < 0.01) were assessed using the t-student’s test.
The incidence of colorectal cancer creates a need for developing therapies that can play a significant role in the prevention and/or treatment of these diseases. There is a lot of scientific evidence emphasizing the effectiveness and practical use of microcapsules loaded with an active substance targeted for release in the large intestine in the treatment of cancer. Such a procedure ensures reduced release of the active substance outside the target site, and thus a reduction in side effects, as well as a reduction in the therapeutic dose required to achieve the intended effects [54,55,56]. It has been shown that over 60% of curcumin in Alg microcapsules is released in the colon, demonstrating cytotoxicity towards cancer cells (Ht-29 line) [54]. Gastroresistant properties and effective release of the active substance in the large intestine were also confirmed for Alg microcapsules containing the drug cetuximab (CTX), which ensured higher cytotoxic activity towards cancer cells than in the case of administration of the free drug [55]. Anticancer activity is also noted for plant phytochemicals bound in microcapsules. Bal et al. [57] showed greater efficacy against lung cancer cells (A549) for the extract of olive tree leaves (Olea europaea) in microcapsules of Alg coated with chitosan than for the free extract. The cited studies, as well as our own results, provide valuable evidence of the anticancer activity of the developed microcapsules, but further studies are necessary, including the assessment of the release profile of phenolic compounds in individual sections of the large intestine, as well as the analysis of the cancer cell death pathway, in order to fully explain and understand their potential chemopreventive properties. This is all the more so because the use of microcapsules and phytochemicals themselves in practice as anticancer agents is very limited. The main reasons for this state of affairs include their low stability, solubility, and bioavailability demonstrated in in vivo models, which hinder effective action in the body [58]. Additionally, due to their multidirectional activity, phenolic compounds can activate or inhibit many different signaling pathways involved in the survival or death of cancer cells, causing various side effects [59]. The above issues are worth considering when designing microcapsules as carriers of phenolic compounds targeted at activity against cancer cells.
4. Conclusions
This study demonstrated the health-promoting and application potential of microcapsules obtained via ionotropic gelation with a core made of raw and purified blueberry fruit extract, where alginate (Alg), pectin (Pect), and whey protein isolate (WPI) were used as coating polymers. It was found that microcapsules with a core made of purified extract (PE) were characterized by better values of the assessed parameters than those with a raw extract (CE), and the mixture of Alg + Pect + WPI retains the antioxidant potential of phenolic compounds and their stability during storage to the greatest extent, while the mixture of Alg + WPI has a beneficial effect on cytotoxic properties towards colon cancer cells and the bioavailability index of phenolic compounds. Moreover, all of the assessed microcapsules were characterized by good biocompatibility towards normal colon epithelial cells, as well as the color and swelling index, which is consistent with previous reports.
The obtained results can be used to direct future studies on increasing the bioavailability and bioassimilability index, especially in the last part of the gastrointestinal tract, which would enable directing the cytotoxic properties of microcapsules to colon cancer cells. In this context, it is also important to expand the panel of the cytotoxic assessment of microcapsules against cancer cells both at the in vitro and in vivo level, including tracing the cell death pathway and the possible side effects of microcapsule administration. After these analyses, microcapsules could be used as a component of functional foods, convenience foods, nutraceuticals, or dietary supplements. Overall, the microcapsules developed in this study represent a promising path to the development of natural chemopreventive agents that can play a major role in the prevention of colon cancer.
Supplementary Materials
The following supporting information can be downloaded at: https://www.mdpi.com/article/10.3390/app14177842/s1, Table S1. Phenolic compound content (mg/g) in microcapsules after simulated in vitro digestion; Figure S1. Microscope images of microcapsules.
Author Contributions
Conceptualization, N.Ż.; methodology, N.Ż., M.Ś. and I.T.K.; software, N.Ż.; validation, N.Ż., M.Ś. and I.T.K.; formal analysis, N.Ż.; investigation, N.Ż.; resources, N.Ż.; data curation, N.Ż.; writing—original draft preparation, N.Ż.; writing—review and editing, N.Ż. and A.P.; visualization, N.Ż.; supervision, I.T.K.; project administration, N.Ż. and I.T.K.; funding acquisition, N.Ż. and I.T.K. All authors have read and agreed to the published version of the manuscript.
Funding
This research was financed under the Podkarpackie Center of Innovation project entitled “Innovative chemopreventive drink enriched with bioactive phytochemicals from berry fruits”, grant number N3_004, funding number 1/UR/1/DG/PCI/2022, funding amount PLN 219,254.00.
Institutional Review Board Statement
Not applicable.
Informed Consent Statement
Not applicable.
Data Availability Statement
The raw data supporting the conclusions of this article will be made available by the authors on request.
Conflicts of Interest
The authors declare no conflicts of interest.
References
- Siegel, R.L.; Wagle, N.S.; Cercek, A.; Smith, R.A.; Jemal, A. Colorectal Cancer Statistics, 2023. CA Cancer J. Clin. 2023, 73, 233–254. [Google Scholar] [CrossRef]
- Islami, F.; Goding Sauer, A.; Miller, K.D.; Siegel, R.L.; Fedewa, S.A.; Jacobs, E.J.; McCullough, M.L.; Patel, A.V.; Ma, J.; Soerjomataram, I.; et al. Proportion and Number of Cancer Cases and Deaths Attributable to Potentially Modifiable Risk Factors in the United States. CA Cancer J. Clin. 2018, 68, 31–54. [Google Scholar] [CrossRef] [PubMed]
- Haque, A.; Brazeau, D.; Amin, A.R. Perspectives on Natural Compounds in Chemoprevention and Treatment of Cancer: An Update with New Promising Compounds. Eur. J. Cancer 2021, 149, 165–183. [Google Scholar] [CrossRef]
- Aiello, P.; Sharghi, M.; Mansourkhani, S.M.; Ardekan, A.P.; Jouybari, L.; Daraei, N.; Peiro, K.; Mohamadian, S.; Rezaei, M.; Heidari, M.; et al. Medicinal Plants in the Prevention and Treatment of Colon Cancer. Oxidative Med. Cell. Longev. 2019, 2019, 1–51. [Google Scholar] [CrossRef]
- Mohan Shankar, G.; Swetha, M.; Keerthana, C.K.; Rayginia, T.P.; Anto, R.J. Cancer Chemoprevention: A Strategic Approach Using Phytochemicals. Front. Pharmacol. 2022, 12, 809308. [Google Scholar] [CrossRef]
- De, S.; Paul, S.; Manna, A.; Majumder, C.; Pal, K.; Casarcia, N.; Mondal, A.; Banerjee, S.; Nelson, V.K.; Ghosh, S.; et al. Phenolic Phytochemicals for Prevention and Treatment of Colorectal Cancer: A Critical Evaluation of In Vivo Studies. Cancers 2023, 15, 993. [Google Scholar] [CrossRef]
- Sun, X.; Liu, C.; Omer, A.M.; Yang, L.-Y.; Ouyang, X. Dual-Layered pH-Sensitive Alginate/Chitosan/Kappa-Carrageenan Microbeads for Colon-Targeted Release of 5-Fluorouracil. Int. J. Biol. Macromol. 2019, 132, 487–494. [Google Scholar] [CrossRef] [PubMed]
- Ćorković, I.; Pichler, A.; Ivić, I.; Šimunović, J.; Kopjar, M. Microencapsulation of Chokeberry Polyphenols and Volatiles: Application of Alginate and Pectin as Wall Materials. Gels 2021, 7, 231. [Google Scholar] [CrossRef] [PubMed]
- Flamminii, F.; Paciulli, M.; Di Michele, A.; Littardi, P.; Carini, E.; Chiavaro, E.; Pittia, P.; Di Mattia, C.D. Alginate-Based Microparticles Structured with Different Biopolymers and Enriched with a Phenolic-Rich Olive Leaves Extract: A Physico-Chemical Characterization. Curr. Res. Food Sci. 2021, 4, 698–706. [Google Scholar] [CrossRef]
- Mohy Eldin, M.; Omer, A.M.; Wassel, M.A.; Tamer, T.M.; Ibrahim, S.A. Novel Smart Ph Sensitive Chitosan Grafted Alginate Hydrogel Microcapsules for Oral Protein Delivery: I. Preparation and Characterization. Int. J. Pharm. Pharm. Sci. 2015, 7, 331–337. [Google Scholar]
- Stach, M.; Kolniak-Ostek, J. The Influence of the Use of Different Polysaccharide Coatings on the Stability of Phenolic Compounds and Antioxidant Capacity of Chokeberry Hydrogel Microcapsules Obtained by Indirect Extrusion. Foods 2023, 12, 515. [Google Scholar] [CrossRef] [PubMed]
- Wang, W.; Jung, J.; Zhao, Y. Chitosan-Cellulose Nanocrystal Microencapsulation to Improve Encapsulation Efficiency and Stability of Entrapped Fruit Anthocyanins. Carbohydr. Polym. 2017, 157, 1246–1253. [Google Scholar] [CrossRef] [PubMed]
- Li, Q.; Duan, M.; Hou, D.; Chen, X.; Shi, J.; Zhou, W. Fabrication and Characterization of Ca(II)-Alginate-Based Beads Combined with Different Polysaccharides as Vehicles for Delivery, Release and Storage of Tea Polyphenols. Food Hydrocoll. 2021, 112, 106274. [Google Scholar] [CrossRef]
- Nutrizio, M.; Jurić, S.; Kucljak, D.; Švaljek, S.L.; Vlahoviček-Kahlina, K.; Režek Jambrak, A.; Vinceković, M. Encapsulation of Rosemary Extracts Using High Voltage Electrical Discharge in Calcium Alginate/Zein/Hydroxypropyl Methylcellulose Microparticles. Foods 2023, 12, 1570. [Google Scholar] [CrossRef]
- Seke, F.; Manhivi, V.E.; Slabbert, R.M.; Sultanbawa, Y.; Sivakumar, D. In Vitro Release of Anthocyanins from Microencapsulated Natal Plum (Carissa macrocarpa) Phenolic Extract in Alginate/Psyllium Mucilage Beads. Foods 2022, 11, 2550. [Google Scholar] [CrossRef]
- Żurek, N.; Pawłowska, A.; Kapusta, I. Obtaining Preparations with Increased Content of Bioactive Compounds from Eight Types of Berries. J. Berry Res. Prepr. 2023, 13, 307–323. [Google Scholar] [CrossRef]
- Seeram, N.P.; Adams, L.S.; Zhang, Y.; Lee, R.; Sand, D.; Scheuller, H.S.; Heber, D. Blackberry, Black Raspberry, Blueberry, Cranberry, Red Raspberry, and Strawberry Extracts Inhibit Growth and Stimulate Apoptosis of Human Cancer Cells In Vitro. J. Agric. Food Chem. 2006, 54, 9329–9339. [Google Scholar] [CrossRef]
- Yi, W.; Fischer, J.; Krewer, G.; Akoh, C.C. Phenolic Compounds from Blueberries Can Inhibit Colon Cancer Cell Proliferation and Induce Apoptosis. J. Agric. Food Chem. 2005, 53, 7320–7329. [Google Scholar] [CrossRef]
- Hui, X.; Wu, G.; Han, D.; Stipkovits, L.; Wu, X.; Tang, S.; Brennan, M.A.; Brennan, C.S. The Effects of Bioactive Compounds from Blueberry and Blackcurrant Powders on the Inhibitory Activities of Oat Bran Pastes against α-Amylase and α-Glucosidase Linked to Type 2 Diabetes. Food Res. Int. 2020, 138, 109756. [Google Scholar] [CrossRef]
- Liao, M.; Ma, L.; Miao, S.; Hu, X.; Liao, X.; Chen, F.; Ji, J. The In-Vitro Digestion Behaviors of Milk Proteins Acting as Wall Materials in Spray-Dried Microparticles: Effects on the Release of Loaded Blueberry Anthocyanins. Food Hydrocoll. 2021, 115, 106620. [Google Scholar] [CrossRef]
- Righi Da Rosa, J.; Cezimbra Weis, G.C.; Bolson Moro, K.I.; Sasso Robalo, S.; Elias Assmann, C.; Picolli Da Silva, L.; Irineu Muller, E.; De Bona Da Silva, C.; Ragagnin De Menezes, C.; Severo Da Rosa, C. Effect of Wall Materials and Storage Temperature on Anthocyanin Stability of Microencapsulated Blueberry Extract. LWT 2021, 142, 111027. [Google Scholar] [CrossRef]
- Mar, J.M.; Silva, L.S.; Rabelo, M.D.S.; Muniz, M.P.; Nunomura, S.M.; Correa, R.F.; Kinupp, V.F.; Campelo, P.H.; Bezerra, J.D.A.; Sanches, E.A. Encapsulation of Amazonian Blueberry Juices: Evaluation of Bioactive Compounds and Stability. LWT 2020, 124, 109152. [Google Scholar] [CrossRef]
- Wu, Y.; Han, Y.; Tao, Y.; Li, D.; Xie, G.; Show, P.L.; Lee, S.Y. In Vitro Gastrointestinal Digestion and Fecal Fermentation Reveal the Effect of Different Encapsulation Materials on the Release, Degradation and Modulation of Gut Microbiota of Blueberry Anthocyanin Extract. Food Res. Int. 2020, 132, 109098. [Google Scholar] [CrossRef]
- Bittencourt, L.L.D.A.; Silva, K.A.; De Sousa, V.P.; Fontes-Sant’Ana, G.C.; Rocha-Leão, M.H. Blueberry Residue Encapsulation by Ionotropic Gelation. Plant Foods Hum. Nutr. 2018, 73, 278–286. [Google Scholar] [CrossRef]
- Chen, J.; Fang, W.; Liu, W.; Liu, J.; Gong, P. Microcapsules and Nanoliposomes Based Strategies to Improve the Stability of Blueberry Anthocyanins. Molecules 2023, 28, 7344. [Google Scholar] [CrossRef] [PubMed]
- Żurek, N.; Świeca, M.; Kapusta, I. UPLC-ESI-TQD-MS/MS Identification and Antioxidant, Anti-Inflammatory, Anti-Diabetic, Anti-Obesity and Anticancer Properties of Polyphenolic Compounds of Hawthorn Seeds. Plant Foods Hum. Nutr. 2024. [Google Scholar] [CrossRef] [PubMed]
- Żurek, N.; Kapusta, I.; Cebulak, T. Impact of Extraction Conditions on Antioxidant Potential of Extracts of Flowers, Leaves and Fruits of Hawthorn (Crataegus × Macrocarpa L.). Food Sci. Technol. Qual. 2020, 27, 130–141. [Google Scholar] [CrossRef]
- Gao, X.; Ohlander, M.; Jeppsson, N.; Björk, L.; Trajkovski, V. Changes in Antioxidant Effects and Their Relationship to Phytonutrients in Fruits of Sea Buckthorn (Hippophae Rhamnoides L.) during Maturation. J. Agric. Food Chem. 2000, 48, 1485–1490. [Google Scholar] [CrossRef]
- Lee, J.; Durst, R.W.; Wrolstad, R.E. Determination of Total Monomeric Anthocyanin Pigment Content of Fruit Juices, Beverages, Natural Colorants, and Wines by the pH Differential Method: Collaborative Study. J. AOAC Int. 2005, 88, 1269–1278. [Google Scholar] [CrossRef]
- Re, R.; Pellegrini, N.; Proteggente, A.; Pannala, A.; Yang, M.; Rice-Evans, C. Antioxidant Activity Applying an Improved ABTS Radical Cation Decolorization Assay. Free Radic Biol. Med. 1999, 26, 1231–1237. [Google Scholar] [CrossRef]
- Żurek, N.; Pawłowska, A.M.; Pycia, K.; Potocki, L.; Kapusta, I.T. Quantitative and Qualitative Determination of Polyphenolic Compounds in Castanea Sativa Leaves and Evaluation of Their Biological Activities. Appl. Sci. 2024, 14, 3859. [Google Scholar] [CrossRef]
- Benzie, I.F.F.; Strain, J.J. He Ferric Reducing Ability of Plasma (FRAP) as a Measure of Antioxidant Power: The FRAP Assay. Anal. Biochem. 1996, 239, 70–76. [Google Scholar] [CrossRef]
- Pawłowska, A.M.; Żurek, N.; Kapusta, I.; De Leo, M.; Braca, A. Antioxidant and Antiproliferative Activities of Phenolic Extracts of Eriobotrya Japonica (Thunb.) Lindl. Fruits and Leaves. Plants 2023, 12, 3221. [Google Scholar] [CrossRef] [PubMed]
- Minekus, M.; Alminger, M.; Alvito, P.; Ballance, S.; Bohn, T.; Bourlieu, C.; Carrière, F.; Boutrou, R.; Corredig, M.; Dupont, D.; et al. A Standardised Static In Vitro Digestion Method Suitable for Food—An International Consensus. Food Funct. 2014, 5, 1113–1124. [Google Scholar] [CrossRef] [PubMed]
- Żurek, N.; Pycia, K.; Pawłowska, A.; Kapusta, I.T. Phytochemical Screening and Bioactive Properties of Juglans Regia L. Pollen. Antioxidants 2022, 11, 2046. [Google Scholar] [CrossRef]
- Li, Y.; Lim, L.-T.; Kakuda, Y. Electrospun Zein Fibers as Carriers to Stabilize (−)-Epigallocatechin Gallate. J. Food Sci. 2009, 74, C233–C240. [Google Scholar] [CrossRef] [PubMed]
- Rocha, J.D.C.G.; De Barros, F.A.R.; Perrone, Í.T.; Viana, K.W.C.; Tavares, G.M.; Stephani, R.; Stringheta, P.C. Microencapsulation by Atomization of the Mixture of Phenolic Extracts. Powder Technol. 2019, 343, 317–325. [Google Scholar] [CrossRef]
- Fernandes, I.; Faria, A.; Calhau, C.; De Freitas, V.; Mateus, N. Bioavailability of Anthocyanins and Derivatives. J. Funct. Foods 2014, 7, 54–66. [Google Scholar] [CrossRef]
- Tan, C.; Sun, Y.; Yao, X.; Zhu, Y.; Jafari, S.M.; Sun, B.; Wang, J. Stabilization of Anthocyanins by Simultaneous Encapsulation-Copigmentation via Protein-Polysaccharide Polyelectrolyte Complexes. Food Chem. 2023, 416, 135732. [Google Scholar] [CrossRef]
- Quirós-Sauceda, A.E.; Palafox-Carlos, H.; Sáyago-Ayerdi, S.G.; Ayala-Zavala, J.F.; Bello-Perez, L.A.; Álvarez-Parrilla, E.; De La Rosa, L.A.; González-Córdova, A.F.; González-Aguilar, G.A. Dietary Fiber and Phenolic Compounds as Functional Ingredients: Interaction and Possible Effect after Ingestion. Food Funct. 2014, 5, 1063–1072. [Google Scholar] [CrossRef]
- Bhatia, N.K.; Raj Tomar, V.; Ishika; Kishor, S.; Deep, S. Effect of pH and Temperature on Physicochemical Properties, Aggregation Behaviour and Degradation Kinetics of Quercetin and Baicalein in Nearly Aqueous Media. J. Mol. Liq. 2022, 366, 120236. [Google Scholar] [CrossRef]
- Martinović, J.; Ambrus, R.; Planinić, M.; Šelo, G.; Klarić, A.-M.; Perković, G.; Bucić-Kojić, A. Microencapsulation of Grape Pomace Extracts with Alginate-Based Coatings by Freeze-Drying: Release Kinetics and In Vitro Bioaccessibility Assessment of Phenolic Compounds. Gels 2024, 10, 353. [Google Scholar] [CrossRef] [PubMed]
- Lachowicz, S.; Świeca, M.; Pejcz, E. Improvement of Health-Promoting Functionality of Rye Bread by Fortification with Free and Microencapsulated Powders from Amelanchier Alnifolia Nutt. Antioxidants 2020, 9, 614. [Google Scholar] [CrossRef] [PubMed]
- Clifford, M.N.; Jaganath, I.B.; Ludwig, I.A.; Crozier, A. Chlorogenic Acids and the Acyl-Quinic Acids: Discovery, Biosynthesis, Bioavailability and Bioactivity. Nat. Prod. Rep. 2017, 34, 1391–1421. [Google Scholar] [CrossRef]
- Kasprzak-Drozd, K.; Oniszczuk, T.; Soja, J.; Gancarz, M.; Wojtunik-Kulesza, K.; Markut-Miotła, E.; Oniszczuk, A. The Efficacy of Black Chokeberry Fruits against Cardiovascular Diseases. IJMS Int. J. Mol. Sci. 2021, 22, 6541. [Google Scholar] [CrossRef]
- Sriamornsak, P.; Sungthongjeeh, S. Modification of Theophylline Release with Alginate Gel Formed in Hard Capsules. AAPS PharmSciTech 2007, 8, E1–E8. [Google Scholar] [CrossRef]
- Park, S.-A.; Ahn, J.-B.; Choi, S.-H.; Lee, J.-S.; Lee, H.G. The Effects of Particle Size on the Physicochemical Properties of Optimized Astaxanthin-Rich Xanthophyllomyces Dendrorhous-Loaded Microparticles. LWT Food Sci. Technol. 2014, 55, 638–644. [Google Scholar] [CrossRef]
- Omer, A.M.; Tamer, T.M.; Hassan, M.A.; Rychter, P.; Mohy Eldin, M.S.; Koseva, N. Development of Amphoteric Alginate/Aminated Chitosan Coated Microbeads for Oral Protein Delivery. Int. J. Biol. Macromol. 2016, 92, 362–370. [Google Scholar] [CrossRef]
- Da Silva Carvalho, A.G.; Da Costa Machado, M.T.; Da Silva, V.M.; Sartoratto, A.; Rodrigues, R.A.F.; Hubinger, M.D. Physical Properties and Morphology of Spray Dried Microparticles Containing Anthocyanins of Jussara (Euterpe Edulis Martius) Extract. Powder Technol. 2016, 294, 421–428. [Google Scholar] [CrossRef]
- Molino, S.; Rufián Henares, J.Á.; Gómez-Mascaraque, L.G. Tannin-Rich Extracts Improve the Performance of Amidated Pectin as an Alternative Microencapsulation Matrix to Alginate. Curr. Res. Food Sci. 2022, 5, 243–250. [Google Scholar] [CrossRef]
- Wu, A.; Gao, Y.; Kan, R.; Ren, P.; Xue, C.; Kong, B.; Tang, Q. Alginate Oligosaccharides Prevent Dextran-Sulfate-Sodium-Induced Ulcerative Colitis via Enhancing Intestinal Barrier Function and Modulating Gut Microbiota. Foods 2023, 12, 220. [Google Scholar] [CrossRef]
- Stavarache, C.E.; Ghebaur, A.; Dinescu, S.; Samoilă, I.; Vasile, E.; Vlasceanu, G.M.; Iovu, H.; Gârea, S.A. 5-Aminosalicylic Acid Loaded Chitosan-Carrageenan Hydrogel Beads with Potential Application for the Treatment of Inflammatory Bowel Disease. Polymers 2021, 13, 2463. [Google Scholar] [CrossRef] [PubMed]
- Trivedi, P.; Saloranta-Simell, T.; Maver, U.; Gradišnik, L.; Prabhakar, N.; Smått, J.-H.; Mohan, T.; Gericke, M.; Heinze, T.; Fardim, P. Chitosan–Cellulose Multifunctional Hydrogel Beads: Design, Characterization and Evaluation of Cytocompatibility with Breast Adenocarcinoma and Osteoblast Cells. Bioengineering 2018, 5, 3. [Google Scholar] [CrossRef] [PubMed]
- Sookkasem, A.; Chatpun, S.; Yuenyongsawad, S.; Wiwattanapatapee, R. Alginate Beads for Colon Specific Delivery of Self-Emulsifying Curcumin. J. Drug Deliv. Sci. Technol. 2015, 29, 159–166. [Google Scholar] [CrossRef]
- Abdellatif, A.A.H.; Ibrahim, M.A.; Amin, M.A.; Maswadeh, H.; Alwehaibi, M.N.; Al-Harbi, S.N.; Alharbi, Z.A.; Mohammed, H.A.; Mehany, A.B.M.; Saleem, I. Cetuximab Conjugated with Octreotide and Entrapped Calcium Alginate-Beads for Targeting Somatostatin Receptors. Sci. Rep. 2020, 10, 4736. [Google Scholar] [CrossRef]
- Jain, S.; Lenaghan, S.; Dia, V.; Zhong, Q. Co-Delivery of Curcumin and Quercetin in Shellac Nanocapsules for the Synergistic Antioxidant Properties and Cytotoxicity against Colon Cancer Cells. Food Chem. 2023, 428, 136744. [Google Scholar] [CrossRef]
- Bal, Y.; Sürmeli, Y.; Şanlı-Mohamed, G. Antiproliferative and Apoptotic Effects of Olive Leaf Extract Microcapsules on MCF-7 and A549 Cancer Cells. ACS Omega 2023, 8, 28984–28993. [Google Scholar] [CrossRef]
- Kim, K.H.; Ki, M.-R.; Min, K.H.; Pack, S.P. Advanced Delivery System of Polyphenols for Effective Cancer Prevention and Therapy. Antioxidants 2023, 12, 1048. [Google Scholar] [CrossRef]
- Duda-Chodak, A.; Tarko, T. Possible Side Effects of Polyphenols and Their Interactions with Medicines. Molecules 2023, 28, 2536. [Google Scholar] [CrossRef]

Disclaimer/Publisher’s Note: The statements, opinions and data contained in all publications are solely those of the individual author(s) and contributor(s) and not of MDPI and/or the editor(s). MDPI and/or the editor(s) disclaim responsibility for any injury to people or property resulting from any ideas, methods, instructions or products referred to in the content. |
© 2024 by the authors. Licensee MDPI, Basel, Switzerland. This article is an open access article distributed under the terms and conditions of the Creative Commons Attribution (CC BY) license (https://creativecommons.org/licenses/by/4.0/).