Abstract
Computed tomography (CT) is the primary source of diagnostic radiation in pediatric patients. Patient head size and tissue attenuation are critical factors for estimating CT radiation doses. This study aimed to determine a size-specific dose estimate based on the water-equivalent diameter (SSDEDw) for pediatric CT head examinations, categorized by age group, and to investigate the parameters influencing the SSDEDw. This retrospective analysis included 274 pediatric patients aged 0 to 15 years who underwent non-contrast CT head examinations using an age-based protocol without automatic exposure control systems. The SSDEDw was calculated using the CTDIvol, and the conversion factor was derived from AAPM Report No. 293, based on the water-equivalent diameter (Dw). We found that the SSDEDw of age groups of 0 to 6 months, 6 months to 3 years, 3 to 6 years, 6 to 12 years, and 12 to 15 years were 15.4 (14.8, 15.8), 20.1 (19.6, 20.6), 25.3 (24.6, 25.7), 28.1 (27.3, 28.8), and 35.1 (34.6, 36) mGy, respectively. Age and body weight significantly affected the SSDEDw, with high R-squared values of 0.87 and 0.63, respectively (p < 0.001). The SSDE, particularly when based on the water-equivalent diameter (SSDEDW), is a valuable supplement to the DLP and the CTDIvol as it closely relates to patient dose, especially for pediatric head scans of different patient sizes.
1. Introduction
Computed tomography (CT) is one of the best modalities for low-contrast imaging in humans. In the 1970s, the first clinical CT scanner was introduced for performing head scans on patients [1,2]. Pediatric head CT scans are the most common procedures performed for the diagnosis and follow-up of diseases, including trauma (23%), infections (22%), headaches (17%), and other medical concerns (38%) [3]. Advancements in CT image quality and reductions in acquisition time have led to a significant increase in CT utilization, establishing it as the primary source of diagnostic radiation exposure for pediatric patients [1,2]. According to the National Council on Radiation Protection and Measurements (NCRP) Report No. 184, in 2016, approximately 5.2 million pediatric patients in the United States underwent CT examinations, accounting for 6.3% of the total annual CT examinations. Head procedures constituted 55% of the CT procedures performed among these pediatric patients, resulting in a collective effective dose of 5.7 person-Sv [4,5]. The radiation dose delivered to patients, particularly children and infants, should be carefully considered due to their increased susceptibility to radiation compared with adults [3,4,6,7]. Additionally, children have a heightened risk of radiation-induced cancer, and the lifetime attributable risk (LAR) of cancer resulting from a single head CT scan can be over ten times greater in infants than in middle-aged adults [8].
Radiation exposure from CT is typically quantified using specific dose metrics, including the volumetric CT dose index (CTDIvol) (mGy) and dose–length product (DLP) (mGy·cm). The CTDIvol, which quantifies the output from the CT scanner and is displayed on the CT scanner control prior to the scan, depends on various parameters, including the tube current–time product (mAs), tube potential (kVp), pitch, and gantry rotation time [2,9,10]. The CTDIvol is a standardized method for comparing the radiation dose output among different CT scanners using a reference phantom. However, the CTDIvol does not account for patient size, shape, or attenuation, making it inaccurate as a patient dose metric since it is determined from a polymethyl methacrylate (PMMA) cylindrical phantom of a particular size. One phantom has a diameter of 16 cm, corresponding to the size of the head, whereas the other phantom has a diameter of 32 cm, corresponding to the size of the body. Both phantoms are 15 cm in length [9,11,12]. Indeed, the patient radiation dose should consider both the output radiation dose from the CT scanner and the patient’s attenuation.
The American Association of Physicists in Medicine (AAPM) introduced the size-specific dose estimate (SSDE) by developing conversion factors applied to the CTDIvol to estimate the patient radiation dose while considering patient size. The inception of the size-dependent conversion factor began with AAPM Report No. 204, which focused on patient geometry, such as the anteroposterior and lateral dimensions or effective diameter, specifically for CT imaging of the abdomen and pelvis [9]. AAPM Report No. 220 introduced the use of the water-equivalent diameter (Dw), which considers tissue attenuation and patient geometry size, to more accurately estimate the SSDE when applied to the abdominal and thoracic regions [9,13,14,15]. AAPM Report No. 293 introduced the SSDE based on the water-equivalent diameter (SSDEDw) for head CT examinations, which estimates the patient radiation dose based on the CTDIvol and a conversion factor specific to the head region, determined based on the Dw. The head SSDE conversion factor was derived from a study combining physical measurements using phantoms and ionization chambers with Monte Carlo simulations across various models of CT scanners [14].
Many studies have investigated the SSDE in pediatric patients by applying conversion factors from AAPM Report No. 293 [7,16,17,18]. These studies used protocols with milliampere (mA) settings determined by automatic exposure control (AEC) software. Fujii et al. [17] investigated the SSDE for pediatric head CT protocols and reported the relationship between the SSDE and age and weight. Jaramillo-Garzón et al. [16] determined the SSDE to establish typical diagnostic reference levels for different age groups.
Currently, various clinical protocols for CT head examinations of pediatric patients aim to minimize radiation exposure to the lowest possible level while maintaining sufficient diagnostic quality, in accordance with the “As Low As Reasonably Achievable” principle. At our institution, pediatric patients undergo CT head examinations using helical acquisition and non-contrast-enhanced scanning protocols for the diagnosis and follow-up of lesions in the head region. Radiation doses are determined using age-based protocols that specify mA and kVp settings without utilizing the AEC system. To obtain radiation dose estimates that more closely correspond to patient dose, the SSDEDw should be implemented to estimate patient radiation doses from CT head scans in pediatric patients, using the conversion factors from AAPM Report No. 293. This study aimed to determine the SSDEDw for CT head examinations of pediatric patients, classified according to age groups, and to investigate the parameters influencing the SSDEDw.
2. Materials and Methods
2.1. Data Population
This retrospective study utilized data from Songklanagarind Hospital and was approved by the Institutional Review Board of the Faculty of Medicine at Songklanagarind Hospital. The cohort comprised 274 pediatric patients, including 96 female and 178 male patients, aged 0 to 15 years. Data were collected from pediatric patients who underwent non-contrast-enhanced CT head examinations between January 2017 and October 2019 using the 80-detector-row CT scanner Aquilion Prime (Canon Medical Systems, Otawara, Japan). Patient data and dose information were retrieved from Synapse PACS software version 4.3.2.1 and the Radimetrics™ Enterprise Platform dose-monitoring software, version 3.4 (Bayer HealthCare, Whippany, NJ, USA). Pediatric patients with incomplete skull coverage, the presence of intracranial devices, or skull contours not visible in the field of view (FOV) reconstruction were excluded from this study.
2.2. Patient Radiation Dose Determination
CT head scans were performed in the helical mode with fixed exposure parameters (tube potential (kVp) and tube current (mA)) and without an AEC system. Patient data were categorized into five age groups based on clinical protocol settings as follows: for ages 0 to 6 months, the settings were 80 kVp and 220 mA; for ages 6 months to 3 years, 80 kVp and 330 mA; for ages 3 to 6 years, 100 kVp and 240 mA; for ages 6 to 12 years, 120 kVp and 180 mA; for ages 12 to 15 years, 120 kVp with a current range of 230 to 300 mA. The scanned region extended from the base of the skull to the vertex. The CTDIvol was determined using a 16 cm cylindrical phantom for all protocols.
The CTDIvol displayed on the CT monitor was verified following the quality assurance guidelines in International Atomic Energy Agency (IAEA) Report No. 19 [19]. The CTDIvol was estimated by performing axial scans of a 16 cm diameter and 15 cm length PMMA phantom using a pencil-type ionization chamber (RaySafe Model X2, Unfors RaySafe AB, Havas, Stockholm, Sweden) at kVp settings ranging from 80 to 120. The ionization chamber was calibrated at the Secondary Standard Dosimetry Laboratory (SSDL) of Thailand. CT radiation dose parameters, including the CTDIvol (mGy) and DLP (mGy·cm) obtained from the Radimetrics™ Enterprise Platform as well as organ doses (mGy) for the brain and eye lens, were determined using Monte Carlo simulation.
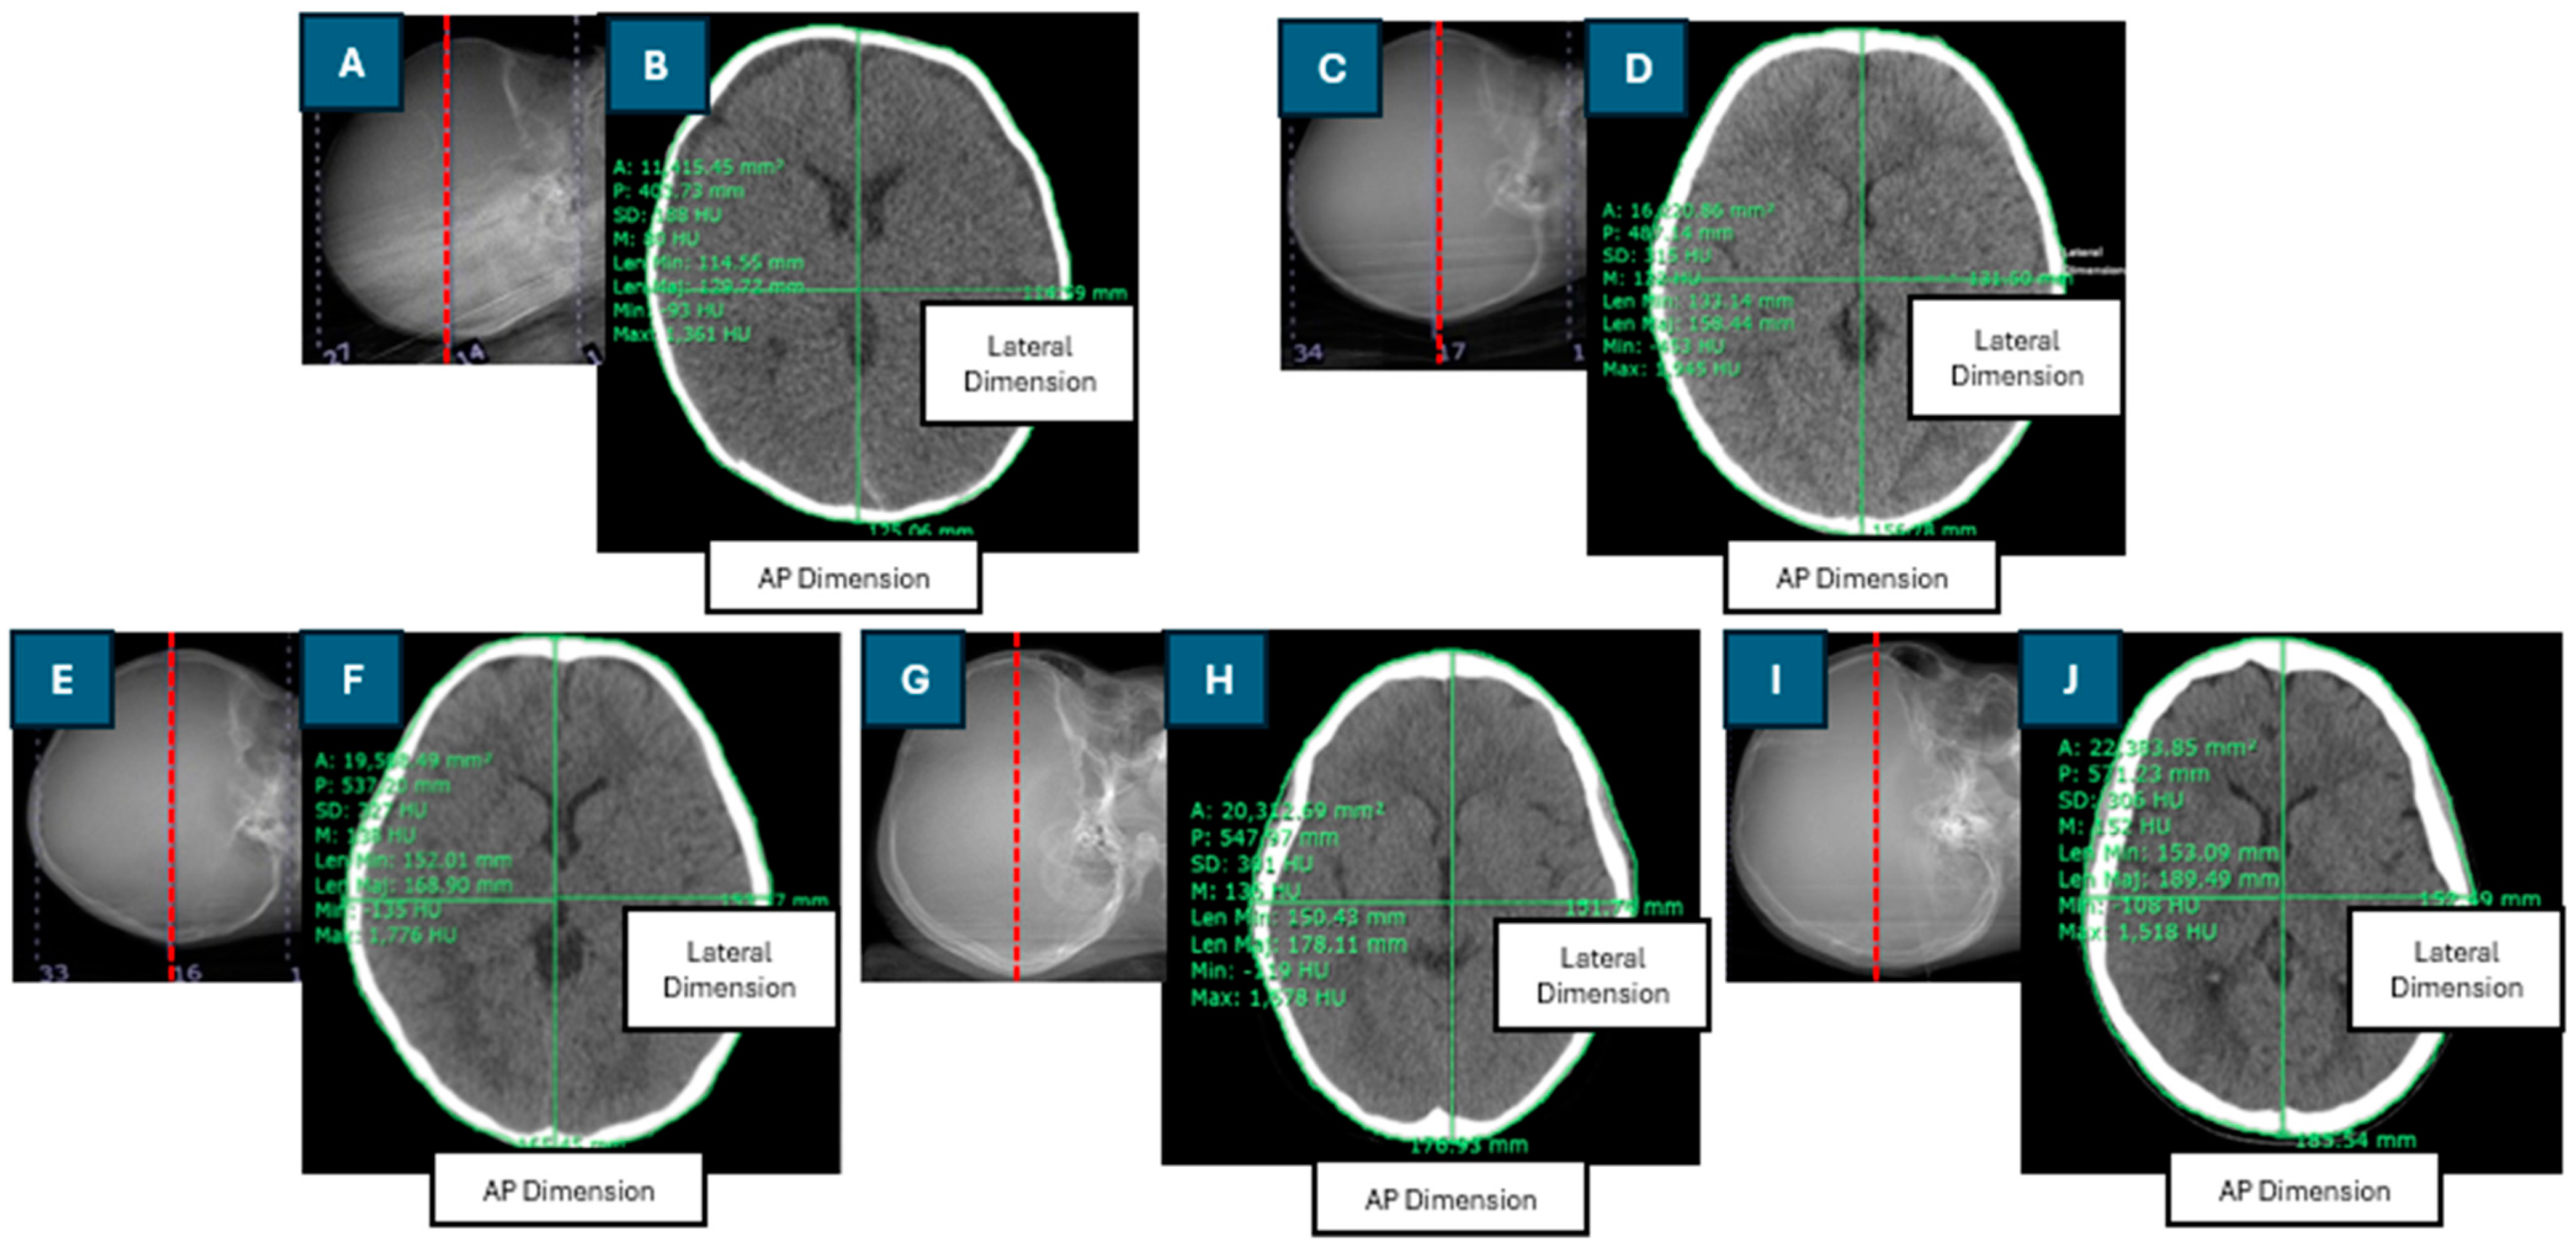
The Dw was calculated using the axial cross-sectional CT image of the brain, selected as the middle slice of the scan length. Patient dimensions and regions of interest (ROIs) were manually drawn using digital calipers and freehand ROI tools within the Synapse software version 4.3.2.1. An ROI was drawn around the perimeter of each patient’s head. The effective diameter (DEff) is the diameter of a circle with an area equivalent to the cross-sectional area of the patient [9]. The DEff was calculated as the square root of the product of the anteroposterior (AP) and lateral (LAT) dimensions. Figure 1 depicts the positioning of the central slice of the scan length in the CT scanogram, the contouring of the region of interest (ROI), and the measurement of anteroposterior (AP) and lateral (LAT) dimensions in the axial cross-sectional CT images for pediatric patients of various ages.
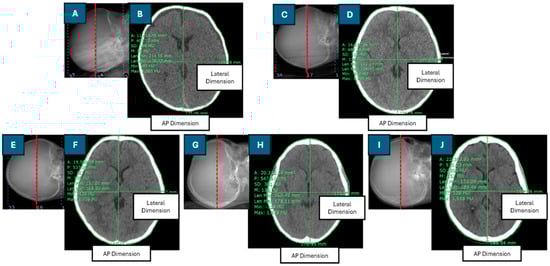
Figure 1.
Positioning of the central slice of the scan length on the CT scanogram and contouring of the region of interest and anteroposterior (AP) and lateral dimensions in the axial cross-sectional CT image in head examinations of pediatric patients of different ages: (A,B): 2-month-old; (C,D): 1-year-old; (E,F): 5-year-old; (G,H): 10-year-old; (I,J): 12-year-old.
The SSDEDw was computed by multiplying the conversion factor (fDw) by the CTDIvol. The conversion factor, fDw, is derived based on the patient size (Dw) and the absorbed dose to tissue [14]. The SSDEDw and fDw were calculated using Equations (1) and (2), respectively.
where α represents the absorbed dose to tissue (mGy/CTDIvol,16), with a value of 1.9852 mGy, and β is the coefficient, with a value of 0.0486 cm−1. Dw is the water-equivalent diameter (cm), as determined by Equation (3):
where represents the mean CT number (HU) within the ROI in the axial cross-sectional CT image of the head and AROI is the total area of the ROI (cm2).
2.3. Statistical Analysis
Statistical analyses of the patient demographic data and radiation doses were performed using SPSS version 22 (IBM Corp., Armonk, NY, USA) and R Studio version 1.4.1103. Descriptive statistics were summarized for the patient demographics and radiation doses, including their mean, standard deviation, median, interquartile range (IQR), and range (minimum to maximum). Univariate and multivariate linear regression models were used to analyze the factors affecting the SSDEDw.
3. Results
3.1. Population Data
The study included 274 pediatric patients comprising 96 female and 178 male patients aged 0 to 15 years. Table 1 presents the number of patients, body weight, effective diameter (Dw), and scan length categorized into five age groups. As the age increased, the median body weight (kg), effective diameter (cm), Dw (cm), and scan length (mm) increased. The median effective diameter was consistently less than the median Dw across all age groups. For the 0 to 6 months age group, the difference between the effective diameter and the Dw was not significant (p > 0.05). However, for the age groups of 6 months to 3 years, 3 to 6 years, 6 to 12 years, and 12 to 15 years, the differences between the effective diameter and the Dw were significant (p < 0.05).

Table 1.
Patient data categorized into five age groups for pediatric computed tomography head examinations.
The correlation between the Dw and the effective diameter was relatively weak, with an R-squared value of 0.31 and a significant difference (p < 0.001).
3.2. Patient Radiation Dose Determination
The percent differences between the CTDIvol displayed on the CT scanner monitors and the measured CTDIvol were within the acceptable limit of ±20%.
Table 2 shows the patient radiation doses for CT brain scanning protocols across the five age groups. The CTDIvol values were consistent across the age groups of 0 to 6 months, 6 months to 3 years, 3 to 6 years, and 6 to 12 years. The CTDIvol for the 12-to-15-year age group showed a slight variation, with a median (IQR) value of 40.1 (40.1, 41.2) mGy. The CTDIvol increased with age, and, similarly, the median values of DLP and organ doses in the brain and eye lenses also increased with age.
Table 2.
Patient radiation dose categorized into five age groups for computed tomography head examinations.
Although the CTDIvol remained consistent within each age group, the SSDEDw values varied. In the 0-to-6-month age group, the CTDIvol values were lower than the median SSDEDw, whereas it exceeded the median SSDEDw in all other age groups.
The total area in the ROI (cm2) in the cross-sectional head images is presented as the mean ± SD (minimum–maximum) for different age groups: 115.48 ± 21.24 (81.95–168.18) cm2 for the age group of 0 to 6 months, 160.77 ± 20.10 (122.79–209.41) cm2 for the age group of 6 months to 3 years, 174.78 ± 13.85 (141.55–230.73) cm2 for the age group of 3 to 6 years, 190.82 ± 13.34 (160.25–216.65) cm2 for the age group of 6 to 12 years, and 200.46 ± 11.78 (175.54–216.65) cm2 for the age group of 12 to 15 years.
The mean ± SD (minimum–maximum) of the conversion factor for CTDIvol to SSDEDw for the CT head exams, as a function of the Dw for the different age groups, are as follows: 1.08 ± 0.06 (0.95–1.19) for the age group of 0 to 6 months, 0.95 ± 0.05 (0.86–1.05) for the age group of 6 months to 3 years, 0.92 ± 0.03 (0.83–0.99) for the age group of 3 to 6 years, 0.89 ± 0.03 (0.85–0.96) for the age group of 6 to 12 years, and 0.87 ± 0.02 (0.82–0.93) for the age group of 12 to 15 years. The conversion factor and age showed a strong negative correlation (r = −0.70), which was significant (p < 0.001).
The linear analysis of the relationship between patient head size, Dw, and SSDE revealed a strong negative correlation. The R-squared values for the different age groups were as follows: 0.9986 for the age group of 0 to 6 months, 0.9989 for the age group of 6 months to 3 years, 0.9993 for the age group of 3 to 6 years, 0.9998 for the age group of 6 to 12 years, and 0.6475 for the age group of 12 to 15 years, all of which were statistically significant (p < 0.001). Additionally, a strong negative correlation was observed between the conversion factor and Dw, with an R-squared value of 0.9975, which was statistically significant (p < 0.001).
Figure 2 shows a box plot of the mean CT numbers within the ROI (HU) across the five age groups. The median value for the 0-to-6-month age group was lower than that of the other age groups. The median value for the 6-month-to-3-year age group was slightly lower than that for the 3-to-6-year age group. However, the median value for the 6-to-12-year age group was lower than that for the 6-month-to-3-year and 3-to-6-year age groups. The 12-to-15-year age group exhibited the highest median value of the mean CT number within the ROI.
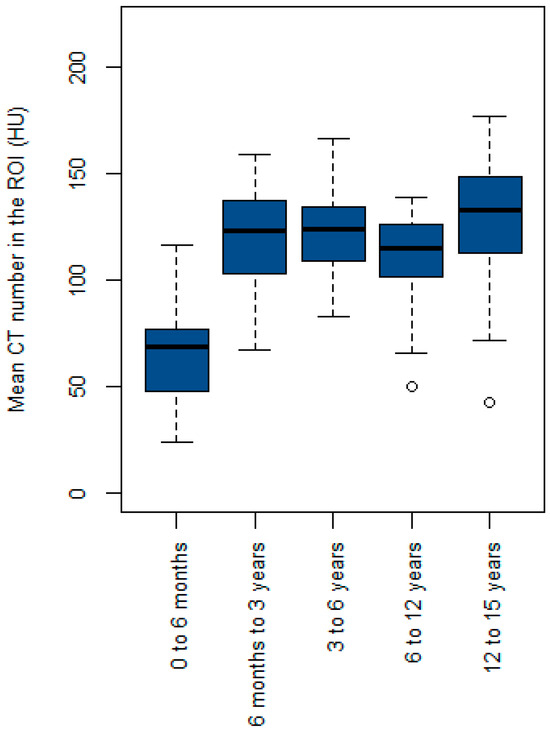
Figure 2.
Box plot of the mean CT number in the region of interest (ROI) (HU) across the five age groups.
Table 3 presents the model and evaluation metrics derived from both the univariate and multivariate linear regression analyses. The univariate analysis indicated a significantly high R-squared value (0.87) for the SSDEDw with age and a moderately R-squared value (0.63) with weight. Both models demonstrated statistical significance (p < 0.001). Multivariate linear regression analysis revealed that the model of the SSDEDw with age and weight exhibited a relatively high R-squared value of 0.87, which was significant (p < 0.001) and had a low residual standard error (RSE).
Table 3.
Univariate and multivariate linear regression of the SSDEDw and Dw with age and weight.
The model was derived from the univariate linear regression of the Dw with age and weight and showed R-squared values of 0.50 and 0.47, respectively, which were significant (p < 0.001). The multivariate linear regression analysis of the Dw with age and weight yielded a moderate R-squared value of 0.52, which was significant (p < 0.001) and had a low RSE.
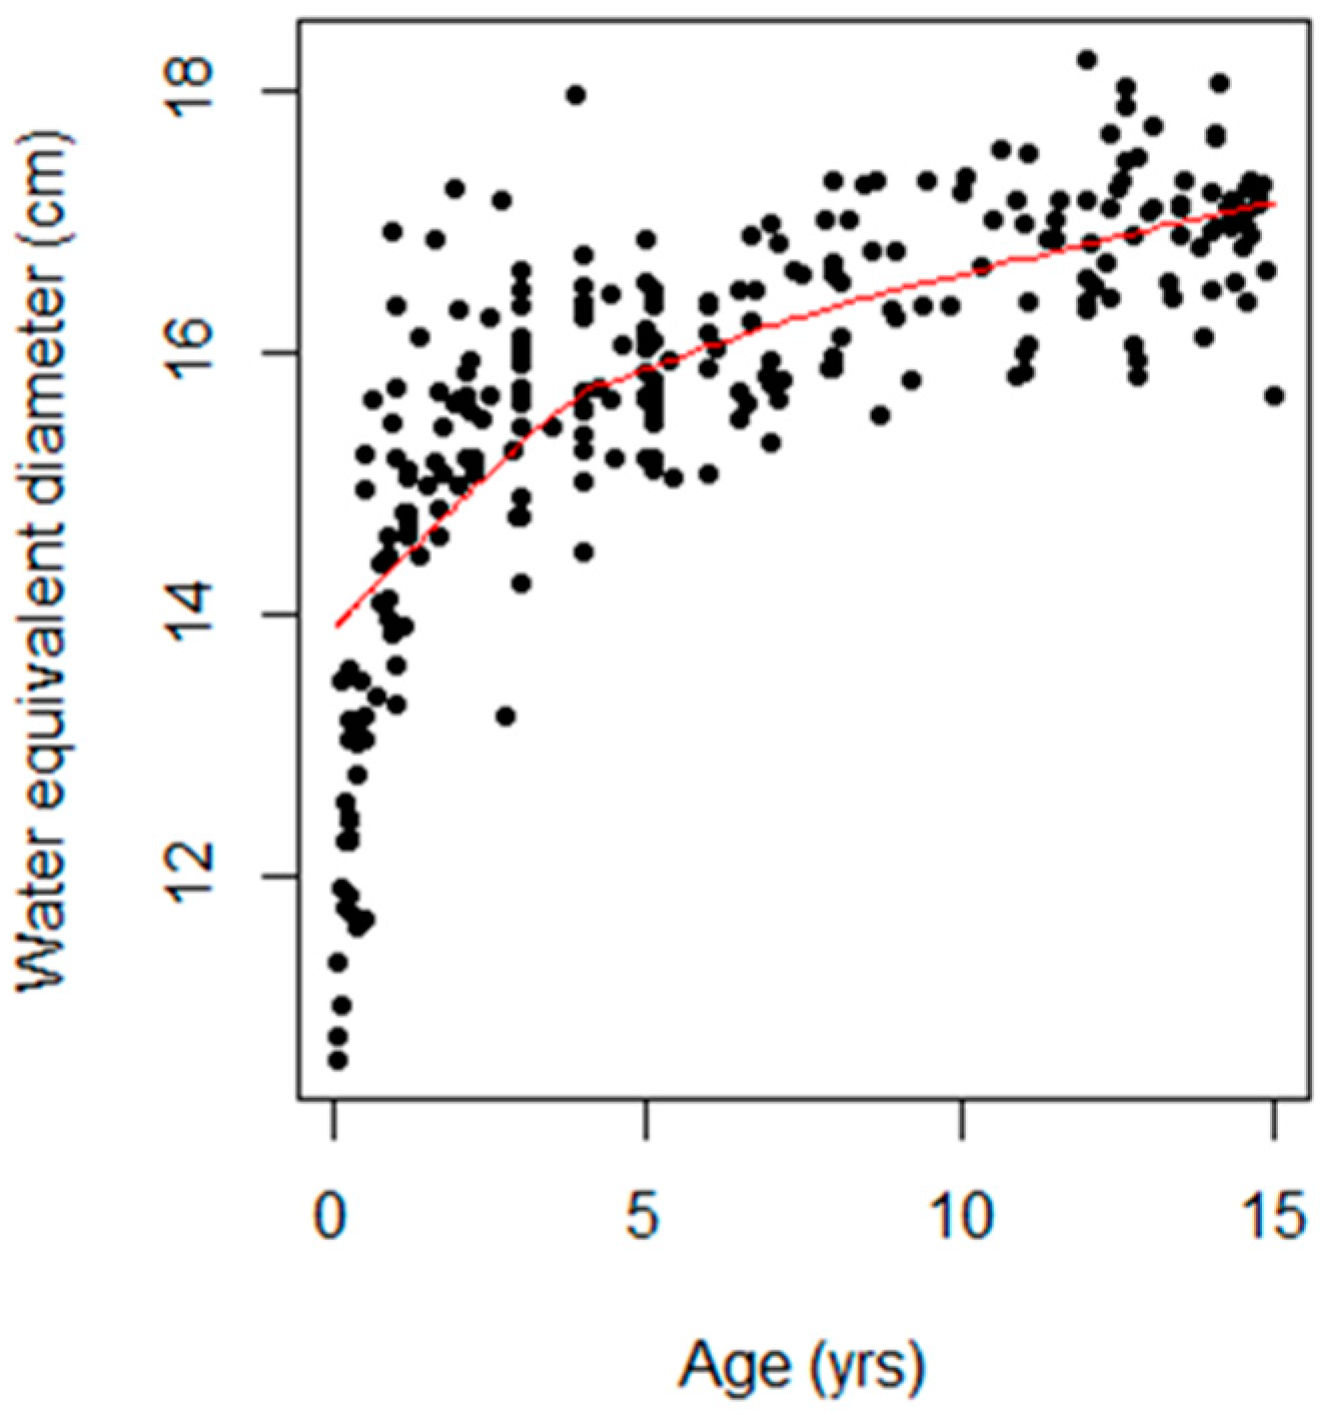
Figure 3 shows a scatterplot of the association between age and Dw, with the trend highlighted by a locally weighted scatterplot smoothing (LOWESS) curve shown as a red line. Noticeably, the Dw value was the lowest during early infancy and increased with age.

Figure 3.
Scatter plot showing the relationship between age (years) and water-equivalent diameter (cm). The black dots represent individual data points, each corresponding to a specific age and its associated water-equivalent diameter. The trend is highlighted by a red line representing a locally weighted scatterplot smoothing (LOWESS) curve.
4. Discussion
In this study, the SSDEDw was estimated for 274 pediatric patients aged 0 to 15 years, and factors influencing the SSDEDw were evaluated. The SSDE based on the water-equivalent diameter (SSDEDW) was calculated using the conversion factor for the CTDIvol to SSDEDW for CT head exams, which was obtained from AAPM Report No. 293. The Dw was derived from the middle slice of the scan length, with the scan region defined as the area extending from the base of the skull to the vertex. The axial cross-sectional CT image from infants and older children encompassed several major components, including brain tissue, the cerebral cortex, ventricles, white matter, gray matter, and skull bones, as illustrated in Figure 1. Each of these components exhibited distinct CT numbers (HU). Additionally, radiation doses, including the CTDIvol, DLP, and organ dose for the brain CT protocol were determined.
As shown in Table 1, head size, represented by the effective diameter and the Dw, increased with age. This led to an increase in scan length and, consequently, in the DLP. The effective diameter and the Dw exhibited slight differences in mean values among all the age groups; however, the Dw was computed from the attenuation area product of the patients, whereas the effective diameter considers only the physical dimensions. This finding aligns with Fahmi et al.’s [20] study on pediatric patient sizes across age groups, which reported that both the effective diameter and the Dw increased with age.
Table 2 reveals that the CTDIvol was higher than the median SSDEDw for all groups except the 0-to-6-month age group. This discrepancy is attributed to a conversion factor greater than 1 in the 0-to-6-month age group, where the Dw is less than 14 cm. Conversely, other age groups had a conversion factor less than 1 when the Dw exceeded 14 cm. The percent relative differences in the radiation dose from the CTDIvol to the SSDEDw were as follows: 0 to 6 months, 8.4%; 6 months to 3 years, 5.0%; 3 to 6 years, 8.3%; 6 to 12 years, 11.74%; and 12 to 15 years, 14.3%. These differences are due to variations in head size and X-ray attenuation factors. Christner et al. [21] similarly found that the SSDE values differ between small and large patients, even with the same CTDIvol.
The CTDIvol is measured using a cylindrical phantom with a diameter of 16 cm; however, the pediatric head is not cylindrical and varies in size and density. Sapignoli et al. [7] reported the Dw (mean ± SD) and SSDEDw (median (IQR)) for patients aged 0 to 6 months and 6 months to 3 years: The Dw was 12.4 ± 1.2 cm and 14.9 ± 0.9 cm, respectively, whereas the SSDEDw for both groups was comparable, with values of 23 (21, 25) mGy and 23 (22, 25) mGy, respectively. The CTDIvol values were 23 (19, 23) and 23 (23, 25) mGy, respectively. Our study found that the mean ± SD of the Dw for the 0-to-6-month age group was lower than that for the 6-month-to-3-year age group, with values of 12.47 ± 1.13 and 15.13 ± 1.01 cm, respectively. Similarly, the SSDEDw was lower in the 0-to-6-month age group compared with the 6-month-to-3-year age group. The median (IQR) SSDEDw values were 15.4 (14.8, 15.8) and 20.1 (19.6, 20.6) mGy, respectively. The CTDIvol values were 14.1 and 21.1 mGy, respectively (Table 2).
The relationship between patient head size, as a function of the Dw and the SSDE, demonstrated a strong negative correlation in the younger age groups, with R-squared values of approximately 0.99 (p < 0.001). In the 12-to-15-year age group, a moderate correlation was observed, with an R-squared value of 0.64 (p < 0.001). In contrast, the relationship between the Dw and the CTDIvol appeared negligible, as CTDIvol values remained constant within the same age groups, indicating that the Dw and the CTDIvol are nearly independent, with the CTDIvol not varying sufficiently to reflect differences in patient head size.
Pearce et al. [22] estimated absorbed doses to the brain using data from hybrid computational human phantoms and Monte Carlo radiation transport techniques; these were found to range from 28 to 43 mGy in pediatric patients aged 0 to 15 years. In our study, using Monte Carlo simulations based on stylized computational phantoms, we found that the brain dose in pediatric patients ranged from 21 to 39.5 mGy.
Table 2 shows that organ doses to the brain and eye lenses increase with age due to higher radiation exposure. The median (IQR) organ dose to the eye lens in the 12-to-15-year age group was the highest at 50.1 (49.9, 52) mGy. The eye lens is highly radiosensitive, and radiation exposure from a CT brain scan poses risks such as cancer and cataracts [23]. Thus, careful scan positioning to avoid radiation exposure to the eye lens is essential. Proper patient positioning, such as aligning scans along the supraorbital meatal line, can help minimize radiation exposure to the lens [24,25]. Although a single brain CT scan may not pose an immediate cancer risk, pediatric patients may undergo multiple scans, increasing the cumulative absorbed dose and the potential for developing cancer later in life [6,25].
Figure 2 shows that the median mean CT number in the ROI (HU) for the 6-to-12-year age group was lower than that for the 6-month-to-3-year and 3-to-6-year age groups. This is primarily due to a higher incidence of hypodense lesions and hydrocephalus in pediatric patients aged 6 to 12 years, which contributes to lower mean CT numbers. Notably, there were outliers in the 6-to-12-year and 12-to-15-year age groups, with mean CT numbers of 50 HU and 43 HU, respectively, which were attributed to specific clinical conditions: bilateral subdural fluid collection and pneumocephalus in the former case, and multiple pneumocephalus and moderate hydrocephalus in the frontal lobe in the latter.
Head size as a function of the Dw increased with age (Figure 3), consistent with Shohji et al.’s [18] investigation of the SSDE using pediatric helical head CT protocols.
The correlation between the conversion factor and age indicates a strong negative relationship, with a correlation coefficient of r = −0.70, indicating that the conversion factor decreases with age. This is consistent with Fujii et al.’s [17] findings. Their study reported that the relationship between the SSDE and age and weight in pediatric brain CT scans, using the AEC system, were best fit by applying a power function, resulting in mean estimation errors close to 0, with R-square values of 0.71 and 0.86, respectively.
In our study, the evaluation metrics, R-squared and RSE, improved when age and weight were applied to the multivariate linear regression model (Table 3). Given the complexity of estimating the SSDEDw, a mathematical model can be used to predict the SSDEDw. The equation for the multiple linear regression model is SSDEDw = 18.64 + 1.34(age) − 0.04(weight). This model, with an R-squared value of 0.87 and an RSE of 2.26, indicates that its predictions closely approximate the true values, demonstrating high predictive accuracy. This finding is particularly useful for medical physicists, radiologists, and radiological technologists, as it enables efficient assessment of the radiation dose received by pediatric patients, specifically the SSDEDw, for the justification and optimization of CT brain imaging protocols.
The limitations of our study include the manual contouring of patient size, measured as the Dw at the middle slice of the brain. Although manual measurement benefits clinical users (physicians and radiological technologists) by reducing costs compared with purchasing commercial software, it may introduce variability if performed by less experienced personnel and may be time-consuming. Automatic segmentation is recommended for drawing ROIs. Additionally, this study used data from pediatric patients scanned with a single helical CT brain scan protocol without AEC. This study categorized patient data into five age groups, encompassing broad age ranges among pediatric patients. This approach may not fully account for the rapid changes in head size that occur during early childhood. Subdividing the age groups into narrower intervals could potentially yield a more robust correlation between age and head size as a function of the Dw.
5. Conclusions
The SSDEDw increases with age in pediatric patients. The median (IQR) of the SSDEDw values for the age groups of 0 to 6 months, 6 months to 3 years, 3 to 6 years, 6 to 12 years, and 12 to 15 years were 15.4 (14.8, 15.8), 20.1 (19.6, 20.6), 25.3 (24.6, 25.7), 28.1 (27.3, 28.8), and 35.1 (34.6, 36) mGy, respectively. Although the CTDIvol remained consistent within each age group, the SSDEDw varied. The relationship between patient head size, Dw, and SSDE exhibited a strong correlation in the younger age groups, whereas a moderate correlation was observed in the 12-to-15-year age group. The SSDE, particularly when based on the water-equivalent diameter (SSDEDw), is useful for complementing the DLP and CTDIvol, as it closely reflects the patient dose across different pediatric head sizes. The correlation between the conversion factor as a function of the Dw and age indicates a strong negative relationship, with a correlation coefficient of r = −0.70, which is significant (p < 0.001). Head size, as a function of the Dw in pediatric patients and the SSDEDw, increased with age. Univariate analysis indicated that patient age and body weight significantly influenced the SSDEDw, with an R-squared value of 0.87 for the SSDEDw with patient age and an R-squared value of 0.63 for the SSDEDw relative to weight, both of which were significant, with p < 0.001. Multivariate linear regression analysis revealed that the SSDEDw model with age and weight exhibited a high R-squared value of 0.87, which was significant (p < 0.001) and had a low RSE. Therefore, in a multivariate linear regression model, age and body weight effectively predict the SSDEDw.
Author Contributions
Conceptualization, S.P.; methodology, S.P., K.C. and N.K.; software, S.P.; validation, S.P., K.C. and N.K.; formal analysis, S.P., K.C. and N.K.; investigation, S.P., K.C. and N.K.; resources, S.P., K.C. and N.K.; data curation, S.P.; writing—original draft preparation, S.P., K.C. and N.K.; writing—review and editing, S.P.; visualization, S.P.; supervision, S.P.; project administration, S.P. All authors have read and agreed to the published version of the manuscript.
Funding
This research received no external funding.
Institutional Review Board Statement
This study was conducted in accordance with the Declaration of Helsinki and was approved by the Institutional Review Board of the Faculty of Medicine, Prince of Songkla University, Thailand, on 14 April 2020 (approval no. REC. 63-066-7-6).
Informed Consent Statement
Patient consent was waived due to the retrospective nature of the study, which utilized patient information and radiation dose data for the size-specific dose estimation (SSDE). The use of pre-existing data minimized potential risks and did not require direct patient interaction. Additionally, the analysis of anonymized data ensured that patient privacy and confidentiality were maintained throughout the research.
Data Availability Statement
The data supporting the findings of this study are not publicly available due to privacy and ethical restrictions. However, data requests can be directed to the corresponding author.
Acknowledgments
The authors wish to thank Jirawan Jayuphan from the Department of Epidemiology, Faculty of Medicine, Prince of Songkla University, Thailand, for her valuable advice on statistical data analysis.
Conflicts of Interest
The authors declare no conflicts of interest.
References
- Hsieh, J. Computed Tomography: Principles, Design, Artifacts, and Recent Advances, 2nd ed.; Book News, Inc.: Portland, OR, USA, 2010. [Google Scholar]
- Bushberg, J.T.; Seibert, J.A.; Leidholt, E.M., Jr.; Boone, J.M. The Essential Physics of Medical Imaging, 4th ed.; Lippincott Williams & Wilkins: Philadelphia, PA, USA, 2021. [Google Scholar]
- Miglioretti, D.L.; Johnson, E.; Williams, A.; Greenlee, R.T.; Weinmann, S.; Solberg, L.I.; Feigelson, H.S.; Roblin, D.; Flynn, M.J.; Vanneman, N.; et al. The Use of Computed Tomography in Pediatrics and the Associated Radiation Exposure and Estimated Cancer Risk. JAMA Pediatr. 2013, 167, 700–707. [Google Scholar] [CrossRef] [PubMed]
- National Council on Radiation Protection and Measurements. Medical Radiation Exposure of Patients in the United States; NCRP Report 184; NCRP: Bethesda, MD, USA, 2019. [Google Scholar]
- Strauss, K.J.; Goske, M.J.; Kaste, S.C.; Bulas, D.; Frush, D.P.; Butler, P.; Morrison, G.; Callahan, M.J.; Applegate, K.E. Image Gently: Ten Steps You Can Take to Optimize Image Quality and Lower CT Dose for Pediatric Patients. AJR Am. J. Roentgenol. 2010, 194, 868–873. [Google Scholar] [CrossRef] [PubMed]
- National Research Council. Health Risks from Exposure to Low Levels of Ionizing Radiation: BEIR VII Phase 2; The National Academies Press: Washington, DC, USA, 2006. [Google Scholar]
- Sapignoli, S.; Roggio, A.; Boschini, A.; Guida, F.; Merlo, C.; Paiusco, M.; Zorz, A.; De Monte, F. Size-Specific Dose Estimates for Pediatric Head CT Protocols Based on the AAPM Report TG-293. Phys. Med. 2022, 100, 26–30. [Google Scholar] [CrossRef] [PubMed]
- Sheppard, J.P.; Nguyen, T.; Alkhalid, Y.; Beckett, J.S.; Salamon, N.; Yang, I. Risk of Brain Tumor Induction from Pediatric Head CT Procedures: A Systematic Literature Review. Brain Tumor Res. Treat. 2018, 6, 1–7. [Google Scholar] [CrossRef] [PubMed]
- American Association of Physicists in Medicine. Size-Specific Dose Estimates (SSDE) in Pediatric and Adult Body CT Examinations (AAPM Task Group 204); American Association of Physicists in Medicine: College Park, MD, USA, 2011. [Google Scholar]
- Zhao, A.; Fopma, S.; Agrawal, R. Demystifying the CT Radiation Dose Sheet. Radiographics 2022, 42, 1239–1250. [Google Scholar] [CrossRef] [PubMed]
- Mayo-Smith, W.W.; Hara, A.K.; Mahesh, M.; Sahani, D.V.; Pavlicek, W. How I Do It: Managing Radiation Dose in CT. Radiology 2014, 273, 657–672. [Google Scholar] [CrossRef] [PubMed]
- McCollough, C.H.; Leng, S.; Yu, L.; Cody, D.D.; Boone, J.M.; McNitt-Gray, M.F. CT Dose Index and Patient Dose: They Are Not the Same Thing. Radiology 2011, 259, 311–316. [Google Scholar] [CrossRef] [PubMed]
- American Association of Physicists in Medicine. Use of Water-Equivalent Diameter for Calculating Patient Size and Size-Specific Dose Estimates (SSDE) in CT (AAPM Task Group 220); American Association of Physicists in Medicine: College Park, MD, USA, 2014. [Google Scholar]
- American Association of Physicists in Medicine. Size-Specific Dose Estimate (SSDE) for Head CT (AAPM Task Group 293); American Association of Physicists in Medicine: Alexandria, VA, USA, 2019. [Google Scholar]
- Burton, C.S.; Szczykutowicz, T.P. Evaluation of AAPM Reports 204 and 220: Estimation of Effective Diameter, Water-Equivalent Diameter, and Ellipticity Ratios for Chest, Abdomen, Pelvis, and Head CT Scans. J. Appl. Clin. Med. Phys. 2018, 19, 228–238. [Google Scholar] [CrossRef] [PubMed]
- Jaramillo-Garzón, W.; Caballero, M.A.; Alvarez-Aldana, D.F. Size-Specific Dose Estimates for Pediatric Non-Contrast Head CT Scans: A Retrospective Patient Study in Tunja, Colombia. Radiat. Prot. Dosim. 2021, 193, 221–227. [Google Scholar] [CrossRef] [PubMed]
- Fujii, K.; Inoue, Y.; Itoh, H.; Sasa, R.; Hata, H.; Mitsui, K. Size-Specific Dose Estimates in Pediatric Brain CT in Relation to Age and Weight. Radiat. Prot. Dosim. 2023, 199, 1075–1081. [Google Scholar] [CrossRef] [PubMed]
- Shohji, T.; Kuriyama, K.; Yanano, N.; Maeda, E.; Katoh, Y. Simple Method of Measuring SSDE for Head CT: Facilitating Pre-CT Scan Dose Calculation Using Specialized Head Scan Band. Radiat. Prot. Dosim. 2021, 197, 1–11. [Google Scholar] [CrossRef] [PubMed]
- International Atomic Energy Agency. Quality Assurance Programme for Computed Tomography: Diagnostic and Therapy Applications; IAEA Report No. 19; IAEA: Vienna, Austria, 2012. [Google Scholar]
- Fahmi, A.; Anam, C.; Ali, M.H. The Size-Specific Dose Estimate of Paediatric Head CT Examinations for Various Protocols. Radiat. Prot. Dosim. 2020, 188, 522–528. [Google Scholar]
- Christner, J.A.; Braun, N.N.; Jacobsen, M.C.; Carter, R.E.; Kofler, J.M.; McCollough, C.H. Size-Specific Dose Estimates for Adult Patients at CT of the Torso. Radiology 2012, 265, 841–847. [Google Scholar] [CrossRef] [PubMed]
- Pearce, M.S.; Salotti, J.A.; Little, M.P.; McHugh, K.; Lee, C.; Kim, K.P.; Howe, N.L.; Ronckers, C.M.; Rajaraman, P.; Craft, A.W.; et al. Radiation Exposure from CT Scans in Childhood and Subsequent Risk of Leukaemia and Brain Tumours: A Retrospective Cohort Study. Lancet 2012, 380, 499–505. [Google Scholar] [CrossRef] [PubMed]
- Alkhorayef, M.; Sulieman, A.; Alonazi, B.; Alnaaimi, M.; Alduaij, M.; Bradley, D. Estimation of Radiation-Induced Cataract and Cancer Risks During Routine CT Head Procedures. Radiat. Phys. Chem. 2019, 155, 65–68. [Google Scholar] [CrossRef]
- Nievelstein, R.A.; van Dam, I.M.; van der Molen, A.J. Multidetector CT in Children: Current Concepts and Dose Reduction Strategies. Pediatr. Radiol. 2010, 40, 1324–1344. [Google Scholar] [CrossRef] [PubMed]
- International Commission on Radiological Protection. The 2007 Recommendations of the International Commission on Radiological Protection; ICRP Publication No. 103; ICRP: Ottawa, ON, Canada, 2007. [Google Scholar]

Disclaimer/Publisher’s Note: The statements, opinions and data contained in all publications are solely those of the individual author(s) and contributor(s) and not of MDPI and/or the editor(s). MDPI and/or the editor(s) disclaim responsibility for any injury to people or property resulting from any ideas, methods, instructions or products referred to in the content. |
© 2024 by the authors. Licensee MDPI, Basel, Switzerland. This article is an open access article distributed under the terms and conditions of the Creative Commons Attribution (CC BY) license (https://creativecommons.org/licenses/by/4.0/).