Abstract
One of the challenges in the drying process is decreasing the drying time while preserving the product quality. This work aimed to assess the impact of pulsed electric field (PEF) treatment with varying specific energy levels (15.2–26.8 kJ/kg) in conjunction with a microwave vacuum dryer (operating at energy levels of 100, 200 and 300 W) on the kinetics of drying apple slices (cv. Gravenstein). The findings demonstrated a notable reduction in the moisture ratio with the application of pulsed electric field treatment. Based on the findings, implementing PEF reduced the drying time from 4.2 to 31.4% compared to the untreated sample. Moreover, two mathematical models (viz. Page and Weibull) and two machine learning techniques (viz. artificial neural network and support vector regression) were used to predict the moisture ratio of the dried samples. Page’s and Weibull’s models predicted the moisture ratios with R2 = 0.958 and 0.970, respectively. The optimal topology of machine learning to predict the moisture ratio was derived based on the influential parameters within the artificial neural network (i.e., training algorithm, transfer function and hidden layer neurons) and support vector regression (kernel function). The performance of the artificial neural network (R2 = 0.998, RMSE = 0.038 and MAE = 0.024) surpassed that of support vector regression (R2 = 0.994, RMSE = 0.012 and MAE = 0.009). Overall, the machine learning approach outperformed the mathematical models in terms of performance. Hence, machine learning can be used effectively for both predicting the moisture ratio and facilitating online monitoring and control of the drying processes. Lastly, the attributes of the dried apple slices, including color, mechanical properties and sensory analysis, were evaluated. Drying apple slices using PEF treatment and 100 W of microwave energy not only reduces drying time but also maintains the chemical properties such as the total phenolic content, total flavonoid content, antioxidant activity), vitamin C, color and sensory qualities of the product.
1. Introduction
The drying operation is a well-known method to reduce moisture content, chemical reactions and microbial and enzymatic activities, consequently extending the shelf life of agricultural products. With the advancement in technology, researchers are working to improve different drying systems such as hot air [1,2], vacuum [3], freeze [4] and microwave [5]. However, overcoming the challenges associated with the time-consuming, costly and energy-intensive drying process remains an ongoing endeavor. Recently, researchers have tried to overcome these challenges through the development of hybrid drying systems that are energy efficient and yield superior product quality [6].
Microwave-vacuum (MV) is gaining popularity as one of the hybrid methods for drying fruit due to its potential for controlled water evaporation, which avoids oxidative quality degradation while maintaining low surface temperatures of the products [7,8]. The effect of different dryer systems on the drying kinetics indices of pumpkin slices was assessed by [7]. The authors identified that the drying time of the MV dryer compared to hot air and freeze drying was 67% less. Further, the appropriate drying of MV for different fruit and vegetables such as dragon fruit [9], carrot [3], persimmon [6] and mulberry [8] has been reported. Although the MV method ameliorates the economy and efficiency of the drying process, preserving retained water-soluble components of some fruits such as apples is essential. Thus, the extent of the changes produced on the solid matrix of these kinds of fruit should be reduced and, to achieve this purpose, a pretreatment method such as a pulsed electric field [3,10] has been recommended. Pretreatment methods not only preserve product quality during drying but also represent an energy-efficient and economical manner.
The pulsed electric field (PEF) method is acknowledged as an efficient and nonthermal pretreatment technique. It not only influences drying rate and energy consumption but also mitigates excessive temperature elevation, safeguarding against undesirable color alterations [11,12]. PEF treatment induces an electroporation phenomenon in the cell membranes of the fruit, resulting in enhanced mass transfer and improved water permeability throughout the drying process [13]. The utilization of PEF as a pretreatment for various drying techniques and its advantageous outcomes, encompassing decreased drying times and improved color preservation, have been observed in several studies. For instance, kiwifruit [14], strawberries [15], spinach [16], tomato [17], carrot [3], potato [18], onion [19] and apple [20]. However, the inefficiencies in using PEF for drying fruit arise from variations in product preparation and experimental conditions. Therefore, a comprehensive understanding of the drying behavior of fruit subjected to PEF pretreatment is required for the drying process.
Mathematical modeling is widely acknowledged as an appropriate method for elucidating the interpretation of functional data and evaluating the drying kinetic constants. Diverse mathematical models have been applied to describe the kinetic drying behavior with minimal error in the literature [21,22,23]. However, two paramount models, Weibull (a model incorporating two parameters kinetic constant and initial mass transfer) and Page (an exponential equation accounting for kinetic constant and an empirical exponent), were recommended. While the kinetic models demonstrated a satisfactory alignment with experimental outcomes offering reasonable accuracy and optimizing the drying process, they occasionally encountered limitations. These limitations encompassed insufficient insight into the underlying drying process mechanism and the potential challenge of predicting a range of experimental parameters [24,25]. Consequently, utilizing intelligent methods to address or minimize the limitations is needed.
Machine learning (ML) is a well-proven method for exploiting experimental data to solve ill-posed problems due to its ability to autonomously train and adapt. ML has the ability to address complex and nonlinear problems during the drying process by mapping data on existing multidimensional datasets [23]. Artificial neural networks (ANNs) and support vector regression (SVR) are recognized as outstanding performance ML tools that can accomplish the function of kinetic processing using a set of flexible structural interrelationships among data. Different ML-based studies on drying characteristics of various fruits and vegetables consisting of pineapple—hot-air dryer [26], potato—infrared dryer [25], pomelo fruit—freeze dryer [27], dragon fruit—microwave vacuum dryer [9] and banana—vacuum dryer [28] have already been carried out.
Despite the application of mathematical and intelligent methods in the characterization of the drying process, no study (to the best of our knowledge) has been performed on precision kinetic drying of MV pretreated by PEF using ML. Therefore, this work aims to (i) assess the impact of PEF pretreatment on the drying kinetics and physicochemical characteristics of apple slices within the context of the developed MV dryer, (ii) develop a data-driven model utilizing the ML approach to predict the moisture ratio under different experimental conditions and (iii) evaluate different mathematical models and compare them with ANN and SVR outputs to assess drying kinetics.
2. Materials and Methods
2.1. Sample Preparation
Apples (cv. Gravenstein) available on the Danish market and popular with consumers were purchased from a local market (Copenhagen, Denmark) and stored in a refrigerator at 4 °C for 48 h. The samples were washed with tap water and left to reach room temperature (21 ± 0.5 °C) before processing. Each apple was cut into concentric circular rings (diameter: 40 mm and thickness: 5 mm) to obtain four pieces of almost the same geometry. Moisture measurement was carried out using a moisture analyzer (VPB-10, Allscales Europe, Zaltbommel, The Netherlands) in triplicate and the initial moisture content of the raw material was observed to be 8.52 ± 0.28 kg water/kg dry matter. It is notable that all of the experiments were replicated three times in this paper.
2.2. Pulsed Electric Field Treatment
The PEF treatment was performed using the batch PEF generator (20KV-500A-36KW, Omnipef model, Vivate, Czech Republic). The batch chamber constitutes two circular stainless steel electrodes with a surface area of 6.25 cm2. The sample was placed inside the chamber on the bottom electrode and 100 mL of tap water (σ = 320 μS/cm and T = 22 ± 1 °C) was added as a conductive medium. Then, the second electrode was placed on the surface of the sample, resulting in a distance of ~10 mm between the electrodes. The treatment protocol consisted of monopolar pulses with time intervals and pulse duration and frequency of 100–300, 10 ms, 10 µs and 100 Hz, respectively. Specific energy equates to kinetic energy and is the amount of energy required to move a unit of mass [18]. The electric field strength (1.2 KV/cm) and specific energy (15.2–26.8 kJ/kg) were calculated by Equations (1) and (2), respectively [18]. The parameters chosen for calculating specific energy were based on standard practices in the field and the literature [11,12,29].
where U, d, m, n and C are voltage (kV), the distance between the electrodes (cm), sample mass (kg), number of pulses and capacitance (μF), respectively. Based on the recommendation by [13,30], the total PEF treatment time should be long enough to ensure the maximum level of electroporation; hence tPEF = 1 s was considered. Subsequently, the apple samples were subjected to the developed MV dryer (see Section 2.3).
2.3. Drying Equipment
A pilot-scale MV dryer (Panasonic NN-SD28HS, Tokyo, Japan) with a microwave capacity from 100 to 600 W operated at 2.15 GHz and a vacuum pump (Lanphan 2XZ-4, Zhengzhou, China) was used for drying the apple samples. The samples were placed as a single layer in a thin tray that was attached to polypropylene (on the top of the microwave chamber). In the preliminary trial, the microwave power was set to 100, 270 and 300 W to prevent overheating. Also, the system was equipped with a temperature controller that automatically adjusted the power to attain specified temperatures. Moreover, the vacuum section line was connected to the rotary system. Silicon dioxide gel was used to absorb the water vapor throughout the vacuum line. A needle valve was utilized to regulate the absolute pressure to 5 kPa. Furthermore, to increase the performance of the vacuum, the water storage tank connections were filled with ice (Figure 1).
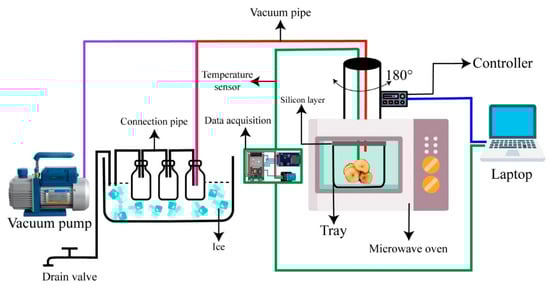
Figure 1.
Schematic representation of developed microwave vacuum drying system at DTU.
A fiber optics sensor was placed on the sample surface and the samples were rotated by 180 degrees to account for any thermal variations. It was noted that the temperature of the surface of the samples was relatively uniform. Each sample was removed from the chamber every three minutes to model the drying kinetics. Finally, the pressure of the chamber and the temperature of the apple surface and the chamber were acquired by the data acquisition unit every five seconds.
The temperature sensors in the MV dryer should be calibrated and validated to give proper measurements. First, it was made sure that the microwave was off to avoid microwave interference. The calibration was carried out in a controlled environment, after which the temperature sensor was placed at specified points within the dryer where they were to be used during operation. The sensor was evaluated across a variety of temperatures that reached the entire operating range of the MV dryer. Readings were taken at each point for the temperature from both the sensors on the dryer and the reference thermometer. After calibration, the microwave dryer was run under normal operating conditions and the calibrated reference thermometer periodically checked the temperature readings. Finally, we verified the consistency and accuracy of the sensor readings under all operating conditions, maintaining those capabilities over time.
2.4. Mathematical Modeling Process
2.4.1. Determination of Moisture Content
The moisture content of the apples was expressed as dry matter. The moisture was plotted as a function of the drying time that presented the drying curve. The moisture content at any time was calculated by Equation (3).
where M, mw and mdw are the moisture content (g water/g dry matter), the mass of water in the apple (g) and the mass of dry matter (g), respectively. The analyses were performed in triplicate at each drying power.
2.4.2. Drying Rate
The drying rate (DR) presents the value of evaporated moisture during the drying time. Equation (4) was used to calculate the DR (g water/g dry matter/min) of the samples.
where Mt, Mt+dt and dt are the moisture content of the apple at any time (g water/g dry matter), the moisture content of the sample at any time + dt (g water/g dry matter) and the drying time (min), respectively. The overall and interval times were 60 and 3 min, respectively.
2.4.3. Moisture Ratio and Drying Kinetic
Assuming negligible external resistance moisture from the center to the material, the moisture ratio (MR) can be calculated by Equation (5).
where Mt, Me and M0 are the moisture content at any time (kg water/kg dry matter), the initial moisture content (kg water/kg dry matter) and the equilibrium moisture content (kg water/kg dry matter), respectively. In this study, two prevalent mathematical models, namely Page (Equation (6)) and Weibull (Equation (7)), have been applied to assess the effect of pretreatment on the drying kinetic of each microwave power. The Page model is a modification to Newton’s empirical model that minimizes the error and has been extensively applied to define the drying behavior of different fruits [14]. Weibull’s model explains the behavior of a complex drying process with considerable flexibility. In fact, various mathematical models have been applied to evaluate the drying kinetic in the literature [22,23,31] and, based on the desired outcome, some of them were selected as appropriate mathematical models. In this paper, Page and Weibull were applied because they present better flexibility and fit for nonlinear and complex drying behaviors. Furthermore, although some mathematical models fit drying data well, they may lack the flexibility and interpretability of the Page and Weibull model, particularly in describing the entire drying process.
where k, t, n, α and β are the kinetic constant, time, empirical exponent, scale parameter and shape parameter, respectively. The experimental data were fitted to the mathematical models as a function of dimensionless MR and a regression was carried out in MATLAB 2022.a software, (Mathworks Inc., Natick, MA, USA).
2.5. Chemical Attributes and Chromatographic Test
To increase the accuracy level of the AI model, chemical parameters including total phenolic content (TP), total flavonoid content (TF), antioxidant activity (AA), and vitamin C (VC) have been considered. The total phenolic content of the samples was assessed through an adapted Folin-Ciocalteu colorimetric technique [32]. A solution containing apple extracts was combined with a diluted Folin-Ciocalteu reagent, which allowed incubation in a dark room for 40 min. Subsequent measurements were conducted at a wavelength of 800 nm. The findings were quantified and presented as milligrams of gallic acid equivalent (GAE) per gram.
The total flavonoid content (TFC) was determined following the methodology outlined by [33]. A solution containing 0.25 mL of sample extract was mixed with 80 μL of 10% sodium nitrite and left to incubate for 10 min [33]. After this incubation period, a solution containing 0.25 mL of 5% aluminum chloride was added to the mixture, followed by another 10-min incubation at 25 °C. Next, 1.2 mL of distilled water and 0.25 mL of 1 M sodium hydroxide solution were added. The change in color was measured at a 550 nm wavelength using quercetin as the reference standard. The TFC was then calculated and expressed as milligrams of quercetin equivalents (QE) per 100 mL of dried weight.
The vitamin C concentration in the samples was assessed utilizing the spectrophotometric technique [32]. Initial treatment involved the addition of stabilizing solutions to the samples. Subsequently, the filtrate obtained after extraction was mixed with 1.8-dichlorophenolindophenol solution and the absorbance was recorded at 520 nm. The vitamin C content was then quantified and reported as milligrams per 100 g of dry matter. All measurements for the aforementioned parameters were carried out in triplicate.
The chromatographic analysis utilized the HPLC method outlined by [34], with some adaptations. The lyophilized extract underwent reconstitution, achieving a concentration of 2 mg/mL through the addition of distilled water, followed by vortexing and filtration using 0.25 μm filters. Both a PDA-DAD detector and an HPLC column (Agilent Technologies Canada Inc., Mississauga, ON, Canada) were employed in the process. The mobile phase comprised two solutions: Solution A, consisting of distilled water and 0.5% acetic acid, and Solution B, composed of 95% acetonitrile and 5% acetic acid. Peak identification was accomplished through utilization of the NIST 2017 library with the aid of an automated mass spectral deconvolution and identification system [35].
2.6. Machine Learning Approach
2.6.1. Artificial Neural Network
To design an ANN architecture, the first step is to determine the input (PEF specific energy, microwave power, surface temperature, HPLC data and drying time), output (moisture content) and the structure of the network (Figure 2a). For developing an efficient neural network, the parameters of its configuration such as the training algorithm, transfer function, number of neurons and hidden layers should be assessed to achieve the best results. Different training algorithms involve backpropagation functions with Jacobian/gradient derivatives, supervised/semisupervised weight and bias. Moreover, different training functions such as the Levenberg–Marquardt (LM), scaled conjugate gradient (SCG), BFGS quasi-Newton (BN), Bayesian regularization (BR), R-backpropagation (RP) and gradient descent momentum (GDM) have been studied for the evaluation of a network’s robustness during the drying process [36]. They reported that selecting the best function to present the best regression depends on the data set and the complexity of the problem. Therefore, to obtain the best result, the aforementioned algorithms were assessed with different transfer functions of the hidden layer (Table 1). The applied transfer functions elliotosig (nonlinear activation function for ANN), tansig (normalizing activation function in ANN), logsig (binary classification activation in ANN), radbas (local activation for function approximation), poslin (nonlinear activation for deep networks) and tribas (Piecewise linear activation for interpolation) were chosen based on the mentioned application that was described completely in the literature [25,36,37,38,39].
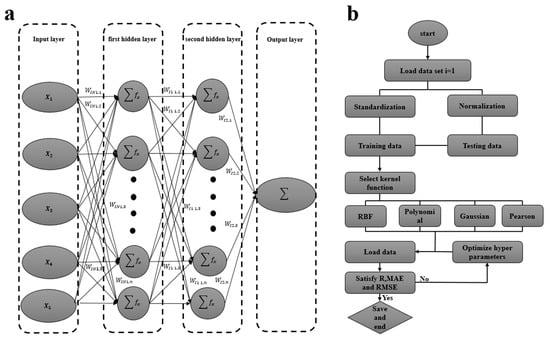
Figure 2.
Applied ML model (a) artificial neural network structure (b) support vector regression flow chart.

Table 1.
Applied transfer function.
Also, the number of neurons and hidden layers affect the error rate. Although a large number of hidden layers and neurons may yield high accuracy, they may increase the computational complexity and overfit the data [40]. For a primary evaluation of the ANN structure, the number of hidden layers and neurons were selected 1–3 and 1–30, respectively. Based on the test and error, we found that one hidden layer did not present an acceptable accuracy and three hidden layers required a lot of time compared to two hidden layers, without less error. Thus, two hidden layers and 20 neurons were used in this research. It should be noted that the neuron layer structure of the networks was odd-odd and even-even. To prevent overfitting during training, the datasets were divided into testing, training and validation sets [9,31]. A k-fold cross-validation methodology (with k = 10), as recommended by [39], was used to split the data into subsets.
2.6.2. Support Vector Regression
SVR is a nonparametric algorithm that maps the data into a higher feature space dimension and creates a discrete hyperplane using the kernel function [41]. The kernel function minimizes the model complexity and maximizes the prediction accuracy. Different kernel functions have been used in the developed nonlinear SVR models to predict the moisture content of various products after the drying process [31,36,42]. In this study, four kernel functions consisting of the radial basis function (RBF, Equation (8)), polynomial (Equation (9)), Gaussian (Equation (10)) and Pearson universal (Equation (11)) were employed due to their computational efficiency.
where α, x, y, n, σ and β are the kernel dimension, feature vectors, polynomial degree, Gaussian and Pearson width, respectively. To optimize the polynomial and Gaussian functions, the penalty factor (C) should be regularized. This parameter controls the SVR performance by estimating the accuracy of the trained data point. Furthermore, the tuning parameter (γ) affects the mapping data into the higher dimensional space by controlling the width of the RBF and Pearson kernel [31]. Therefore, five levels of C (0.01, 0.1, 1, 10 and 100) and three levels of γ (0.01, 0.1 and 1) were applied to define the position of the hyperplanes. Subsequently, the performance of the developed model was assessed until it reached the best performance (Figure 2b).
To evaluate the performance of the mathematical models and machine learning methods, the correlation coefficient (Equation (12)), mean absolute error (Equation (13)) and root mean squared error (Equation (14)) were considered.
where Ci, Cii, Cm and n were the experimental moisture ratio, predicted moisture ratio, mean value of the moisture ratio and total number of samples, respectively. In addition, out-of-sample validation was used to analyze the prediction performance of the models.
2.7. Sample Characteristics
2.7.1. Color
The color parameters were evaluated by the L* (whiteness or brightness), a* (redness or greenness) and b* (yellowness or blueness) using a VidometerLab 2, Videometer A/S, Denmark. Considering the color of the dried sample, a black background was considered for calibration and the color parameters were acquired automatically. Afterward, the total color difference (ΔE) was calculated (Equation (15)) to express the color change.
where ΔL*, Δa* and Δb* are the differences of the mean L*, a* and b* parameters, respectively. The analyses were performed for eight repetitions from each treatment for fresh fruit as a control sample and dried apple slices.
2.7.2. Mechanical Properties
Mechanical properties, including firmness and Young’s modulus, were extracted using a texture analyzer (TA.XTplus, Stable Micro Systems, Surrey, UK)). Force vs. distance and stress–strain curves were required to obtain the firmness and Young’s modulus. For this purpose, a stainless steel blade was utilized for the cutting test. In addition, the best result could be achieved when the loading rate was below 5 mm·min−1 [43]. Therefore, the loading rate and load cell were considered as 1 mm·min−1 and 5 N, respectively. After the deformation reached 0.01 mm (equivalent to 1% of the total strain), a stress diagram was generated considering the elapsed time. Subsequently, the stress–strain diagram was obtained.
2.7.3. Sensory Analysis
All samples were assessed using descriptive quantitative analysis for sensory analysis by 10 expert panelists. The panelists evaluated the scale of the sensory parameters consisting of color, taste, odor, sweetness and overall acceptability from 1 (very weak) to 10 (intense) in increments of 1 [14].
2.8. Statistical Analysis
Data analysis was carried out using MATLAB software. An analysis of variance (ANOVA) was carried out to evaluate the effect of the PEF treatment on the color, mechanical properties and moisture ratio. Further, a multiple pairwise comparison using Tukey’s test was used to determine any significant difference between means at a 95% confidence level.
3. Results and Discussion
3.1. Drying Characteristics
The initial moisture content of the apple slices was 4.25 ± 0.124 (d.b). The drying rate exhibited higher values during the middle phase of the drying process across all microwave power settings (Figure 3a–c). Moreover, there was a notable enhancement in the drying rate as the microwave power was increased. The elevated drying rate during the middle phase resulted from the rapid mass transfer rate and the evaporation of a substantial volume of free moisture from the apple’s surface. Furthermore, the drying rates were high at higher microwave power due to accelerated evaporation, promoting moisture diffusion from the interior to the exterior [7].
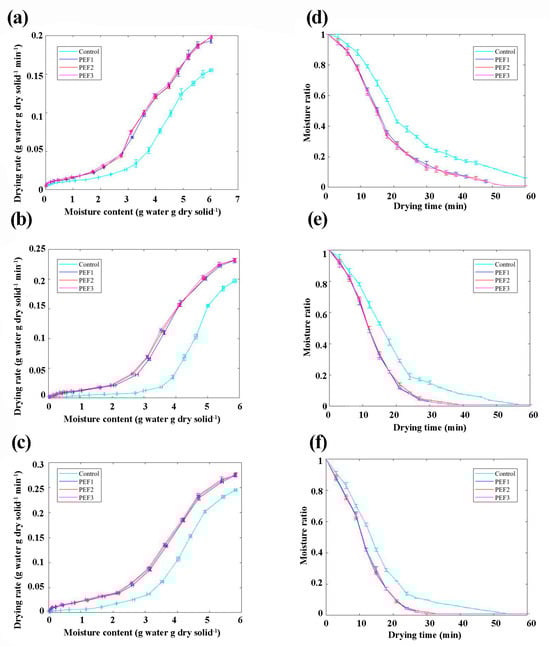
Figure 3.
Drying rate curves for apple slices at (a) 100 W (b) 200 W and (c) 300 W. Moisture ratio curves for apple slices at (d) 100 W (e) 200 W and (f) 300 W. PEF1, PEF2 and PEF3 present the pulsed electric field under specific energy of 15.2, 21.07 and 26.8 kJ/kg, respectively.
Also, PEF pretreatment had a significant effect on increasing the drying rate for all drying conditions. The application of PEF treatment led to tissue damage and enhanced the permeability of cell membranes. This led us to propose the hypothesis that following PEF treatment, there would be an acceleration in the drying rate during the middle drying phase due to the expedited moisture supply to the surface. The influence of the PEF treatment on the drying rate of the current research was in agreement with [16,19,44].
The impact of pretreatment with PEF on the drying rate and changes in spinach quality during hot air drying was investigated [16]. They reported the drying times for the PEF samples were shortened to 1.5 h by air drying. They supposed that the moisture supply to the surface was accelerated after PEF treatment, so the drying rates were increased in the early stage of drying. Also, the influence of PEF pretreatment on the convective drying kinetics of onions was assessed by [19]. The drying time and the diffusion coefficient for the onion in this study were optimal at a medium PEF treatment intensity (4–6 kJ/kg), giving a Z value in the range of 0.53–0.60. They reported that applying PEF treatment resulted in an enhancement of the drying rate throughout the drying process. The sharp incline observed in the middle phase of the drying curve also indicated that liquid moisture diffusion was the primary mechanism for eliminating water from the sample’s interior.
Figure 3d–f illustrates the correlation between the moisture ratio of the samples as MR versus drying time progresses under different pretreatment and drying conditions. It is evident that as the drying time increased, the moisture ratio of the apple consistently decreased. The moisture ratio dropped rapidly at the beginning of the drying process and a gradual decrease was noted during the concluding phases of the drying procedure. The difference in water vapor pressure between the interior and surface of the apple mass accelerates the internal movement of moisture toward the surface. This phenomenon explains the decrease in moisture content.
As the microwave power increased, the amount of moisture decreased considerably (Figure 3d–f). For example, the required time to reach MR of 0.1 with powers of 100, 200 and 300 W were 54, 36 and 30 min, respectively. As the microwave power increased, there were improvements in the temperature gradients and surface evaporation rates, leading to an acceleration in the diffusion of moisture from the interior to the surface. These outcomes align with the results of other studies that linked higher microwave power to reduced drying times [42,45].
Also, PEF treatment reduced the rate of MR significantly in all experimental conditions. However, increasing the frequency from 100 to 300 Hz (which enhanced the specific energy) had no significant effect. For instance, the MR of control, PEF-100, PEF-200 and PEF-300 were 0.29 ± 0.02, 0.12 ± 0, 0.14 ± 0.01, 0.12 ± 0, respectively, after 21 min (Figure 3d–f). Based on the findings, implementing PEF reduced the drying time from 4.2 to 31.4% compared to the untreated sample. The results could be elucidated by releasing a significant amount of free water from the samples subjected to PEF electroporation. The released water from the electroporated apple cells can move unrestrictedly and be efficiently removed during the drying procedure [13,30]. Similar behavior of PEF treatment on the MR trends over the drying time was reported for onion [19], carrot [3], spinach [16] and potato [18]. The effects of PEF on the vacuum drying and quality characteristics of dried carrot were evaluated by [3] under different drying temperatures (25 °C, 50 °C, 75 °C and 90 °C). When the temperature increased from 25 to 90 °C, the total drying time decreased from 21,600 s to 5400 s and from 9720 s to 3600 s for untreated and PEF-pretreated samples, respectively. The application of PEF treatment caused a noticeable decrease in the drying time (by 33–55%) and acceleration drying kinetics even at a higher temperature (90 °C); it evidently reflected the effects of electroporation by the PEF treatment.
3.2. Mathematical Modeling of Drying
The alteration in moisture content throughout the MV drying of apple slices was assessed by fitting the Page and Weibull models and, subsequently, the best model was employed to depict the drying behavior of the sample (Table 2). The applied mathematical model demonstrated an acceptable fit with the experimental data and exhibited R, RMSE and MAE values in the range of 0.917–0.977, 0.011–0.075 and 0.006–0.046, respectively. Based on the statistical parameters, it was recommended that the Weibull model yielded an average R2 of 0.963 to effectively characterize the moisture loss process in apple slices during the MV drying. The recent literature has confirmed the robustness of the Weibull model in accurately fitting the kinetic drying profiles of diverse products exposed to varying drying conditions [14,25].
Table 2.
Statistical parameters and constants from employed drying models to characterize the drying process of the apple slices.
Although the models successfully created the correlation between average moisture ratio and drying time, they lack consideration for the underlying principles of the drying process, such as PEF, resulting in their parameters lacking physical significance. Consequently, understanding the kinetics of drying enables the comprehension and prediction of drying times, which ultimately lead to enhanced process efficiency through optimization [14]. The kinetic constants of each model under different experimental conditions are presented in Table 2. The kinetic constant of the Page model revealed a notable increase as microwave power intensified the PEF treatment. The lowest and highest kinetic constants of the Page model were observed in the control-100 W (1.241) and PEF3-300 W (3.931) cases, respectively. Conversely, the kinetic constant of the Weibull model decreased with the augmentation of microwave power and PEF treatment. The influence of PEF treatment on the upward and downward trends of Page’s and Weibull’s constant values in this study was similar to the findings of [14,46].
To assess the relationship between the kinetic parameter and microwave power, the kinetic constants were graphed against the power and a linear regression was computed (Figure 4). A linear correlation between the kinetic parameter and microwave power was observed. The linear regression models offer the potential to predict the drying rate at a power ranging from 100 to 300 W. The maximum calculated correlation coefficients by Page’s and Weibull’s models were 0.962 and 0.986, respectively. The pretreatments led to a more pronounced decrease in drying time at 300 W, whereas the escalation in the specific energy of PEF did not facilitate any further reduction. This pattern might be associated with the alteration of the initial water content due to pretreatments, which could potentially augment the mass transfer rate through the application of PEF.
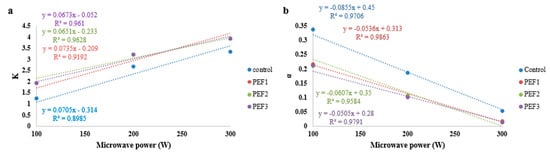
Figure 4.
Relation between kinetic parameters of (a) Page’s and (b) Weibull’s models and microwave power.
Although the overall accuracy and errors of the Page and Weibull models were acceptable, it appears that all the models assumed a form of drying kinetics that may not capture all the complexities of the drying process. Thus, it should be combined with other additional empirical models. Further, the models have the assumption that the drying characteristics are homogeneous, which may not be the case for sliced apple samples; thus, this model could prove to be useful for materials with relatively uniform properties or perhaps be integrated together with other models accounting for heterogeneity.
3.3. Chemical Analysis and Chromatographic Method
The results obtained from HPLC analyses show a wide range of chemical compounds constituting the extract (Figure 5a). It is noticeable that the HPLC method was performed for using its data as an input dataset to increase the accuracy of the ML model. The antioxidant activity, assessed using DPPH radicals, ranged from 0.98 to 1.24 mg TE/100 g dry weight for the obtained dried apple slices (Figure 5b). There was a notable decrease in antioxidant activity with increasing microwave energy. However, pretreatment with PEF showed a positive impact on reducing antioxidant levels. For instance, with PEF1, the antioxidant content at an energy level of 200 W was ten units higher and, intriguingly, as the energy level of PEF increased, the antioxidant levels remained consistent. Nevertheless, no significant difference was observed with PEF2 and PEF3. During treatment with PEF, it can potentially disrupt cell membranes and eventually lead to the release of intracellular components. The disruption may result in the degradation or oxidation of certain sensitive antioxidants during the process when otherwise protected in cell structures [47]. Similarly, the total polyphenol content exhibited a notable decrease with increasing microwave energy, with a significant distinction observed between PEF1 and PEF2 at 100 W (Figure 5c). However, there was no significant contrast between the PEF treatments when the device operated at 200 and 300 W. Polyphenols are very sensitive to heat and drying is carried out at high temperatures, so the degradation of polyphenols can easily occur by oxidation or simple thermal degradation. The applied PEF may enhance the cell membrane permeability, facilitating easy access to polyphenols and, hence, their bioavailability.
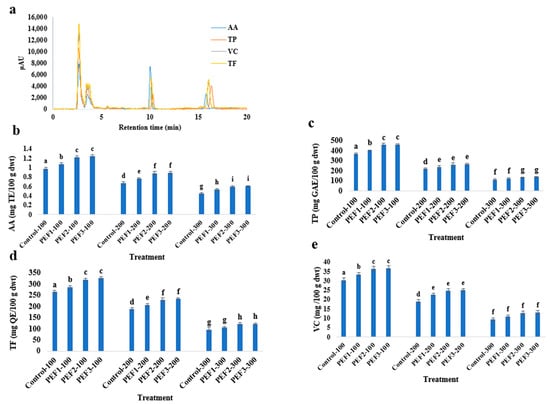
Figure 5.
Effects of different energy microwave (a) and PEF treatment on (b) antioxidant activity (c) total phenolic content (d) total flavonoid and (e) vitamin C of dried apple slices. Different letters indicate significant differences between sample means (p < 0.05). (TP: phenolic content, TF: total flavonoid content, AA: antioxidant activity, and VC: vitamin C).
Also, both the level of microwave energy and the application of PEF treatment influenced the total flavonoid (Figure 5d) and vitamin C contents (Figure 5e). As the microwave energy escalated from 100 to 300 W, the flavonoid content decreased from 265.5 to 97.3 TFmg QE/100 g dry weight. Nevertheless, the findings indicated that PEF treatment mitigated this decline rate. Based on the literature, PEF treatment could induce reversible breakdowns in the cell membrane at the moment of application, called electroporation. As a result, there was an increase in the permeability of the cell membrane and intracellular flavonoids were released into the surrounding medium for preservation [47]. While PEF treatment led to enhanced preservation of vitamin C at 300 W microwave energy, no significant contrast was noted between the control and PEF-treated samples. It seems PEF decreased the generation of some reactive oxygen species, inducing oxidative stress, and thus oxidized and could preserve the vitamin C content. Ascorbic acid is easily oxidized and high oxidative stress due to PEF treatment could maintain the vitamin C content [24,44].
The influence of microwave energy and the application of PEF treatment on bioactive compounds in this study mirrored findings by [29,33,48]. These studies revealed that PEF pretreatment could expedite the drying process without compromising the nutritional integrity of foods. Samples subjected to PEF before drying retained higher levels of polyphenols, anthocyanins and flavonoids, exhibiting improved color and flavor. Moreover, this method mitigated the risk of localized high temperatures, which could otherwise induce undesirable changes in color, flavor, nutrition and texture. However, it was observed that after intense PEF treatment, the antioxidant capacity of dried apples diminished.
3.4. Machine Learning Approach
The outcome of training using various training functions is depicted in Figure 6a, enabling the identification of the optimal number of hidden neurons that yield the highest R2 value and the lowest RMSE value. The statistical parameters revealed that the Levenberg–Marquardt (R2 = 0.998, RMSE = 0.041) and RPROP (R2 = 0.86, RMSE = 0.129) were the best and worst training functions, respectively. The optimum topology of neuron number for LM, BR, SCG, BN, GDM and RP were 20–20, 16–16, 18–18, 13–13, 15–15 and 17–17, respectively. Notably, the most favorable outcomes for each training function were achieved within the neuron range of 13–20. This suggests that augmenting the number of neurons to a certain threshold can enhance accuracy [39].
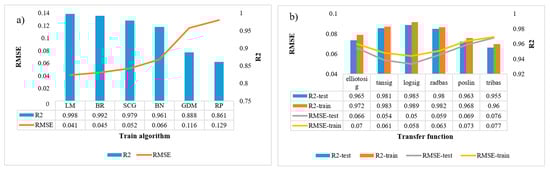
Figure 6.
Best statistical parameters of test set for (a) identification of the optimal number of hidden neurons and (b) different transfer functions.
Afterward, the performance of different transfer functions was evaluated (Figure 6b). The Logsig function, with the corresponding train and test of correlation coefficient and root mean squared error with the neuron topology of 18–18 and epoch of 156 had the best performance. It was followed by tansig, radbas, elliotosig, poslin and tribas. It is noticeable that the transfer function of the first and second hidden layers was the same in Figure 5b. Thus, to achieve improved outcomes through distinct transfer functions for the first and second layers, the network was subjected to retraining using the Levenberg–Marquardt algorithm and the top 10 models are presented in Table 3.
Table 3.
Assessment of the developed ANN models.
For each architecture of the developed ANN model trained using the complete dataset, the cross-validation procedure was implemented across the whole data set, excluding one group from the dataset at each iteration. Statistical parameters indicated that employing diverse transfer functions in the first and second hidden layers can enhance model performance. Notably, the most proper outcomes were achieved when the network utilized Logsig and Tansig functions in the first and second layers, respectively. Furthermore, the findings revealed that all of the top-performing networks reached convergence within fewer than 170 training epochs and an increase in the number of neurons corresponded to an enhancement in network accuracy. The investigation of different transfer functions along with varying network structures in this study is consistent with the observations made by [36,39]. The findings from their studies were largely in agreement, with the primary difference between their research lying in the arrangement of hidden layers. In their work, [36] asserted that one hidden layer was sufficient to attain high performance.
Upon establishing the optimal topology (4–18–18–1), the performance of the developed network to predict the moisture content of the apple slices was evaluated. The statistical parameters presented favorable outcomes in both the test and cross-validation sets (Table 4). The maximum error rates for test and cross-validation were 0.038 and 0.047, respectively. Although the network’s performance was satisfactory, a decline in accuracy was observed with higher microwave energy and PEF treatment levels. This outcome suggests that alterations in temperature and cellular structure can introduce complexity into prediction conditions, thereby influencing network performance (similar to the mathematical modeling findings).
Table 4.
Performance evaluation of the best network structure for different experimental conditions.
The predictive ability of artificial neural networks (ANN) in determining the moisture ratio kinetic has been corroborated in previous studies by [26,27]. Ref. [26] developed an intelligent interface to assess various drying techniques for pomelo fruit (Citrus maxima) peel, reporting a minimum correlation coefficient of 0.993. Similarly, ref. [27] employed the ANN approach to predict moisture content in coated pineapple cubes. Their findings demonstrated a highly effective model (R2 = 0.999, RMSE = 0.001 and MAE = 0.0007) with a topology of 3–14–14–1. However, they underscored that the appropriateness of the chosen topology depends on factors such as the type of sample, the drying methodology, the inputs, the number of samples, the number of neurons and the configuration of hidden layers employed in the analysis. Furthermore, their findings affirmed that the selection of the neuron number is contingent upon the available number of samples. In instances where there are numerous samples yet few neurons, the ANN learning process might prove inadequate, leading to an underfitted estimation. Conversely, when confronted with few samples and an abundance of neurons, the process could become time consuming, resulting in an overfitted estimation.
Also, to comprehensively assess the robustness of the ML approach, the performance of the developed SVR model was examined. Various regression parameters were employed to fine-tune different kernels and the most favorable outcomes are presented (Table 5). Although all the optimized kernel functions exhibited satisfactory performance, the radial basis (RB) model was identified as the superior choice to predict the moisture ratio across diverse experimental conditions.
Table 5.
Best result of optimized SVR models with different kernel functions.
Figure 7 depicts the prediction models developed using the RBF network under various experimental conditions. The most optimal and least favorable outcomes were exhibited in the laboratory conditions of 200 W-control (R2 = 0.994, RMSE = 0.012) and 300 W-PEF3 (R2 = 0.847, RMSE = 0.127), respectively. Similar to the findings from mathematical and ANN modeling, the prediction accuracy was notably influenced by the quantity of microwave energy and the application of PEF treatment. The potential of SVR to predict the moisture ratio in the drying process has been confirmed by previous studies [36,42]. Ref. [36] optimized the SVR model by investigating the Gaussian kernel regression parameters for the online prediction of the moisture ratio of lentil seeds in a microwave-fluidized bed dryer. Further, Ref. [42] presented a novel modeling approach employing support vector regression methods enhanced by the dragonfly algorithm techniques to predict the drying kinetics of pea pods. They found that the optimized hyperparameters derived from the dragonfly algorithm effectively revealed the nonlinear characteristics of pea pod drying (R2 = 0.9983 and RMSE = 0.0132).
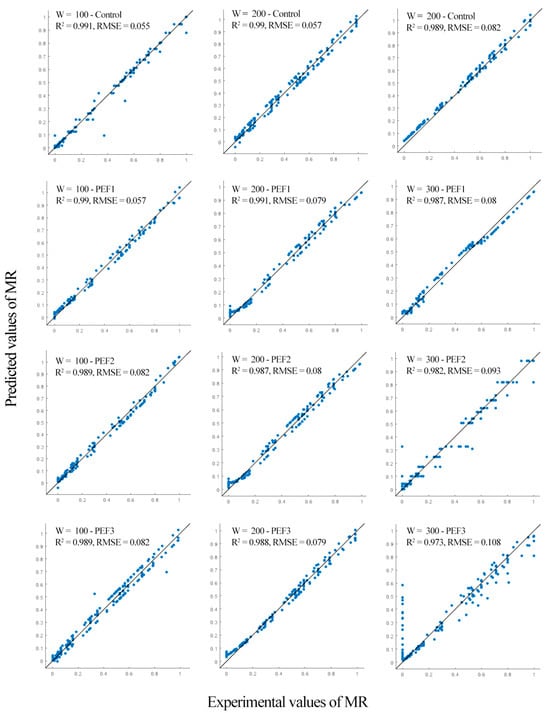
Figure 7.
Comparison of predicted and experimental moisture ratio of training iterations for all experimental conditions.
The comparison of the employed models in this study aimed to ascertain their efficacy in predicting the drying kinetics of apple slices using the applied MV (Table 6). The findings underscored the ANN’s robust performance as the highest among the considered models. Overall, the accuracy achieved through machine learning approaches surpassed that of the mathematical models, a notion supported by [9,25,31].
Table 6.
Summary of the best models to predict the drying kinetics of apple slices.
Ref. [31] employed diverse mathematical models and machine learning techniques, including ANN, KNN and SVR, to model the drying process of chanterelle mushrooms using a heat pump dryer. Due to the elevated accuracy of the ML model, they suggested its applicability in the online monitoring and control of the drying processes of chanterelle mushrooms. Additionally, Ref. [25] developed an ANN model to predict enzyme inactivation kinetics of Irish potatoes using infrared and microwave as dry blanching tools. They reported that ML accuracy surpassed that of mathematical methods. They highlighted the superior performance of ANNs, as evidenced by an elevated coefficient of determination (R2 = 0.963–1) compared to the best-fitting mathematical model, Weibull (R2 = 0.862–0.969), underscoring the advantage of ANNs over mathematical modeling. Moreover, their study revealed that ANNs provide a more comprehensive comprehension of the modeling and data prediction process compared to mathematical models. This is achieved by elucidating the relationship between input and output factors through a set of rules governing data management.
Based on the results of this paper and the literature [6,25,26,27,28,39,40], it can be claimed that the ANN and SVR models are prominent MLs that can be used for evidence predicting and optimizing the drying process in industrial settings. ANN models, as complex, nonlinear relationship learners, are characterized by their layered architecture approach. Their major advantage is high computational performance and adaptability to real-time applications, which are extremely necessary for under-equipped modern hardware with optimized algorithms. They can be used to process volumes of large datasets from drying operations quickly to provide correct predictions and adjustments in real time [26,28]. On the other side, whereas, in general, less computationally intensive and quite robust with smaller datasets, SVR models may not scale to achieve real-time performance because the computational complexity in dealing with large feature spaces and nonlinear mappings may be an issue [40]. In this sense, in the industrial field, where dryers work against variable conditions and quick, adaptive responses to their actions are required, always an important choice will be the ANN model, due to better handling of dynamic and complex data, while the SVR models can be very useful in cases with constrained dimensions of data and simpler relationships. While both models help improve operational efficiency, ANN’s computational efficiency closely relates to it as being the instant model of choice for large industrial models.
3.5. Characterization of the Dried Samples
Variations in the color attributes of dried apples were explored across different experimental conditions. The initial color parameters for fresh fruit were measured as follows: L* = 77.25 ± 3.19, a* = 3.48 ± 0.27 and ∆E = 12.09 ± 0.89. As the microwave energy increased, the L* and ∆E values exhibited a significant decrease. For instance, in the case of the control dried apples, the L* values under 100 W, 200 W and 300 W were recorded as 75.68 ± 3.82, 69.81 ± 2.17 and 55.42 ± 2.86, respectively. Conversely, the a* values significantly decreased, indicating that the microwave’s lower average energy could inhibit the browning of apple slices. An additional factor contributing to the notable decline in the L* index during drying at 300 W power was the occurrence of darkened areas resulting from overheating. This effect can be attributed to the elevated energy levels (which result in higher temperatures) during the drying process, leading to the deactivation of enzymes such as polyphenol oxidase and peroxidase, while simultaneously augmenting the incidence of enzymatic browning reactions. Nevertheless, the vacuum part effectively eliminated the oxygen within the chamber and the inclusion of a condensation unit expedited the drying process. This combination of vacuum drying assisted by condensation is a highly effective method for preserving the color of dried apples. Ref. [45] evaluated the color change of peaches under a combination of convective and microwave methods and they claimed that increasing the temperature considerably affected the color of the samples. Similarly Ref. [32] used microwave drying and combined microwave-convective drying for drying blueberry fruit and assessed the effect of increasing the power on the color and some chemical aspects of blueberry fruit. They revealed that the results could be attributed to the fact that microwave-assisted hot-air-dried blueberries had no difference compared to convective drying due to pigment loss related to the higher temperature attained by samples during the process, which led to surface damage [32]. Therefore, we can conclude that the utilization of PEF treatment can significantly improve the drying process of perishable fruit.
The PEF treatment influenced the maintenance of the color changing during the drying process; however, the value was not statistically significant. The samples subjected to PEF treatment and dried at 100 W exhibited the least noticeable color differences. This favorable impact on the sample’s color could be attributed to the alteration in cell membrane permeability caused by electroporation. This phenomenon led to reduced enzyme release and the release of substrates involved in enzymatic browning reactions as well as a decrease in pigment oxidation through thermal decomposition. Similarly, Ref. [17] evaluated the effect of PEF on the quality parameters of osmotically dehydrated tomatoes and they revealed that PEF treatment could improve the color change of the samples during the heat treatment. On the other hand, Ref. [29] assessed the effect of air humidity and temperature on the convective drying of apples with PEF and reported that the color of the untreated and the PEF-pretreated dried samples was similar.
The firmness and Young’s modulus values for both fresh and dried samples were assessed (Table 7). The initial firmness and Young’s modulus of the fresh apple slices were 16.47 ± 1.57 N and 0.14 ± 0.02 MPa, respectively. The application of different levels of microwave energy and PEF treatment exerted an influence on the mechanical attributes. The findings indicated a significant decrease in the mechanical properties with escalating energy levels. Specifically, based on Young’s modulus and firmness values of the fruit dried under 300 W (F = 6.76 ± 0.71 N and Y = 0.05 ± 0.00 MPa), it became evident that the dried sample was susceptible to early breakage. This occurrence was due to the uneven dispersion of water molecules within the fruit matrix, rendering their reorganization within the structure unattainable [30].
Table 7.
Result of fresh and dried apple slices characteristics. Data are expressed as means ± standard (n = 3). Different letter superscripts in the same column indicate significant differences. The abbreviations include firmness (F), Young’s modulus (Y), color (Co), taste (Ta), odor (Od), sweetness (Sw) and overall acceptability (Oa).
Although the firmness of the treated samples decreased, this decline was not statistically significant at 100 W and the firmness was able to be moderately maintained during the drying process. However, the impact of PEF treatment on the mechanical properties did not exhibit significance when subjected to drying conditions of 200 and 300 W. This mechanical response indicates an antiplasticizing effect induced by the presence of slight amounts of adsorbed water. At elevated microwave levels, a reduction in the maximum force, along with a significant refinement in the force-deformation relationship, has been observed. This corresponds to the plasticizing influence of water on the structure, resulting in an enhanced cohesion and toughness of the material. The effect of PEF on similar mechanical behavior was studied by [14,49]. Ref. [14] reported that PEF improved the firmness parameter of kiwifruit when a low temperature of drying (50 and 60 °C) was used, while an increasing temperature resulted in less firmness (apart from the samples dried at 60 °C) compared to other pretreated samples. Similarly, ref. [49] revealed that the PEF maintained the texture during the storage period. The 25, 50 and 100 kV/m of firmness loss in atemoya were 78.56%, 72.23% and 88.41%, respectively. They reported that when PEF was administered to partially dehydrated tissue, it led to increased cell disintegration.
A sensory evaluation was conducted by experts and the results have been detailed in Table 7. The most favorable appearance quality in terms of color was observed when the sample was treated by PEF dried at 100 W. As the microwave energy increased, the visual color quality of the dried samples deteriorated due to the appearance of scorch marks caused by excessive heat. Consequently, the PEF treatment exhibited a beneficial effect on color preservation (only for the 100 W treatment). Similarly, experts expressed satisfaction with the taste quality of samples treated under 100 W, both in the controlled and treated groups, receiving a high score of 9. In contrast, the sweetness score for samples dried at 200 W and 300 W was below the acceptable threshold (i.e., 5). Finally, the total admissibility scores for dried samples subjected to 100 W, 200 W and 300 W conditions were high (9), near the threshold of acceptability (5) and under the acceptability threshold (2), respectively. Notably, the PEF treatment displayed no discernible impact on the toral acceptability score. In a similar way, ref. [14] reported the sensory parameters of kiwifruit samples that were treated by PEF, when dried at a lower temperature (50 and 60 °C) showed an intermediate value of all parameters while, when dried at 70 °C, in addition to having the lowest score for the overall acceptability, showed the minimum texture and a balance between the sweetness and acidity level. Overall, a comparison of the current research and literature demonstrates that PEF could improve the physical, chemical and physical properties of the fruit under the heating process.
While the model developed in this study focused on pulsed electric fields and apple slices, its optimization renders it applicable to various devices and products. Initially, artificial intelligence models are employed to determine the optimal network topology. Subsequently, network inputs are tailored according to specified parameters. There is even flexibility to adjust input parameters and tailor the network based on datasets encompassing dryer specifications, PEF system characteristics and product attributes.
4. Conclusions
The utilization of a microwave vacuum dryer combined with PEF treatment exerted a substantial influence on the moisture ratio of the sample throughout the drying process. With a rise in the quantity of microwave energy, the drying rate increased significantly. However, elevating the specific energy of PEF did not impact the drying kinetics. The employed mathematical models for predicting the MR yielded satisfactory results, with the Weibull model offering the most accurate prediction (R2 = 0.970, RMSE = 0.099 and MAE = 0.064). Furthermore, in pursuit of enhanced accuracy and the incorporation of more parameters for MR prediction, the optimized computational intelligence methods were employed. The outcomes from the developed ANN and SVR highlight that the machine learning approach can be contemplated for online control of the drying process due to its outstanding performance. Finally, an exploration of various qualitative indices of dried apples was conducted, revealing that the escalation of microwave energy exerted an influence on the color parameters, mechanical properties and sensory evaluation of the dried apple slices. Also, the PEF treatment influenced the characterization of the dried samples, even though not in a statistically significant manner. In conclusion, drying apple slices under 100 W of microwave energy with the aid of PEF treatment not only shortens the drying time but also preserves the product’s quality.
The results obtained indicated that employing PEF as a pretreatment prior to drying holds promise for fostering more sustainable processes, ensuring the nutritional attributes and maintaining the flavor of agricultural products. In addition, by leveraging ML algorithms, drying parameters such as temperature and humidity can be optimized for improved efficiency and product quality. ML models can analyze real-time data from sensors to predict drying times, detect anomalies or irregularities in the process and suggest adjustments to enhance energy usage and reduce waste. Additionally, ML techniques enable the development of predictive maintenance systems, allowing for proactive identification of equipment failures or performance degradation, thus minimizing downtime and ensuring continuous operation of drying systems. However, some challenges such as achieving more accuracy and versatility of developed MV dryers and applied ML models were found in this study. To overcome these kinds of challenges, it is suggested that the dyer be integrated with some novel technologies such as machine vision systems. This involves aligning the imaging setup to monitor the product consistently and possibly synchronizing it with the drying parameters. In addition, implementing the trained models within the drying system’s control software can be a helpful action to achieve more accuracy. The models should process image processing data in real time to predict moisture content and other relevant parameters. Moreover, closing a feedback loop in which the predictions of the model can enable a dynamic adjustment of the drying conditions.
Author Contributions
M.R.: Conceptualization, Data curation, Methodology, Software, Writing—original draft. M.N.: Visualization, Writing—review and editing. J.P.: Visualization, Writing—review and editing. H.Z.: Visualization, Writing—review and editing. A.H.F.: Conceptualization, Project administration, Supervision, Visualization, Writing—review and editing. All authors have read and agreed to the published version of the manuscript.
Funding
This research received no external funding.
Institutional Review Board Statement
Not applicable.
Informed Consent Statement
Not applicable.
Data Availability Statement
The data that support the findings of this study are available from the corresponding author upon reasonable request.
Acknowledgments
This project received support from the National Food Institute of the Technical University of Denmark. Additionally, the authors wish to express their gratitude to Peter Reimer from the Food Production Engineering Research Group at DTU for his assistance in developing the laboratory equipment utilized in this project.
Conflicts of Interest
The authors declare no conflicts of interest.
References
- Xing, S.; Lin, Z.; Gao, X.; Wang, D.; Liu, G.; Cao, Y.; Liu, Y. Research on outgoing moisture content prediction models of corn drying process based on sensitive variables. Appl. Sci. 2024, 14, 5680. [Google Scholar] [CrossRef]
- Li, J.; Yi, X.; Jin, Y. Study of the targeted regulation of rice drying characteristics and quality. Appl. Sci. 2024, 14, 3587. [Google Scholar] [CrossRef]
- Liu, C.; Pirozzi, A.; Ferrari, G.; Vorobiev, E.; Grimi, N. Effects of pulsed electric fields on vacuum drying and quality characteristics of dried carrot. Food Bioprocess Technol. 2020, 13, 45–52. [Google Scholar] [CrossRef]
- Bogusz, R.; Nowacka, M.; Rybak, K.; Witrowa-Rajchert, D.; Gondek, E. Foam-Mat freeze drying of kiwiberry (Actinidia arguta) pulp: Drying kinetics, main properties and microstructure. Appl. Sci. 2024, 14, 5629. [Google Scholar] [CrossRef]
- Sahoo, M.; Titikshya, S.; Aradwad, P.; Kumar, M.; Kumar, V.; Naik, S.N. Microwave drying of bitter yam (Dioscorea bulbifera): An approach of MATLAB image processing to comprehend moisture diffusion process. J. Food Process Eng. 2023, 46, e14454. [Google Scholar] [CrossRef]
- Dash, K.K.; Bhagya Raj, G.V.S. Ultrasound assisted microwave vacuum drying of persimmon fruit: Modeling by artificial neural network and optimization by genetic algorithm. J. Food Process Eng. 2023, 46, e14315. [Google Scholar] [CrossRef]
- Monteiro, R.L.; Link, J.V.; Tribuzi, G.; Carciofi, B.A.; Laurindo, J.B. Microwave vacuum drying and multi-flash drying of pumpkin slices. J. Food Eng. 2018, 232, 1–10. [Google Scholar] [CrossRef]
- Cong, Y.; Liu, Y.; Tang, Y.; Ma, J.; Ma, J.; Liu, Z.; Yang, X.; Zhang, H. Optimization and testing of the technological parameters for the microwave vacuum drying of mulberry harvests. Appl. Sci. 2024, 14, 4137. [Google Scholar] [CrossRef]
- Raj, G.B.; Dash, K.K. Microwave vacuum drying of dragon fruit slice: Artificial neural network modeling, genetic algorithm optimization, and kinetics study. Comput. Electron. Agric. 2020, 178, 105814. [Google Scholar] [CrossRef]
- Bai, J.W.; Zhang, L.; Aheto, J.H.; Cai, J.R.; Wang, Y.C.; Sun, L.; Tian, X.Y. Effects of different pretreatment methods on drying kinetics, three-dimensional deformation, quality characteristics and microstructure of dried apple slices. Innov. Food Sci. Emerg. Technol. 2023, 83, 103216. [Google Scholar] [CrossRef]
- Nowacka, M.; Szymanska, I.; Rybak, K.; Karwacka, M.; Matys, A.; Wiktor, A.; Slowinski, M.; Witrowa-Rajchert, D. Effect of PEF treatment on chosen properties of raw and hot air-and freeze-dried poultry meat. Appl. Sci. 2024, 14, 1808. [Google Scholar] [CrossRef]
- Rastorhuiev, O.; Matys, A.; Wiktor, A.; Rybak, K.; Lammerskitten, A.; Toepfl, S.; Schnäckel, W.; Gondek, E.; Parniakov, O. The impact of pulsed electric field treatment and shelf temperature on quality of freeze-dried pumpkin. Appl. Sci. 2024, 14, 4561. [Google Scholar] [CrossRef]
- Iaccheri, E.; Castagnini, J.M.; Dalla Rosa, M.; Rocculi, P. New insights into the glass transition of dried fruits and vegetables and the effect of pulsed electric field treatment. Innov. Food Sci. Emerg. Technol. 2021, 67, 102566. [Google Scholar] [CrossRef]
- Tylewicz, U.; Mannozzi, C.; Castagnini, J.M.; Genovese, J.; Romani, S.; Rocculi, P.; Dalla Rosa, M. Application of PEF-and OD-assisted drying for kiwifruit waste valorisation. Innov. Food Sci. Emerg. Technol. 2022, 77, 102952. [Google Scholar] [CrossRef]
- Pobiega, K.; Matys, A.; Trusinska, M.; Rybak, K.; Witrowa-Rajchert, D.; Nowacka, M. The effect of ultrasound and pulsed electric field on the osmotic dehydration process of strawberries. Appl. Sci. 2023, 13, 12335. [Google Scholar] [CrossRef]
- Yamakage, K.; Yamada, T.; Takahashi, K.; Takaki, K.; Komuro, M.; Sasaki, K.; Aoki, H.; Kamagata, J.; Koide, S.; Orikasa, T. Impact of pre-treatment with pulsed electric field on drying rate and changes in spinach quality during hot air drying. Innov. Food Sci. Emerg. Technol. 2021, 68, 102615. [Google Scholar] [CrossRef]
- Katsimichas, A.; Dimopoulos, G.; Dermesonlouoglou, E.; Taoukis, P. Modelling and evaluation of the effect of pulsed electric fields and high pressure processing conditions on the quality parameters of osmotically dehydrated tomatoes. Appl. Sci. 2023, 13, 11397. [Google Scholar] [CrossRef]
- Shorstkii, I.; Sosnin, M.; Smetana, S.; Toepfl, S.; Parniakov, O.; Wiktor, A. Correlation of the cell disintegration index with LuikovLuikov’sand mass transfer parameters for drying of pulsed electric field (PEF) pretreated plant materials. J. Food Eng. 2022, 316, 110822. [Google Scholar] [CrossRef]
- Ostermeier, R.; Giersemehl, P.; Siemer, C.; Töpfl, S.; Jäger, H. Influence of pulsed electric field (PEF) pre-treatment on the convective drying kinetics of onions. J. Food Eng. 2018, 237, 110–117. [Google Scholar] [CrossRef]
- Matys, A.; Dadan, M.; Witrowa-Rajchert, D.; Parniakov, O.; Wiktor, A. Response surface methodology as a tool for optimization of pulsed electric field pretreatment and microwave-convective drying of apple. Appl. Sci. 2022, 12, 3392. [Google Scholar] [CrossRef]
- Abbaspour-Gilandeh, Y.; Kaveh, M.; Aziz, M. Ultrasonic-microwave and infrared assisted convective drying of carrot: Drying kinetic, quality and energy consumption. Appl. Sci. 2020, 10, 6309. [Google Scholar] [CrossRef]
- Górnicki, K.; Kaleta, A.; Kosiorek, K. Mathematical description of changes of dried apple characteristics during their rehydration. Appl. Sci. 2022, 12, 5495. [Google Scholar] [CrossRef]
- Kaleta, A.; Górnicki, K.; Obranović, M.; Kosiorek, K. Some aspects of the modelling of dried red beets rehydration process. Appl. Sci. 2024, 14, 1016. [Google Scholar] [CrossRef]
- Punthi, F.; Yudhistira, B.; Gavahian, M.; Chang, C.K.; Cheng, K.C.; Hou, C.Y.; Hsieh, C.W. Pulsed electric field-assisted drying: A review of its underlying mechanisms, applications, and role in fresh produce plant-based food preservation. Compr. Rev. Food Sci. Food Saf. 2022, 21, 5109–5130. [Google Scholar] [CrossRef] [PubMed]
- Okonkwo, C.E.; Moses, O.I.; Nwonuma, C.; Abiola, T.; Benjamin, B.O.; Folorunsho, J.O.; Olaniran, A.F.; Pan, Z. Infrared and microwave as a dry blanching tool for Irish potato: Product quality, cell integrity, and artificial neural networks (ANNs) modeling of enzyme inactivation kinetic. Innov. Food Sci. Emerg. Technol. 2022, 78, 103010. [Google Scholar] [CrossRef]
- Meerasri, J.; Sothornvit, R. Artificial neural networks (ANNs) and multiple linear regression (MLR) for prediction of moisture content for coated pineapple cubes. Case Stud. Therm. Eng. 2022, 33, 101942. [Google Scholar] [CrossRef]
- Kırbaş, İ.; Tuncer, A.D.; Şirin, C.; Usta, H. Modeling and developing a smart interface for various drying methods of pomelo fruit (Citrus maxima) peel using machine learning approaches. Comput. Electron. Agric. 2019, 165, 104928. [Google Scholar] [CrossRef]
- Ropelewska, E.; Çetin, N.; Günaydın, S. Non-destructive discrimination of vacuum-dried banana using image processing operation and machine learning approach. Food Bioprod. Process. 2023, 46, 36–48. [Google Scholar] [CrossRef]
- Matys, A.; Witrowa-Rajchert, D.; Parniakov, O.; Wiktor, A. Assessment of the effect of air humidity and temperature on convective drying of apple with pulsed electric field pretreatment. LWT 2023, 188, 115455. [Google Scholar] [CrossRef]
- Castagnini, J.M.; Iaccheri, E.; Tylewicz, U.; Dalla Rosa, M.; Rocculi, P. Pulsed electric fields effect on mechanical and sorption properties of dried apple tissue. Innov. Food Sci. Emerg. Technol. 2020, 65, 102442. [Google Scholar] [CrossRef]
- Peter, M.; Liu, Z.; Fang, Y.; Dou, X.; Awuah, E.; Soomro, S.A.; Chen, K. Computational intelligence and mathematical modeling in chanterelle mushromushrooms’g process under heat pump dryer. Biosyst. Eng. 2021, 212, 143–159. [Google Scholar] [CrossRef]
- Zia, M.P.; Alibas, I. Influence of the drying methods on color, vitamin C, anthocyanin, phenolic compounds, antioxidant activity, and in vitro bioaccessibility of blueberry fruits. Food Biosci. 2021, 42, 101179. [Google Scholar] [CrossRef]
- Ciurzynska, A.; Trusinska, M.; Rybak, K.; Wiktor, A.; Nowacka, M. The Influence of pulsed electric field and air temperature on the course of hot-air drying and the bioactive compounds of apple tissue. Molecules 2023, 28, 2970. [Google Scholar] [CrossRef]
- Dzah, C.S. Optimized ultrasound-assisted recovery, HPLC/LC-MS identification and biological activities of Tetrapleura tetraptera L. dry fruit polyphenols. Food Chem. Adv. 2022, 1, 100093. [Google Scholar] [CrossRef]
- NIST Mass Spectrometry Data Center. NIST/EPA/NIH Mass Spectral Library (NIST 17); National Institute of Standards and Technology: Gaithersburg, MD, USA, 2017. [Google Scholar]
- Taheri, S.; Brodie, G.; Gupta, D. Optimised ANN and SVR models for online prediction of moisture content and temperature of lentil seeds in a microwave fluidised bed dryer. Comput. Electron. Agric. 2021, 182, 106003. [Google Scholar] [CrossRef]
- Neethu, K.C.; Sharma, A.K.; Pushpadass, H.A.; Emerald, F.M.E.; Manjunatha, M. Prediction of convective heat transfer coefficient during deep-fat frying of pantoa using neurocomputing approaches. Innov. Food Sci. Emerg. Technol. 2016, 34, 275–284. [Google Scholar] [CrossRef]
- Chen, X.; Jiao, Y.; Liu, B.; Chao, W.; Duan, X.; Yue, T. Using hyperspectral imaging technology for assessing internal quality parameters of persimmon fruits during the drying process. Food Chem. 2022, 386, 132774. [Google Scholar] [CrossRef] [PubMed]
- Chasiotis, V.K.; Tzempelikos, D.A.; Filios, A.E.; Moustris, K.P. Artificial neural network modeling of moisture content evolution for convective drying of cylindrical quince slices. Comput. Electron. Agric. 2020, 172, 105074. [Google Scholar] [CrossRef]
- Wang, W.; Paliwal, J. Generalisation performance of artificial neural networks for near infrared spectral analysis. Biosyst. Eng. 2006, 94, 7–18. [Google Scholar] [CrossRef]
- Zhang, H.; Paliwal, J.; Jayas, D.S.; White, N.D.G. Classification of fungal infected wheat kernels using near-infrared reflectance hyperspectral imaging and support vector machines. Trans. ASABE 2007, 50, 1779–1785. [Google Scholar] [CrossRef]
- Hadjout-Krimat, L.; Belbahi, A.; Dahmoune, F.; Hentabli, M.; Boudria, A.; Achat, S.; Remini, H.; Oukhmanou-Bensidhoum, S.; Spigno, G.; Madani, K. Study of microwave and convective drying kinetics of pea pods (Pisum sativum L.): A new modeling approach using support vector regression methods optimized by dragonfly algorithm techniques. J. Food Process Eng. 2023, 46, e14232. [Google Scholar] [CrossRef]
- Rashvand, M.; Altieri, G.; Genovese, F.; Li, Z.; Di Renzo, G.C. Numerical simulation as a tool for predicting mechanical damage in fresh fruit. Postharvest Biol. Technol. 2022, 187, 111875. [Google Scholar] [CrossRef]
- Zhang, C.; Lyu, X.; Arshad, R.N.; Aadil, R.M.; Tong, Y.; Zhao, W.; Yang, R. Pulsed electric field as a promising technology for solid foods processing: A review. Food Chem. 2023, 403, 134367. [Google Scholar] [CrossRef] [PubMed]
- Chatzilia, T.; Kaderides, K.; Goula, A.M. Drying of peaches by a combination of convective and microwave methods. J. Food Process Eng. 2023, 46, e14296. [Google Scholar] [CrossRef]
- Kim, S.Y.; Jeong, U.C.; Ju, H.I.; Jeong, S.; Lee, D.U. Effect of pulsed electric field pretreatment on mass transfer during hot air drying: Drying and rehydration properties of sweet potato. Innov. Food Sci. Emerg. Technol. 2023, 89, 103449. [Google Scholar] [CrossRef]
- Chang, C.-K.; Tsai, S.-Y.; Tsai, M.-S.; Tu, A.-T.; Hou, C.-Y.; Cheng, K.-C.; Zhu, W.-L.; Mulyani, R.; Hsieh, C.-W. Promoting the aging process and enhancing the production of antioxidant components of garlic through pulsed electric field treatments. Antioxidants 2024, 13, 374. [Google Scholar] [CrossRef] [PubMed]
- Soproni, V.D.; Bandici, L.; Teusdea, A.C.; Hathazi, F.I.; Arion, M.N.; Molnar, C.O.; Leuca, T.; Dalea, C.A.; Vicas, S.I. Phenolic content, antioxidant capacity, and browning impact of apple slices during microwave drying: A chemometric approach. Processes 2023, 11, 1601. [Google Scholar] [CrossRef]
- Chang, C.K.; Yang, Y.T.; Gavahian, M.; Cheng, K.C.; Hou, C.Y.; Chen, M.H.; Santoso, S.P.; Hsieh, C.W. Prolonging the shelf-life of atemoya (Annona cherimola × Annona squamosa) using pulsed electric field treatments. Innov. Food Sci. Emerg. Technol. 2023, 88, 103458. [Google Scholar] [CrossRef]
Disclaimer/Publisher’s Note: The statements, opinions and data contained in all publications are solely those of the individual author(s) and contributor(s) and not of MDPI and/or the editor(s). MDPI and/or the editor(s) disclaim responsibility for any injury to people or property resulting from any ideas, methods, instructions or products referred to in the content. |
© 2024 by the authors. Licensee MDPI, Basel, Switzerland. This article is an open access article distributed under the terms and conditions of the Creative Commons Attribution (CC BY) license (https://creativecommons.org/licenses/by/4.0/).