Article

Fiber Monitoring System Applied to Railway Bridge Structures in a Near-Fault Region

1
Department of Civil Engineering, Chung Hua University, No. 707, Sec. 2, Wufu Rd., Hsinchu 30012, Taiwan
2
OlitGlobal, No. 329, Huaxia Rd., 3FL., Zuoying, Kaohsiung 81355, Taiwan
*
Author to whom correspondence should be addressed.
Appl. Sci. 2024, 14(17), 7883; https://doi.org/10.3390/app14177883
Submission received: 24 July 2024 / Revised: 29 August 2024 / Accepted: 2 September 2024 / Published: 4 September 2024
(This article belongs to the Section Civil Engineering)

Abstract

:
Bridges are widely used for train transportation. Some bridges must be constructed close to geologic faults or across them due to the constraints of travel route alignment and the geographical environment. Taiwan is located at the junction of the Eurasian Plate and the Philippine Plate, where geological joints are present and earthquakes are frequent. In Taiwan, the monitoring and early warning of structural displacements is increasingly important, especially in the mutual control and monitoring of bridges and railways. This study utilizes fiber as a continuous sensor to monitor the safety of railway bridges in a near-fault region. This research builds upon the theory of Brillouin frequency shift (BFS) and applies it to a practical scenario of a fault-crossing railway bridge. BFS is related to the strain and temperature change in a single-mode fiber. Distributed fiber optic sensing (DFOS) systems enable us to detect shifts in frequency on the sensing fiber. A systemic approach to installing DFOS systems will be discussed. Data from a DFOS system are collected, and through data processing, they are converted into strain with regard to the deformations (bending, tension, compression) of a box girder bridge. Changes in the geometric structure of the box girder bridge throughout the year are measured and processed into graphical data. This system can be effectively applied to the structural safety monitoring of railway bridges. Through this research, several functions have been achieved, including continuous displacement, automatic monitoring, and real-time automatic alarm functions, without the need for human intervention.

1. Introduction

Bridge safety and monitoring are vital to the safety of passengers. Natural disasters like earthquakes or landslides pose a threat to the structural stability of bridges. Taiwan is located on the Circum-Pacific seismic belt, where the Eurasia plate meets the Philippine Sea plate, and earthquakes occur regularly. On average, there have been 221 earthquakes a year with a magnitude of 4 within a depth of 300 km in the last 10 years. When an earthquake happens in a near-fault region, it accompanies a long-period velocity pulse and permanent ground displacement. This will cause serious structural damage to bridges. Understanding how to accurately monitor the safety of a bridge and trace the structural changes throughout its lifetime is very important in harsh geological conditions like those in Taiwan.
The displacement conditions of railway bridges are different from those of roadway bridges. Because the rails are laid on the bridge slabs, the “bridge-rail mutual control” between the bridge structure and the rail must be considered. The railway bridges that are near or cross geological faults are easily dislocated and deformed due to stratigraphic dislocation.
Bridge inspection vehicles, which rely on human visual inspections, are traditional inspection technique for bridges [1]. Bridge safety has been managed by regular visual inspection, and in most cases, only a simplified physical model is used to assess the structure due to the lack of accurate data. This often leads to the underestimation of bridge health. Even while using settlement marks or inclinometer monitoring of the structure, continuous displacement data measurement and real-time alarms are still not achievable. With the continual rise in human resource costs and higher safety standards, a more effective technology for monitoring bridges is urgently needed.
Various studies have demonstrated that strain and temperature changes in fibers can be detected through the theory of Brillouin frequency shift (BFS) [2,3,4,5,6,7,8,9,10]. Other environmental factors like humidity and air pressure are not taken into consideration for various reasons. Humidity does not contribute much to the changes in BFS [11,12], and the overall change in humidity in Taiwan is around 75~77% according to the Taiwan Central Weather Administration. For this research, we calculate the difference in different parallel fibers on a box girder. This means that if we assume the nearby fibers experience the same humidity and air pressure, these factors would be deducted. Through this sensing technology, structures could be monitored continuously. This research applies this technique and is able to gather continuous data for the geometric structure of the box girder bridge. A systematic approach to installing fiber sensors that accurately detect the conditions across the entire bridge is explained in this research. The installed fiber sensor provides us with accurate data that reflect the condition of bridges. Data accuracy and reliability are taken into account during the assessment of fiber installation. Through experimentation, the data sampling density is increased to obtain continuous measurements that are much more refined. The distributed fiber optic sensing (DFOS) technique has been proven to be of significant value in structural monitoring [13,14,15]. Data collected through the Brillouin DFOS system are transferred to a server for further data processing. Through a series of calculations, the data obtained from the sensing fibers are then turned into useful measurements of strain and geometric data for the box girder bridge. This allows engineers to critically assess the safety of bridge structures with sets of continuous data that were never before accessible. Previous studies were primarily based on measuring the condition of a single continuous structure. For this research on box girder bridges, a more advanced approach is needed to account for the relative motion between the box girders, as multiple boxes are attached to form a bridge. In this research, measurements of both the condition of the box girder structure and the relative motion of the expansion joint are collected through a single DFOS system. This allows for a single system that measures continuous data over long distances across multiple structures. This article describes the background theory, fiber sensor installation, data processing, and analysis of the results.

2. Measurement Theory

2.1. Brillouin Frequency Shift in Single-Mode Optical Fiber

A portion of the light is backscattered when it is beamed into optical fiber. The collision between the photons of the incident light and acoustic phonons causes this phenomenon. The frequency of the incident light shifts into the stoke and anti-stoke zones. This shift in frequency is proportional to the speed of acoustic phonons, which is the acoustic wave velocity. The temperature and strain acting on the sensing fiber will affect the density and tension of the glass, thus affecting the speed of the phonons V A [16]. This Brillouin frequency shift (BFS) in relation to the acoustic wave velocity can be expressed as Equation (1):
v B = 2 n V A / λ ,
n is the reflective index of the fiber sensor, V A is the acoustic wave velocity, and λ is the wavelength of the incident light [17].
BFS can further be expressed in relation to the external factors acting on the fiber. Horiguchi et al., 1989, and Kurashima et al., 1990 [18], analyzed how temperature and external strain would affect the speed of the phonons V A traveling in the fiber, thus causing BFS, and could be expressed in terms of linear parameters (2):
v B = v B 0 + C ε ε ε 0 + C T ( T T 0 ) Δ v B = C ε Δ ε + C T Δ T
where v B is the measured Brillouin frequency shift; v B 0 is the initial Brillouin frequency shift; ε is the strain and T is temperature; and C ε and C T are the coefficients of strain and temperature. The coefficients are related to the material properties of the fiber, which vary with different fiber sensors from different suppliers. This equation can be further arranged into Equation (3):
Δ ε = ( Δ v B C T Δ T ) / C ε

2.2. Separating the Temperature Effect on Fiber

From Equation (2), there are two variables that contribute to the Brillouin frequency shift: the strain (ε) and the temperature (T) [19]. Further calculations must be made to separate the effects of the two variables. One option is to nullify the effect of temperature change. We can choose the measured results with the same temperature conditions as the measured initial values. This could be achieved by choosing the same month to calculate for each year to minimize the temperature difference or by taking the same temperature results for the next month. This way, ΔT = 0, Equation (3), can be simplified to
Δ ε = Δ v B C ε
Another option would be to input temperature into the equation for every measurement. There are a few options to acquire temperature values. For the first option, the system server could search for temperature data from nearby weather stations given by the Central Weather Administration. With reference to the initial temperature condition, Δ T could be calculated, and the strain difference could be calculated from Equation (3). The second option is the installation of a thermometer that is linked to the server. The system server can read the thermometer as it simultaneously measures the frequency shift. The third option is to install a temperature-sensing fiber. This kind of fiber is designed to not be affected by strain within a certain limit. Its structure is specially designed, for example, oil-filled fiber cable and gel-filled fiber cable. Therefore, since the strain is zero, Equation (2) becomes Δ T = Δ v B / C T . The coefficient of temperature C T can be obtained by the fiber supplier or measured through an experiment. The strain difference can then be calculated from Equation (3). The last option is to coil up the sensing fiber for several meters. This is synonymous with option three, but the fiber needs to be installed and fixed in such a way as to not induce stress and only have the effect of thermal expansion present. The thermal expansion coefficient α of the outer layer of the fiber cable must be considered. The equation for calculating the temperature difference is as follows: Δ T = Δ v B / ( C T + α · C ε ) . If the thermal expansion coefficient is minimal, we use the same equation as the third option for obtaining Δ T and then input Δ T to calculate the strain difference from Equation (3). For this research, the last option for installing thermal sensing fiber is used, as it gives a more direct reading of the temperature of the structure because it is in contact with the structure.

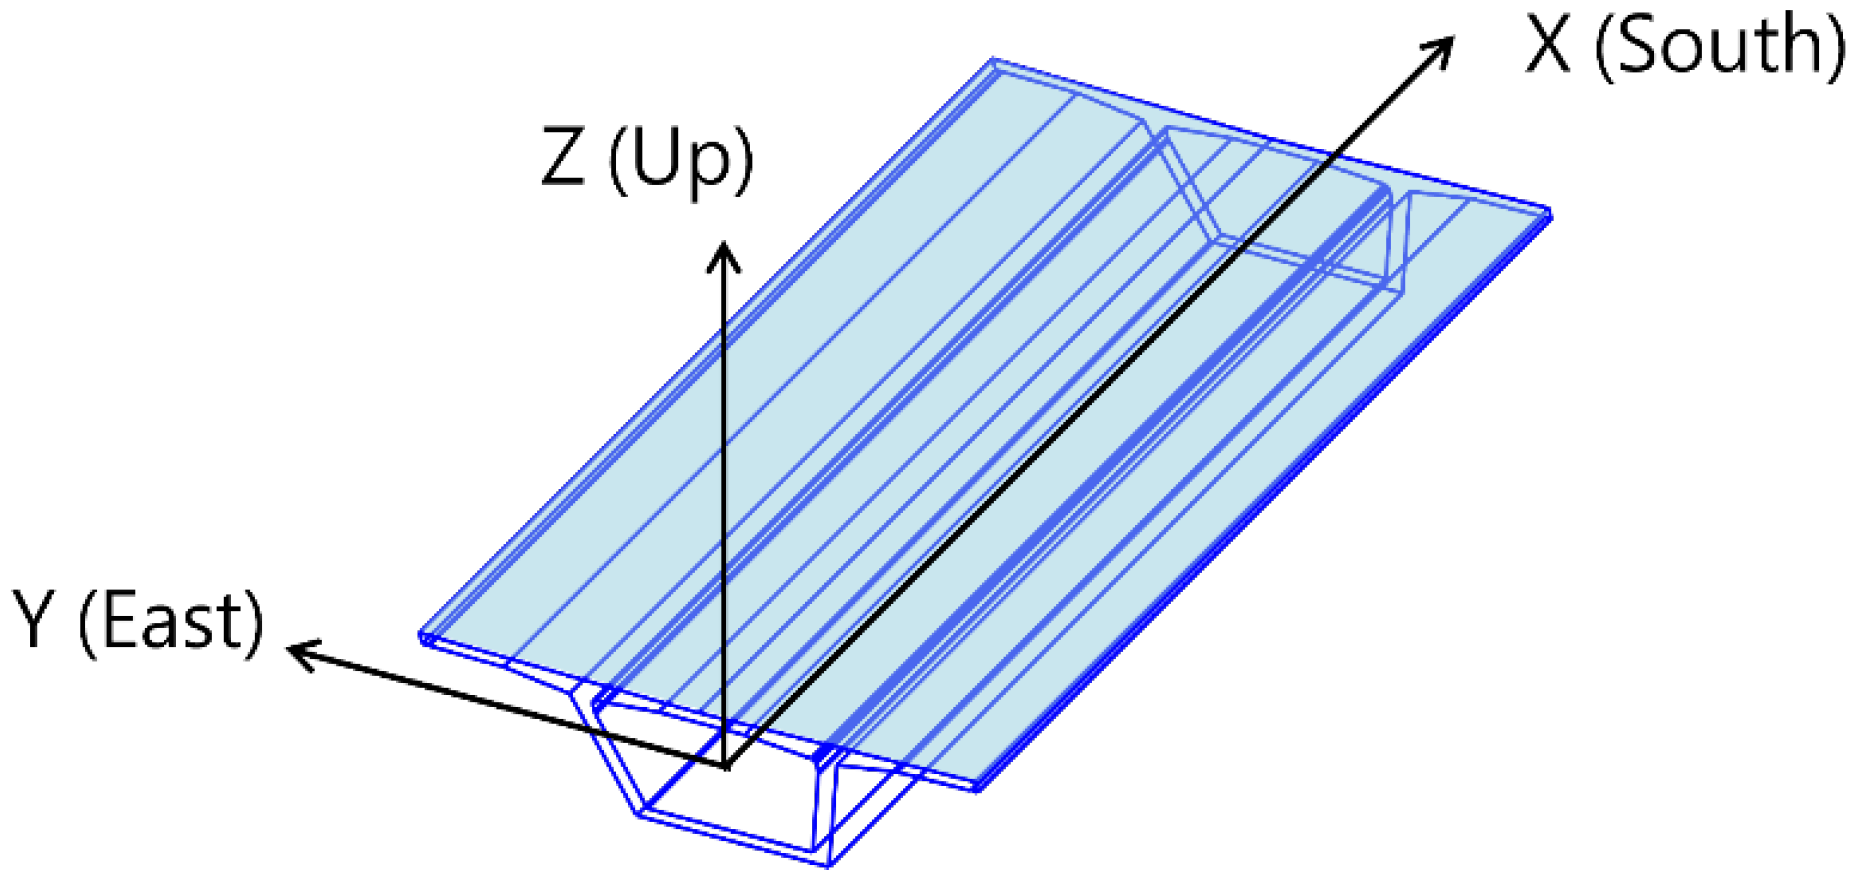
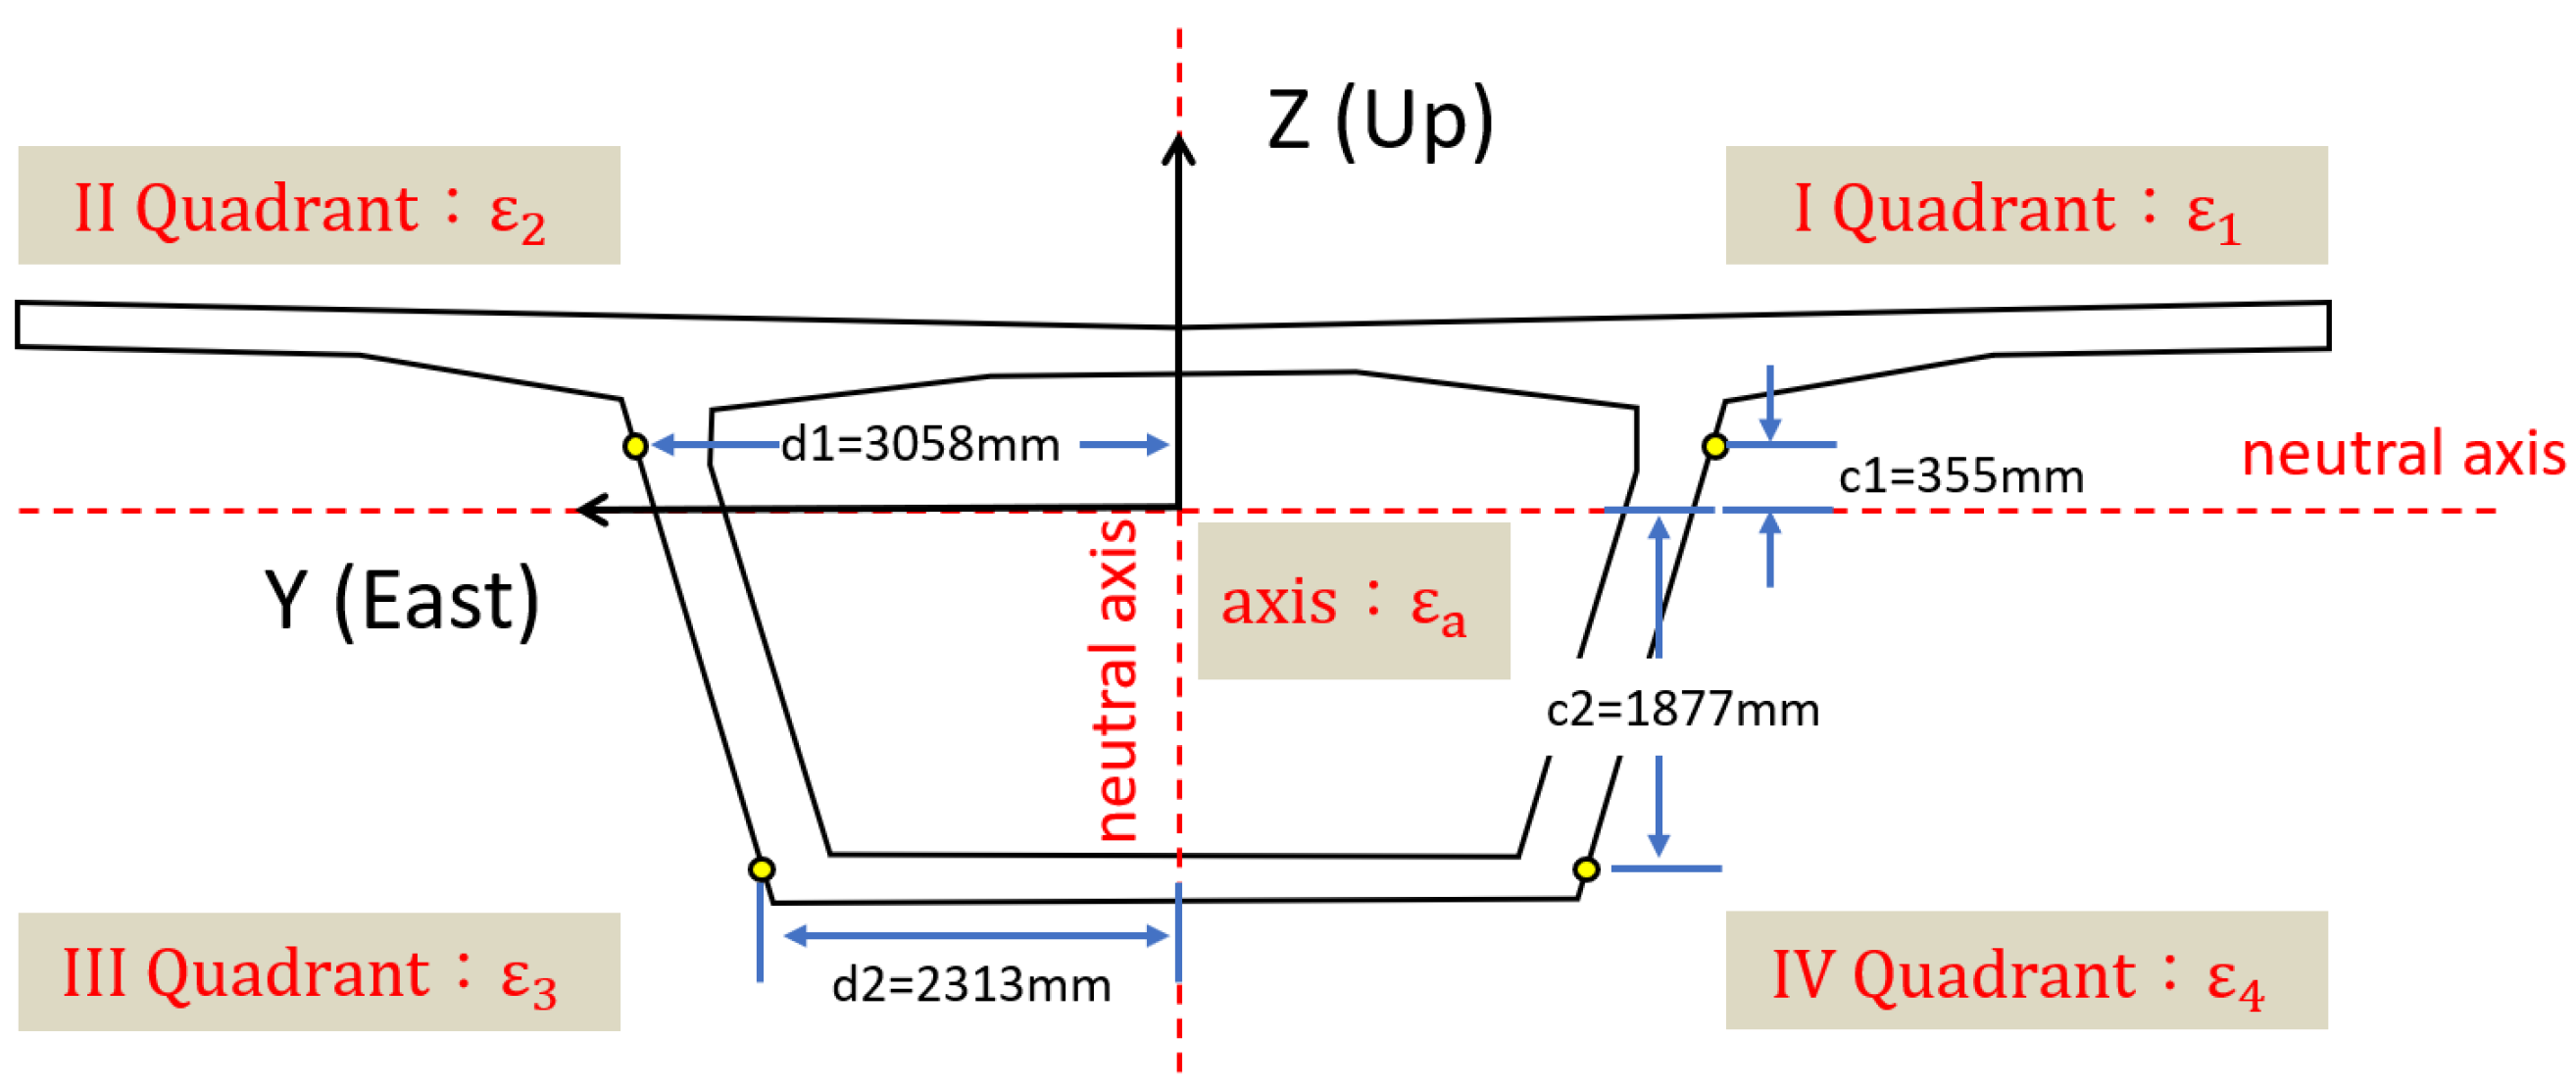
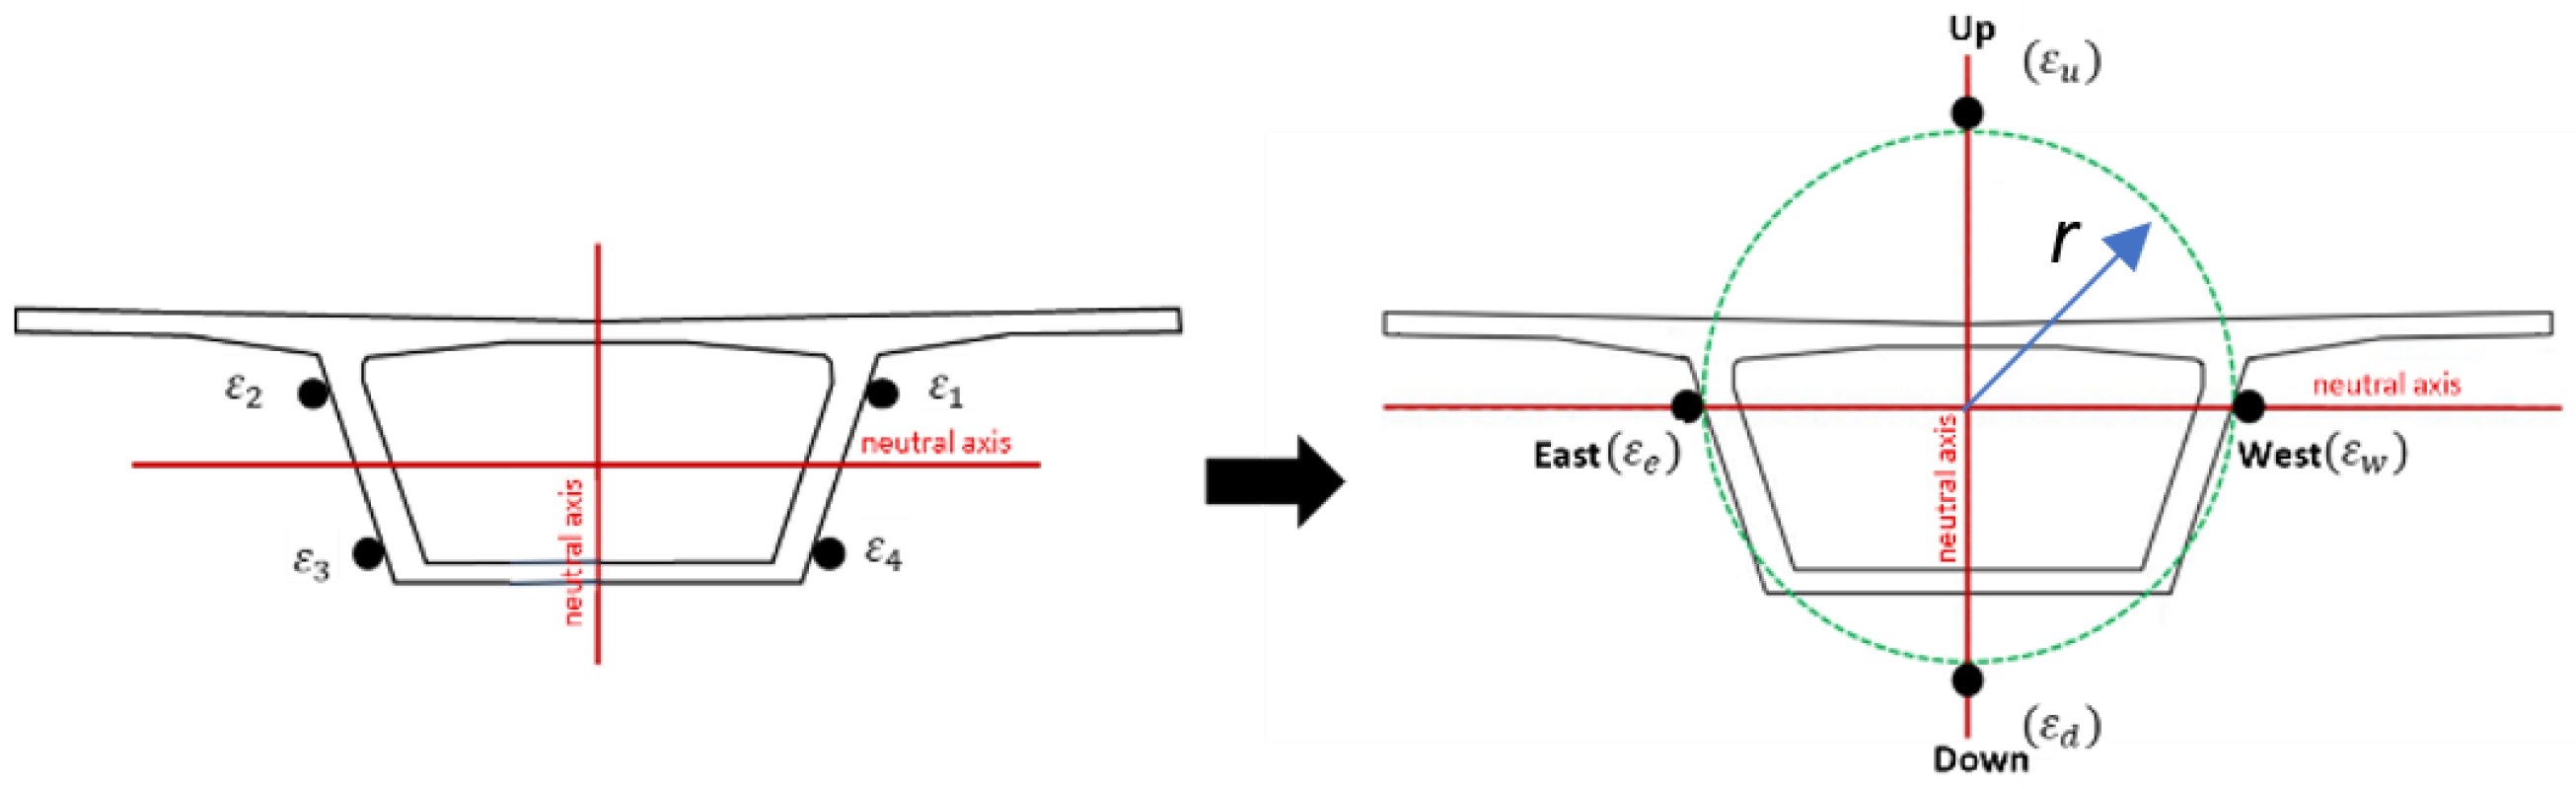
2.3. Strain Distribution of Box Girder

The main subject of measurement is the box girder. To accurately calculate the strain distribution of a three-dimensional object, its structural geometry must be accounted for [20]. A DFOS system of four sensing fibers is used in this research for accuracy of measurement and reliability.
First, the coordinate system of the box girder is defined. Take the horizontal plane as the xy plane and the vertical axis as z. The positive x direction will be the direction in which the migration of the bridge propagates. The y direction will hence be perpendicular to the direction of the bridge. Figure 1 shows how the axis is defined.
Figure 2 is a cross-section of the box girder, and it is divided into four dimensions regarding the y and z axes. There are four fibers parallelly installed on the box girder in the x direction of each dimension. Each of the fibers outputs a set of strain data. The strain values of each fiber are defined as ε1, ε2, ε3, and ε4. The vertical distance to the geometric center is c1, c2. The horizontal distance to the geometric center is d1, d2. The distance between the fiber and the geometric center is shown in Figure 2.
Consider a single box girder as a simply supported beam. First, calculate the axial strain and curvature (Figure 3). Acquire the axial displacement by integrating axial strain. Based on the Euler–Bernoulli beam equation, it is possible to calculate the displacement for curvatures: the vertical displacement and the horizontal displacement.
Define the variable for calculation.
Axial strain: ε a ; Radius of Curvature: ρ .
Vertical curvature on the left: k v l = 1 ρ v l , and on the right: k v r = 1 ρ v r .
Horizontal curvature on the top: k h u = 1 ρ h u , and on the bottom: k h d = 1 ρ h d .
The strain equation linking the variables is as follows:
ε a c 1 k v r + d 1 k h u = ε 1
ε a c 1 k v l d 1 k h u = ε 2
ε a + c 2 k v l d 2 k h d = ε 3
ε a + c 2 k v r + d 2 k h d = ε 4
This equation is further simplified considering the conditions for approximation.
Vertical curvature: k v k v l = 1 ρ v l k v r = 1 ρ v r .
Horizontal curvature: k h k h u = 1 ρ h u k h d = 1 ρ h d .
Hence, the strain equations are simplified and written as a matrix:
1 c 1 d 1 1 c 1 d 1 1 c 2 d 2 1 c 2 d 2 ε a k v k h = ε 1 ε 2 ε 3 ε 4
This is calculated with an augmented matrix to solve for ε a ,   k v ,   k h :
1 0 0 0 1 0 0 0 1 0 0 1 ε 1 + ε 2 + ε 3 + ε 4 2 k v c 2 c 1 / 4 ε 3 + ε 4 ε 1 + ε 2 / 2 c 1 + c 2 ( ε 1 ε 2 ) / 2 d 1 ( ε 4 ε 3 ) / 2 d 2
These equations can also be written as
ε a = ε 1 + ε 2 + ε 3 + ε 4 2 k v c 2 c 1 / 4 k v = ε 3 + ε 4 ε 1 + ε 2 / 2 c 1 + c 2 k h = ( ε 1 ε 2 ) / 2 d 1 , o r k h = ( ε 4 ε 3 ) / 2 d 2
ε1, ε2, ε3, and ε4 represent the measured strain from sensing fiber, and distance c, d has known values; thus, ε a ,   k v ,   k h can be solved. The strain distribution across the four dimensions can be calculated using the following equation when assuming the horizontal and vertical curvatures are the same in the left and right directions:
ε q 1 = ε a k v c 1 + k h d 1 ε q 2 = ε a k v c 1 k h d 1 ε q 3 = ε a + k v c 2 k h d 2 ε q 4 = ε a + k v c 2 + k h d 2
where c 1 and d 1 are the relative horizontal and vertical distances to the centroid.
The strain from the fibers can be calculated to determine the strain in the positions of up, down, east, and west, as shown in Figure 4.
ε u = ε a k v r ε d = ε a + k v r ε e = ε a k v r ε w = ε a + k v r
Horizontal strain is defined as ε e ε w , and vertical strain as ε u ε d .
To calculate axial displacement u x , integrate the axial strain:
u x = ε a · d x
Double integrate the horizontal curvature to obtain the horizontal displacement u y .
u y = k h · d x d x
Double integrate the vertical curvature to obtain the vertical displacement u z .
u z = k v · d x d x

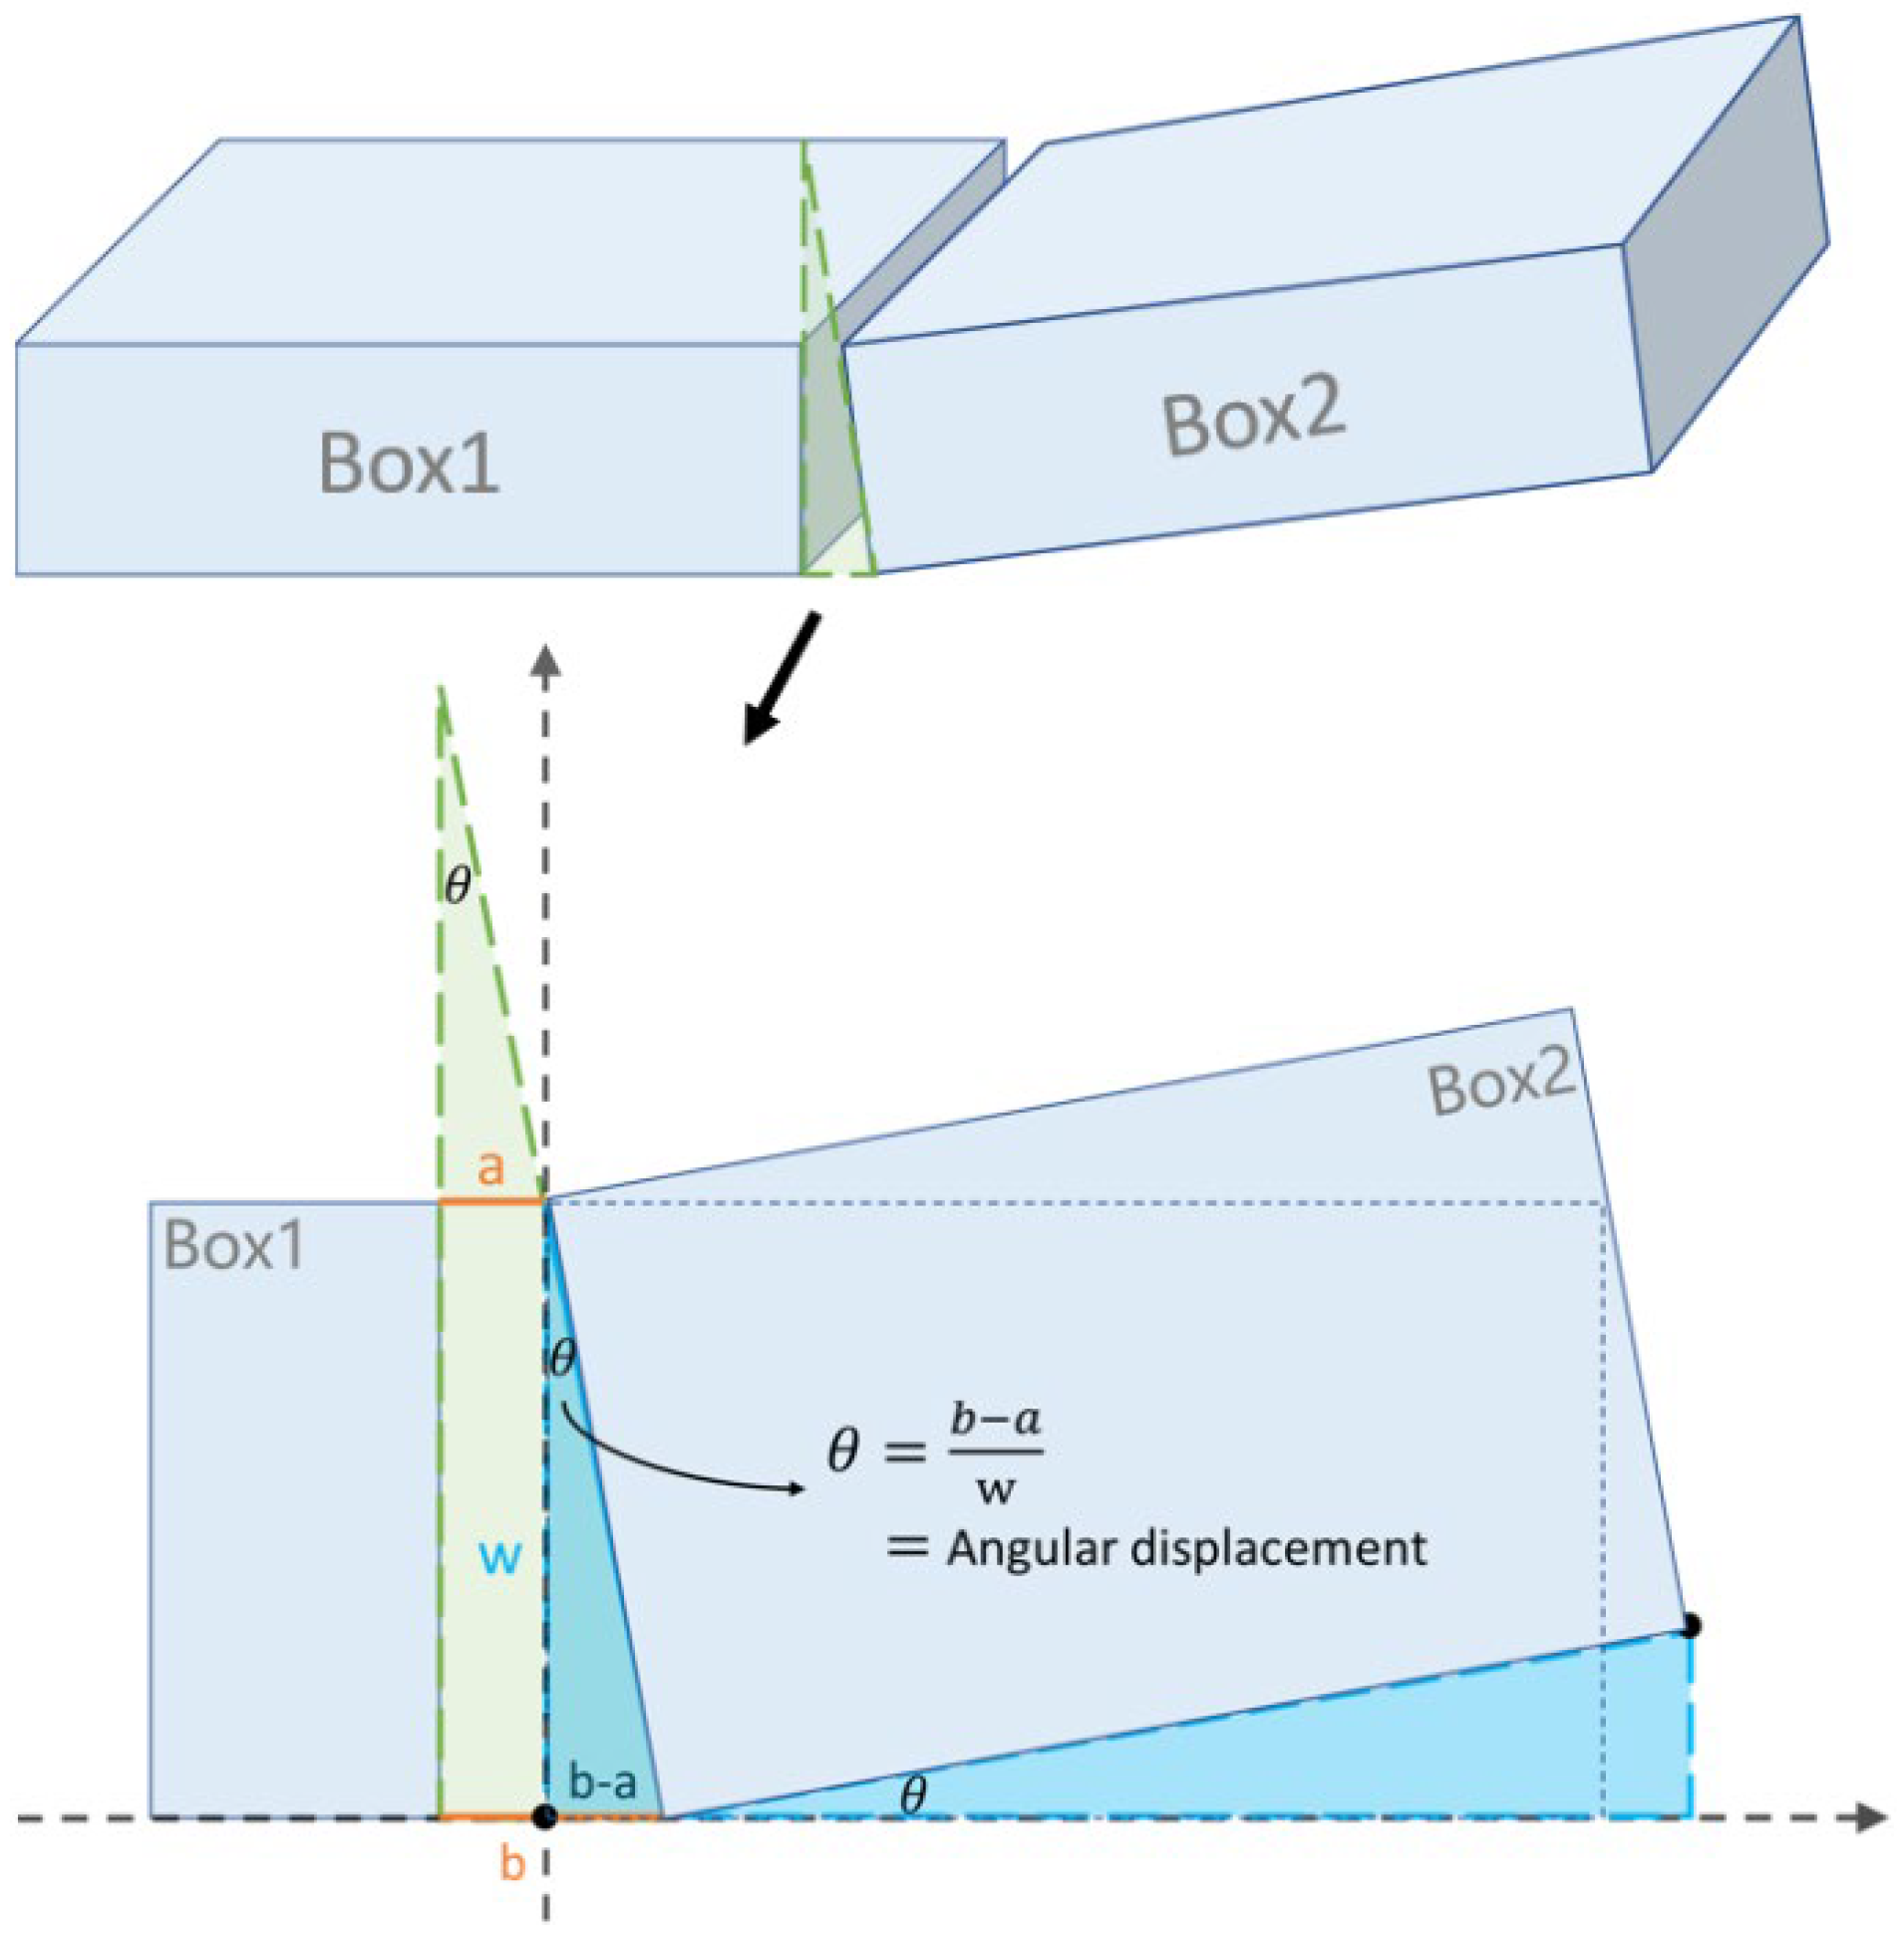
2.4. Angular Displacement of Expansion Joints

Expansion joints are located between the box girders to absorb the temperature-induced expansion and contraction of structures. The angular displacement must be taken into consideration when analyzing the geometric structure of the bridge continuously. The angular displacement can be calculated by simple trigonometry-approximating calculations in this case with changes in the small angles.
θ b a w = h o r i z o n t a l   o r   v e r t i c a l   a n g l u a r   d i s p l a c e m e n t
There are two directions of angular displacement: horizontal and vertical.
In Figure 5, b − a equates to the horizontal or vertical displacement of the expansion joint. w is the horizontal or vertical width of the box girder.

3. Research Design and Data Collection

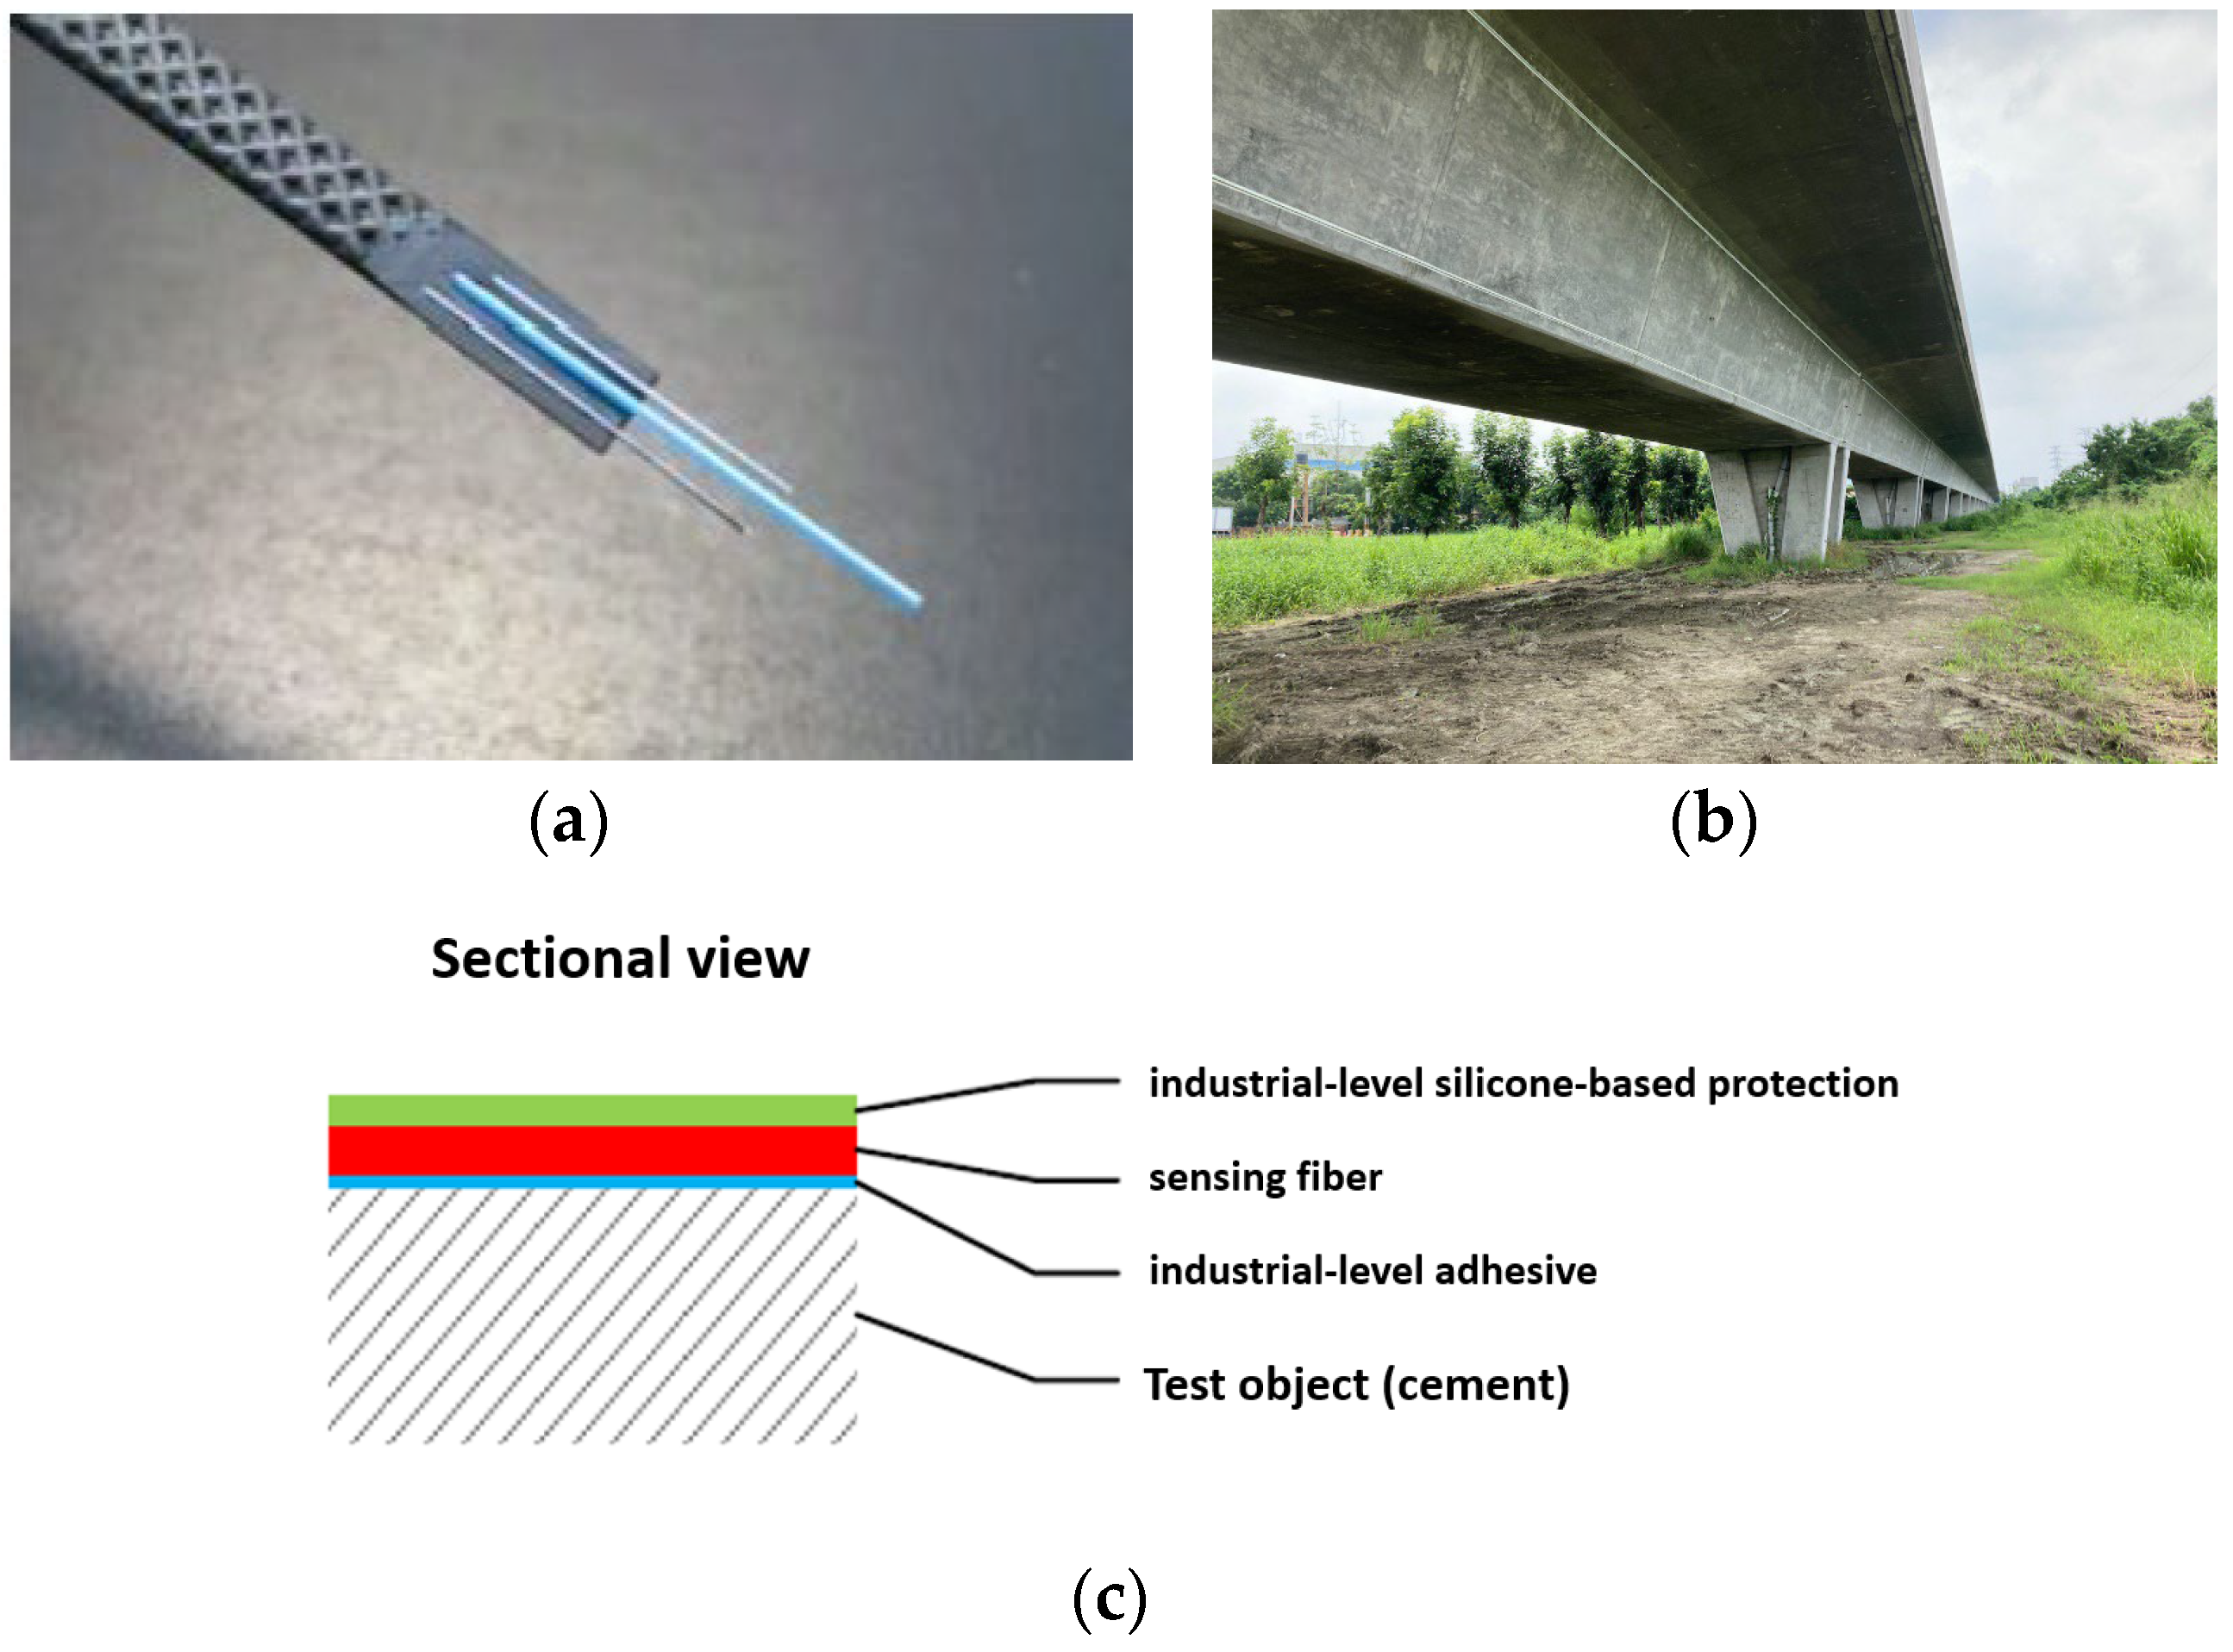
3.1. Determining the Test Field

Bridge structures are most at risk when they are situated across faults. Observations from Taiwan High-Speed Rail report that a bridge across the Longchuan Fault in Yanchao Dist., Kaohsiung City, experiences abnormal displacement. Nearby faults also include the Chekualin Fault and the Qishan Fault. This makes rail bridges near the region more susceptible to failure. The accumulation of deformation over long periods of time may lead to a shorter structural lifetime than expected. For the reasons mentioned above, bridges across this region make a suitable test field for further experimentation.

3.2. Installation of Sensing Fiber

The fiber cables used in this research are single-mode optical fiber with four cables running parallel to each other on the box girder bridge. The working temperature ranges from −20 °C to 80 °C. The optimal strain-sensing range of the fiber cable used in this research is set at 5000 με. To account for the expansion of the bridge structure, fiber cables that have steel wires embedded are chosen for testing in this research, as shown in Figure 6a. Steel wires in fiber cable greatly improve its tensile strength, and the maximum tensile strength for this fiber is 15 kg-f.
The cross-section of the High-Speed Rail bridge box girder is in the shape of a trapezoid. It would make sense to assume that four sensing fibers on the four corners of the trapezoid are a suitable setup that could collect the necessary data for horizontal and vertical strain measurement of the structure. The sensing fibers are laid out to be parallel to each other. With the same axial position of the strain measurement point for each sensing fiber, it forms a cross-section for strain and deformation analysis.
The installation and verification of the sensing fibers are closely considered to ensure the accuracy of data collection. To accurately represent the strain of the box girder, the contact between the sensing fiber and the surface of the box girder needs to be non-slip. First, due to the height of the bridge, it is necessary to work aloft to clean and smooth out the surface of the box girder. The next step would be to apply industrial-level adhesive to the surface and place the sensing fiber. Another industrial-level silicone-based protection is applied on top of the fiber to further protect it from possible environmental damage, as shown in Figure 6. Lastly, BOTDR is used to make sure the installed fiber is of high quality and there is no breakage of the fiber during the installation process.

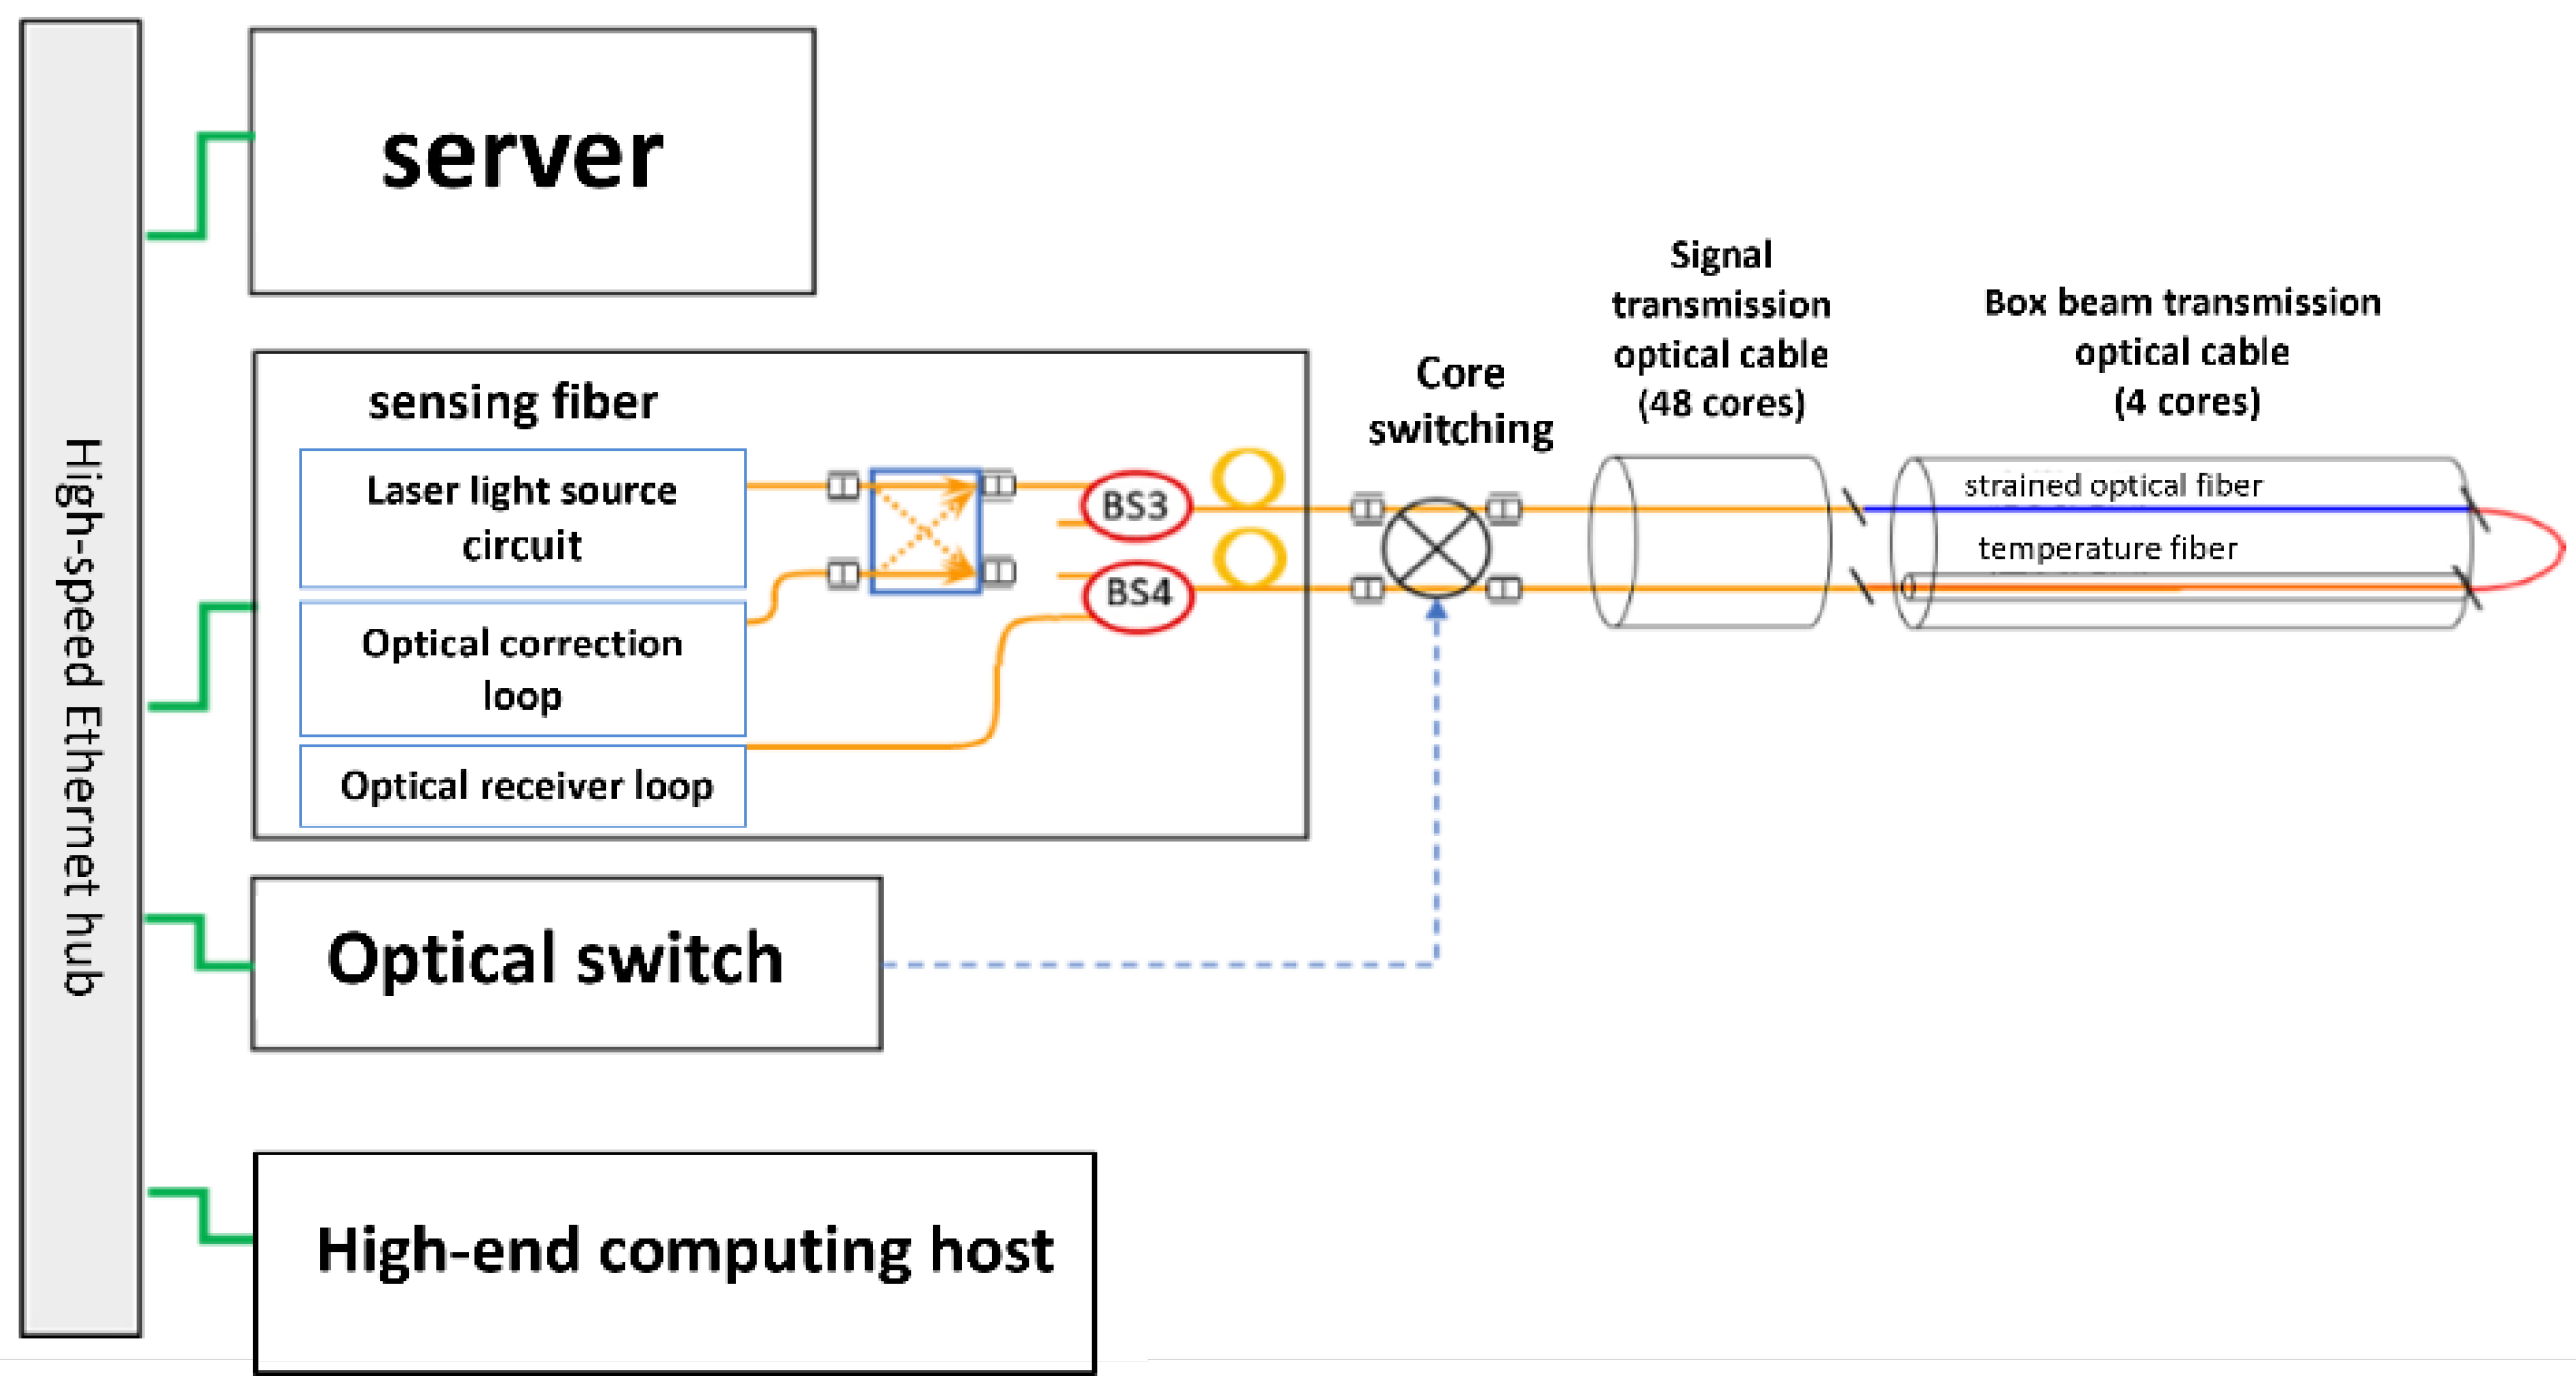
3.3. System Framework for Data Collection

A DFOS system was set up near the testing ground of the Taiwan High-Speed Rail box girder bridge in Yanchao, Kaohsiung City (Figure 7). The DFOS system includes the function of Brillouin Optical Time Domain Analysis (BOTDA: NBX-6066, Neubrex Co., Ltd. Sakaemachidori 1-1-24, Chuo-ku, Kobe, Hyogo, 650-0023 Japan). BOTDA utilizes Brillouin scattering to measure Brillouin gain and loss when light travels through a fiber. BOTDA was set to measure 1 km with a spatial resolution of 5 cm, a measurement accuracy of 7 με, repeatability of 3 με, and a frequency of measurement that could be set from 10 to 60 min. The system includes a server for large data storage and internet connection. A computer was used for numerical calculation with high-speed data processing and a software platform with GUI for data fetching and graphical presentation.
The server first sends a command through LAN/WAN to BOTDA to start fiber measurement. BOTDA starts sending signals through sensing fiber, and the fiber backscatters the signal back to BOTDA. BOTDA records the data and sends it to the server for further data analysis. The data are processed through a dedicated high-speed computer, and the server stores the processed data. The processed data can then be accessed through software and presented graphically. The alarm and warning values can be set, and if the measured data exceed these values, warning messages can be sent. Users of the system can also access data via PC, tablet, or phone using the internet to increase data availability when not stationed near the server. A UPS system is also included in case of an emergency. Earthquakes and typhoons are a regular occurrence in Taiwan, and unfortunately, electricity will go out on some occasions. Bridges are most at risk in these dire situations; thus, a UPS system is needed for sending alarms in case of an emergency.

4. Results

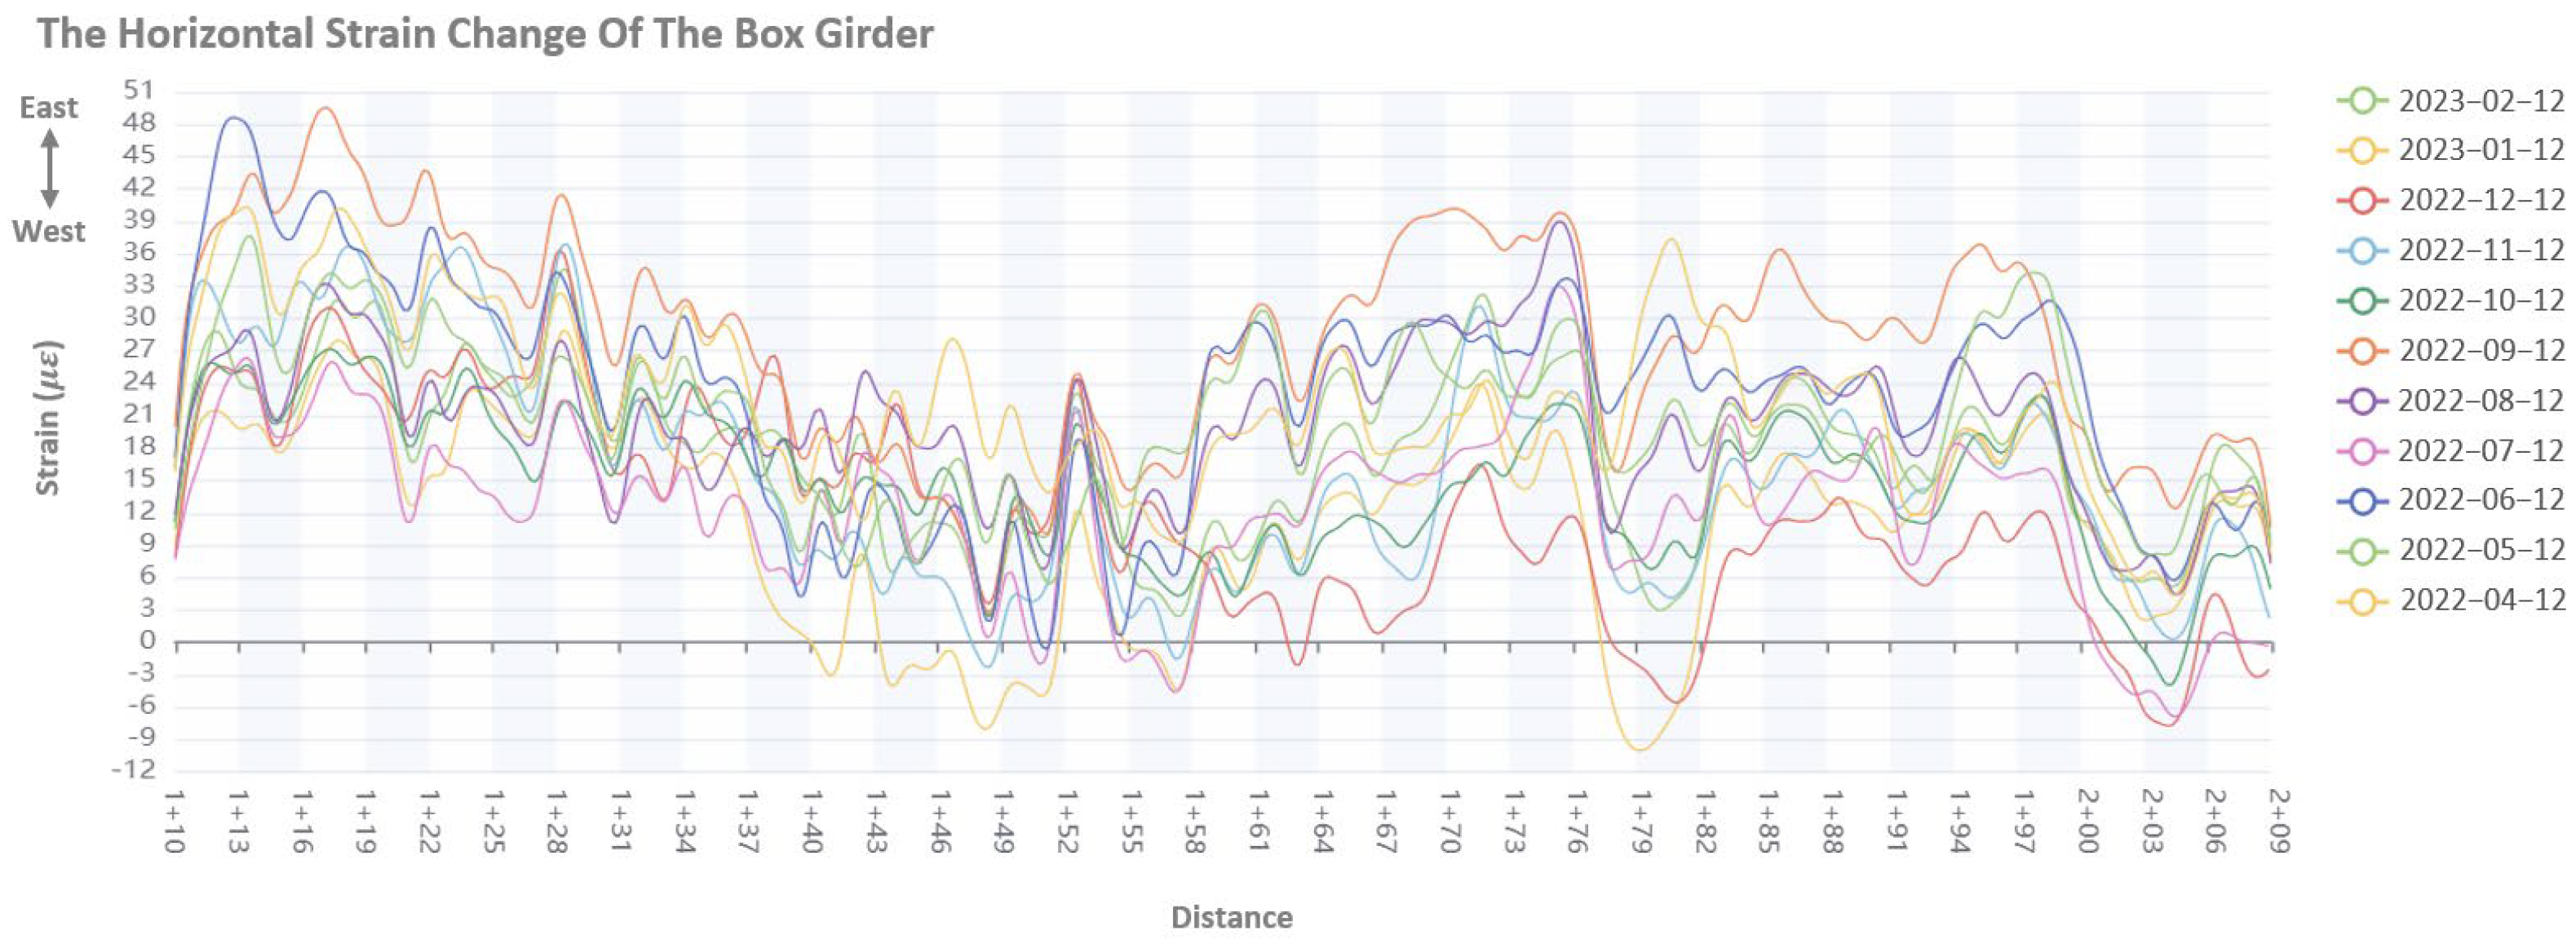
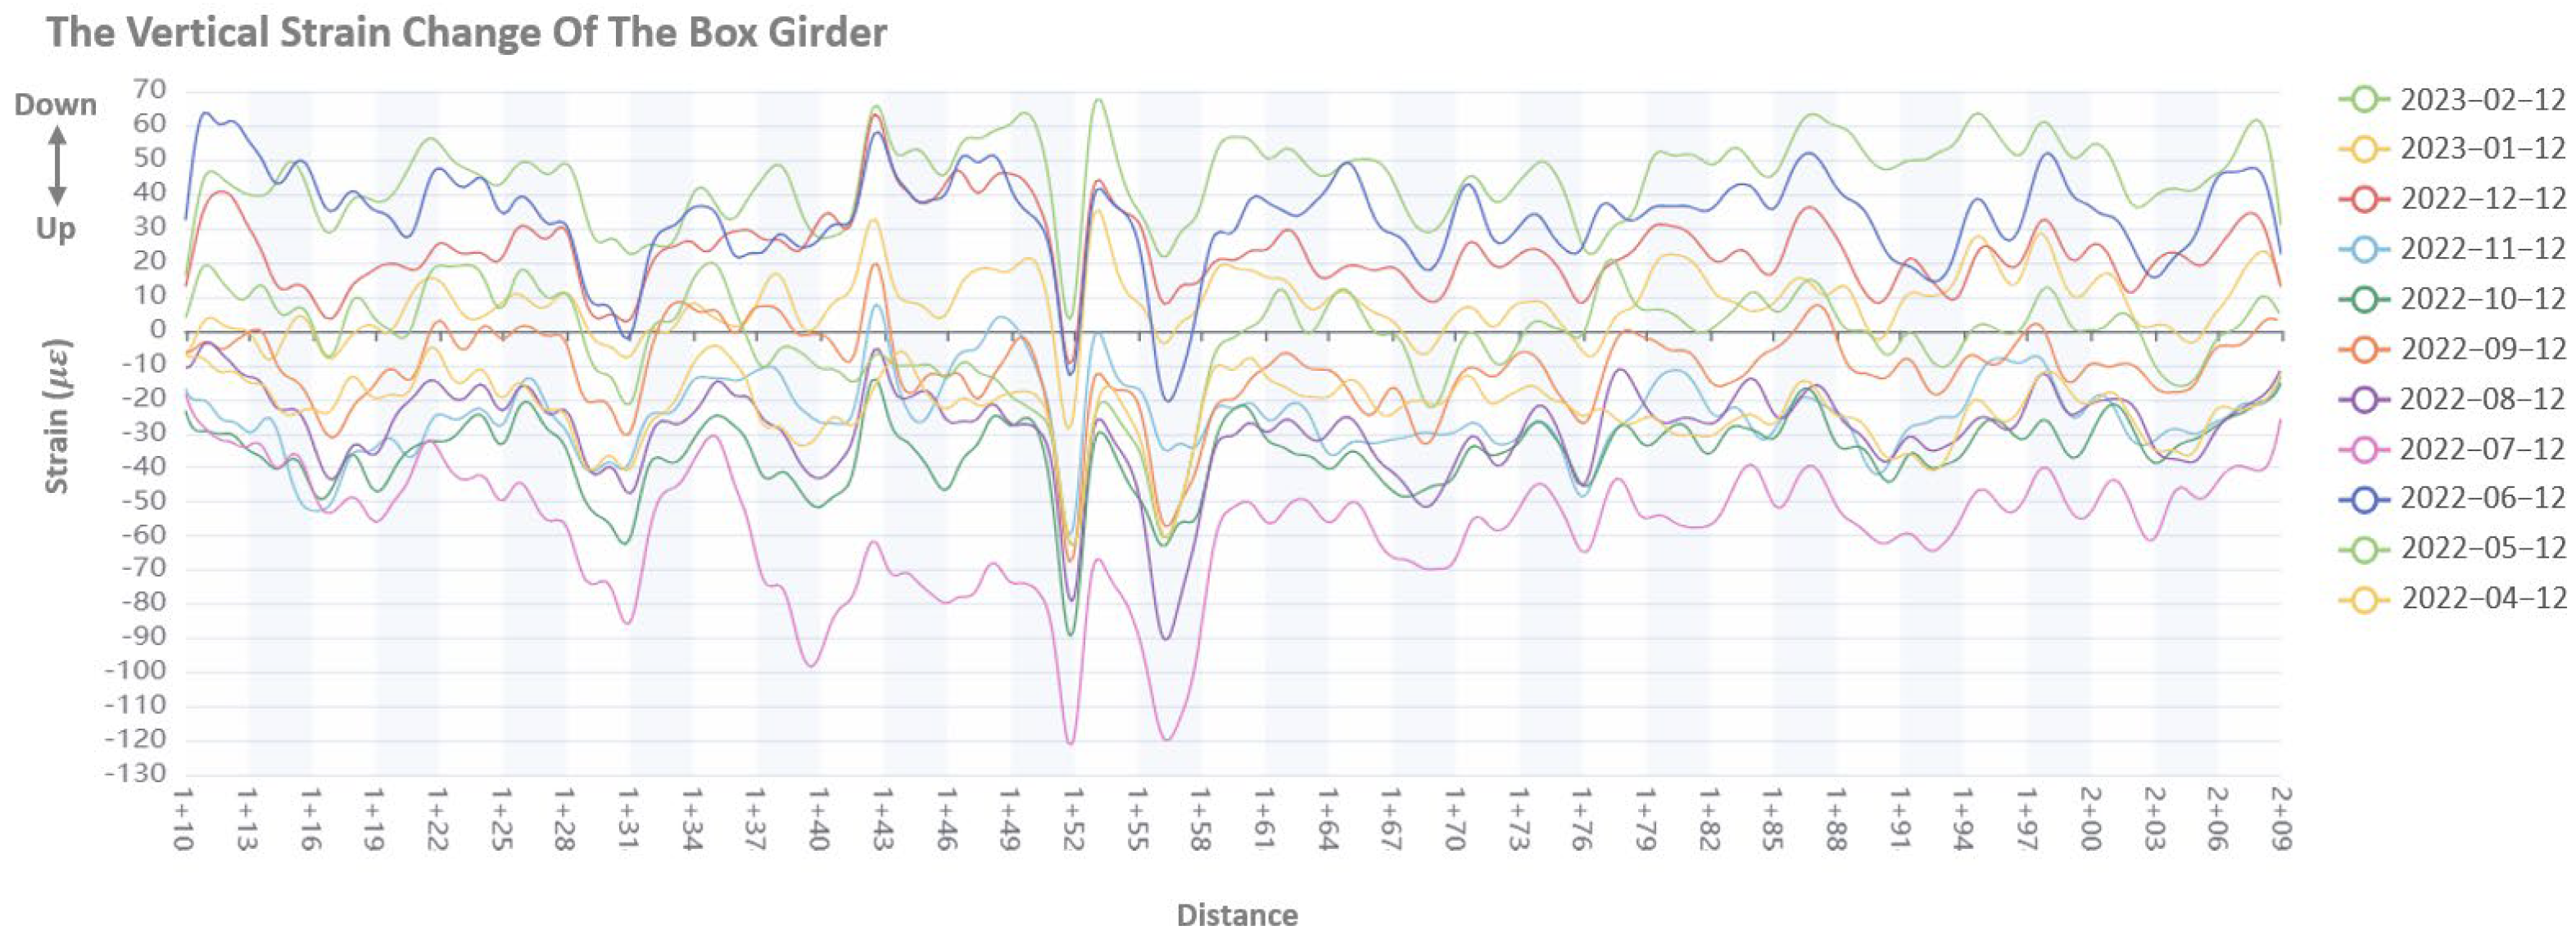
4.1. Strain Distribution of Box Girder

For this research, data were collected on the 12th of every month. For a single fiber, the length between data points was 5 cm and the length of the bridge span was 27.1 m, which equals 27.1 m/0.05 m = 542 data points for each span. There were a total of 33 bridge spans for this research, which amounts to 542 × 33 = 17,886 data points. Distance in this research are presented as n + m. The “n” stands for the serial number of the box girder, and “m” stands for distance in meters. The starting points of the box girder were at a distance of 30 m apart from each other. The period of measurement was from 12 April 2022 to 12 February 2023. Figure 8 shows the horizontal strain changes throughout the year. The horizontal strain change was obtained by subtracting the initial horizontal strain value from the measured horizontal strain of the DFOS data. The strain values were also processed through data smoothing. During the period of observation, the horizontal strain change was between 50 με and −10 με.
From this graph of horizontal strain change, for distances 1 + 79~1 + 82, 2 + 00~2 + 06, there is a uniform inclination of bending movement toward the east. At a distance of 1 + 10~1 + 13, there is a uniform bending movement towards the west, but the strain is relatively small. Whether this shift in strain makes a large enough difference to warrant further action will depend on continuous data monitoring and observation made over a long period of time.
The vertical strain change was obtained by subtracting the initial vertical strain value from the measured vertical strain of the DFOS data. During the period of observation, the vertical strain change was between −130 με and 70 με.
From this study of vertical strain, it is observed that there is a downward bending tendency throughout the distance of 1 + 40~1 + 43. Throughout the distance of 1 + 49 ~1 + 58, there is an upward bending tendency. According to Figure 8 and Figure 9, the vertical strain is greater than the horizontal strain. It is concluded that vertical strain is the larger affecting factor within this area of the box girder bridge.

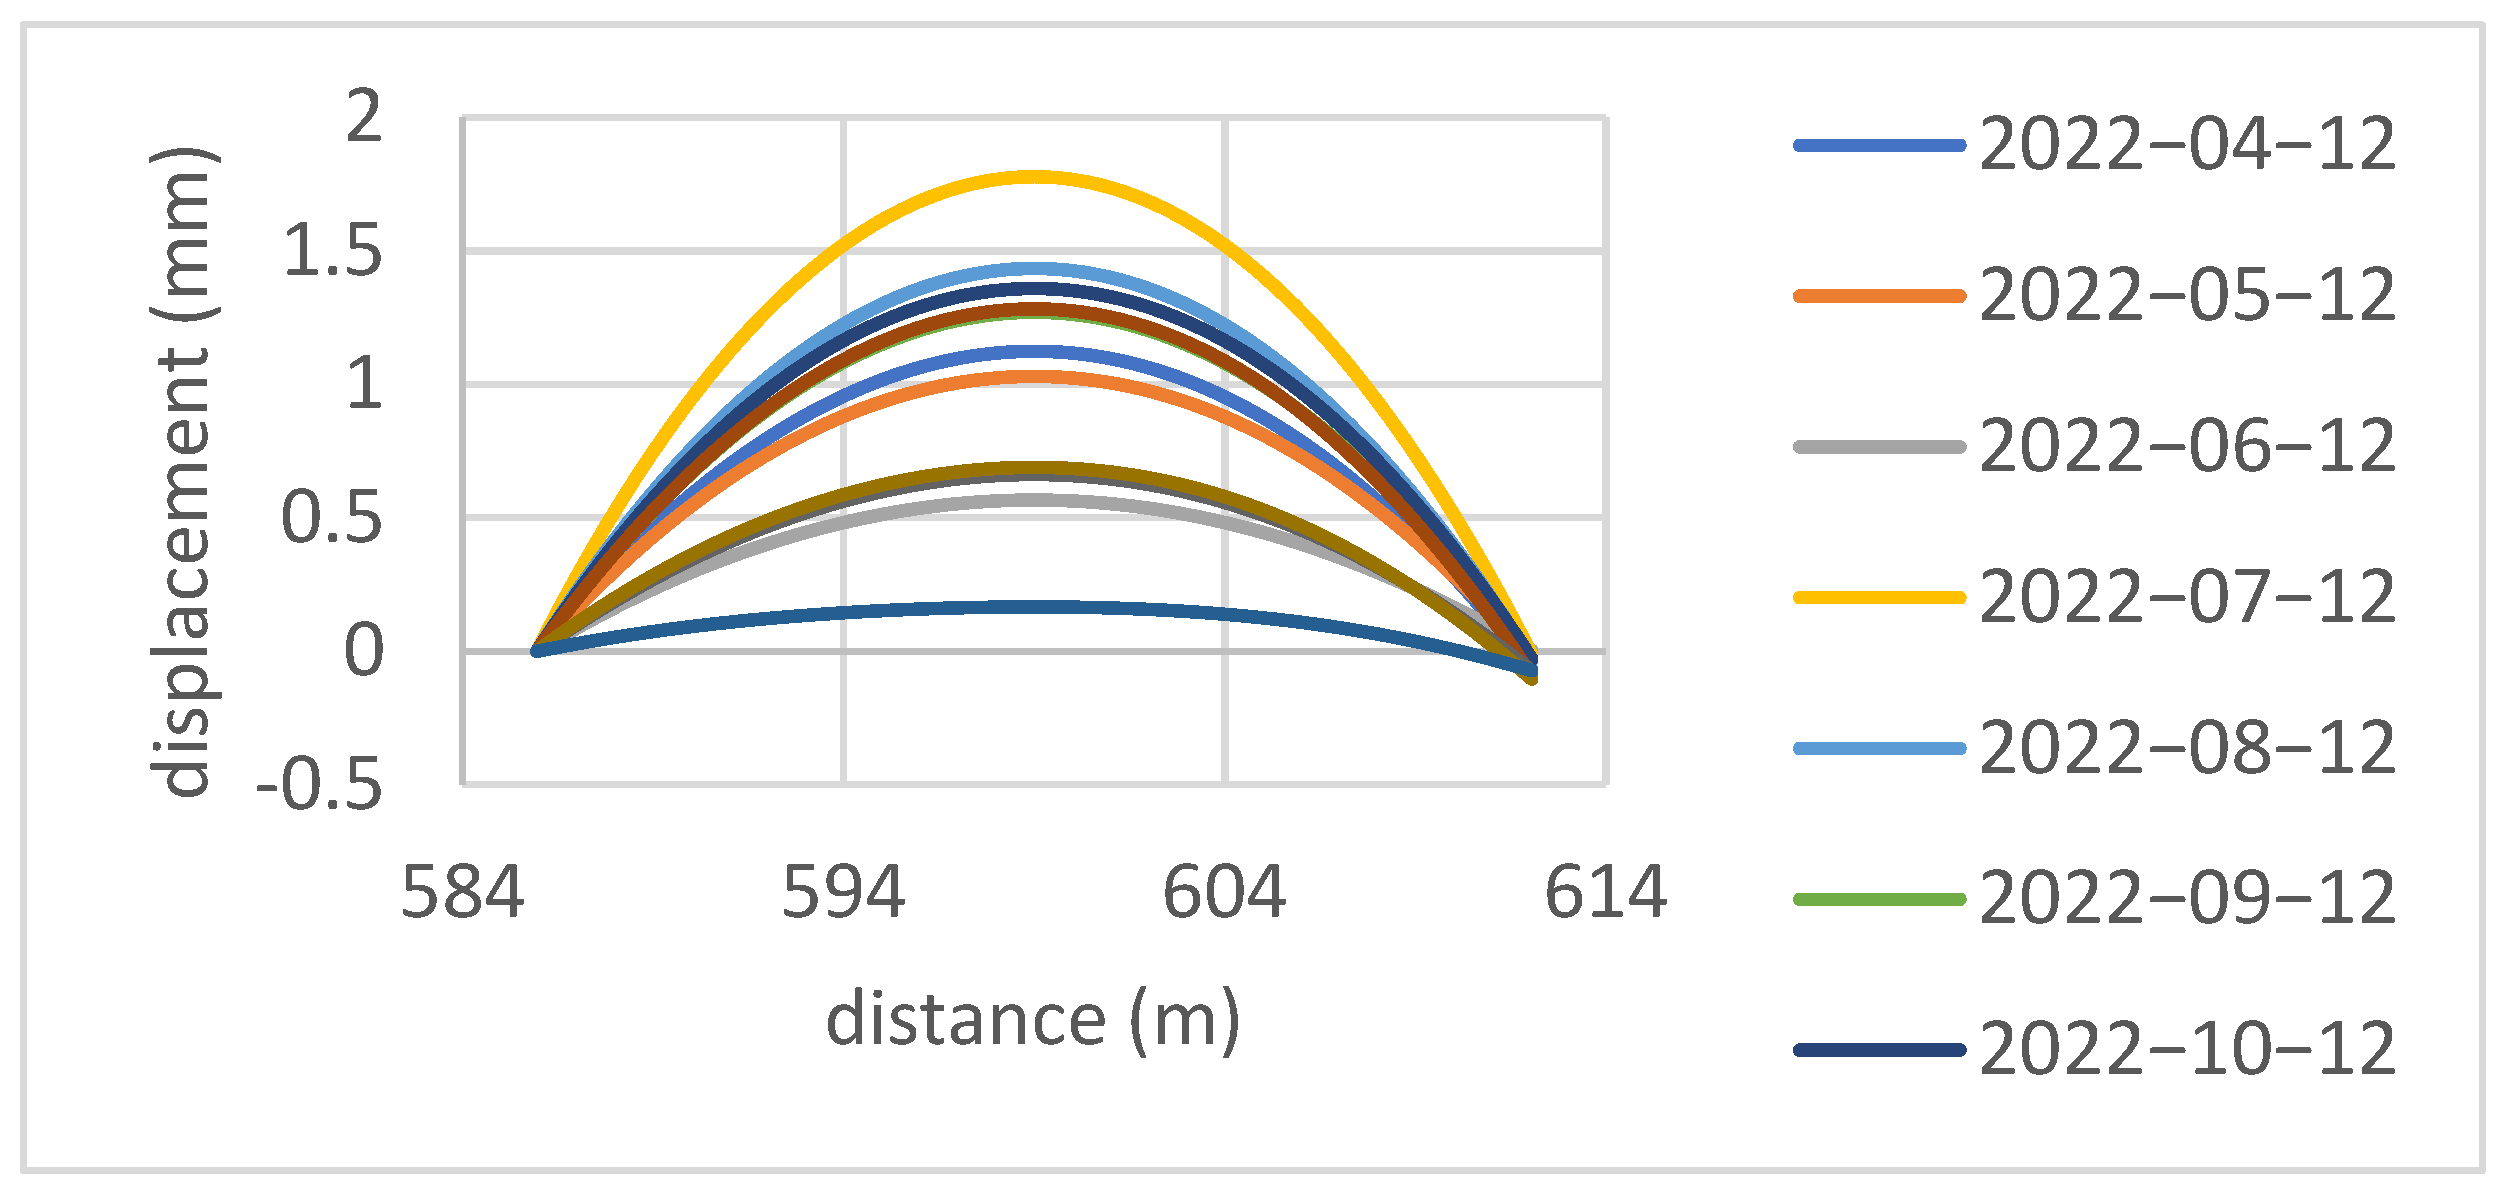
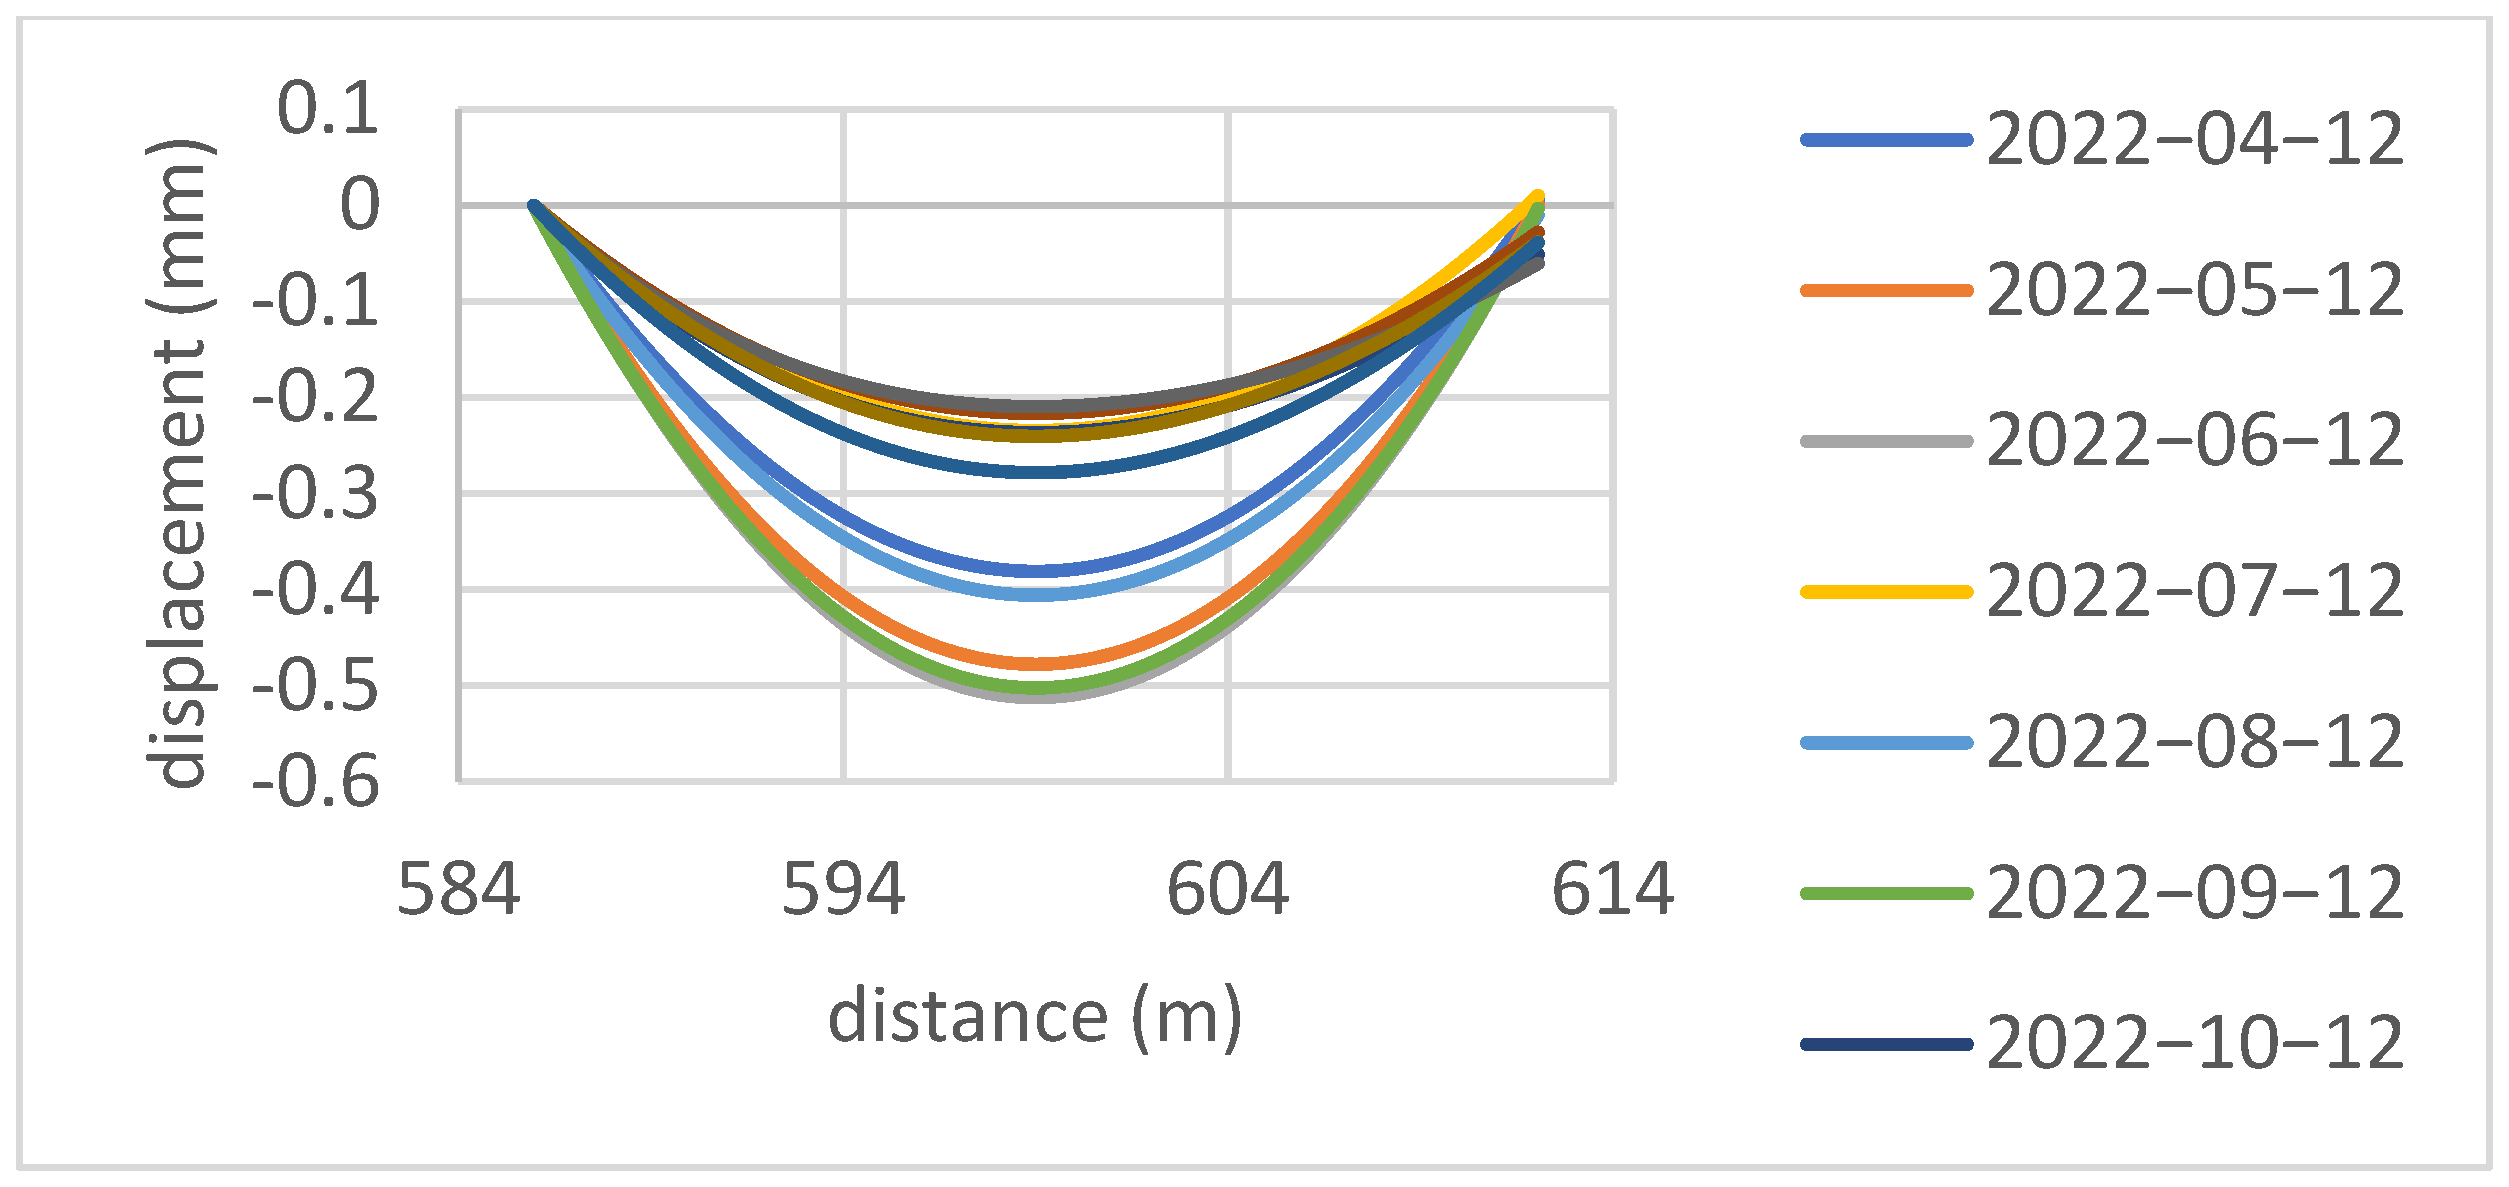
4.2. Displacement of Box Girder

By calculating the result of the box girder strain, displacement data for the box girder were gathered. The boundary condition was set according to the geometry of the box girder. Take the bridge pier of the box girder as the starting boundary condition for zero displacement. The boundary condition at the center of the bridge was set to a zero-degree deflection angle. Then, by integrating the strain data from the north pier to the south pier twice, we determined the displacement of the box girder (Figure 10).
Figure 11 and Figure 12 show the calculated results of the displacement of the box girder. It can be observed from Figure 11 that the box girder experiences convex displacement throughout the year, with a maximum value of 1.8 mm recorded in July. Figure 12 shows that the bridge is mainly convex toward the east side and has a maximum displacement value of roughly −0.5 mm. It also shows that, considering displacements for the structure of the box girder bridge, the horizontal portion may be more rigid and less susceptible to change compared to the vertical portion. The displacement data could be taken into consideration for structural maintenance or enhancement. Future designs for box girder bridges could be more closely related to the actual application.

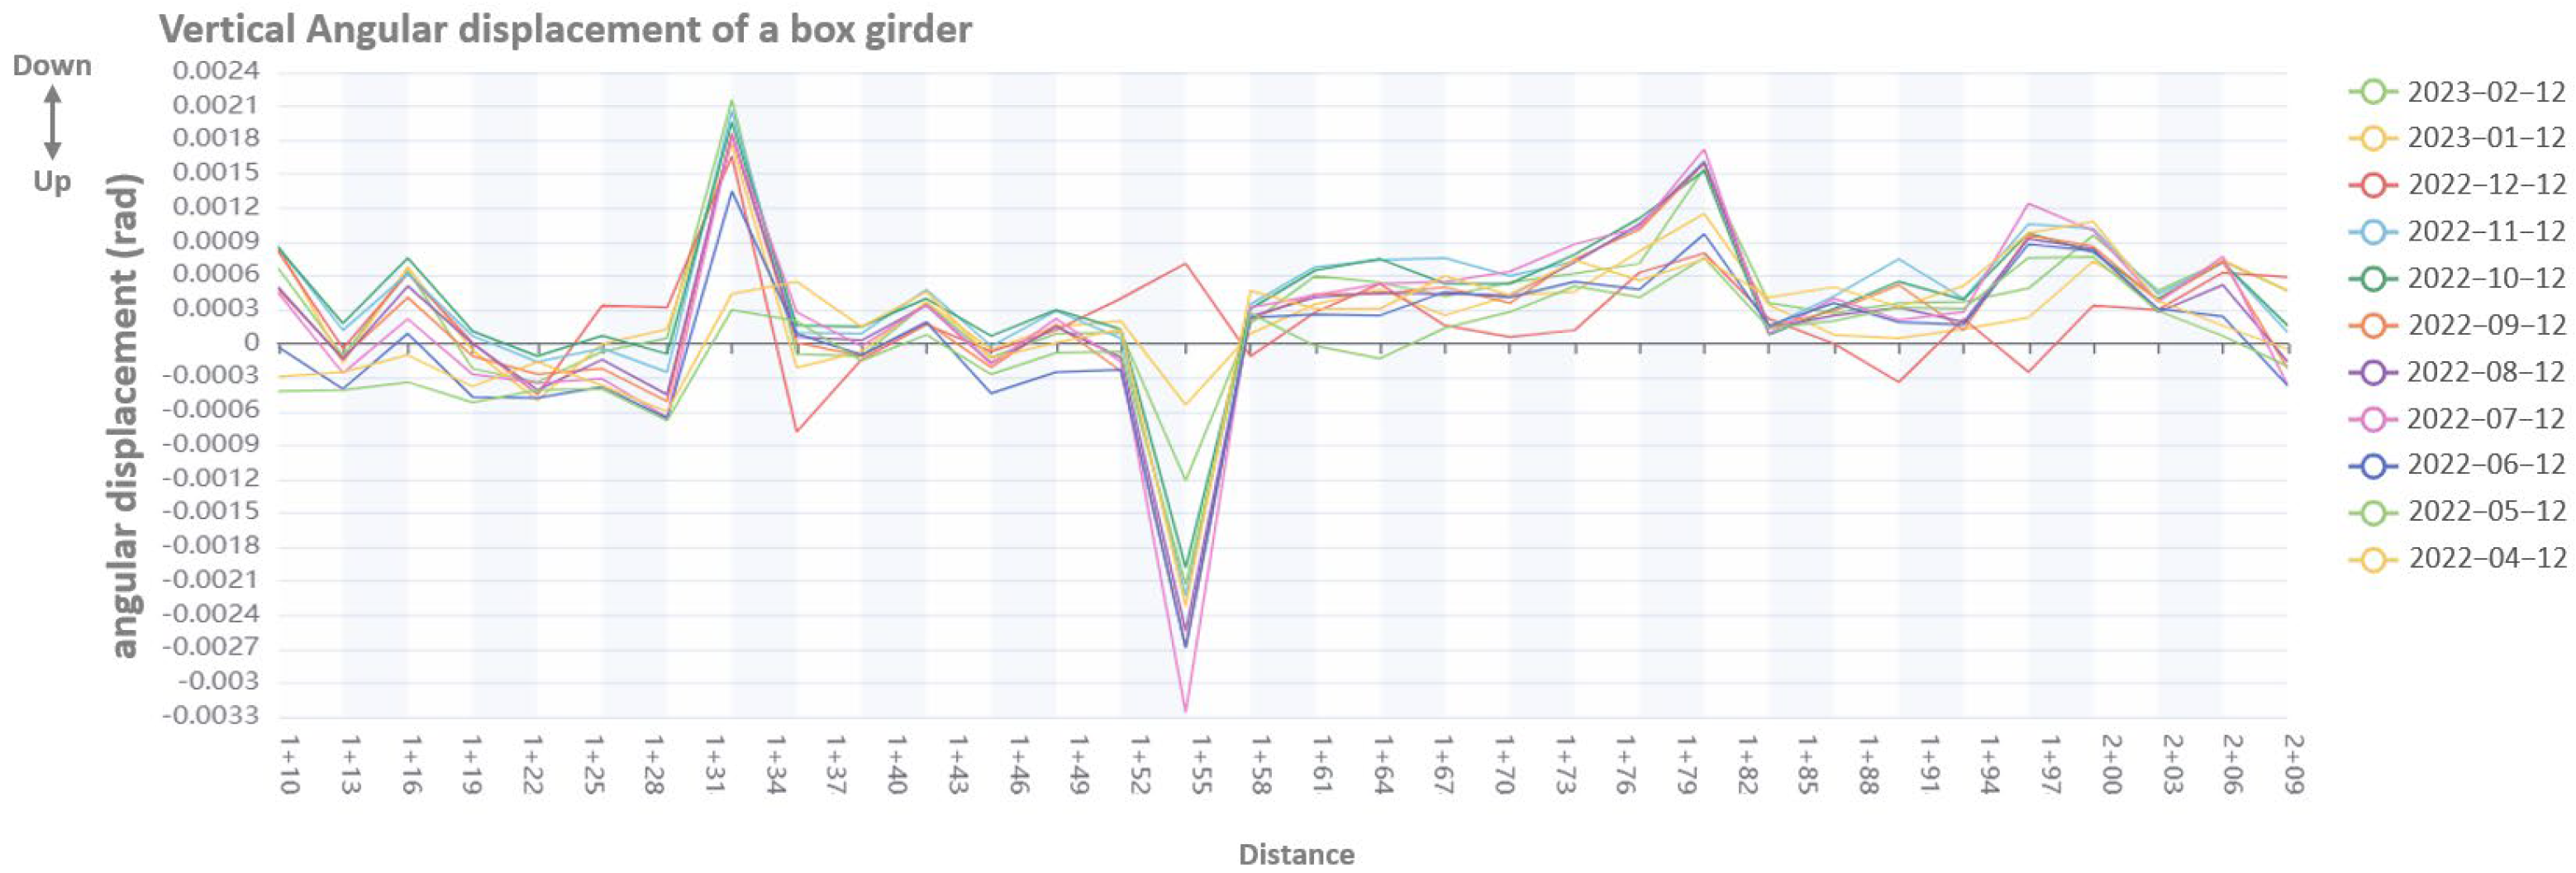
4.3. Angular Displacement across Multiple Expansion Joints

Figure 13 shows the horizontal angular displacement of the expansion joints at each measurement location. Positive angular displacement means that the box girder is curving eastward. The angular displacement on 1 + 55 is curving toward the west and on 1 + 64 and 1 + 79 towards the east. The magnitude of the angular displacement increases throughout the year.
Figure 14 shows the vertical angular displacement of the expansion joints at each measurement location. Positive angular displacement means that the box girder is curving downward. The angular displacement on 1 + 31 is curving downward, and on 1 + 55, it is curving upward. The magnitude of the angular displacement also increases throughout the year.

5. Conclusions

Traditionally, to determine the safety of bridges, manual inspections must be carried out. These inspections are mostly carried out by eye. This makes inspections prone to human error and not able to achieve real-time feedback. This research presents a new approach to monitoring bridge structures in real time. To monitor the bridge effectively, sensing fibers are attached to the bridge, and a DFOS system is used to collect the BFS of the fibers. The BFS is then calculated as the strain of the fiber by excluding the factor of temperature change. The strain data of the fiber can be processed into the strain data of the bridge structure by incorporating the bridge geometry into the calculation. Furthermore, data on bridge displacement and deformation can be acquired through data processing techniques. By analyzing the above data over time, engineers will be able to judge if a structure is deformed or on its way to failure. This will be the first time that the incremental movement of bride structures can be observed over a long period of time in high resolution across the length of a bridge.
Fiber optics systems applied to bridge monitoring provide more comprehensive and real-time data. Potential structural problems and deficiencies can be detected through the continuous monitoring of structural changes in a bridge. This enables malfunction detection and preventive maintenance to be performed beforehand. The safety and reliability of bridges have greatly improved, which will decrease accidents caused by structural problems. Bridge management personnel can better understand the condition of a bridge and take effective measurements to guarantee the safety of bridge transportation.
Future designs for bridges could reference data from this fiber sensor system and enable the manufacture of more structurally stable bridges. Cost reductions could also be achieved by decreasing overengineering. This study will prove to be valuable for the technological advancement of future bridge maintenance and overall structural safety.

Author Contributions

W.-K.H.: analysis, validation, and main editing and reviewing; H.-C.S., T.-H.H. and Y.-L.L.: analysis and validation; N.-T.Y. and N.-H.C.: physics model analysis, software programming and computation, on-site measurement, and data curation. All authors have read and agreed to the published version of the manuscript.

Funding

This research received no external funding.

Institutional Review Board Statement

Not applicable.

Informed Consent Statement

Not applicable.

Data Availability Statement

Data are contained within the article.

Acknowledgments

This test and study were conducted using a DFOS system and sensing fibers that were provided by OlitGlobal Technology (Kaohsiung, Taiwan) to measure the strain and temperature of the tested rail. We also thank the Taiwan High-Speed Rail Corporation for their assistance during the test period.

Conflicts of Interest

Authors Nien-Tsu Yang and Ning-Hsuan Chang were employed by the company OlitGlobal. The remaining authors declare that the research was conducted in the absence of any commercial or financial relationships that could be construed as a potential conflict of interest.

References

  1. Jing, G.; Qin, X.; Wang, H.; Deng, C. Developments, challenges, and perspectives of railway inspection robots. Autom. Constr. 2022, 138, 104242. [Google Scholar] [CrossRef]
  2. Hsu, W.-K.; Lee, Y.-L.; Kuan, T.-T. Brillouin Frequency Shift Sensing Technology Used in Railway Strain and Temperature Measurement. Appl. Sci. 2021, 11, 7101. [Google Scholar] [CrossRef]
  3. Yoon, H.-J.; Song, K.-Y.; Choi, C.; Na, H.-S.; Kim, J.-S. Real-Time Distributed Strain Monitoring of a Railway Bridge during Train Passage by Using a Distributed Optical Fiber Sensor Based on Brillouin Optical Correlation Domain Analysis. J. Sens. 2016, 2016, 9137531. [Google Scholar] [CrossRef]
  4. Liu, R.-M.; Meng, D.; Li, Z. Study on defects detection of a structure undergoing dynamic load. J. Vibroeng. 2015, 17, 1828–1836. [Google Scholar]
  5. Yoon, H.-J.; Kim, J.-S.; Song, K.-Y.; Cho, H.-W.; Jung, J.-Y. Distributed Strain Monitoring of Railway Composite Bogies Using a Brillouin Optical Correlation Domain Analysis System. Appl. Sci. 2018, 8, 1755. [Google Scholar] [CrossRef]
  6. Wheeler, L.N.; Take, W.A.; Hoult, N.A.; Le, H. The Use of Fiber Optic Sensing to Measure Distributed Rail Strains and Determine Rail Seat Forces Due to a Moving Train. Can. Geotech. J. 2019, 56, 1–13. [Google Scholar] [CrossRef]
  7. Zhang, Z.; Sun, Y.; Zhang, Q.; Duan, J.; Gao, L. Applications of optical frequency-domain reflectometry technology in strain-deformed configuration conversion of structural surface deformed configuration measurement. Int. J. Distrib. Sens. Netw. 2019, 15, 1550147719891636. [Google Scholar] [CrossRef]
  8. Michael, I. Novel Applications of Distributed Fiber-Optic Sensing in Geotechnical Engineering; vdf Hochschulverlag AG: Zollikon, Switzerland, 2012. [Google Scholar] [CrossRef]
  9. Minardo, A.; Persichetti, G.; Testa, G.; Zeni, L.; Bernini, R. Long term structural health monitoring by Brillouin fibre-optic sensing: A real case. J. Geophys. Eng. 2012, 9, S64–S69. [Google Scholar] [CrossRef]
  10. Siwowski, T.; Rajchel, M.; Howiacki, T.; Sieńko, R.; Bednarski, Ł. Distributed fibre optic sensors in FRP composite bridge monitoring: Validation through proof load tests. Eng. Struct. 2021, 246, 113057. [Google Scholar] [CrossRef]
  11. Galindez, C.A.; Madruga, F.J.; Lomer, M.; Cobo, A.; Lopez-Higuera, J.M. Effect of humidity on optical fiber distributed sensor based on Brillouin scattering. In Proceedings of the 2018 SPIE—The International Society for Optical Engineering, Perth, Australia, 15–18 April 2008. [Google Scholar] [CrossRef]
  12. Schreier, A.; Wosniok, A.; Liehr, S.; Krebber, K. Humidity-induced Brillouin frequency shift in perfluorinated polymer optical fibers. Opt. Express 2018, 26, 22307–22314. [Google Scholar] [CrossRef] [PubMed]
  13. Sun, Y.; Shi, B.; Zhang, D.; Tong, H.; Wei, G.; Xu, H. Internal Deformation Monitoring of Slope Based on BOTDR. J. Sens. 2016, 2016, 9496285. [Google Scholar] [CrossRef]
  14. Klug, F.; Lackner, S.; Lienhart, W. Monitoring of Railway Deformations using Distributed Fiber Optic Sensors. In Proceedings of the Joint International Symposium on Deformation Monitoring (JISDM), Wien, Austria, 30 March–1 April 2016; p. 8. [Google Scholar]
  15. Rajeev, P.; Kodikara, J.; Chiu, W.K.; Kuen, T. Distributed Optical Fibre Sensors and Their Applications in Pipeline Monitoring. Key Eng. Mater. 2013, 558, 424–434. [Google Scholar] [CrossRef]
  16. Lu, P.; Lalam, N.; Badar, M.; Liu, B.; Chorpening, B.T.; Buric, M.P.; Ohodnicki, P.R. Distributed optical fiber sensing: Review and perspective. Appl. Phys. Rev. 2019, 6, 041302. [Google Scholar] [CrossRef]
  17. Horiguchi, T.; Kurashima, T.; Tateda, M. Tensile strain dependence of Brillouin frequency shift in silica optical fibers. IEEE Photonics Technol. Lett. 1989, 1, 107–108. [Google Scholar] [CrossRef]
  18. Horiguchi, T.; Shimizu, K.; Kurashima, T.; Tateda, M.; Koyamada, Y. Development of a distributed sensing technique using Brillouin scattering. J. Light. Technol. 1995, 13, 1296–1302. [Google Scholar] [CrossRef]
  19. Kurashima, T.; Horiguchi, T.; Tateda, M. Thermal effects on the Brillouin frequency shift in jacketed optical silica fibers. Appl. Opt. 1990, 29, 2219–2222. [Google Scholar] [CrossRef] [PubMed]
  20. Bednarski, Ł.; Sieńko, R.; Grygierek, M.; Howiacki, T. New Distributed Fibre Optic 3DSensor with Thermal Self-Compensation System: Design, Research and Field Proof Application Inside Geotechnical Structure. Sensors 2021, 21, 5089. [Google Scholar] [CrossRef] [PubMed]
Figure 1. Coordinate system of the box girder.
Applsci 14 07883 g001
Figure 2. Cross-section of the box girder.
Applsci 14 07883 g002
Figure 3. The directional curvature.
Applsci 14 07883 g003
Figure 4. Calculating fiber positions into up, down, east, and west.
Applsci 14 07883 g004
Figure 5. Angular displacement of the box girder.
Applsci 14 07883 g005
Figure 6. (a) Sensing fiber imbedded with steel wires. (b) Fiber location on the box girder. (c) Cross-section of an installed sensing fiber.
Applsci 14 07883 g006
Figure 7. System for data collection.
Applsci 14 07883 g007
Figure 8. Horizontal strain change in the box girder.
Applsci 14 07883 g008
Figure 9. Vertical strain change in the box girder.
Applsci 14 07883 g009
Figure 10. Boundary conditions of the bridge.
Applsci 14 07883 g010
Figure 11. Vertical displacement of a box girder.
Applsci 14 07883 g011
Figure 12. Horizontal displacement of a box girder.
Applsci 14 07883 g012
Figure 13. Horizontal angular displacement of a box girder.
Applsci 14 07883 g013
Figure 14. Vertical angular displacement of a box girder.
Applsci 14 07883 g014
Disclaimer/Publisher’s Note: The statements, opinions and data contained in all publications are solely those of the individual author(s) and contributor(s) and not of MDPI and/or the editor(s). MDPI and/or the editor(s) disclaim responsibility for any injury to people or property resulting from any ideas, methods, instructions or products referred to in the content.

