Article

Mechanical Responses and Fracture Evolution of Marble Samples Containing Stepped Fissures under Increasing-Amplitude Cyclic Loading

1
Shangri-La Yunkuang Hongniu Mining Co., Ltd., Shangri-La 674400, China
2
Department of Civil Engineering, School of Civil & Resource Engineering, University of Science & Technology Beijing, Beijing 100083, China
*
Author to whom correspondence should be addressed.
Appl. Sci. 2024, 14(17), 7919; https://doi.org/10.3390/app14177919
Submission received: 6 August 2024 / Revised: 25 August 2024 / Accepted: 27 August 2024 / Published: 5 September 2024

Abstract

:
This work aims to reveal the effect of rock bridge length (RBL), i.e., 10, 20, 30, or 40 mm, on the fatigue mechanical responses and fracture evolution of marble samples containing stepped fissures under multilevel cyclic loading paths. Comprehensive investigations were conducted on fatigue strength, deformation, damping evolution, and damage propagation. The test results demonstrate that fatigue strength, volumetric deformation, and fatigue lifetime increase as rock bridge length increases. The energy dissipation reflected by the damping ratio indicates that much energy is consumed to drive crack propagation, especially for rock with larger rock bridge segments at the final cyclic loading stage (CLS). An index of strain incremental rate is proposed to predict rock failure development. It is found that volumetric strain rate is a better early warning sign than axial strain rate. Warning time decreases with increasing rock bridge length; it is suggested that rock with large segments has good ability to resist external fatigue loading.

1. Introduction

As a typical geomaterial, rock mass is characterized by non-homogeneity, discontinuity, and anisotropy. Natural flaws, e.g., joints, weak planes, faults, cleavage, schistosity, etc., lead to non-linear geomechanical behaviors in naturally fractured rock mass [1,2,3,4,5]. The long-term stability of rock mass is obviously influenced by these discontinuities; notably, the structural deterioration of rock mass is accelerated when exposed to cyclic or fatigue loading [6,7,8,9]. Therefore, investigations into the mechanical responses of flawed rock mass are crucial to maintain the operation of underground rock infrastructures.
Laboratory mechanical tests like uniaxial compression or triaxial compression are often used to study the cyclic or fatigue mechanical properties of rock. These properties are affected not only by the geometric structure of flaws, but also by several loading parameters such as amplitude, frequency, mean stress, and the number of fatigue cycles [10,11,12,13]. Fatigue loading tests are categorized into constant-amplitude and variable-amplitude tests. Previous studies have primarily explored the influence of loading parameters—such as waveform, maximum stress, mean stress, amplitude, frequency, and cycle number—on the strength and deformation characteristics of rocks. The sinusoidal signal is widely acknowledged as closely resembling the dynamic waveforms generated by blast vibrations, earthquakes, or rock bursts. Therefore, sinusoidal stress waveforms are commonly employed in fatigue mechanical tests [14,15]. Variable-amplitude cyclic loading, involving multiple levels, is considered more representative of the actual stress conditions in engineered rock masses than constant-amplitude loading tests. Field monitoring data also confirm that rock masses experience multi-level fatigue loading [16,17,18]. In underground rock engineering, blasting- or mining-induced earthquakes impose non-constant-amplitude fatigue loading on the surrounding rock structures. Numerous studies have investigated intact or flawed rocks subjected to variable-amplitude or variable-frequency fatigue loading, revealing insights into rock deformation, damage propagation, and failure patterns from both mesoscopic and macroscopic perspectives [11,19,20]. Nevertheless, the impact of rock bridge segments on rock fatigue response remains uncertain. Non-connected rock bridge segments within the rock mass serves as high-energy storage zones that impede fissure connection and associated instability events.
In summary, there is a paucity of studies investigating the impact of rock bridge length (RBL) on volumetric deformation, damping characteristics, and damage evolution. Therefore, this study conducted a series of increasing-amplitude cyclic loading tests on marble samples with RBLs of 10 mm, 20 mm, 30 mm, and 40 mm. Fatigue mechanical properties, including damping effects, fatigue deformation, strain incremental rate, damage evolution, and fracture development, were systematically analyzed. The findings enhance the understanding of how rock bridge segments influence the fracture evolution of flawed rock and offer new insights into their role in resisting external fatigue disturbances.

2. Materials and Methods

2.1. Rock Sample Preparation

The rock material was obtained from a roadway of a lead–zinc polymetallic mine in Baoshan city, Yunnan Province, China. The lead–zinc polymetallic deposit, located in the northern part of Baoshan in the Sanjiang region, is a skarn-type polymetallic deposit hosted within Early Paleozoic carbonate rocks. The geographical coordinates are approximately 99°10′12″–99°11′31″ E and 25°33′46″–25°24′51″ N, with the mining area spanning 3.005 km², situated directly north of the Baoshan urban area at a straight-line distance of 40 km. The Baoshan block is delineated to the west by the Lushi suture zone, to the east by the Changning–Menglian suture zone, to the north by the intersection of the Nujiang–Ruili fault and the Lancangjiang fault, and to the south by the Dian–Burma–Thai–Malay block. Overall, it exhibits a wedge-shaped configuration that is narrower in the north and broader in the south, interposed between the Tengchong–Ruili block and the Lanping–Simao basin [21,22]. The block has undergone a geological history characterized by the formation, evolution, and closure of the Tethys Ocean, followed by the continental–continental collision orogeny between the Eurasian and Indian plates. This unique and complex tectonic environment, coupled with favorable metallogenic geological conditions, has created an advantageous setting for the concentration and mineralization of various useful metallic elements [23].
During the field investigation, as shown in Figure 1a, multiple intermittent joints were observed on the rock mass surface. Due to blast vibrations and excavation disturbance, it was found that the discontinuous joints were connected, increasing the risk of geo-disaster from spalling and collapse occurring at the roadway. The connection of the intermittent joints poses a huge threat to the stability of the roadway, and could affect normal mine production. As a result, the influence of intermittent joints on rock fracture exposed to dynamic loading needs to be thoroughly investigated. At the laboratory scale, marble samples were prepared with double-stepped fissures using a water jet (Figure 1b) to mimic the rock bridge structure. The water jet had a weak disturbance effect on the intact marble samples, ensuring the preparation quality of the tested marble samples. The combination of high-pressure water and garnet abrasive, emitted from a nozzle with a diameter of 0.75 mm, can create a defect with an aperture measuring 1 mm. The inclination of the fissures was determined from the field measurement of rock joints, and the fissure angle (α) was set to 30°. The rock bridge approach angle (β) was set to 75°. Four kinds of marble samples with different rock bridge lengths were prepared, i.e., 10 mm, 20 mm, 30 mm, and 40 mm. Figure 1c shows typical marble samples containing double-stepped fissures with different rock bridge lengths of 10, 20, 30, and 40 mm.

2.2. Experimental Setup

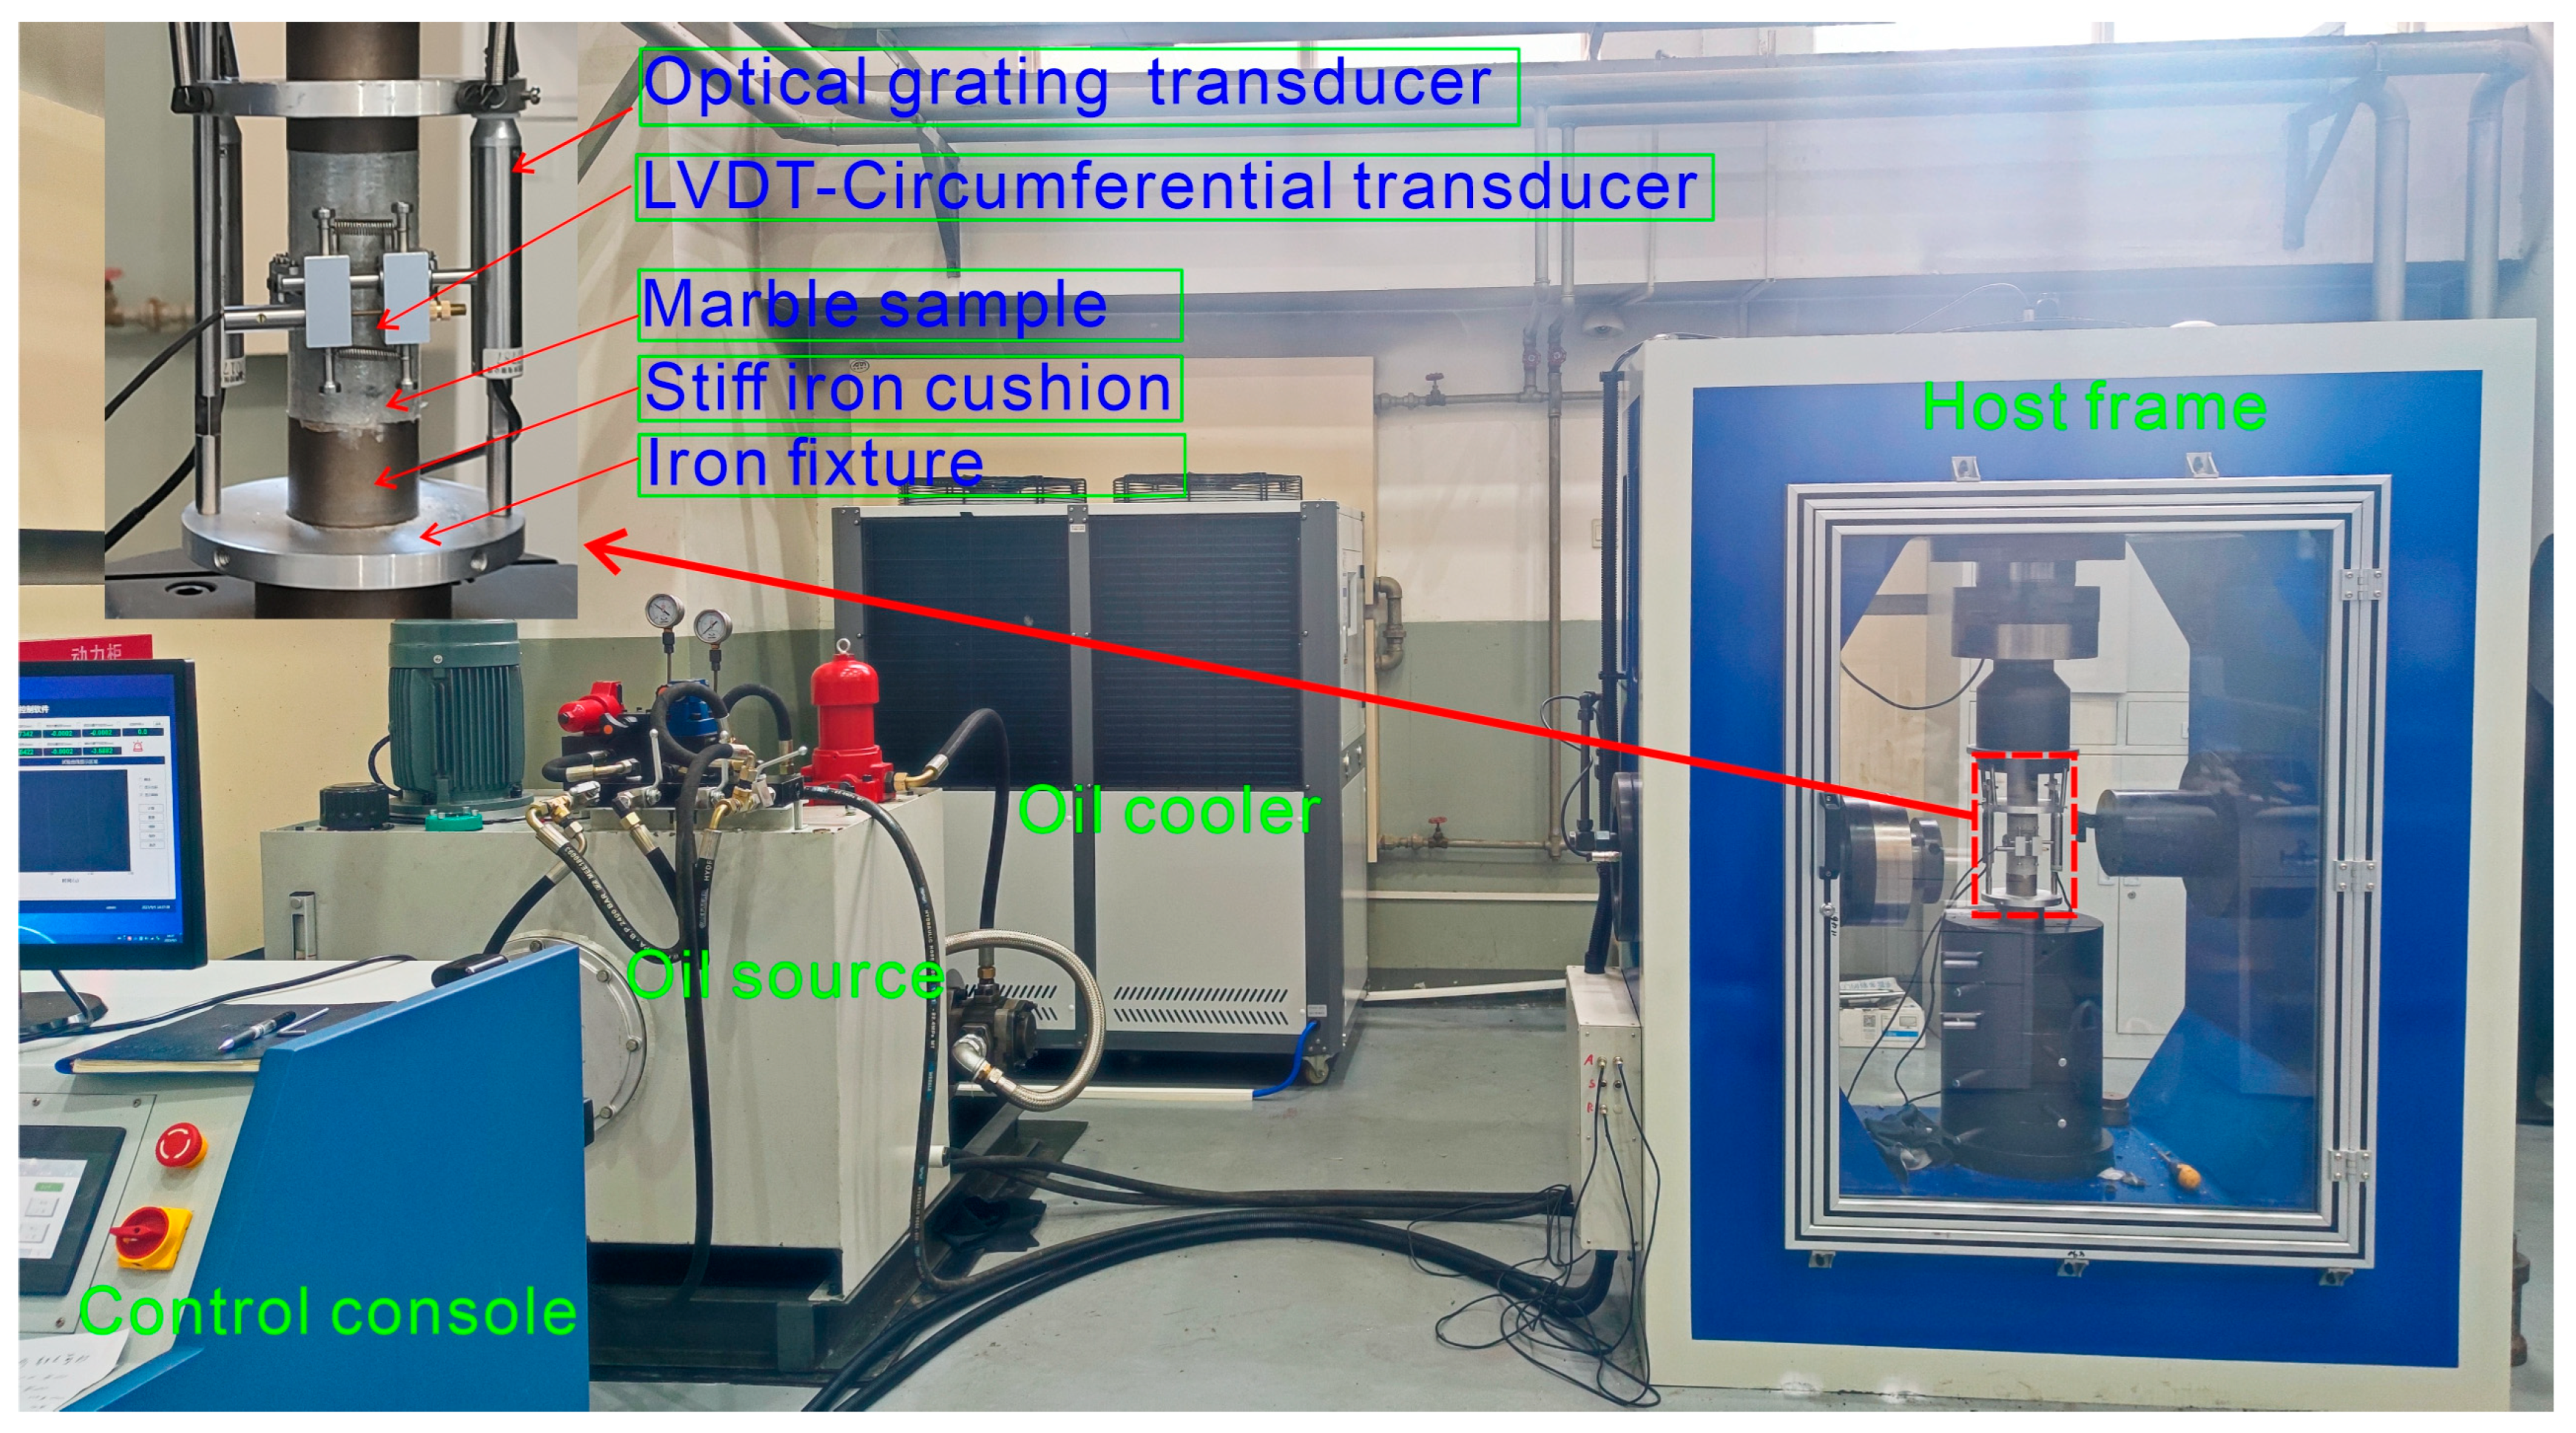
A servo-controlled fatigue mechanical apparatus (RTFS 1000) was employed to carry out the uniaxial increasing-amplitude cyclic loading test, as shown in Figure 2. The host frame has a stiffness of 8 GN/m and the maximum load capacity is 1000 kN. The testing machine has the capacity to apply complicated disturbance loading, e.g., sinusoidal, square, and triangular cyclic loading, on rock or rock-like specimens. The testing machine can achieve a dynamic loading frequency ranging from 0 to 10 Hz, with a maximum loading amplitude of 1.5 mm. Concurrently, a central computer was used to monitor the deformation and strength parameters, including axial strain, axial stress, and transverse strain, at the same sampling frequency. Axial strain is measured using two grating transducers accurate to 0.1 μm. Radial deformation is measured by a linear variable differential transformer (LVDT), positioned at the marble specimen’s center with a precision of 0.1 μm.

2.3. Testing Procedures

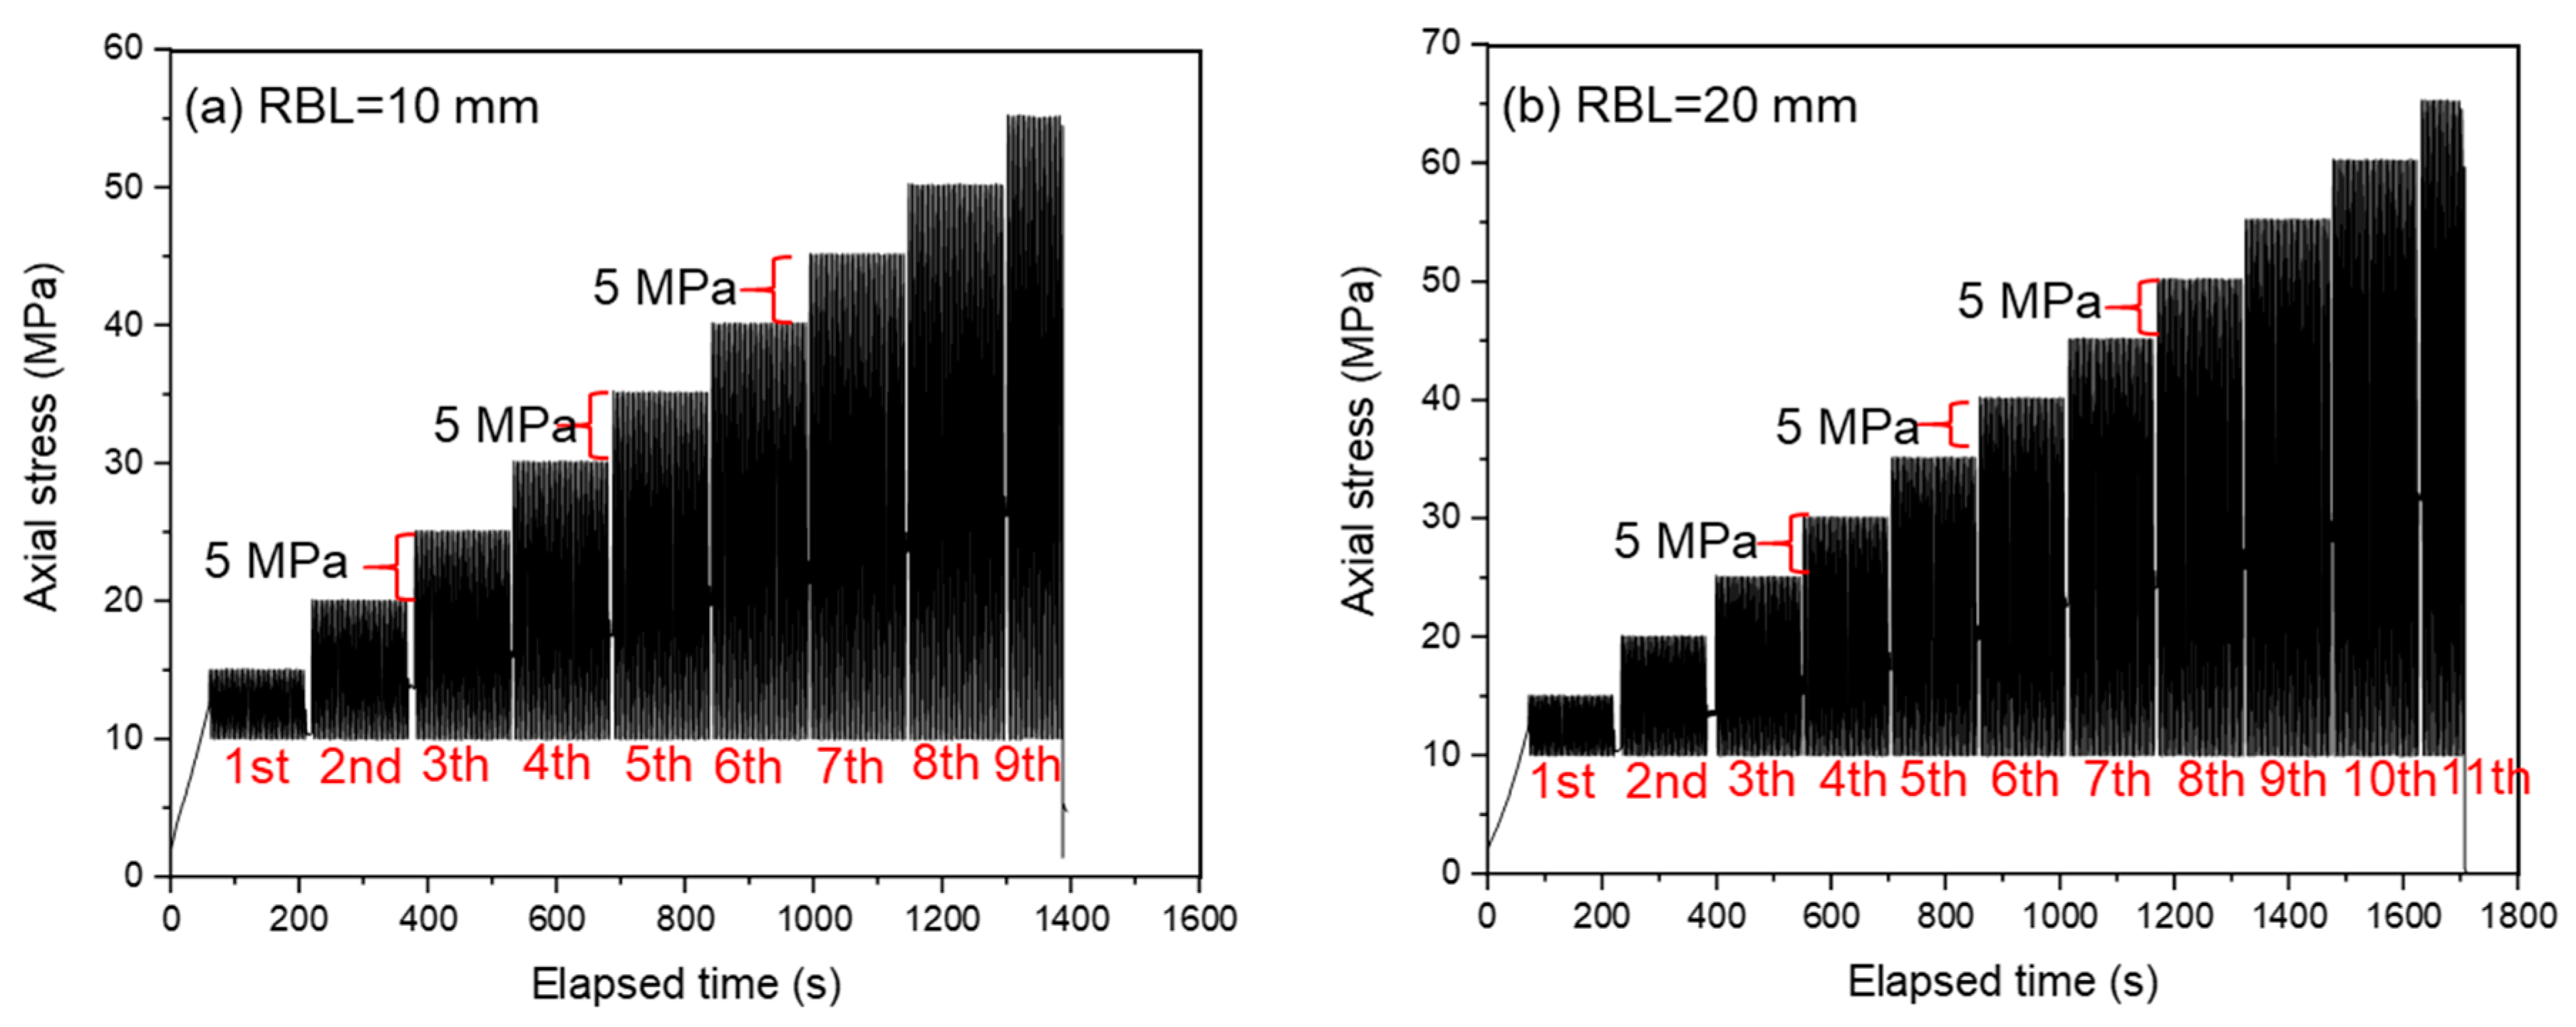
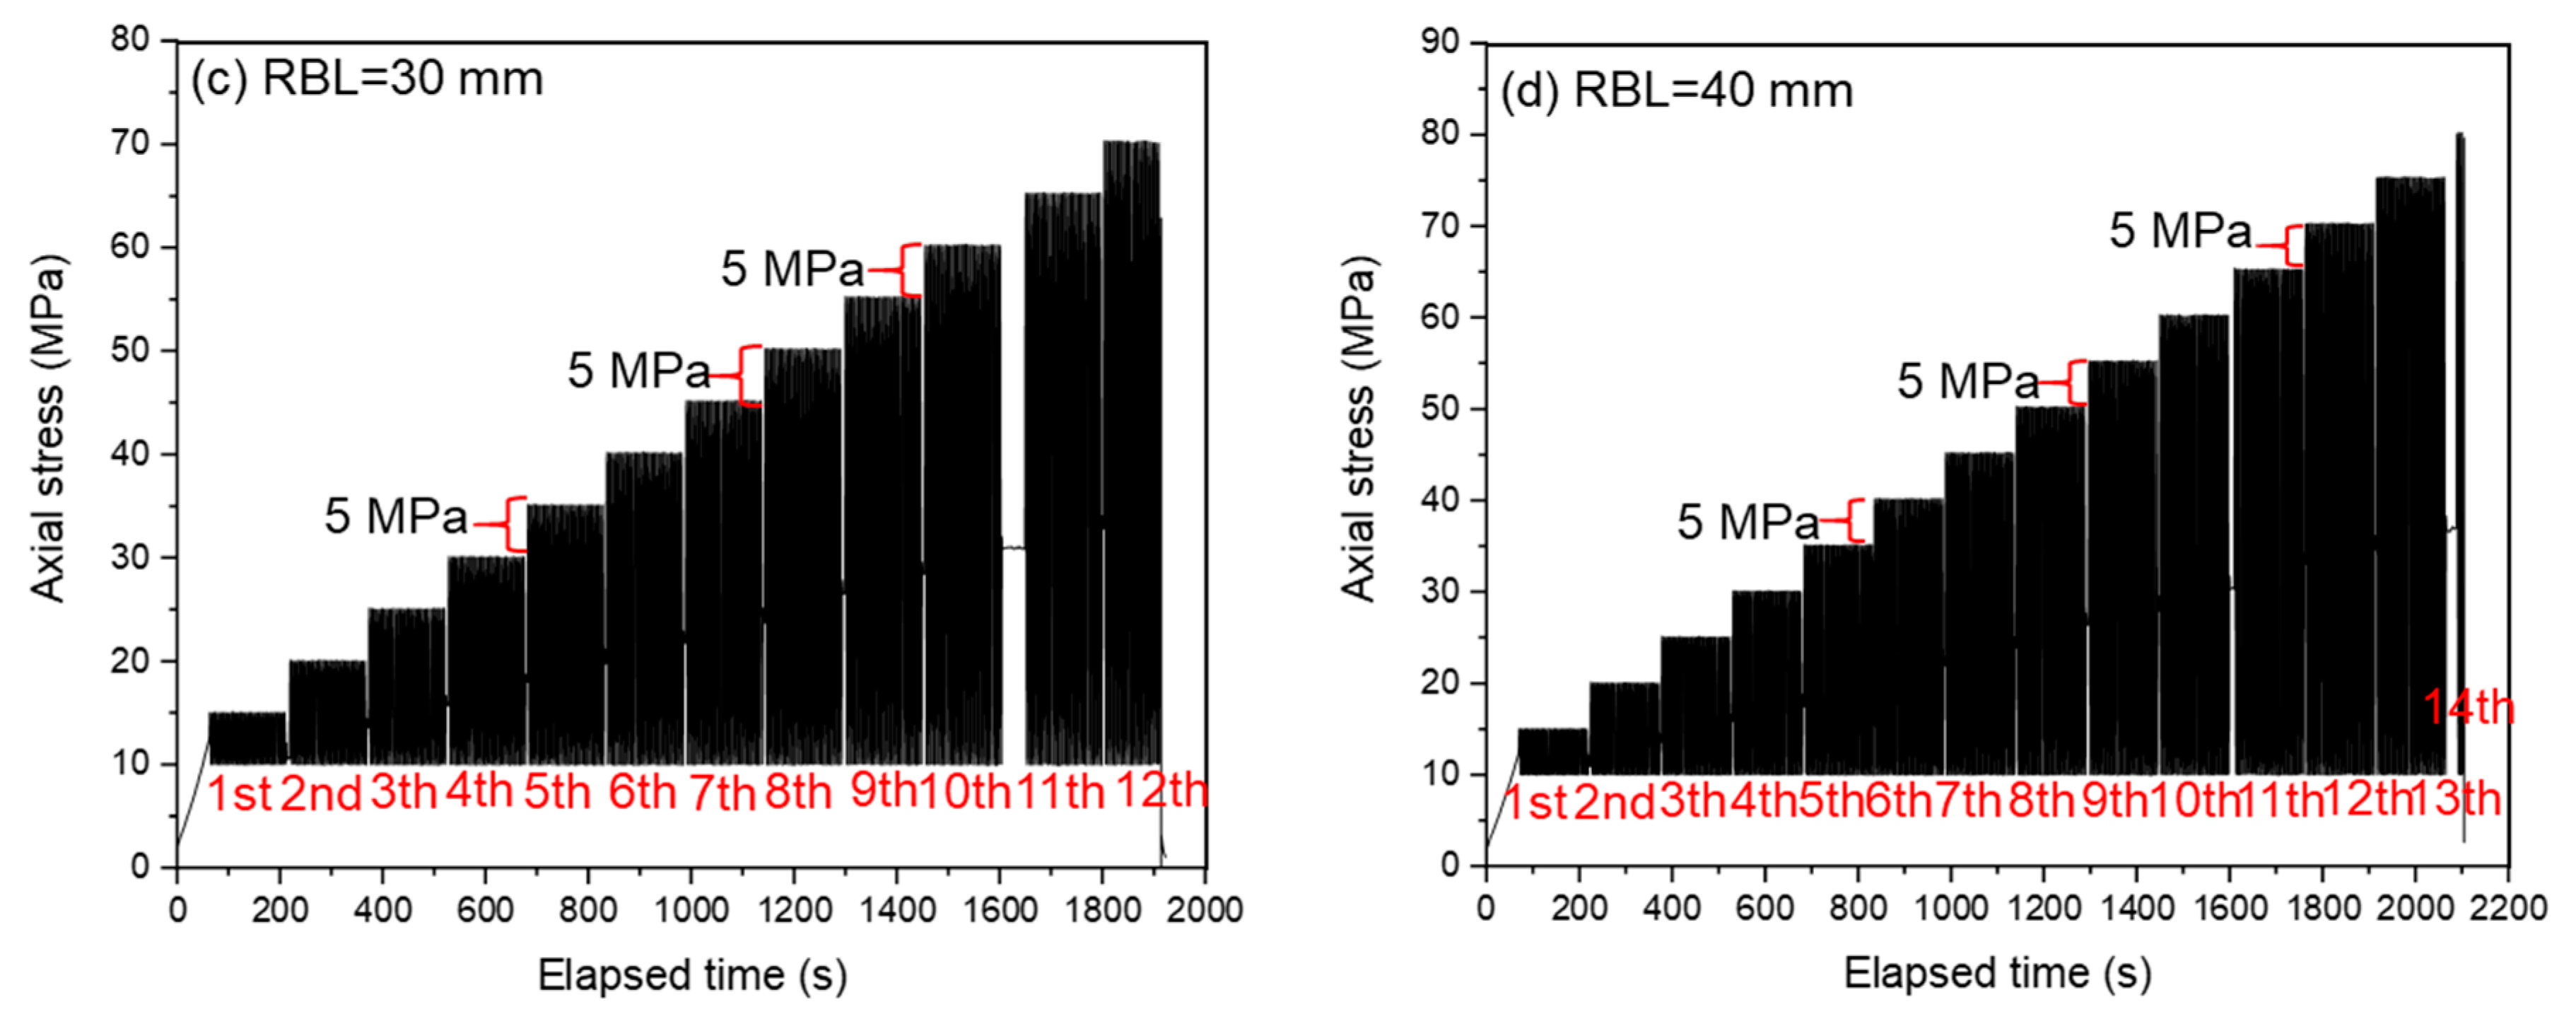
In this study, fatigue loading tests with multiple levels were conducted on marble samples containing double fissures. Initially, each sample was loaded to a stress of 10 MPa at a constant displacement rate of 0.06 mm/min (equivalent to 1.0 × 10⁻⁵ s−1). Subsequently, cyclic dynamic loading was applied based on the stress disturbance characteristics obtained from blast vibration measurements, utilizing a dynamic loading frequency of 0.5 Hz. This resulted in each cycle of loading and unloading being completed within 2 s.
During the fatigue loading process, the first cyclic dynamic loading stage involved applying a stress-controlled sinusoidal cyclic load with a stress amplitude of 5 MPa. In each subsequent cyclic loading stage (CLS), the stress amplitude was incremented by 5 MPa, also under sinusoidal cyclic loading control mode. This cycling of stress continued until the sample eventually failed. For each dynamic cyclic loading stage, the granite sample underwent 30 stress cycles per loading level. The testing protocol for marble is detailed in Table 1, where σmin is the fixed minimum cyclic stress (10 MPa), σmaxi is the maximum cyclic stress of the first CLS, σa is the increasing stress amplitude between two consecutive CLSs, σmaxf is the ultimate failure stress corresponding to rock failure, CLS is the cyclic loading stage, and CDF is the cyclic loading frequency. The differences in rock bridge length and rock failure at different CLSs and fatigue strengths are shown in Table 1 and Figure 3.

3. Testing Results

3.1. Typical Stress–Strain Responses

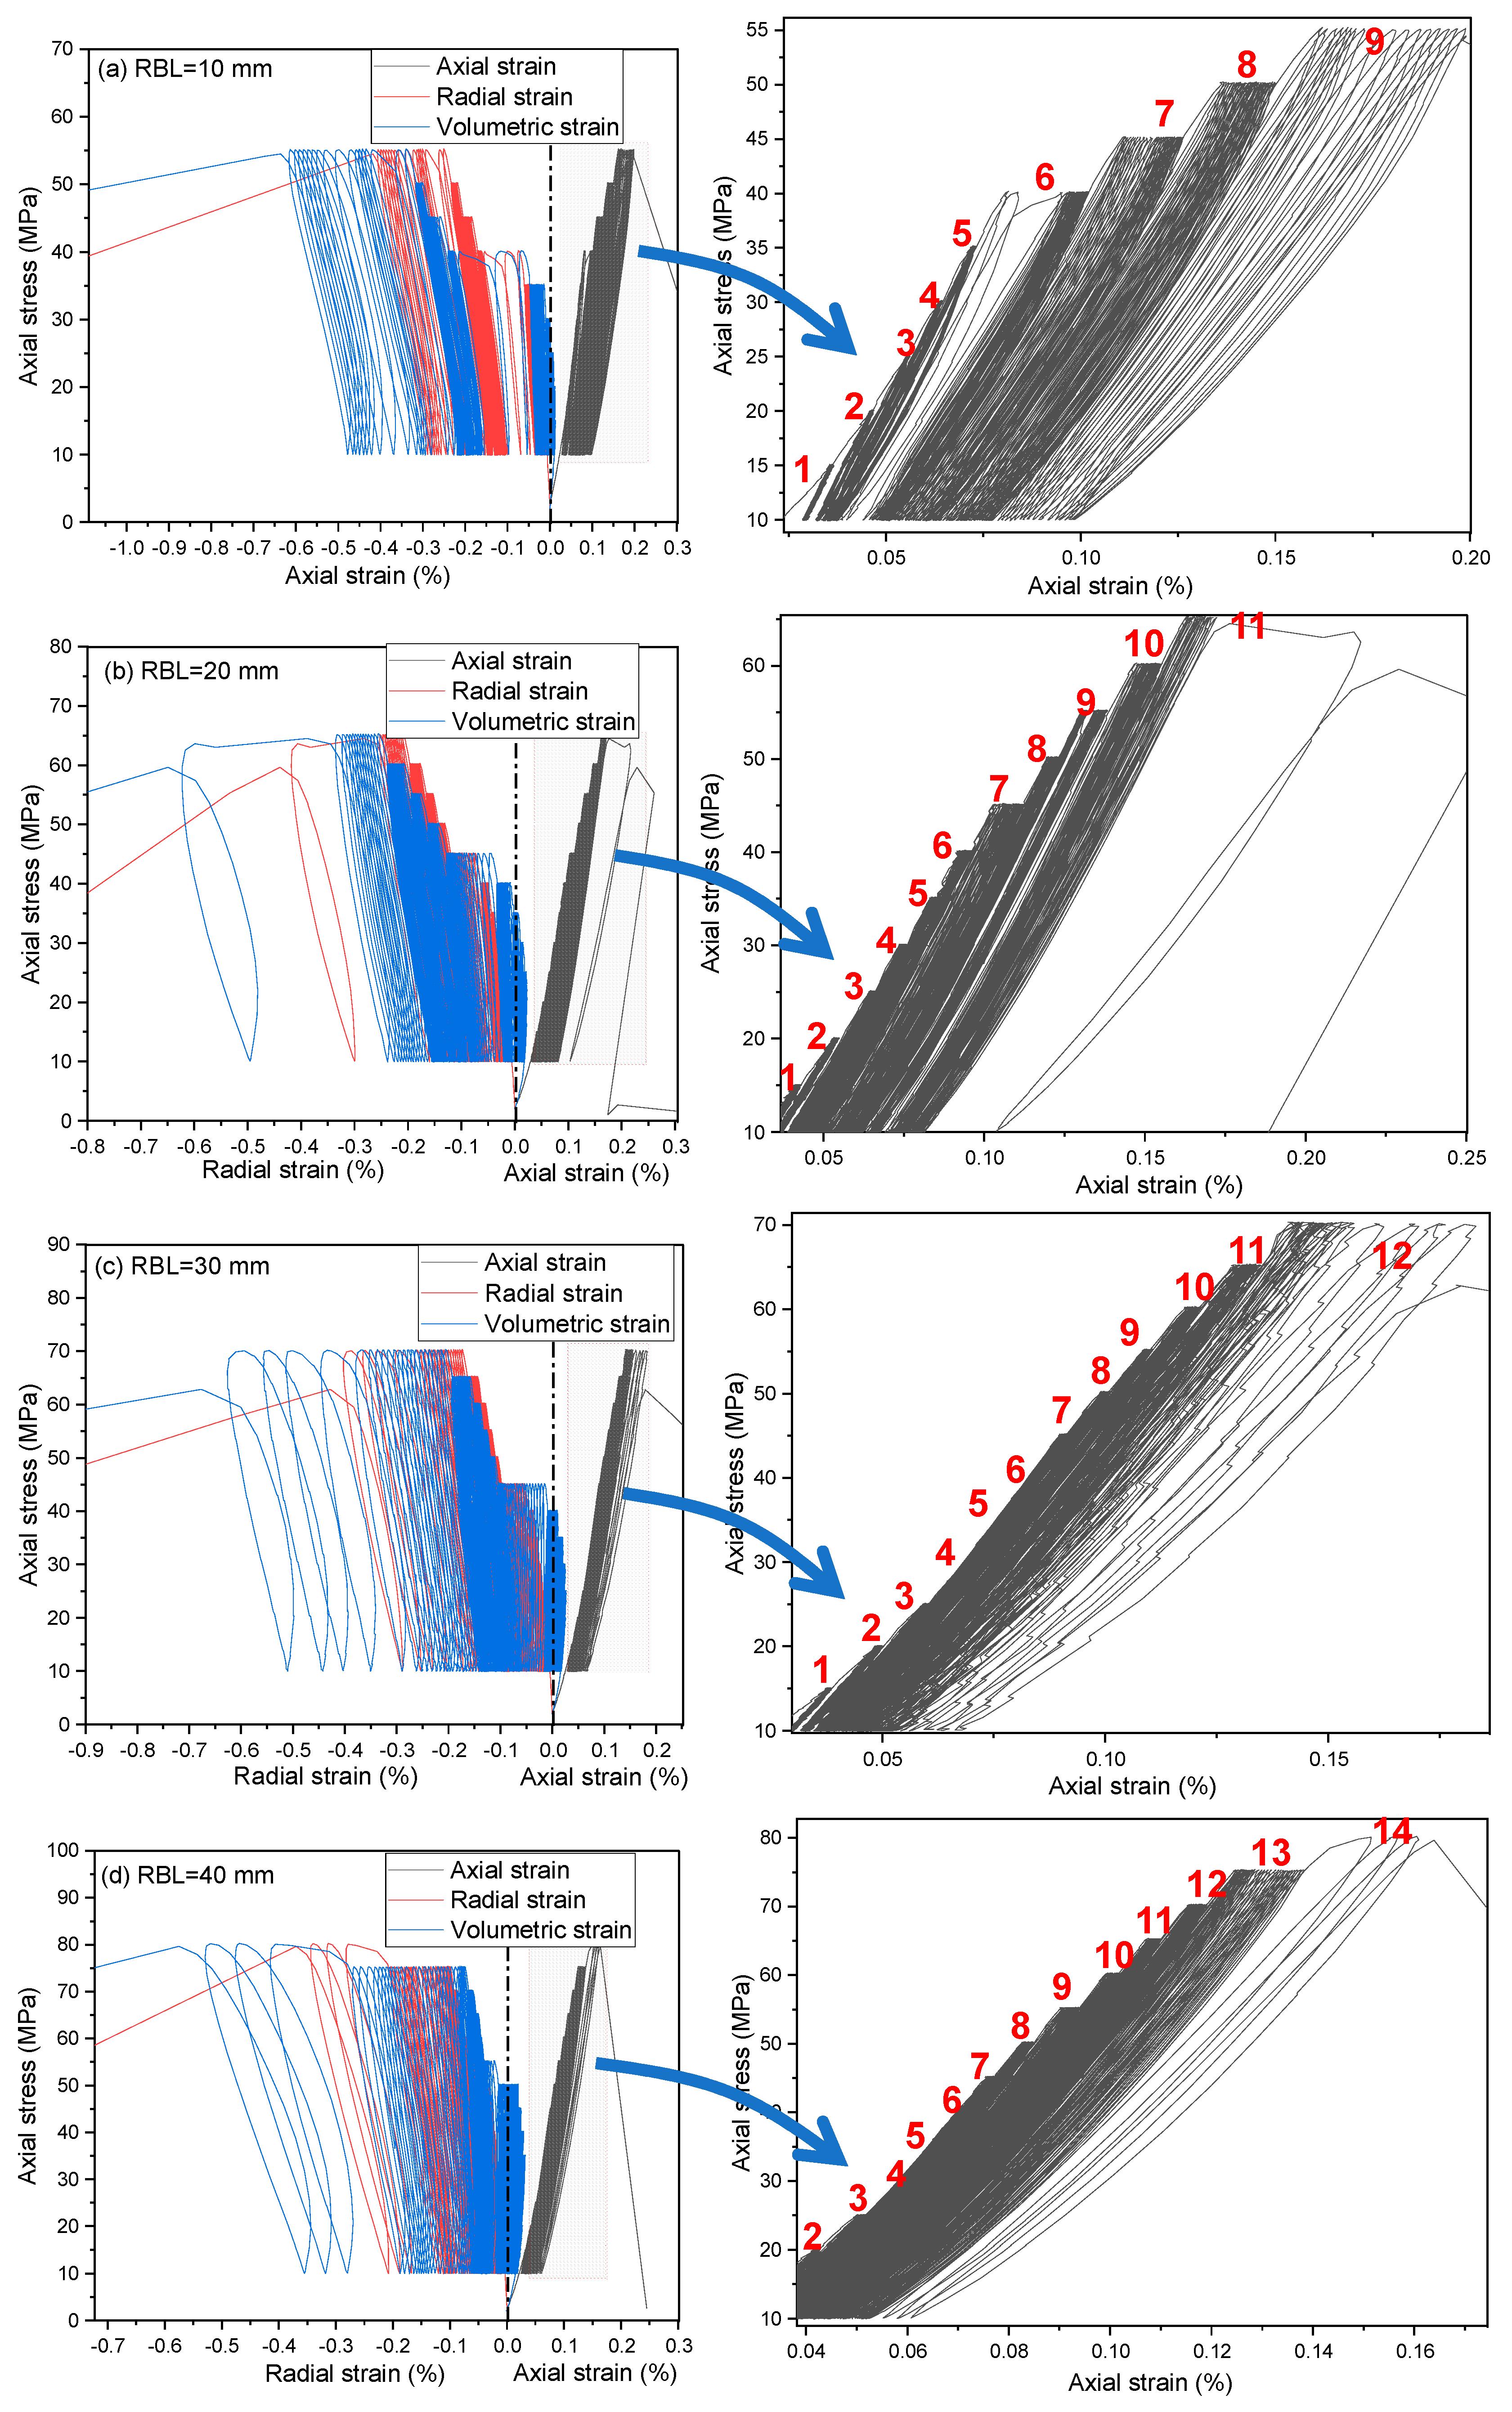
As depicted in Figure 4a–d, the samples were subjected to uniaxial increasing-amplitude fatigue loading paths. Influenced by rock bridge length, the marble samples exhibit varying fatigue loading stages and cycles before failure. The fatigue lifetime increases with longer rock bridge lengths, measuring 258, 316, 353, and 394 cycles, respectively, for samples with rock bridge lengths of 10 mm, 20 mm, 30 mm, and 40 mm. Irreversible plastic deformation causes the loading curve to deviate from the unloading curve, resulting in the formation of a hysteresis loop whose shape changes over time. After measuring axial strain (εa) and lateral strain (εr), volumetric strain (εv) can be calculated using the formula εv = εa − 2εr.
Volumetric strain in rock provides a more comprehensive reflection of its deformation characteristics by integrating both axial and lateral deformations. The shape of the hysteresis loop on the volumetric stress–strain curve varies across different stages of fatigue loading. Changes in the sparse and dense characteristics of volumetric strain exhibit distinct trends. The shape of the hysteresis loop is intricately linked to the behaviors of crack initiation, propagation, and coalescence. Before reaching the last fatigue loading stage, the hysteresis loop consistently shifts from sparse to dense at the onset of each loading stage. This shift indicates greater plastic deformation occurring with each increase in stress amplitude. However, during the final loading stage, the hysteresis loop gradually becomes sparser until the granite samples eventually fail. This progression suggests that significantly more energy is expended to form the crack coalescence pattern, resulting in greater energy dissipation during the last cyclic stage compared to the preceding loading stages.

3.2. Deformation Characteristics Analysis

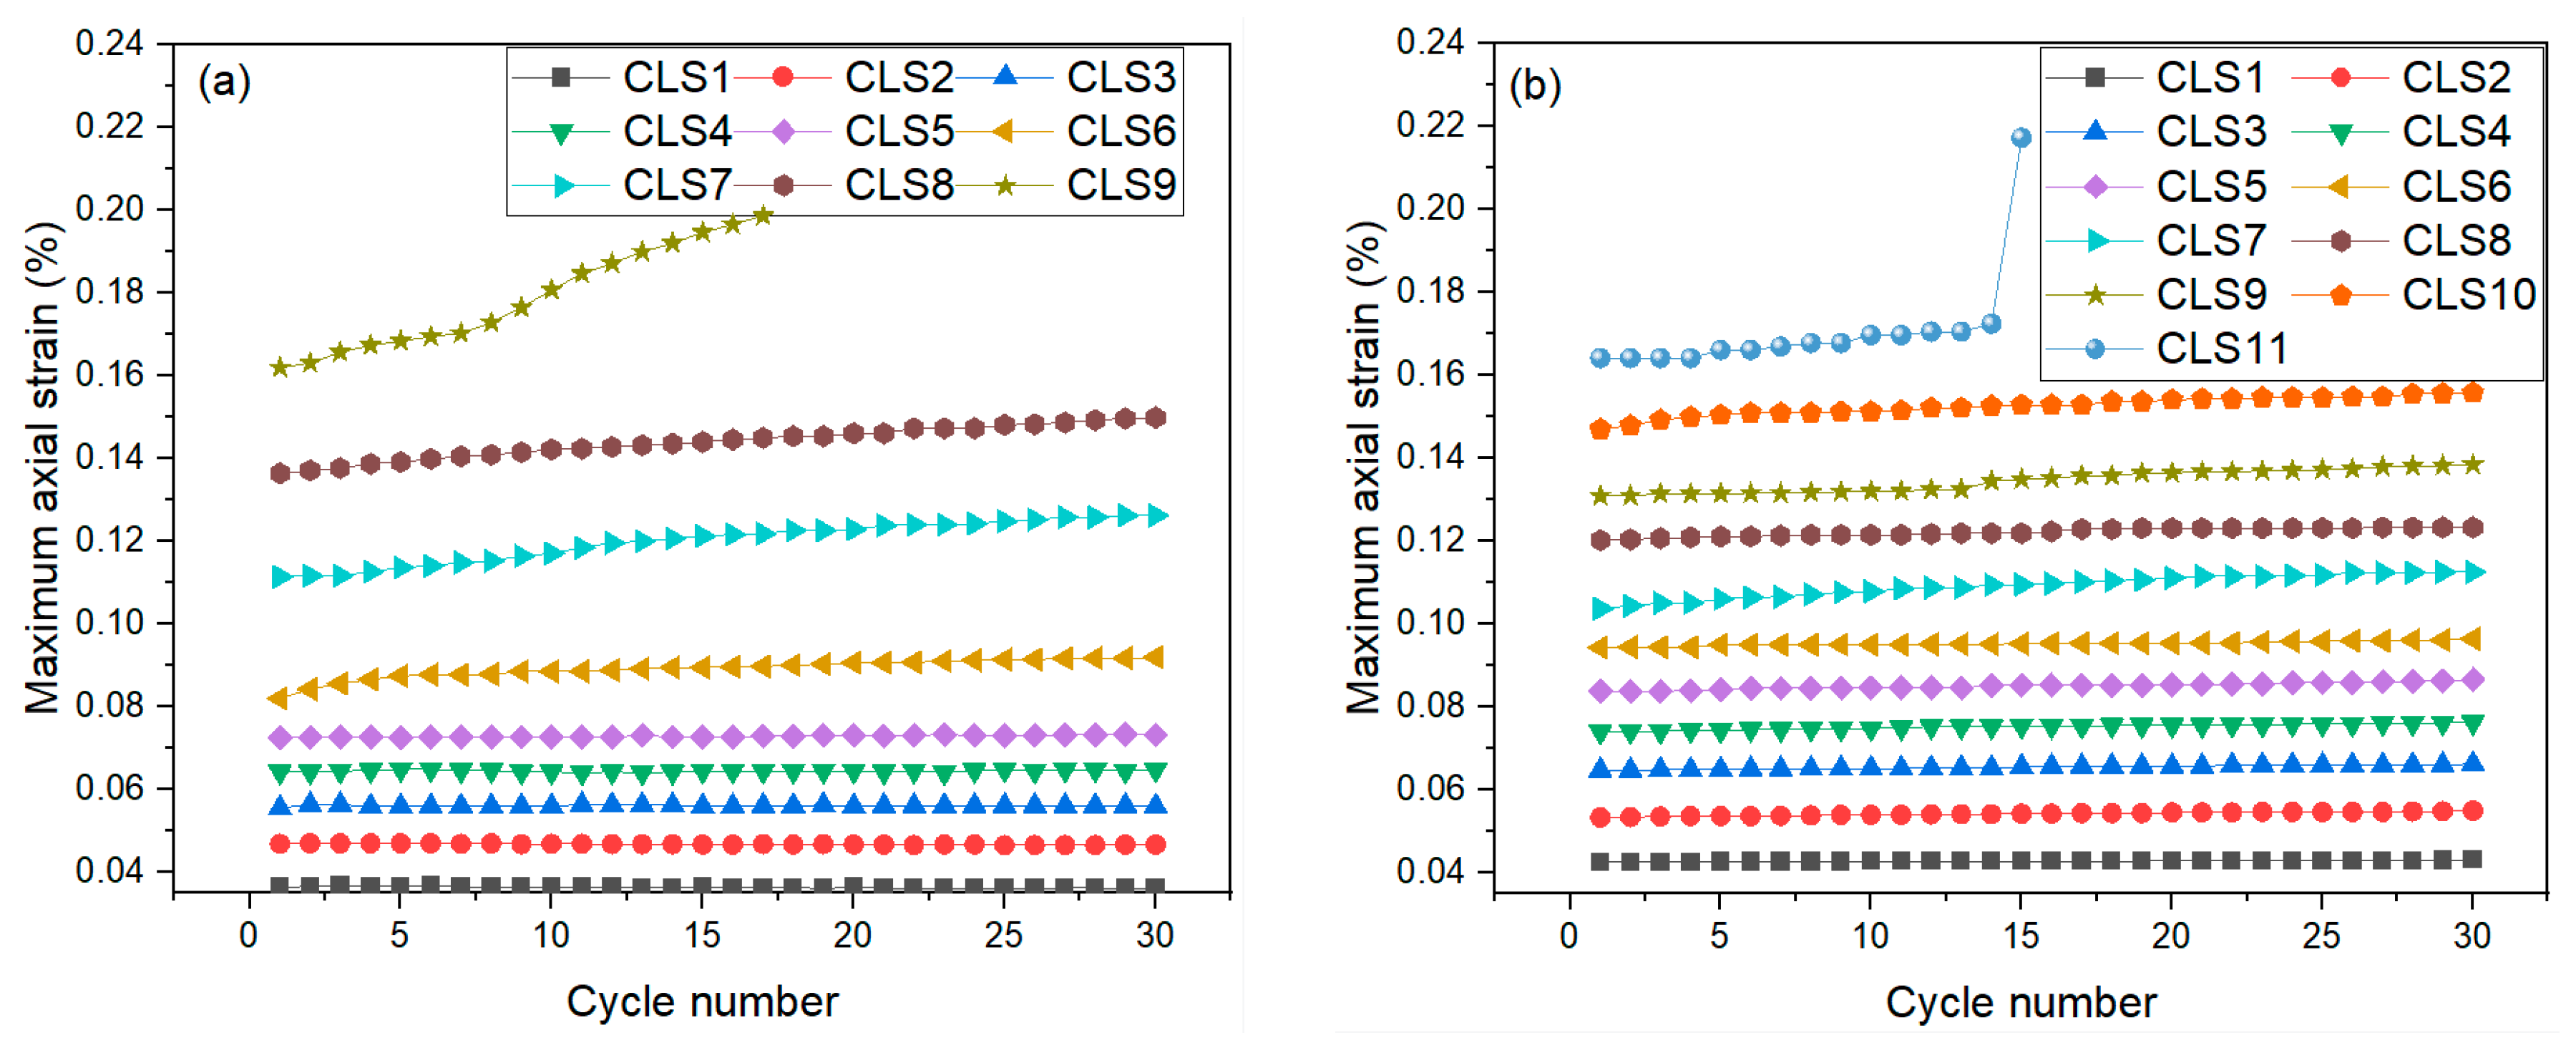
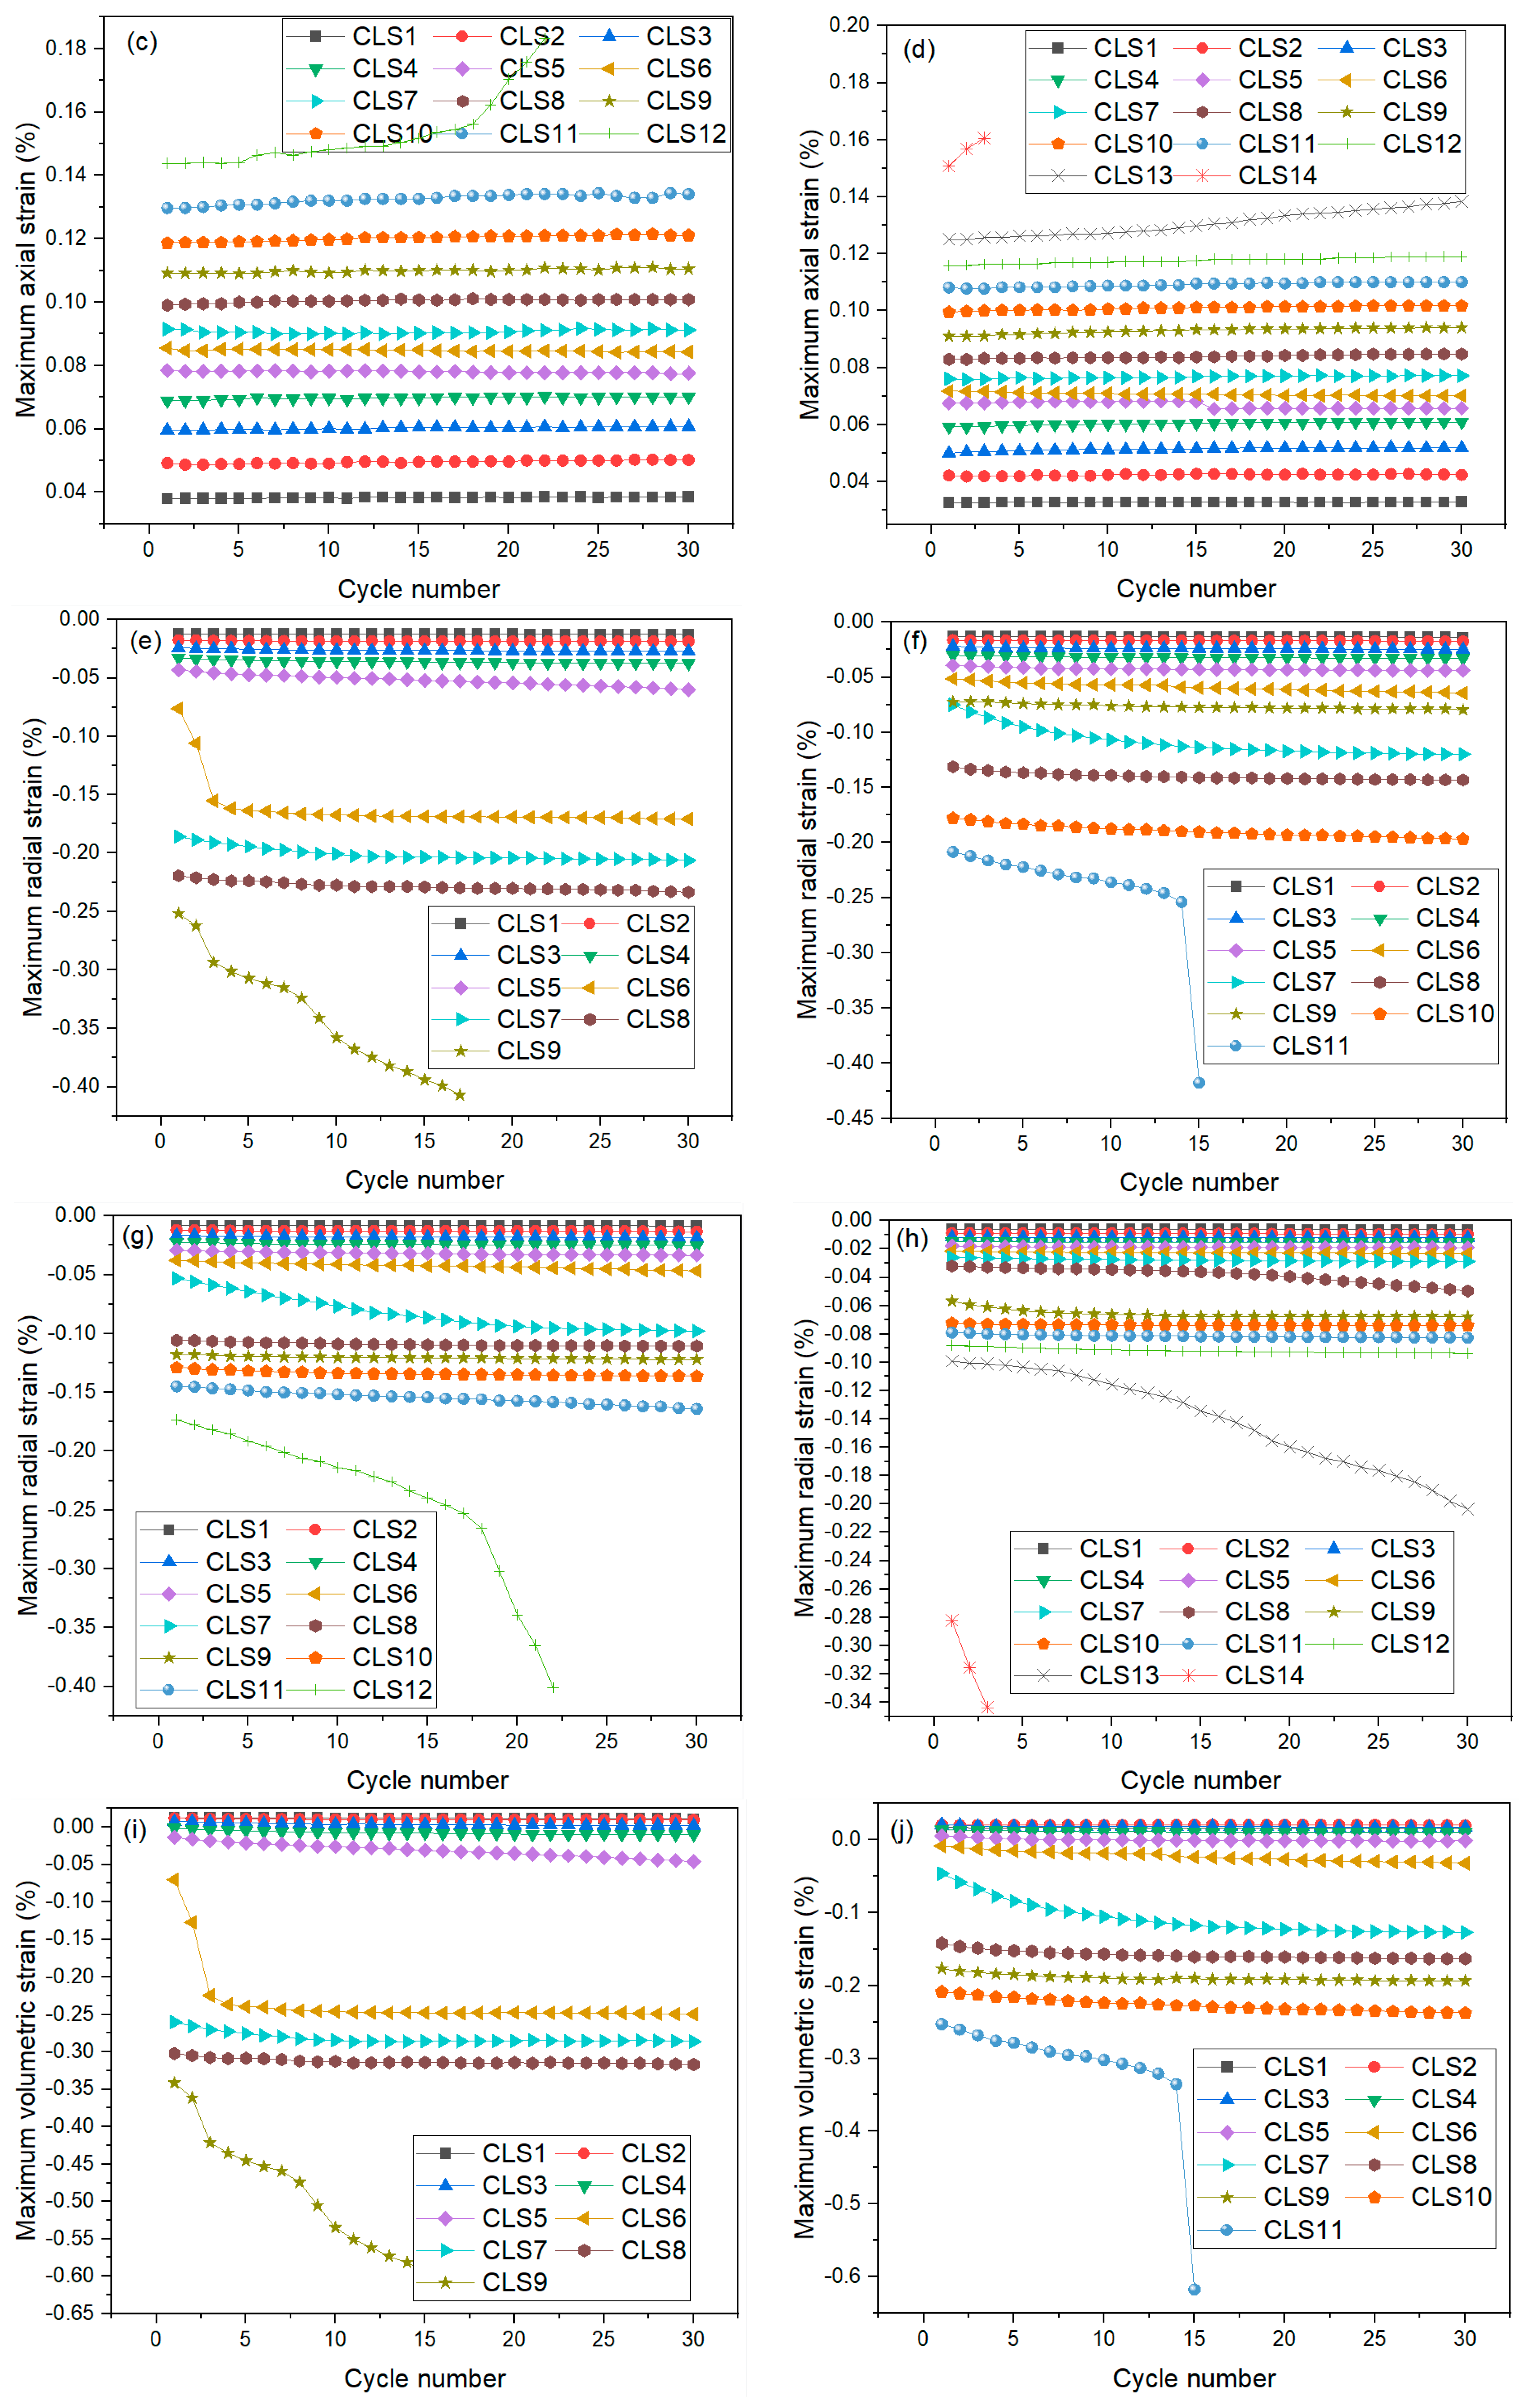
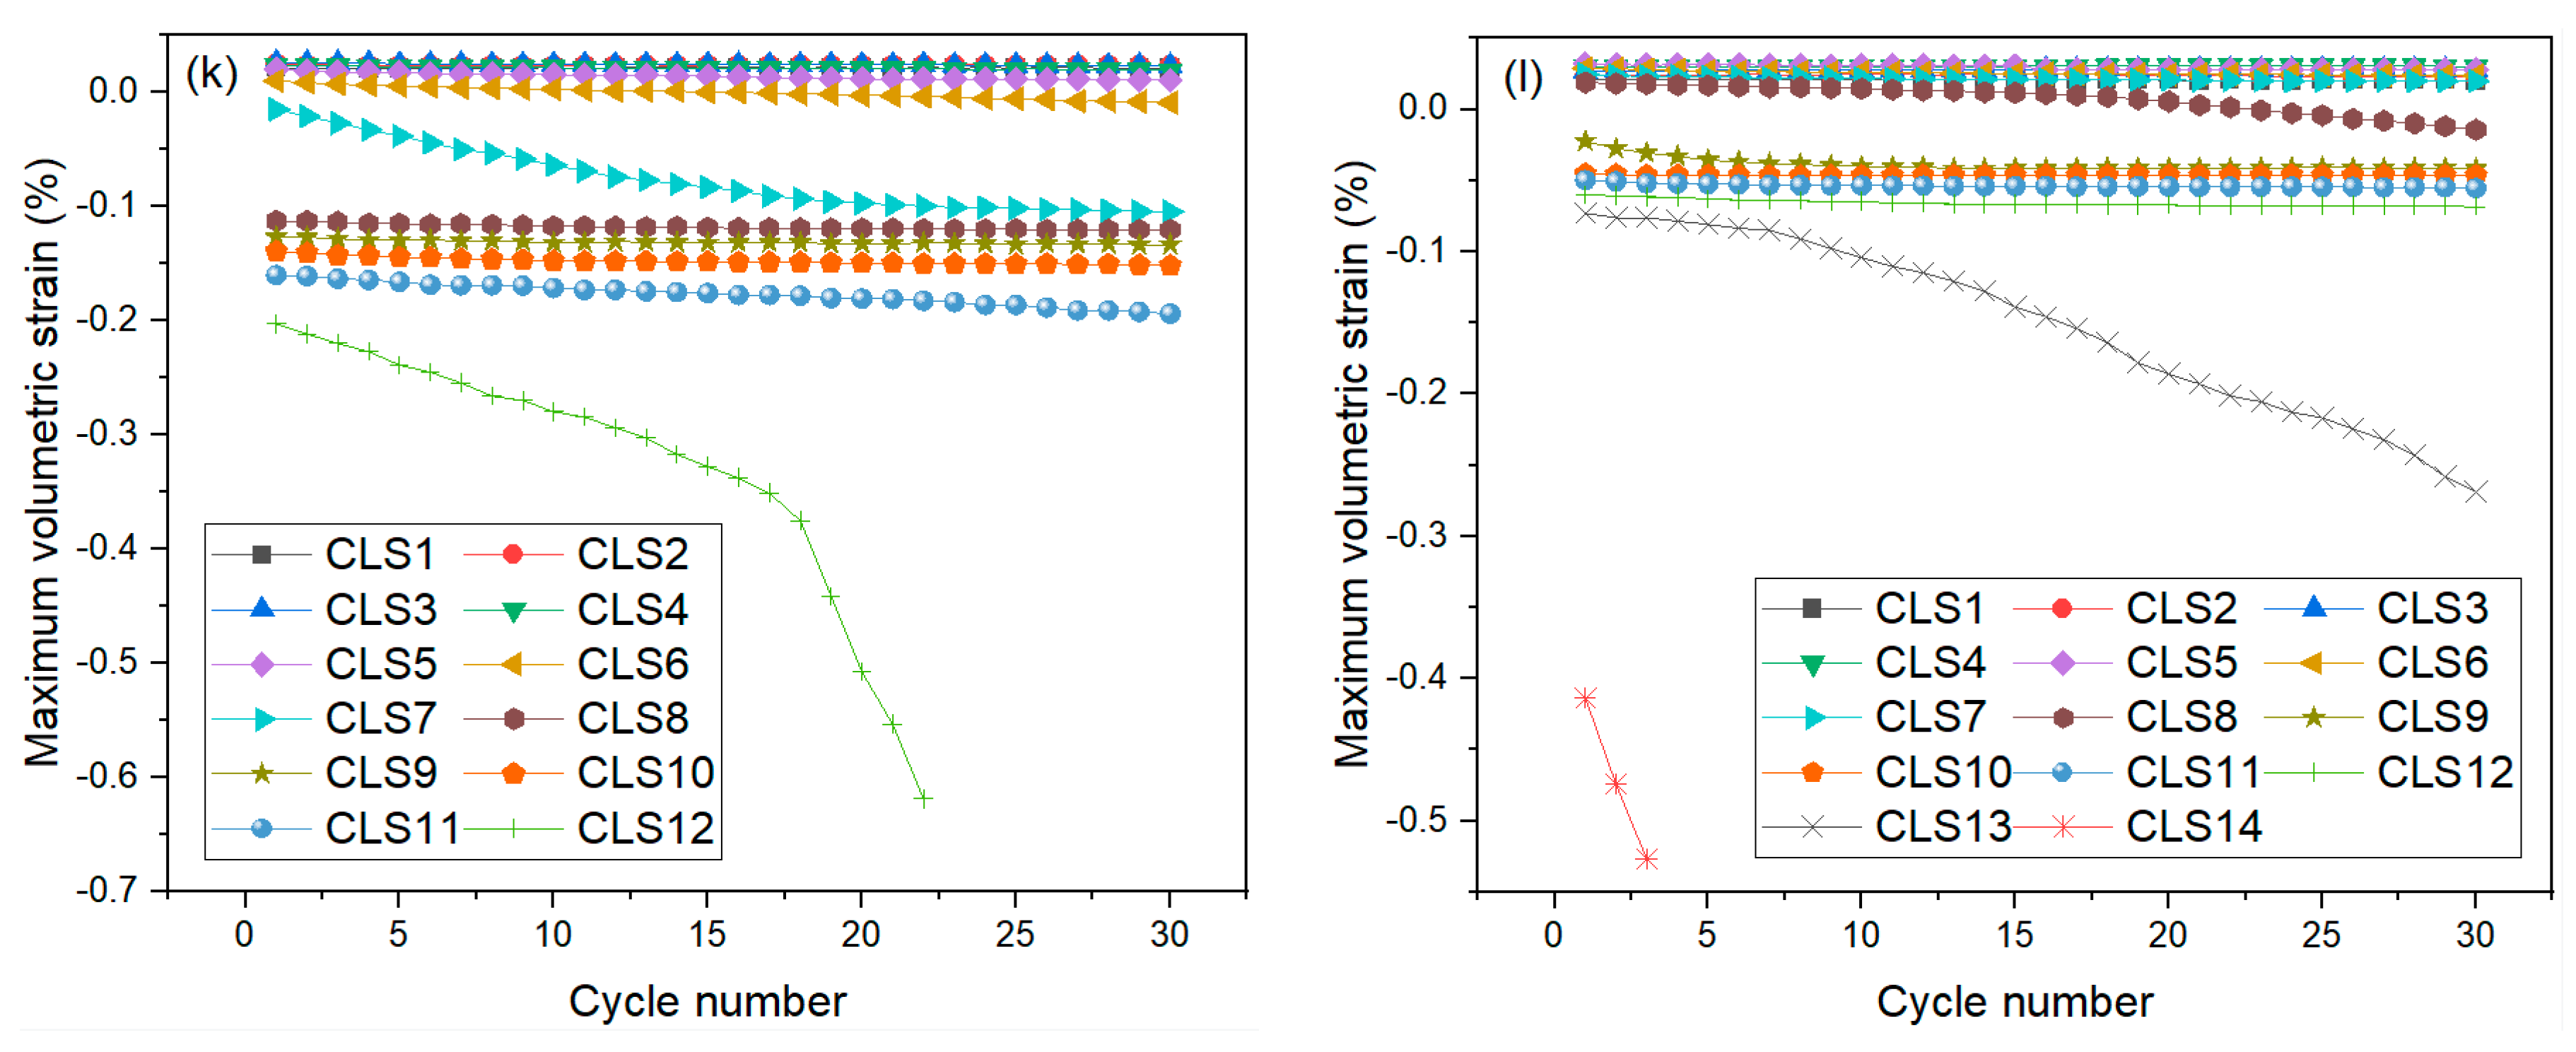
It can be seen that the stress–strain curves are influenced by rock bridge length. Looking beyond the stress–strain curves, the relationship between strain and cycle number at various CLSs is revealed, as plotted in Figure 5. The existence of fissures and the initiation, propagation, and connection of the rock bridge have a great influence on strain development. The evolution curves of axial, radial, and volumetric strain present fluctuating trends. In Figure 5a–d, the graphs depict the maximum axial strain per cycle versus cycle number. It is observed that axial strain increases rapidly during the initial loading stages of each cyclic loading sequence (CLS), after which it stabilizes. However, as the CLS approaches failure, the axial strain increases rapidly once again. This pattern is consistent across all tested rocks with different rock bridge lengths (RBLs), showing a similar evolution of axial strain where the incremental rate accelerates continuously until rock failure. The evolution of radial strain with cycle number, as illustrated in Figure 5e–h, shows an initial slow increase followed by a rapid pattern as the cycle number increases. The measured radial strain indicates expansion deformation in the middle part. Radial expansion reflects damage evolution, crack propagation, and coalescence. Influenced by rock bridge length (RBL), radial expansion is significantly affected by the presence of rock bridge segments, with spalling and the collapse of voids enhancing radial deformation development. The progression of radial strain accelerates and reaches its maximum in the final few cyclic loading stages. The evolution of volumetric strain with cycle number is depicted in Figure 5i–l. Volumetric strain serves as a reliable predictor of rock sample fracture and instability. The pattern of the volumetric strain curve closely resembles that of the radial strain curve, suggesting that radial deformation controls volumetric strain and significantly influences overall rock deformation. The curve illustrates a transition in rock behavior from compression-dominated to expansion-dominated deformation. Inflection points on the volumetric strain curve signify unstable crack propagation. Specifically, these inflection points occur at the first, second, third, and fifth CLSs for rock samples with RBLs of 10 mm, 20 mm, 30 mm, and 40 mm, respectively. These points mark the critical stages where crack propagation becomes unstable.

3.3. Dynamic Parameter Analysis

In Figure 5, dynamic elastic modulus (Ed) and damping ratio (Dr) are utilized to characterize the dynamic properties of the cyclic stress hysteresis curve for the marble samples across every fatigue loading stage [24,25]. These parameters offer insights into how the material behaves dynamically under cyclic loading conditions, providing information on its stiffness (Ed) and energy-dissipation capability (Dr). The definition of these two parameters can be found in the literature (Wang et al. [26]). It can be seen that Dr displays different patterns for the tested marble samples, and the curve shape is affected by RBL (Figure 6a–d). This result indicates that accumulative damage and crack propagation behaviors are influenced by rock bridge length; moreover, the structural deterioration during fatigue loading is influenced by rock bridge length. For the sample with an RBL of 10 mm, the Dr shows a pattern of first increasing then decreasing, and then increasing again. For the sample with an RBL of 20 mm, it first decreases and then increases until failure. For the sample with an RBL of 30 mm, it increases slowly at the first several CLSs and then increases quickly until failure. For the sample with an RBL of 40 mm, it first decreases and then increases until failure. The differential change trend of Dr reflects the fracture mechanism, and it is influenced by the rock bridge between the two fissures. In the fatigue loading stage, Dr presents a fluctuation trend, indicating the propagation and interlocking of cracks.
Concerning the evolution of Ed, Figure 7a–d present a decreasing trend with CLS, indicating that increasing load cycles leads to a decrease in Ed. However, Ed first presents an increasing and then deceasing trend at different CLSs. The analysis of dynamic elastic modulus (Ed) confirms the earlier findings from the cyclic stress–strain curves, demonstrating that greater plastic strain leads to a larger hysteresis loop and a reduced dynamic elastic modulus (Ed). However, Ed exhibits a sharp decline towards sample failure across all tested samples.

3.4. Strain Incremental Rate Analysis

This section discusses the impact of RBL on rock failure by analyzing the incremental rates of axial and volumetric strain. Typically, strain rate serves as a metric to quantify the rate of damage incurred by a rock during deformation. The consensus exists that irrespective of whether a rock experiences creep, static, or cyclic loading [27,28,29], the strain rate consistently correlates positively with the damage ratio. In this context, the strain incremental rate refers to the incremental change in strain (axial, radial, or volumetric) at the upper stress point of each cyclic loading stage (CLS), as depicted in Figure 8. This rate is calculated by dividing the difference in strain values between the different cycles by the number of cycles elapsed: (εan − εa1)/(N − 1), where εan and εa1 represent the axial strain of the Nth and 1st cycles, respectively, at the upper stress level. The cycle number (N) in each CLS is 30 in this work. This study focuses on analyzing the axial strain rate (εar) and volumetric strain rate (εvr), while the circumferential LVDT device records local deformation as radial strain. The calculation of incremental axial and volumetric strain rates is detailed in Table 2 and Table 3. The gradual failure of marble is observed to be influenced by RBL, and sudden increases in axial and volumetric strain are attributed to the formation of rock bridges. Regions highlighted in green, yellow, and red denote varying levels of risk. It is noted that the risk levels categorized by axial and volumetric strain rates exhibit distinct patterns. As the volumetric strain rate is a comprehensive reflection of axial and radial deformation, the early warning using the volumetric rate is favorable for instability prediction. From Table 3, it is shown that warning predictions are found at the 5th, 8th, 10th and 11th levels; these are earlier than the warnings using axial strain rate (i.e., the 7th, 11th, 11th, and 13th levels; Table 2).

3.5. Modelling of Damage Evolution

In the flawed rock samples depicted in Figure 5a–d, the axial strain occasionally exhibits a decreasing trend, indicating sporadic deformation, as recorded by two optical gratings. Conversely, the LVDT system, positioned at the rock bridge segment, effectively measures the deformation of the rock bridge, particularly the radial strain. Furthermore, the shape of the hysteresis loop on the radial stress–strain curve is more distinct compared to that on the axial stress curve. As seen in Figure 5e–h, the development of radial strain at each cyclic loading stage is more pronounced than that of axial strain. The rapid increase in radial deformation results from crack coalescence, leading to significant damage. Therefore, in this study, radial strain is deemed more suitable for describing the propagation of rock damage. Radial deformation is utilized to model the evolution of rock damage and establish the relationship between damage factors and cycles. A damage variable defined using the maximum radial strain, Drs, is expressed as follows:
D r s = ε max n ε max 0 ε max f ε max 0
where ε max 0 , ε max n , and ε max f are the initial maximum strain, instantaneous maximum strain after n cycles, and ultimate maximum strain, respectively.
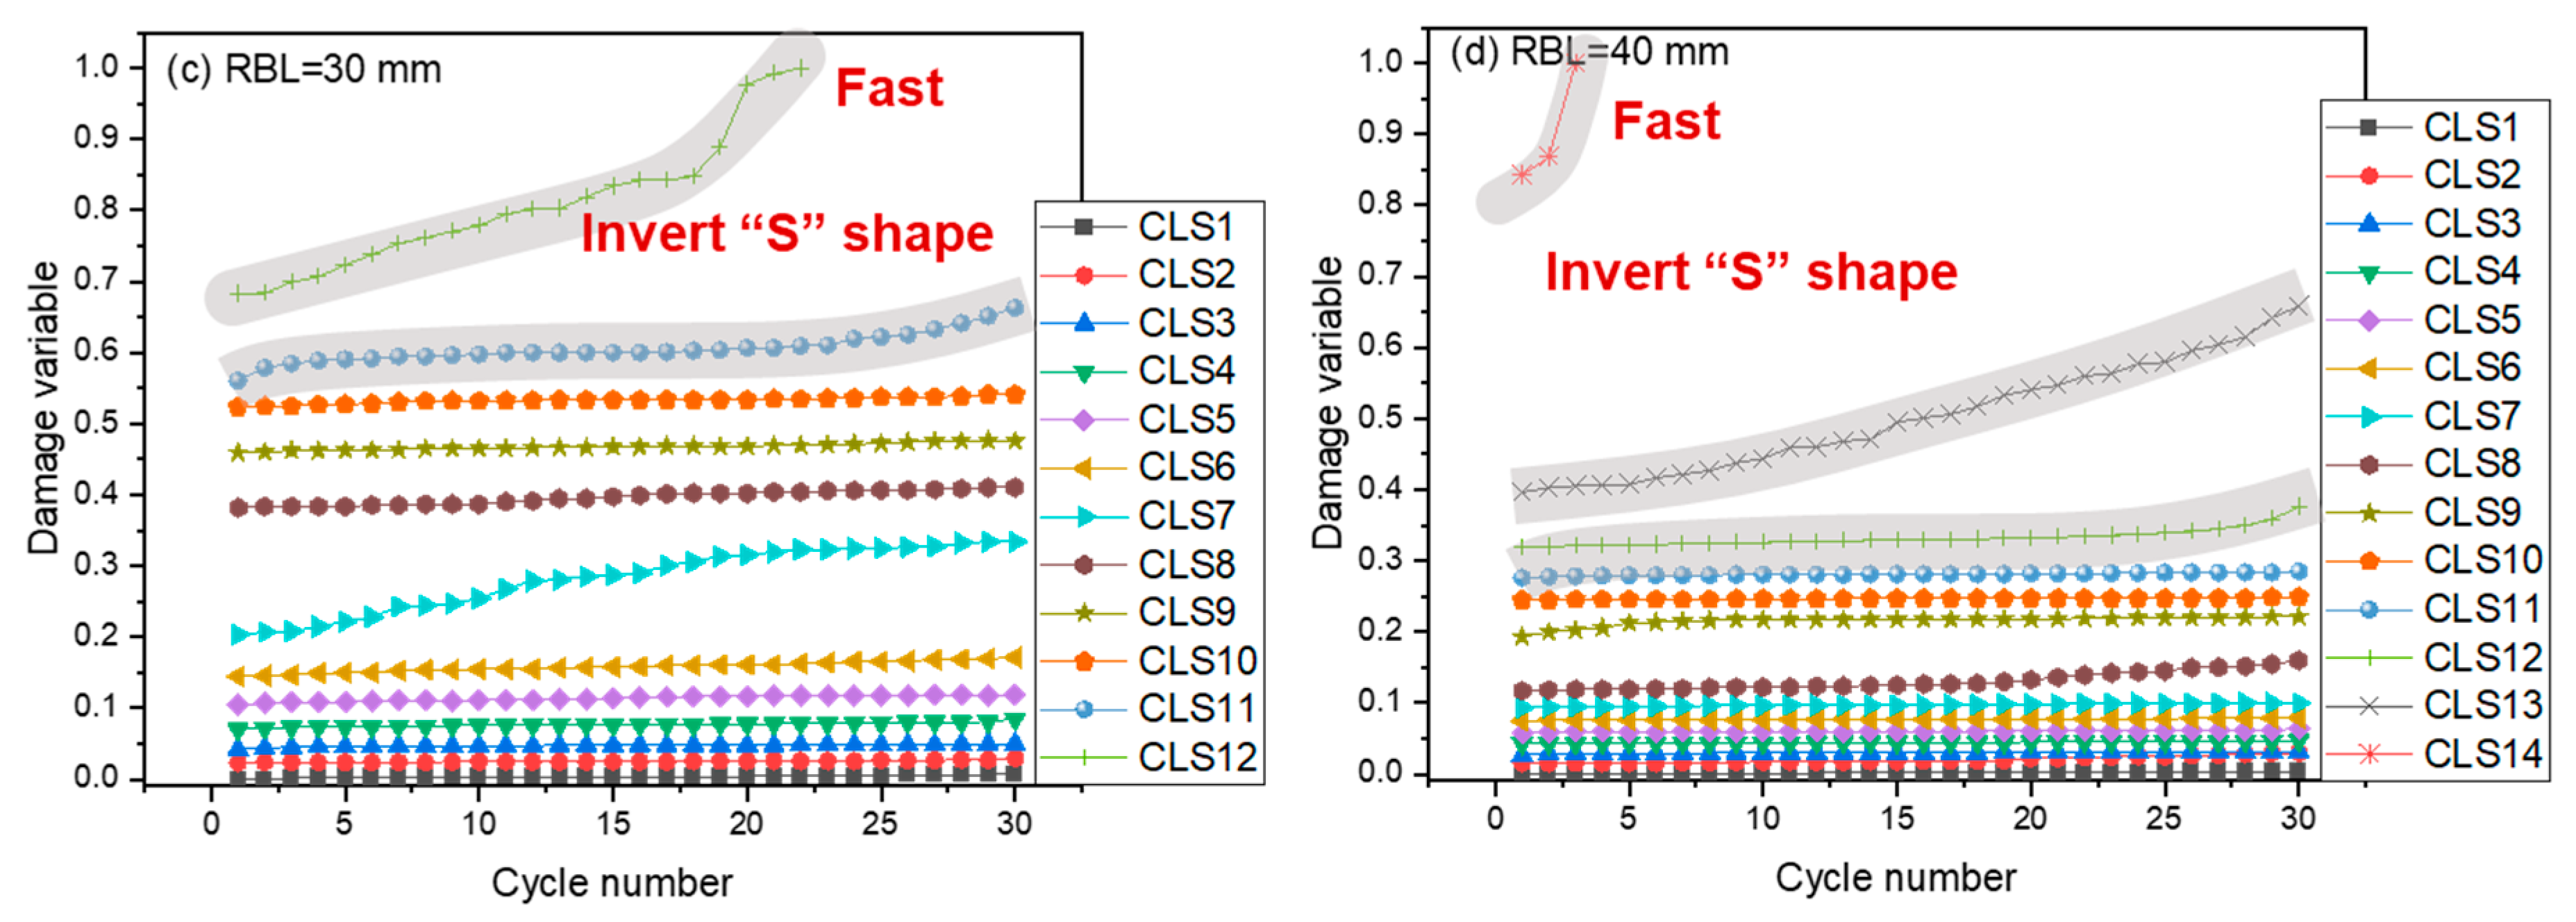
Using Equation (1), we depict the evolution of this damage variable against cycle number in Figure 9. The characteristics of damage propagation are consistent with the analysis of radial deformation. Initially, damage within a CLS is relatively minor during the early loading stages. Subsequently, damage escalates as the CLSs increase, and the incremental rate accelerates accordingly. Towards the end of the loading sequence, an inverted “S”-shaped pattern of damage propagation becomes evident in the last several CLSs.
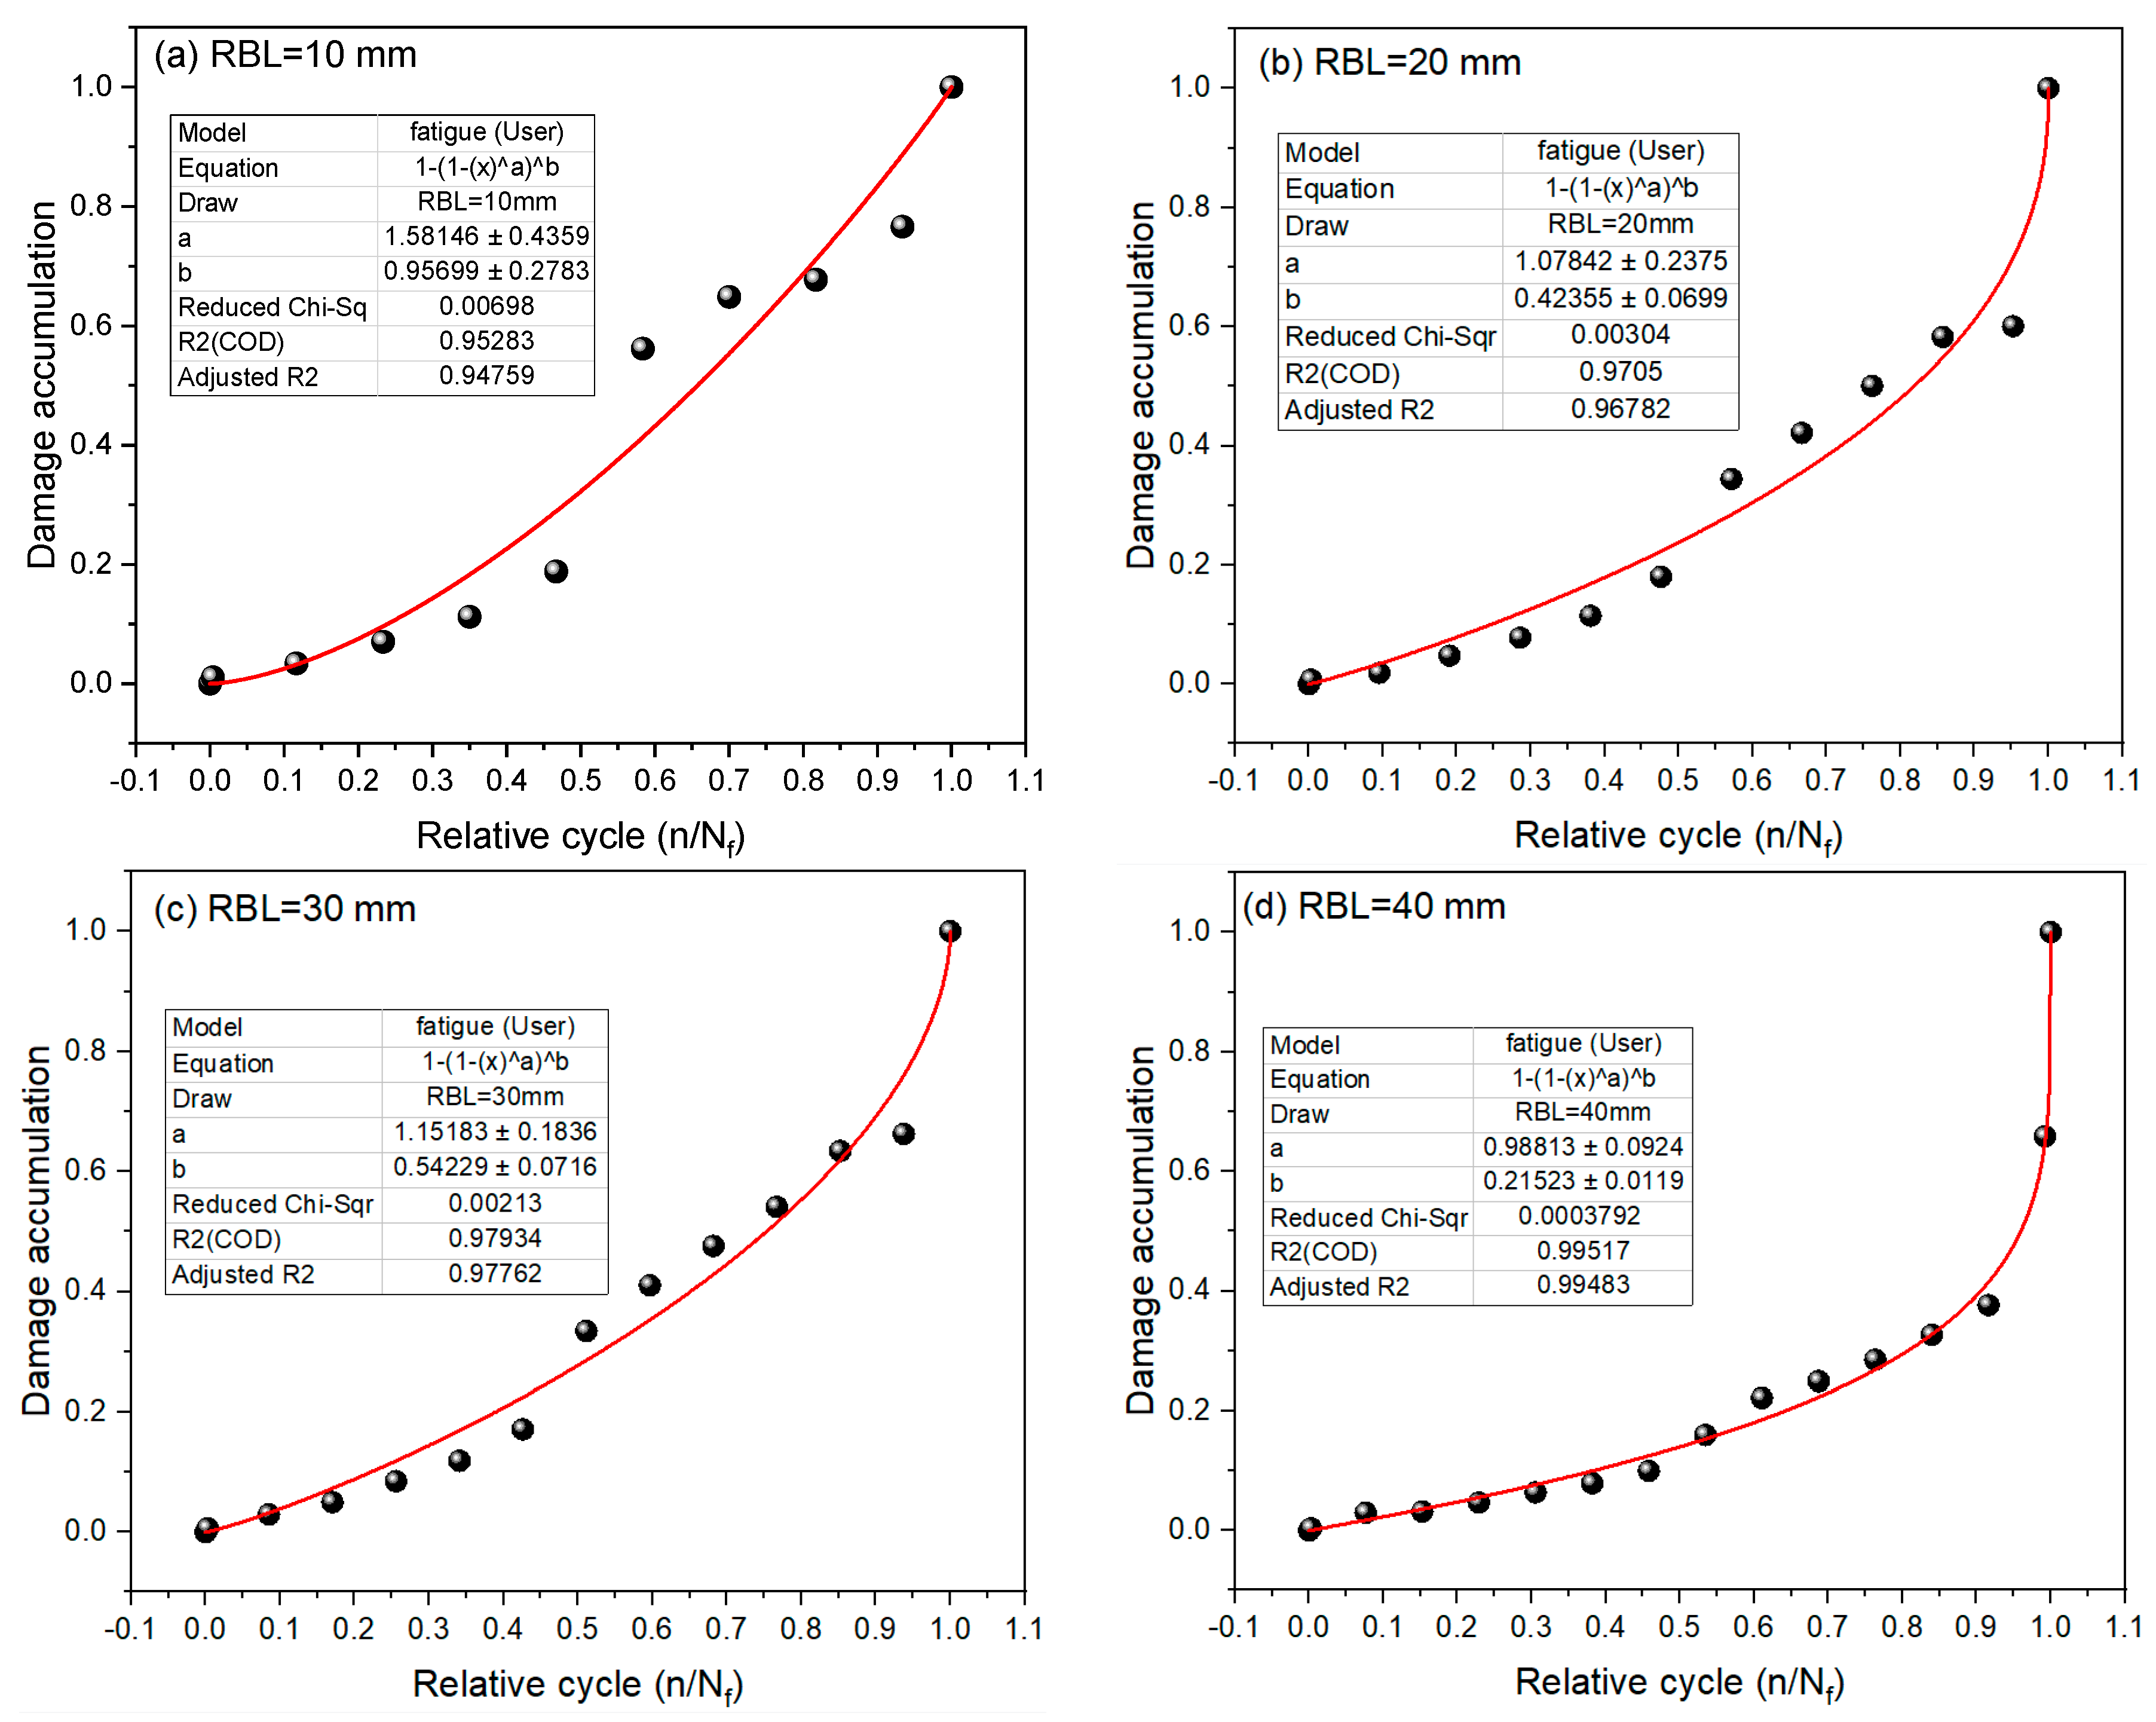
Based on the findings presented in Figure 9, we establish a self-defined damage evolution model that incorporates radial strain and deformation, as illustrated in Figure 10. The form of this proposed model is represented as follows:
D = 1 − (1 − (n/Nf)a)b
The damage variable D results from irreversible plastic deformation. Initially, rock damage is zero before loading (N = 0) and reaches one when failure occurs completely (N = Nf). Here, n denotes the number of loading cycles and Nf signifies the fatigue lifetime. Parameters a and b are associated with material characteristics. Figure 10 displays the fitting results using Origin 2021 software for the marble samples with RBLs of 10 mm, 20 mm, 30 mm, and 40 mm. These results, along with corresponding correlation coefficients, affirm the applicability of the proposed model in describing the evolution of rock damage.

4. Summary and Conclusions

This study utilized marble samples containing double-stepped fissures of varying rock bridge length to conduct fatigue loading tests with increasing amplitude. The experimental findings systematically illustrate how the length of the rock bridge (RBL) affects the fatigue mechanical properties of brittle rock material, encompassing stress–strain behaviors, fatigue strain progression, damping characteristics, dynamic elastic modulus, and the evolution of damage. The principal findings are synthesized as follows:
(1)
The presence of pre-existing rock bridge segments significantly impacts crack propagation and coalescence. As the length of the rock bridge increases, both rock fatigue deformation and fatigue lifetime decrease. Notably, the sample with the longest rock bridge segment exhibited the lowest volumetric deformation, suggesting that damage propagation was least pronounced in this case.
(2)
Both damping ratio and dynamic elastic modulus are influenced by the presence of a rock bridge segment. The damping ratio reveals significant energy dissipation, particularly during the final stages of cyclic loading, highlighting substantial energy consumption driving crack propagation.
(3)
A strain incremental rate index is introduced to forecast the progression of rock failure. It is observed that volumetric strain rate serves as an effective early warning indicator compared to axial strain rate. The warning time diminishes as rock bridge length increases, suggesting that rocks with larger segments exhibit greater resistance to external fatigue loading.

Author Contributions

Conceptualization, Y.Y.; methodology, X.Y.; software, Z.C.; writing—review and editing, Y.W.; funding acquisition, Y.W. All authors have read and agreed to the published version of the manuscript.

Funding

This article is funded by the National Natural Science Foundation of China (52174069), the Beijing Natural Science Foundation (8202033), and the Henan Key Laboratory for Green and Efficient Mining & Comprehensive Utilization of Mineral Resources (Henan Polytechnic University) (KCF2203).

Institutional Review Board Statement

Not applicable.

Informed Consent Statement

Not applicable.

Data Availability Statement

The original contributions presented in the study are included in the article; further inquiries can be directed to the corresponding author.

Conflicts of Interest

Author Yongchun Yu was employed by the company Shangri-La Yunkuang Hongniu Mining Co., Ltd. The remaining authors declare that the re-search was conducted in the absence of any commercial or financial relationships that could be construed as a potential conflict of interest.

References

  1. Gong, B.; Wang, S.; Sloan, S.W.; Sheng, D.; Tang, C.A. Modelling rock failure with a novel continuous to discontinuous method. Rock Mech. Rock Eng. 2019, 52, 3183–3195. [Google Scholar] [CrossRef]
  2. Bobet, A.; Fakhimi, A.; Johnson, S.; Morris, J.; Tonon, F.; Yeung, M.R. Numerical models in discontinuous media: Review of advances for rock mechanics applications. J. Geotech. Geoenvironmental Eng. 2009, 135, 1547–1561. [Google Scholar] [CrossRef]
  3. Lisjak, A.; Grasselli, G. A review of discrete modeling techniques for fracturing processes in discontinuous rock masses. J. Rock Mech. Geotech. Eng. 2014, 6, 301–314. [Google Scholar] [CrossRef]
  4. Shirani Faradonbeh, R.; Taheri, A.; Karakus, M. Fatigue failure characteristics of sandstone under different confining pressures. Rock Mech. Rock Eng. 2022, 55, 1227–1252. [Google Scholar] [CrossRef]
  5. Zheng, Q.; Liu, E.; Yu, D.; Liu, M. Fatigue and damage properties of non-consecutive jointed mudstone samples subjected to cyclic triaxial loading. Bull. Eng. Geol. Environ. 2020, 79, 2467–2481. [Google Scholar] [CrossRef]
  6. Liu, Y.; Dai, F.; Dong, L.; Xu, N.; Feng, P. Experimental investigation on the fatigue mechanical properties of intermittently jointed rock models under cyclic uniaxial compression with different loading parameters. Rock Mech. Rock Eng. 2018, 51, 47–68. [Google Scholar] [CrossRef]
  7. Jafari, M.K.; Pellet, F.; Boulon, M.; Hosseini, K.A. Experimental study of mechanical behaviour of rock joints under cyclic loading. Rock Mech. Rock Eng. 2004, 37, 3–23. [Google Scholar] [CrossRef]
  8. Cerfontaine, B.; Collin, F. Cyclic and fatigue behaviour of rock materials: Review, interpretation and research perspectives. Rock Mech. Rock Eng. 2018, 51, 391–414. [Google Scholar] [CrossRef]
  9. Fathi, A.; Moradian, Z.; Rivard, P.; Ballivy, G. Shear mechanism of rock joints under pre-peak cyclic loading condition. Int. J. Rock Mech. Min. Sci. 2016, 83, 197–210. [Google Scholar] [CrossRef]
  10. Li, K.; Yang, S.; Liu, C.; Chen, Y.; Zhang, G.; Ma, Q. Mechanical response and microscopic damage mechanism of pre-flawed sandstone subjected to monotonic and multilevel cyclic loading: A laboratory-scale investigation. Int. J. Min. Sci. Technol. 2023, 33, 1487–1510. [Google Scholar] [CrossRef]
  11. Moghaddam, R.H.; Golshani, A. Fatigue behavior investigation of artificial rock under cyclic loading by using discrete element method. Eng. Fail. Anal. 2024, 160, 108105. [Google Scholar] [CrossRef]
  12. Brown, E.T.; Hudson, J.A. Fatigue failure characteristics of some models of jointed rock. Earthq. Eng. Struct. Dyn. 1973, 2, 379–386. [Google Scholar] [CrossRef]
  13. Zhang, T.; Xu, W.; Wang, H.; Wang, R.; Yan, L.; Shi, A. Anisotropic mechanical characteristics and energy evolution of artificial columnar jointed rock masses subjected to multi-level cyclic loading. Int. J. Fatigue 2022, 165, 107215. [Google Scholar] [CrossRef]
  14. Vaneghi, R.G.; Thoeni, K.; Dyskin, A.V.; Sharifzadeh, M.; Sarmadivaleh, M. Fatigue damage response of typical crystalline and granular rocks to uniaxial cyclic compression. Int. J. Fatigue 2020, 138, 105667. [Google Scholar] [CrossRef]
  15. Erarslan, N.; Williams, D.J. Mechanism of rock fatigue damage in terms of fracturing modes. Int. J. Fatigue 2012, 43, 76–89. [Google Scholar] [CrossRef]
  16. Wang, Y.; Li, C.H.; Han, J.Q. On the effect of stress amplitude on fracture and energy evolution of pre-flawed granite under uniaxial increasing-amplitude fatigue loads. Eng. Fract. Mech. 2020, 240, 107366. [Google Scholar] [CrossRef]
  17. Karakus, M.; Akdag, S.; Bruning, T. Rock fatigue damage assessment by acoustic emission. In Proceedings of the International Conference on Geo-Mechanics, Geo-Energy and Geo-Resources (IC3G), Melbourne, Australia, 28–29 September 2016; pp. 9–82. [Google Scholar]
  18. Shu, L.Y.; Liu, Z.S.; Wang, K.; Zhu, N.N.; Yang, J. Characteristics and classification of microseismic signals in heading face of coal mine: Implication for coal and gas outburst warning. Rock Mech. Rock Eng. 2022, 55, 6905–6919. [Google Scholar] [CrossRef]
  19. Xu, B.; Liu, X.; Zhou, X.; Xie, Y.; Suliman, L.; Liu, X.; Lin, G.; Huang, J. Investigation on the macro-meso fatigue damage mechanism of rock joints with multiscale asperities under pre-peak cyclic shear loading. Soil Dyn. Earthq. Eng. 2021, 151, 106958. [Google Scholar] [CrossRef]
  20. Singh, M.; Khalkho, P. Modelling of Fatigue Damage Evolution of Two Natural Rocks Under Cyclic Loading. Int. J. Geosynth. Ground Eng. 2022, 8, 8. [Google Scholar] [CrossRef]
  21. Tao, Y.; Hu, R.Z.; Zhu, F.L.; Ma, Y.S.; Ye, L.; Cheng, Z.T. Ore-forming age and the geodynamic background of the Hetaoping lead-zinc deposit in Baoshan, Yunnan. Acta Petrol. Sin. 2010, 26, 1760–1772. [Google Scholar]
  22. Deng, M.G.; Zhao, J.X.; Liu, F.X.; Yu, H.J.; Sun, B.D.; Liu, F.; Li, S.B. Discussion on sources of metallogenic fluids and materials of the Shuitoushan Pb-Zn deposit in Zhenkang, western Yunnan: Evidence from H, O, S and Pb isotopes. Acta Petrol. Sin. 2017, 33, 2001–2017. [Google Scholar]
  23. Li, W.; Yin, G.; Lu, Y.; Wang, Y.; Yu, H.; Cao, X.; Zhang, S. Delineation and significance of the Hongshan-Shudu serpentinite mélange zone within the “Sanjiang” volcanic-magmatic arc in Southwest China. Acta Petrol. Sin. 2010, 26, 1661–1671. [Google Scholar]
  24. Wang, Y.; Wei, X.M.; Li, C.H. Dynamic behavior of soil and rock mixture using cyclic triaxial tests and X-ray computed tomography. Arab. J. Geosci. 2019, 12, 229. [Google Scholar] [CrossRef]
  25. Lamas-Lopez, F. Field and Laboratory Investigation on the Dynamic Behavior of Conventional Railway Track-Bed Materials in the Context of Traffic Upgrade. Ph.D. Thesis, Ecole Nationale des Ponts et Chaussees, Universite Paris-Est, Paris, France, 2016. [Google Scholar]
  26. Wang, Y.; Li, C.; Han, J.; Wang, H. Mechanical behaviours of granite containing two flaws under uniaxial increasing-amplitude fatigue loading conditions: An insight into fracture evolution analyses. Fatigue Fract. Eng. Mater. Struct. 2020, 43, 2055–2070. [Google Scholar] [CrossRef]
  27. Wang, Y.; Yang, H.N.; Han, J.Q.; Zhu, C. Effect of rock bridge length on fracture and damage modelling in granite containing hole and fissures under cyclic uniaxial increasing-amplitude decreasing-frequency (CUIADF) loads. Int. J. Fatigue 2022, 158, 106741. [Google Scholar] [CrossRef]
  28. Brantut, N.; Heap, M.J.; Meredith, P.G.; Baud, P. Time-dependent cracking and brittle creep in crustal rocks: A review. J. Struct. Geol. 2013, 52, 17–43. [Google Scholar] [CrossRef]
  29. Li, X.; Konietzky, H.; Li, X.; Wang, Y. Failure pattern of brittle rock governed by initial microcrack characteristics. Acta Geotech 2019, 14, 1437–1457. [Google Scholar] [CrossRef]
Figure 1. Rock structure characteristics of the lead–zinc mine. (a) Rock mass in a roadway. (b) Fissure prefabrication in intact marble sample. (c) Typical marble samples with two fissures of different rock bridge lengths.
Applsci 14 07919 g001
Figure 2. The apparatus for the rock samples containing stepped fissures. Axial and radial deformation were measured using optical grating and LVDT installed at the longitudinal and circumferential segments, respectively.
Applsci 14 07919 g002
Figure 3. Plots of axial stress (σ) and elapsed time (s) for rock containing stepped fissures with rock bridge lengths of 10, 20, 30, and 40 mm.
Applsci 14 07919 g003aApplsci 14 07919 g003b
Figure 4. Axial stress versus strain for marble specimens subjected to cyclic loading. (ad) Rock bridge lengths are 10 mm, 20 mm, 30 mm, and 40 mm, respectively. The numbers in the figures indicate the cyclic loading stage.
Applsci 14 07919 g004
Figure 5. Description of maximum axial, radial, and volumetric strain with cycle number at different cyclic loading stages. ((ad): The maximum axial strain versus cycle number; (ef): The maximum radial strain versus cycle number; (gl): The maximum volumetric strain versus cycle number).
Applsci 14 07919 g005aApplsci 14 07919 g005bApplsci 14 07919 g005c
Figure 6. Evolution of damping ratio with cycle number at different loading stages. (ad) Marble samples containing stepped fissures with rock bridge lengths of 10, 20, 30, and 40 mm, respectively.
Applsci 14 07919 g006aApplsci 14 07919 g006b
Figure 7. The evolution of dynamic elastic modulus (Ed) with cycle number at different loading stages for marble samples containing stepped fissures with rock bridge lengths of 10 mm (a), 20 mm (b), 30 mm (c), and 40 mm (d).
Applsci 14 07919 g007
Figure 8. Definition of axial, radial, and volumetric strain incremental rates. (ad) Marble samples containing stepped fissures with RBLs of 10, 20, 30, and 40 mm, respectively.
Applsci 14 07919 g008
Figure 9. Damage variable versus cycle number at different loading stages. (ad) Rock samples with RBLs of 10, 20, 30, and 40 mm, respectively.
Applsci 14 07919 g009aApplsci 14 07919 g009b
Figure 10. Modelling of damage evolution equation for typical fissure-containing marble samples. (ad) Rock samples with RBLs of 10, 20, 30, and 40 mm, respectively.
Applsci 14 07919 g010
Table 1. The loading schemes for marble samples exposed to cyclic loads in this work.
Specimen IDσminσmaxiσaσmaxfCLSCycles in Each CLSCDF
(MPa)(MPa)(MPa)(MPa)(/)(Cycle)(Hz)
RTSF -1,2,310155559300.5
RTSF -4,5,6101556511300.5
RTSF -7,8,9101557012300.5
RTSF -10,11,12101558014300.5
Table 2. Axial strain rates for the tested rock samples at different CLSs.
CLSMaximum Stress (MPa)Axial Strain Rate [%/N − 1]
RBL = 10 mmRBL = 20 mmRBL = 30 mmRBL = 40 mm
1156.666 × 10-51.333 × 10−53 × 10−51 × 10−5
2201.533 × 10−43.033 × 10−43.866 × 10−43.146 × 10⁻⁴
3352.1 × 10−44.666 × 10−43.5 × 10−43.146 × 10⁻⁴
4403.933 × 10−45.4 × 10−43.133 × 10−43.04 × 10⁻⁴
5454.8 × 10−46.466 × 10−42.466 × 10−41.6 × 10⁻⁴
6506.266 × 10−43.233 × 10−42.266 × 10−41.466 × 10⁻⁴
7550.00114 *5.4 × 10−42.3 × 10−42.346 × 10⁻⁴
8600.001333.633 × 10−43.2 × 10−42.533 × 10−4
9650.001635.033 × 10−43.233 × 10−43.093 × 10−4
1070 5.733 × 10−43.533 × 10−42.56 × 10⁻⁴
1175 0.00119 *0.00121 *2.746 × 10−4
1280 0.001542.96 × 10−4
1385 0.00106 *
14 0.00165
Note: The green region denotes safety, the yellow region signifies uncertainty, and the red region indicates danger. The * underscores the notable volume dilatancy observed in the rock sample, marking a shift from compression dominance to expansion dominance.
Table 3. Volumetric strain rates for the tested rock samples at different CLSs.
CLSMaximum Stress (MPa)Volumetric Strain Rate [%/N − 1]
RBL = 10 mmRBL = 20 mmRBL = 30 mmRBL = 40 mm
1151 × 10−61 × 10−66.667 × 10−61.666 × 10⁻⁶
2204.6 × 10−53.333 × 10−61.04 × 10−41.213 × 10⁻⁴
3352.5 × 10−49.733 × 10−51.4 × 10−51.346 × 10⁻⁴
4404.066 × 10−42.68 × 10−41.266 × 10−47.733 × 10⁻⁵
5450.00122 *3.893 × 10−43.133 × 10−48.667 × 10⁻⁵
6500.006774.032 × 10−46.667 × 10−41.4 × 10−4
7550.001174.653 × 10−43.16 × 10-41.32 × 10−4
8600.001070.00234 *5.533 × 10−41.14 × 10−4
9650.011660.001054.3 × 10−48.773 × 10⁻⁴
1070Failure0.003010.00103 *1.907 × 10−4
1175--0.012850.001432.987 × 10−4
1280--Failure0.012940.00329
1385----Failure0.00667 *
14 ------0.00861
------Failure
Note: The green region denotes safety, the yellow region signifies uncertainty, and the red region indicates danger. The * underscores the notable volume dilatancy observed in the rock sample, marking a shift from compression dominance to expansion dominance.
Disclaimer/Publisher’s Note: The statements, opinions and data contained in all publications are solely those of the individual author(s) and contributor(s) and not of MDPI and/or the editor(s). MDPI and/or the editor(s) disclaim responsibility for any injury to people or property resulting from any ideas, methods, instructions or products referred to in the content.