Abstract
To address the limitations of existing studies on the built environment and commute mode choice, which primarily focus on the objective and residential built environment, this study investigates how commuters’ perceptions of the built environment at their residences and workplaces influence their choice of commuting mode. First, six latent variables are proposed to characterize the perceived built environment. Then, commuters’ socio-economic and commuting characteristics are treated as exogenous variables. Subsequently, the influence of the perceived built environment on commute mode choice is analyzed using both a Multinomial Logit (MNL) model without latent variables and a Hybrid Choice Model (HCM) incorporating variables related to the perceived built environment. Finally, a case study conducted in Shanghai reveals that the goodness-of-fit value of the HCM improves by approximately 27.4% compared to that of the MNL, indicating that the perceived built environment plays a significant role in explaining commute mode choice. Furthermore, commuters’ socio-economic profiles, commuting characteristics, and perceptions of the built environment all significantly influence their commute mode choices. The perceived built environment at residences has a stronger impact on commute mode choice than that at workplaces. Among the various commute modes of driving, cycling, walking, and public transit, the perceived built environment most significantly influences public transit usage. Based on these findings, several policy implications are offered, providing decision-making support for urban planning and traffic management authorities.
1. Introduction
Traffic congestion and environmental pollution pose significant challenges to sustainable urban development. Some scholars argue that transportation planning during urban construction and renewal should prioritize non-motorized transportation (e.g., walking and cycling) and public transit over motorized vehicles [1]. Since the 1990s, urban planning researchers have explored the potential of influencing residents’ travel behavior by enhancing the built environment [2,3]. Initially, it was hypothesized that government interventions in urban transport planning and design could shorten travel distances and reduce private car usage by altering the built environment. Subsequent empirical studies have demonstrated that optimizing the built environment, creating high-density mixed land use patterns, and improving public transit accessibility can encourage residents to choose sustainable transport modes [4,5].
A review of previous studies reveals that most research on the built environment and travel behavior primarily focuses on objective elements, known as the “5Ds”: density, diversity, design, destination accessibility, and distance to transit. However, these studies often overlook the interactive relationship between commuters’ travel behavior and their travel environment, lacking an exploration of the perceived built environment. For instance, some research has highlighted that the relationship between the objective built environment and the psychological perception of it is not always positive or linear, indicating a disconnect between people’s subjective perceptions and the actual conditions of the built environment [6]. Due to differences in individuals’ social experiences, economic levels, and travel preferences, even residents within the same neighborhood may have varying subjective evaluations of the surrounding built environment. From a psychological perspective, people’s subjective perceptions of the built environment often have greater explanatory power for their travel behavior decisions than objective factors. Research on the perceived built environment and travel behavior is still in its early stages, and standardized indicators for perceived built environment are yet to be established. Therefore, it is essential to promptly explore the influence of the perceived built environment on travel behavior.
To address the gap in the existing research on how perceived built environments influence commute mode choice, this paper introduces an innovative framework using a Hybrid Choice Model (HCM). This approach uniquely analyzes the perceived built environments in both residential and workplace settings, providing a more comprehensive view of how these environments jointly impact commuters’ choices. Unlike earlier studies that concentrate on a single location or depend solely on objective metrics, our dual-location approach incorporates six latent variables, effectively capturing both overt and subtle factors that influence commuting behaviors. By combining a traditional Multinomial Logit (MNL) model with latent variable techniques, the HCM offers a deeper analysis that surpasses conventional metrics. Additionally, through a case study conducted in Shanghai, this research provides valuable insights into commuting behaviors within high-density urban contexts, contributing essential knowledge to the fields of urban planning and traffic management. Ultimately, this advanced modeling technique enhances our understanding of how different factors—such as socio-economic attributes, commuting characteristics, and perceived environmental conditions—separately influence commuting decisions, offering practical guidance for promoting sustainable urban development.
The remainder of this paper is organized as follows. The next section presents a literature review relevant to our study. The third section outlines the research and design carried out in this study including variables selection, data description and testing, and the modeling approach used. The fourth section provides an analysis of the results and several policy implications. Finally, the conclusions and a discussion of this study are presented.
2. Literature Review
The built environment comprises the physical and spatial surroundings shaped by land use patterns, urban design, and transportation infrastructure [7]. It can be categorized into the objective built environment and the perceived built environment, depending on the evaluation perspective taken. Scholars have explored the relationship between these types of built environments and travel behavior from multiple aspects such as the content of their research and methods. In this section, we will review and summarize the research on these four key aspects: the relationship between the objective built environment and travel behavior, the evaluation index system used for the perceived built environment, the relationship between the perceived built environment and travel behavior, and the application of the HCM in travel behavior analysis.
2.1. Relationship between Objective Built Environment and Travel Behavior
Since the 1990s, the expansion of urban roads has been constrained by natural environmental factors. Consequently, scholars have shifted their focus to exploring the relationship between the built environment and travel behavior. The aim has been to enhance the urban built environment to encourage changes in travel behavior, reduce the use of small cars, and lower transportation-related carbon emissions. Many researchers have employed the “5Ds” to assess the built environment and empirically analyze its impact on residents’ travel behavior. For instance, a study in Hong Kong, China, utilized the “5Ds” framework and census data to examine commuting modes, revealing a positive relationship between walking to commute and neighborhood design, particularly through the presence of street intersections [8]. Another study in Fuzhou found that built environment factors in residential and employment areas differently affect commuting modes, identifying an inverted U-shaped relationship between mixed land use and the choice of non-motorized and public transit commuting modes [9]. Additionally, research from Shanghai found that commuting distance acts as a mediating variable, partially mediating the relationship between the built environment and commuting modes. This mediation effect was most significant for the walking and bicycling commuting modes among suburban residents [10].
Existing empirical studies have shown that various elements of the built environment influence residents’ travel modes. However, the direction and magnitude of these impacts vary, and conclusions regarding the influence of the built environment at places of residence and employment are not consistent. These inconsistencies may be due to spatial heterogeneity, which arises from selecting different regions for empirical studies, as well as variations in research methodologies and data collection methods.
2.2. Evaluation Index System of the Perceived Built Environment
Research on methods for the evaluation of the perceived built environment has previously been carried out, primarily utilizing interviews and questionnaires, though a standardized questionnaire scale has not yet been established. Scholars have developed various measurement indicators for the perceived built environment, tailored to different research objectives and evaluation contexts. For instance, a study in the U.S. assessed the built environment in urban and rural communities using a scale comprising 43 measurement topics, including residential land use, non-residential space use, esthetic elements, amenities for walking and cycling, and transportation and road conditions [11]. Another study empirically examined the effects of subjective and objective community-built environments on walking among older adults, identifying six dimensions: perceived accessibility to activity venues, perceived accessibility to transportation stops, perceived connectivity, perceived roadway environment, perceived attractiveness, and perceived safety [12]. Additionally, research in Wuhan explored the impact of neighborhood environmental perception on residents’ health, considering both physical and social environmental perceptions. Physical environmental perception included environmental quality, service facilities, and sports and leisure facilities, while social environmental perception encompassed community organization, sense of belonging, and community safety [13]. Furthermore, a study from Nanjing identified perceived elements of the built environment such as convenience of living (proximity to shopping areas, parks, plazas, and public transit stops), neighborhood aesthetics (architectural aesthetics and the number of benches), the quality of walking (comfort and quietness of the environment), and walking safety (safety of children’s play areas, community security, and traffic safety) [14].
From the above analysis of the literature, it is evident that scholars use varying dimensions and specific indicators to evaluate the perceived built environment, depending on their evaluation targets and research content. In the next section, we will summarize research on the perceived built environment and travel modes to identify relevant indicators for assessing travel behavior.
2.3. Relationship between Perceived Built Environment and Travel Behavior
The stimulus–response theory in psychology suggests that environmental factors serve as stimuli that influence human behavior. Residents are influenced by the objective environment, which in turn shapes their psychological perceptions, and their subsequent behavior is based on these perceptions [15,16]. Due to discrepancies between objective environmental factors and subjective perceptions, some scholars have focused on the perceived built environment when studying the relationship between the environment and travel behavior [17]. For example, a study in San Diego examined the connection between perceptions of the built environment and walking behavior in six central ring neighborhoods. It found that features such as the presence of trees and wide sidewalks encouraged walking, while traffic noise, motorized vehicles, narrow sidewalks, and challenging intersections discouraged it [18]. Another study used factor analysis to categorize neighborhood environment perceptions into five latent variables, including perceptions of service facilities, road conditions, environmental quality, traffic safety, and community safety, covering eighteen measurement topics. Structural equation modeling showed that positive perceptions of service facilities and environmental quality increased the likelihood of walking and biking, while traffic safety was positively associated with small car commuting. Road conditions and community safety did not directly affect commuting mode choice [19]. Additionally, another study also employed a factor analysis to identify nine factors related to the perceived built environment: aesthetics, comfort and convenience, traffic safety, functional aspects and facilities along the path, accessibility to stores and public transport, personal security, continuity of walking and comfort, sidewalk width, and street enclosure. A regression analysis revealed that aesthetics, comfort and convenience, and traffic safety were significantly positively correlated with walking [20].
2.4. Application of the HCM in Travel Behavior Analysis
The application of the HCM in travel behavior analysis has garnered increasing attention due to its ability to integrate unobservable latent variables with observable choice behaviors, thereby providing a more comprehensive understanding of the complex factors influencing travel decisions. The study by Johansson et al. utilized an HCM to analyze how latent variables such as attitudes and personality traits affect individuals’ mode choice, demonstrating the HCM’s strength in capturing the impact of personal characteristics on travel behavior [21]. Walker et al. further explored how to identify latent variables within Hybrid Choice Models, particularly those related to travel behavior attitudes and perceptions, offering significant methodological support for the application of HCMs [22]. This approach is particularly effective for analyzing complex travel decision-making processes. Kamargianni and Polydoropoulou employed an HCM to investigate the effects of teenagers’ attitudes towards walking and cycling on their mode choice behavior, combining subjective attitudes and objective choice data, and demonstrating the HCM’s ability to handle latent variables and multidimensional data [23]. Moreover, HCMs have been crucial in analyzing the influence of environmental attitudes on transportation mode choice behavior. Hoyos et al. applied an HCM to study how environmental attitudes impact people’s travel choices, revealing a significant correlation between latent environmental attitudes and actual transportation behaviors [24]. These findings provide new perspectives for understanding technology acceptance, further enriching the applications of HCMs.
In conclusion, the application of HCMs in transportation behavior analysis is both broad and in-depth, covering various latent variables ranging from individual psychological factors to environmental attitudes. HCMs not only enhance our understanding of traditional discrete choice models but also provides more targeted recommendations for transportation policy-making and urban planning. These studies demonstrate that HCMs, as a powerful tool, effectively address the complexity and diversity of transportation behavior research, advancing both academic knowledge and practical application in the field.
Through the analysis of the above literature, it is evident that most existing studies on the impact of the perceived built environment on transportation modes primarily consider the objective built environment, with less attention given to residents’ subjective perceptions. Moreover, there is no unified evaluation index system for the perceived built environment. Due to differences in evaluation objects and research content, the dimensions and specific indicators used by scholars to measure the perception of the built environment vary. Most studies focus solely on the built environment in residential areas, likely because the place of residence is typically the starting point for people’s activities.
To address these research gaps, this paper includes the perception of the built environment at the workplace in the study of commuting, creating a more comprehensive research framework based on the HCM. Additionally, since obtaining objective parking data (e.g., parking fees, number of parking spaces) is challenging, most studies on built environment factors exclude the parking dimension. This paper incorporates the availability of parking when constructing an index system for the perceived built environment. These additions help to clarify the mechanism by which the perceived built environment influences the choice of commuting mode more clearly and effectively.
3. Research Design
3.1. Variables Selection
3.1.1. Perceived Built Environment
The literature review in Section 2 reveals a lack of a unified standard in academia for measuring the perceived built environment. This paper proposes characteristics related to travel modes and introduces the dimension of parking space availability. The perceived built environment is evaluated using six dimensions: destination accessibility, public transit accessibility, road conditions, travel safety, travel aesthetics, and parking convenience at both residential and workplace locations. These dimensions are treated as psychological latent variables, which are measured using observational variables. The specific indicators for each dimension are detailed in Table 1.

Table 1.
Latent variable description, factor loading, and test values.
3.1.2. Socio-Economic Characteristics
The socio-economic characteristics examined in this study include gender, age, occupation, income, education, household car ownership, and the presence of children in the household. The relationship between gender, occupation, and commuting mode choice is inconsistent across existing studies. For example, individuals working in companies may have more flexibility in choosing their commuting mode compared to those employed in government positions. Older individuals tend to prefer commuting by car, as walking or using public transit requires more physical effort. Higher income levels are often associated with a greater likelihood of purchasing and using a private car for commuting. Commuters with higher education levels, who may have more autonomy in job selection, often face longer commuting distances and a higher propensity to choose private cars. Household car ownership has a direct impact on commuting behavior; the more cars a household owns, the stronger the preference for car travel. Additionally, the number of children in a household can influence commuting mode due to the need to transport children to and from school.
3.1.3. Commuting Characteristics
This study examines how commuting characteristics influence the choice of commuting mode, focusing on three key variables: commuting distance, commuting time, and whether the departure time occurs during morning or evening peak hours. These variables were chosen based on several considerations. Firstly, commuters are more likely to opt for public transit during peak hours due to concerns about road congestion. However, if commuting times are flexible, commuters may adjust their departure times to avoid peak hours, thus reducing congestion and potentially increasing the likelihood of choosing to drive. Secondly, commuting distance is a critical factor in mode choice; shorter distances often lead to a preference for non-motorized modes like walking or cycling, while longer distances tend to favor car travel. Finally, commuting time is generally positively correlated with commuting distance, and its influence on commuting mode choice aligns with that of commuting distance.
3.2. Data Description and Testing
3.2.1. Data Collection
The built environment and work–residence separation vary greatly from city to city, so the choice of study area should not be too broad; thus, a single area was targeted for the case study. In this paper, Shanghai was chosen to be the study area. Since the actual travel behavior of the travelers and their perception of the built environment on the trip are being studied here, both of which are already occurring, the revealed preference survey method was used in this study. In this study, the sampling method of probability proportional to size sampling, which is the most widely used in the field of statistics and survey research methodology, was used to select respondents in the survey area according to the principle of randomization and equal proportionality. First of all, in accordance with the density distribution characteristics of the number of permanent residents in the 16 districts built in Shanghai, based on a certain proportion and the principle of uniform distribution, the survey area was chosen in order to enhance the overall representativeness of the survey samples, and then, using the field survey method, which is the most widely used method in the field of traffic and travel surveys, the questionnaire survey was conducted using the on-site random sampling survey method within the proposed selected survey area, and residential districts, commercial complexes, core business districts and transportation hubs were chosen as the main survey locations; finally, randomly selected survey respondents in the survey locations, with the majority of survey respondents being residents working and living in Shanghai for at least one year with commuting travel needs, were issued paper or electronic questionnaires in order to conduct the survey and record relevant data.
The main content of the questionnaire was divided into three parts. The first part is a survey of basic individual and household information, including: gender, age, occupation, education level, annual income, household location, driver’s license, marital status, housing status, and household car ownership. The second part was a survey of commuting trip information, including trip origins and destinations, departure and arrival times, and travel modes used for commuting. The third part recorded the participants’ subjective perceptions of their commuting travel environment, including their perception of the travel road conditions, safety, aesthetics, accessibility to destinations, accessibility to public transportation, and ease of parking on both sides of the workplace, for a total of 38 questions. The response options in the third section were quantitatively evaluated using a 5-point Likert scale method, using a score from 1 to 5 between the five levels of strongly disagree to strongly agree, respectively.
A pre-survey was conducted in April 2023 in various neighborhoods, central business districts, and public transportation hubs in Shanghai before the formal distribution of the questionnaire. The pre-survey was conducted by distributing paper questionnaires face-to-face, with a total of 112 questionnaires being distributed, and the initial questionnaire was modified according to the questionnaire completion and interview results to form the final version. For large-scale surveys, the formal survey was conducted online in consideration of sample size and data collection efficiency, and recognizing that field research can be limited by a variety of factors. Participants accessed the questionnaire by scanning a QR code or clicking on a provided link, and were offered a cash incentive for completing the questionnaire, thus increasing participation rates and ensuring more reliable data. In addition, based on the principle that the effective sample size in structural equation modeling should be 20 times the total number of observations for the latent variable, the questionnaire was designed to include a total of 38 observations, so it was necessary to ensure that the number of effective questionnaires was at least 760. From May to June 2023, a total of 1024 questionnaires were distributed online. To ensure the validity of the data, invalid questionnaires were screened out, resulting in 838 valid responses and a validity rate of 81.8%. The socio-economic characteristics of the questionnaire sample are described in Table 2.
Table 2.
Variables and description.
3.2.2. Data Testing
From the data in the latter columns of Table 1, it can be seen that the factor loadings of the observed variables corresponding to the six latent variables of perceived built environment at residence and workplace are all greater than the critical value of 0.5, indicating that the designed observed variables can effectively measure their respective latent variables and have passed the significance test. Additionally, the Cronbach’s alpha value of each latent variable is greater than the critical value of 0.7, the Average Variance Extracted (AVE) is greater than the critical value of 0.5, and the Combined Reliability (CR) is greater than the critical value of 0.7, all of which indicate that the scale has a good convergent validity. In summary, the evaluation indexes of the latent variable data are all high, proving that the scale questions corresponding to the indicator observation variables in the questionnaire are well-designed. The sampling process of the questionnaire considered the representativeness and randomness of the sample as much as possible. Although the representativeness of the sample may still be insufficient, it is acceptable to a certain extent, considering that the main purpose of this paper is to study the relationship between the sample’s commuting behavior and the built environment, rather than to reflect the sample’s commuting behavior itself.
3.3. Modeling Approach
As a new kind of discrete choice model, the HCM combines the discrete choice model and the latent variable model within a single framework. The HCM is an ideal tool for exploring the impact of latent variables (such as attitudes, perceptions, and preferences) on travel mode choice because it can combine unobservable latent variables with observable choice behaviors to more accurately analyze the impact of these implicit factors. The advantage of this model lies in its flexibility, which can handle both explicit and implicit factors at the same time, reflecting the complexity of travel choice behavior. In addition, the hybrid choice model improves the accuracy of predictions by integrating latent variables, providing more precise guidance for policy making and urban planning. Therefore, using the hybrid choice model to study the impact of latent variables on travel mode choice can not only help us to better understand residents’ travel behavior, but also provide a scientific basis for sustainable transportation policies. The most general framework was proposed by Ben-Akiva et al. [25,26] and consists of two components. The measurement model component describes the relationship between the indicators and their corresponding latent variables, while the structural model component describes the complex relationships among exogenous and endogenous variables. In this paper, we aim to examine the influences of perceived built environment on commute mode choice. To achieve this, we constructed a HCM framework with 12 latent variables. To measure the latent variables, 38 observed variables are used. The modeling framework is presented in Figure 1.
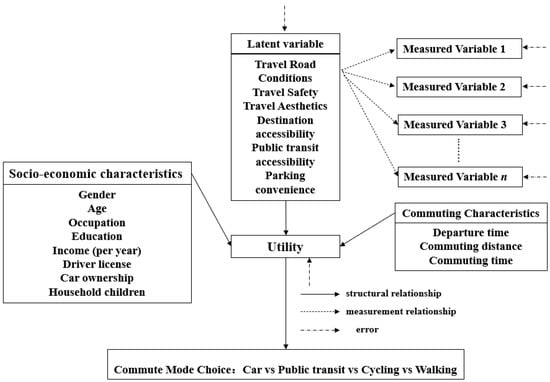
Figure 1.
Modeling framework.
For the HCM framework, the structural model and the measurement model can be described as follows. For the structural equation part:
where is the latent variable, is the exogenous variable, and is the random error term. is assumed to follow a normal distribution. This assumption is made for several reasons: the central limit theorem suggests that aggregated random effects tend to be normally distributed, which simplifies mathematical modeling and analysis. Moreover, the normal distribution’s symmetry around the mean ensures that the error term does not introduce systematic bias, making it a common choice in econometric models [27,28]. is the utility of the nonmotorized travel mode, and is the independently, identically distributed extreme value. , , and are the estimated parameters. For the measurement equations part:
where is the indicator of the latent variable (), is the random error term, and is a chosen indicator, taking the value one if the travel mode is chosen, and zero if not.
In this study, maximum likelihood techniques are used to estimate the model parameters. For the HCM approach, the likelihood function for a given observation is the joint probability of observing the travel mode choice and the attitudinal indicators, which can be obtained as follows:
To examine the role of the latent variable of perceived built environment in commute mode choice behavior, a comparison was conducted between the MNL model and the HCM. The implementation of the HCM is described above, while the implementation of the MNL model is based on the methodology outlined by Hausman and McFadden [29] in their work from 1984.
4. Results and Implications
4.1. Results Analysis
This study utilizes the valid data obtained from the questionnaire to construct the MNL model and HCM based on the methodology given in Section 3, to explore the influence of perceived built environment on commute mode choice. Socio-economic characteristics and commuting characteristics are added as control variables, with the actual commuting modes of commuters used as the explanatory variable. In the model parameter estimation, the car commuting mode is used as the utility reference term, and the model parameters are estimated using the maximum likelihood method with the help of the Stata 17 software.
Two models are constructed using stepwise regression: the MNL model includes only personal attributes and commuting characteristics as independent variables, while the HCM adds the perceived built environment of residence and employment place as independent variables. The results of the MNL and HCM analyses are shown in Table 3. The goodness-of-fit index R² of the model shows that the goodness-of-fit of the HCM, which includes the latent variable of perceived built environment, is higher than that of the MNL model, which only considers personal attributes and commuting characteristics. The R² increases by 0.08, approximately 27.4%, indicating that the perceived built environment plays a significant role in explaining the choice of commuting mode. This is consistent with the conclusions reached by Johansson et al. and Hoyos et al. [21,24]. Commuters’ socio-economic characteristics, commuting characteristics, and perceptions of the built environment all have a significant impact on their commuting mode choices. Additionally, there are more variables with more significance (p-value < 0.05 in MNL and p-value < 0.01 in HCM) in the HCM than in the MNL model, further suggesting that the constructed HCM is reasonable and valid. Therefore, the influence of commuters’ socio-economic characteristics, commuting characteristics, and perceived built environment on commute mode choice is analyzed below.
Table 3.
Results of the analyses with the MNL model and HCM (with car as the utility reference term).
There is a significant association between gender and public transit choice in the MNL model and HCM. Additionally, while the gender variable does not significantly affect cycling trip choices in the MNL model, it does in the HCM, suggesting that the HCM has a significantly improved goodness-of-fit and interpretability. Moreover, by analyzing the positive and negative regression coefficients, it can be observed that female commuters are more likely than male commuters to choose public transit. Additionally, after considering the perceived built environment, the likelihood of female commuters choosing cycling also increases. Age has a significant negative effect on non-motorized modes such as walking and bicycling, indicating that older commuters are less likely to use non-motorized modes. Furthermore, like the relationship between gender and commuting mode choice, age has a significant positive effect on public transit mode choice in the HCM, whereas this relationship is insignificant in MNL. This suggests that older commuters are more likely to choose public transit for commuting after considering the perceived built environment.
Occupation has a significant positive effect on the choice of public transit, cycling, and walking. The reference term for the occupation variable is commuters who work for the government, suggesting that those who work for private companies are more likely to choose public transit, cycling, and walking. This is because, in large cities, especially in Shanghai, company employees often have a better transportation infrastructure at their workplaces, with more accessible bus stops and cycling facilities. Furthermore, education negatively affects public transit choices but positively affects cycling and walking. Generally, commuters with higher education levels prefer to live closer to their workplaces and have better fitness habits, making them more inclined to choose cycling and walking as active modes of travel. Income has a significant negative effect on the choices of public transit, cycling, and walking. Higher-income commuters generally prefer to purchase private cars and are thus less likely to choose public transit.
Having a driver’s license only negatively affects a commuter’s choice of public transit. Car ownership significantly negatively impacts commuters’ choices of public transit, cycling, and walking, similar to the relationship with income. It is understandable that owning a car reduces the likelihood of choosing public transit, biking, and walking. The number of children in a commuter’s household significantly negatively affects the choice of public transit and cycling. Commuters who need to transport their children to and from school generally do not choose public transit and instead opt for more flexible car trips. Alternatively, they may choose to locate their workplace and residence near a school to facilitate commuting and transporting their children. If the departure time of the commute falls within the morning and evening peak hours, commuters are likely to choose public transit due to heavy congestion on urban roads during these times, ensuring the reliability of arrival times. Additionally, both commuting distance and commuting time have a significant negative impact on cycling and walking trip choices.
The HCM results in Table 3 reveal that the perceived built environment at residential places has a greater impact on commute mode choice than the perceived built environment at workplaces. This is not consistent with the conclusions of Wang et al. [8] and Sun et al. [17], which is possibly because we considered more latent variables related to the perceived built environment. Moreover, the perceived built environment has a more significant impact on public transit than on cycling and walking. In terms of the perceived built environment at residential places, public transit accessibility and destination accessibility both have significant positive impacts on walking and public transit, whereas the perceived built environment at workplaces influences only public transit choices. The road conditions in the perceived built environment within residential areas facilitate non-motorized mode choices such as walking and bicycling, whereas the perceived built environment at workplaces is related only to bicycling choices.
Travel safety within the perceived built environment in residential areas is related to the share of walking commutes, whereas the perceived built environment at workplaces has no significant effect. The travel aesthetics in the perceived built environment in residential areas increase the probability of bicycling and public transit choices, whereas the travel aesthetics in the perceived built environment at workplaces promote walking choices. Parking convenience of the perceived built environment at residential places dampens bicycling choices, and parking convenience at workplaces negatively affects public transit mode.
4.2. Policy Implications
Based on the case study results analyzed in this paper, the following policy implications are proposed to encourage commuters to shift from car usage to green modes of transportation (cycling, walking, and public transit):
4.2.1. Enhance the Development of Mixed Land Functions near Residential and Workplace Areas
The findings indicate that commuters are more likely to walk and use public transit when they perceive better accessibility to destinations near their homes and workplaces. Commuters often have multiple destinations in a single trip, and the number and spatial distribution of service facilities around their residences and workplaces can significantly determine the distance traveled. A higher degree of land use diversity near these areas shortens the distance between various facilities, promoting non-motorized modes such as walking and cycling, and helps cultivate green travel habits among commuters.
4.2.2. Position Public Transit Facilities Close to Residential and Workplace Areas
The analysis shows that better public transit accessibility in the perceived built environment increases the likelihood of commuters choosing buses or subways. The perception of public transit accessibility is most reflected in the observation variable, “the distance to the nearest bus or subway station is appropriate”. Therefore, bus and subway stations should be located as close as possible to residential and workplace areas. With the ongoing development of subway systems, city planners should integrate residential area development with the influence zone of subway stations to improve accessibility.
4.2.3. Improve the Attractiveness of Urban Buildings and Street Roads
The attractiveness of the natural and human landscape around workplaces can encourage workers to choose bicycles, electric vehicles, and public transit. Enhancing the esthetics of road surroundings can increase commuters’ enjoyment during their commute. Urban planners and architects should consider the visual appeal of buildings while ensuring their functionality. For example, the government can plant ornamental plants in street green belts and construct landscaped pedestrian paths to increase the willingness to walk and use other green travel modes.
4.2.4. Enhance Travel Safety in Residential Areas
The study shows that perceived travel safety in the built environment is related to the proportion of walking commuters. Therefore, we recommended strengthening the traffic safety measures in residential areas, such as installing more traffic lights, adding road signs, and improving lighting conditions, to enhance the sense of safety for pedestrians and cyclists.
4.2.5. Adjust Parking Convenience in Residential and Workplace Areas Appropriately
Given the negative impact of parking convenience on non-motorized travel modes, it is recommended to limit the supply of parking facilities in residential and work areas. Specifically, reducing the number of parking spaces in city centers and convenient transportation areas can encourage more people to choose public transit, walking, or cycling.
5. Conclusions and Discussion
This study investigated how the perceived built environment at commuters’ workplaces and residences influenced their commuting mode choices. Two types of discrete choice models were constructed for quantitative analysis using actual survey data from Shanghai. The study examined the direction and impact of the perceived built environment latent variables, aiming to guide commuters toward green modes of transportation by improving the built environment around their residences and workplaces, thereby alleviating road congestion and reducing transportation-related carbon emissions.
Firstly, we reviewed the current state of research on the relationship between the built environment and travel behavior, finding that most studies focused solely on the objective built environment while overlooking commuters’ perceptions of the built environment. Therefore, this study explored the issue from a subjective perspective. Based on the literature, we summarized the evaluation indexes used for the perceived built environment related to transportation behavior and constructed an evaluation index system comprising six latent variables: destination accessibility, public transportation accessibility, road conditions, safety perception, esthetics, and parking space availability. Using the literature and the pre-survey interview results, we designed the measurement items for each latent variable and analyzed the influence mechanism of each factor on commuters’ commuting mode choice. A questionnaire survey was then conducted, incorporating interview results from the pre-survey stage to form the questionnaire. Based on the valid questionnaire data, we conducted a reliability test, constructed the latent variable measurement model, and developed the MNL model and HCM for commuting mode choice. An empirical analysis was then conducted to examine the influence of the perceived built environment at residences and workplaces on commuting mode. Finally, based on the empirical results, this study draws conclusions and provides relevant suggestions for urban planning and transportation management policies.
We believe that future research can deepen our understanding of how the built environment affects travel behavior by focusing on several key areas. Firstly, future studies could prioritize longitudinal data analyses to assess the long-term impacts of changes in the built environment on travel choices. This approach would help capture the effects of temporal dynamics and provide insights into how urban planning decisions influence sustainable travel behavior over time. Additionally, expanding the research scope to include various travel purposes beyond commuting, such as shopping, leisure, and social trips, would allow for a more comprehensive exploration of the built environment’s influence on diverse travel mode choices. Furthermore, future research should integrate objective measures of the built environment with subjective perceptions, using the latter as mediating variables to better understand their combined effects on travel behavior. Lastly, leveraging advanced machine learning techniques could offer valuable opportunities to predict and simulate travel behavior across different environmental scenarios, providing critical insights for urban planners and policymakers designing sustainable cities. These future research directions will not only contribute to the academic community but also offer practical guidance for promoting sustainable urban transportation and supporting effective urban development strategies.
Author Contributions
Conceptualization, H.L. and H.G.; methodology, H.L. and H.G.; software, H.L.; validation, H.L. and H.G.; writing—original draft preparation, H.L.; writing—review and editing, H.G.; visualization, H.L.; project administration, H.G.; funding acquisition, H.G. All authors have read and agreed to the published version of the manuscript.
Funding
This research was supported by the National Natural Science Foundation of China (Grant Number: 71871143), and the Key Scientific and Technological Project Funded by Science and Technology Commission of Shanghai Municipality (Grant Number: 22dz1203400 & 22dz1203405).
Institutional Review Board Statement
Not applicable.
Informed Consent Statement
Informed consent was obtained from all subjects involved in the study.
Data Availability Statement
Data are contained within the article.
Conflicts of Interest
The authors declare no conflict of interest.
References
- Mitra, R. Independent mobility and mode choice for school transportation: A review and framework for future research. Transp. Rev. 2013, 33, 21–43. [Google Scholar] [CrossRef]
- Ball, K.; Jeffery, R.W.; Crawford, D.A.; Roberts, R.J.; Salmon, J.; Timperio, A.F. Mismatch between perceived and objective measures of physical activity environments. Prev. Med. 2008, 47, 294–298. [Google Scholar] [CrossRef] [PubMed]
- McCormack, G.R.; Cerin, E.; Leslie, E.; Du Toit, L.; Owen, N. Objective versus perceived walking distances to destinations—Correspondence and predictive validity. Environ. Behav. 2008, 40, 401–425. [Google Scholar] [CrossRef]
- Ding, C.; Cao, X.Y.; Liu, C. How does the station-area built environment influence Metrorail ridership? Using gradient boosting decision trees to identify non-linear thresholds. J. Transp. Geogr. 2019, 77, 70–78. [Google Scholar] [CrossRef]
- Cao, X.Y. Heterogeneous effects of neighborhood type on commute mode choice: An exploration of residential dissonance in the Twin Cities. J. Transp. Geogr. 2015, 48, 188–196. [Google Scholar] [CrossRef]
- Ding, C.; Cao, X.Y.; Wang, Y.P. Synergistic effects of the built environment and commuting programs on commute mode choice. Transp. Res. Part A Policy Pract. 2018, 118, 104–118. [Google Scholar] [CrossRef]
- Jandy, S.; Boarnet, M.; Ewing, R.; Killingsworth, R. How the built environment affects physical activity—Views from urban planning. Am. J. Prev. Med. 2002, 23, 64–73. [Google Scholar]
- Wang, D.G.; Cao, X.Y. Impacts of the built environment on activity-travel behavior: Are there differences between public and private housing residents in Hong Kong? Transp. Res. Part A 2017, 103, 25–35. [Google Scholar] [CrossRef]
- Zhang, Y.; Hu, S.; Chen, X.; Zhao, L. The impact of urban built environment on residential choice of commuting mode: Based on empirical research in Fuzhou. Urban Dev. Stud. 2019, 26, 72–78. [Google Scholar]
- Zhu, Q.Y.; Ta, N. The impact of built environment in neighborhood and workplace on suburban residents’ commuting mode: A case study in Shanghai. World Reg. Stud. 2021, 30, 433–442. [Google Scholar]
- Porter, A.K.; Wen, F.; Herring, A.H.; Rodríguez, D.A.; Messer, L.C.; Laraia, B.A.; Evenson, K.R. Reliability and One-Year Stability of the PIN3 Neighborhood Environmental Audit in Urban and Rural Neighborhoods. J. Urban Health Bull. N. Y. Acad. Med. 2018, 95, 431–439. [Google Scholar] [CrossRef]
- Yupei, J.; Feng, Z.; Honghu, S.; Wenwen, W. Research on the influence of urban built environment on daily walking of older adults from a perspective of health. Geogr. Res. 2020, 39, 570–584. [Google Scholar]
- Zhang, S.Y.; Lin, S.N.; Li, Z.G.; Guo, Y. Influence of neighborhood environmental perception on self-rated health of residents in cities of China: A case study of Wuhan. Hum. Geogr. 2019, 34, 32–40. [Google Scholar]
- Wu, J.Y.; He, Z.Y. The Effects of community built environment on residents’ sedentary behavior: A study in Nanjing. Mod. Urban Res. 2021, 124–131. [Google Scholar] [CrossRef]
- Wang, D.; Zhou, M. The built environment and travel behavior in urban China: A literature review. Transp. Res. Part D Transp. Environ. 2017, 52, 574–585. [Google Scholar] [CrossRef]
- Chan ET, H.; Schwanen, T.; Banister, D. The role of perceived environment, neighbourhood characteristics, and attitudes in walking behaviour: Evidence from a rapidly developing city in China. Transportation 2021, 48, 431–454. [Google Scholar] [CrossRef]
- Sun, B.; Lin, J.; Yin, C. Impacts of the built environment on social capital in China: Mediating effects of commuting time and perceived neighborhood safety. Travel Behav. Soc. 2022, 29, 350–357. [Google Scholar] [CrossRef]
- Herrmann-Lunecke, M.G.; Mora, R.; Vejares, P. Perception of the built environment and walking in pericentral neighbourhoods in Santiago, Chile. Travel Behav. Soc. 2021, 23, 192–206. [Google Scholar] [CrossRef]
- Cao, C.; Zhen, F.; Jiang, Y.P. The influence of neighborhood environmental perception and individual health on commuting mode choice: A case study of Nanjing city, China. Geogr. Res. 2021, 40, 2823–2837. [Google Scholar]
- Paydar, M.; Fard, A.K.; Khaghani, M.M. Walking toward Metro Stations: The Contribution of Distance, Attitudes, and Perceived Built Environment. Sustainability 2020, 12, 10291. [Google Scholar] [CrossRef]
- Johansson, M.V.; Heldt, T.; Johansson, P. The effects of attitudes and personality traits on mode choice. Transp. Res. Part A Policy Pract. 2006, 40, 507–525. [Google Scholar] [CrossRef]
- Walker, J.L.; Ben-Akiva, M.; Bolduc, D. Identification of parameters in normal error component logit-mixture (NECLM) models. J. Appl. Econom. 2007, 22, 1095–1125. [Google Scholar] [CrossRef]
- Kamargianni, M.; Polydoropoulou, A. Hybrid choice model to investigate effects of teenagers’ attitudes toward walking and cycling on mode choice behavior. Transp. Res. Rec. 2013, 2382, 151–161. [Google Scholar] [CrossRef]
- Hoyos, D.; Mariel, P.; Hess, S. Incorporating environmental attitudes in discrete choice models: An exploration of the utility of the awareness of consequences scale. Sci. Total Environ. 2015, 505, 1100–1111. [Google Scholar] [CrossRef]
- Ben-Akiva, M.; McFadden, D.; Train, K.; Walker, J.; Bhat, C.; Bierlaire, M.; Bolduc, D.; Boersch-Supan, A.; Brownstone, D.; Bunch, D.S.; et al. Hybrid choice models: Progress and challenges. Mark. Lett. 2002, 13, 163–175. [Google Scholar] [CrossRef]
- Ben-Akiva, M.; Walker, J.; Bernardino, A.T.; Gopinath, D.A.; Morikawa, T.; Polydoropoulou, A. Integration of choice and latent variable models. In Perpetual Motion: Travel Behaviour Research Opportunities and Application Challenges; Mahmassani, H.S., Ed.; Pergamon: Amsterdam, The Netherlands; New York, NY, USA, 2002; pp. 431–470. [Google Scholar]
- Greene, W.H. Econometric Analysis, 7th ed.; Pearson Education: London, UK, 2012. [Google Scholar]
- Wooldridge, J.M. Econometric Analysis of Cross Section and Panel Data, 2nd ed.; MIT Press: Cambridge, MA, USA, 2010. [Google Scholar]
- Hausman, J.; McFadden, D. Specification tests for the multinomial logit model. Econom. J. Econom. Soc. 1984, 52, 1219–1240. [Google Scholar] [CrossRef]

Disclaimer/Publisher’s Note: The statements, opinions and data contained in all publications are solely those of the individual author(s) and contributor(s) and not of MDPI and/or the editor(s). MDPI and/or the editor(s) disclaim responsibility for any injury to people or property resulting from any ideas, methods, instructions or products referred to in the content. |
© 2024 by the authors. Licensee MDPI, Basel, Switzerland. This article is an open access article distributed under the terms and conditions of the Creative Commons Attribution (CC BY) license (https://creativecommons.org/licenses/by/4.0/).