Article

Brake Torque Sensor Calibration Device

1
Faculty of Engineering Sciences, State University of Applied Sciences in Nowy Sącz, 1a Zamenhofa Street, 33-300 Nowy Sącz, Poland
2
Department of Transport and Handling Machines, Faculty of Mechanical Engineering, University of Zilina, Univerzitná 1, 010 26 Žilina, Slovakia
3
Department of Vehicles and Engines, Faculty of Mechanical Engineering, Technical University of Liberec, Studentská 1402, 46117 Liberec, Czech Republic
*
Author to whom correspondence should be addressed.
Appl. Sci. 2024, 14(17), 7927; https://doi.org/10.3390/app14177927
Submission received: 9 August 2024 / Revised: 28 August 2024 / Accepted: 3 September 2024 / Published: 5 September 2024
(This article belongs to the Section Electrical, Electronics and Communications Engineering)

Abstract

:
This paper deals with the design of a calibration device for measuring the residual torque of the vehicle brake. It informs about the problems and purpose of the brakes, requirements placed on the brake system, and the design of vehicle brake systems. The practical part of the research contains the design of four versions of the calibration device and the 3D model of the proposed calibration device. There is also a new calibration methodology and calculation of the theoretical fault of the calibration device. An analysis and comparison of the original and new torque sensor calibration methods are presented at the end of this paper. By comparing the original and new calibration methods, it was revealed that the deviations from the required torque value compared to the original calibration version decreased from an average value of 0.154 Nm to 0.0047 Nm, and the variance of the measured values decreased on average from 0.00276 Nm to 2.07 × 10⁻⁶ Nm. The proposed new torque sensor calibration method has shown a positive contribution to the accuracy of torque sensor calibration, which as a result will significantly increase the reliability and accuracy of measuring the residual torque of automobile brakes and shorten the measurement time.

1. Introduction

More than 130 years have passed since the world’s first car with a gasoline engine was produced. Whether it was a car of the distant past or the cars of today, they all need to stop at the right time and in the right place, which requires brakes. Constantly increasing demands for ecological and environmental sustainability have increased the demands for the operation of cars and, ultimately, for the brakes themselves. The current trend is to reduce fuel consumption as much as possible, influence the amount of emissions from the combustion of hydrocarbon fuels, and reduce the particle of matter emissions from the wear of brake friction materials and vehicle tires. As stated [1], particulate matter (PM) is one of the world’s most problematic pollutants in terms of harm to the environment and human health. Brake dust emissions represent on average 21% of PM emissions in the air, while their share increases near the edges of roads and at intersections, or other places where it is necessary to adjust the traffic speed [2,3,4,5,6]. The statistics show that motor vehicle exhaust emissions have a decreasing trend, while the amount of non-exhaust emissions gradually increases [7,8,9,10]. Several tests demonstrated that PM emissions significantly increased at the brake temperature of 130 °C and higher during long-term or intensive braking [11]. With the increasing dimensions of cars, the increasing weight of vehicles, and the increasing payloads of vehicles, there is a higher production of PM emissions. The amount of these emissions also affects the technical condition of vehicles, or their braking systems [12]. A lot of research work has been conducted on the production and distribution of brake particulate matter [13]. Based on PM size distribution from brake wear, 84% of total PM emissions are considered as PM1, i.e., smaller than 1 μm [1,14]. Kukutschova et al. [15] report that minimal knowledge about the morphology, chemical composition, and toxicity of nano- and micro-sized particles released from automotive brakes is alarming due to the fact that brake manufacturers are currently not required to develop eco-friendly formulations, particularly when over 70% of the U.S. and only a slightly smaller amount of European brake linings are being imported, which makes it more difficult to control all aspects of these imported brake linings. The authors of refs. [16,17] pointed out that the different kinds of friction materials, LM, SM, and NAO, behave differently considering the differences that can be observed in the friction layer’s morphology, resulting from the different wear mechanisms.
Apart from PM, squeal is another harmful effect of the operation of a brake system. Squeal is generated due to the contact of the friction couple during braking and with the related high frequency of the vibration of the brake system components [18]. However, there are many cases, in which the residual torque after braking leads to unpleasant noise, which is given off during vehicle movement [19,20]. This residual torque not only causes squeals but also negatively contributes to the drag [21,22,23].
Based on the facts described above, there are efforts to minimize the residual torque of the brake system of vehicles. The issue is to determine the value of this residual torque. It is possible to find it experimentally by means of a suitable calibration device [24,25].
In all cases, a strict relationship exists between the composition of the friction layer forming on the mating surfaces and the composition of the emitted particles. The residual torque of the brake plays a significant role in this issue. This is the torque that is created by the contact of the brake element with the disc after the brake is released. For the measurement results of this torque to be as accurate as possible, it is necessary to ensure the high accuracy of the entire measuring device, especially the torque sensor. For the values measured by the sensor to be as accurate as possible, it is necessary to calibrate it at regular intervals and verify its correctness and function with a suitable calibration device. Such a device is equipped with a torque sensor and other needed components [26,27,28]. The designed device is detailed as described below. This issue is currently highly relevant due to the upcoming arrival of the latest emission standard, EURO 7, in 2026, which will regulate emissions from brakes and tires for the first time.

2. Brake System

The brake system is one of the most important parts of the vehicle in terms of active safety. The main brake systems of road vehicles [29,30,31] and rail vehicles [32,33,34] work on the friction principle when friction couples are in contact and generate brake force. These systems contain friction parts, whose main tasks are to slow down the vehicle, stop it, as well as secure the stationary vehicle from starting on its own. A system consists of brake and control mechanisms and is based on criteria such as the purpose of use, energy source, braking force transmission, and the control mechanism. Brake systems are divided into four main groups:
  • Service brakes, the main feature of which is foot control. During operation, they must act on all vehicle wheels and vehicle sets and their effect must be variable. They must ensure a reduction in speed or a complete stop of the vehicle while maintaining the desired direction.
  • Emergency brakes, which, unlike service brakes, do not have to act on every single wheel of the vehicle or set of vehicles. In case of failure, they replace the service brakes, and it is important that they act on at least one wheel on each side. Emergency brakes often work with less effect than service brakes.
  • Parking brakes, the main task of which is to prevent a stationary vehicle from moving off a slope even if there is no driver in the vehicle.
  • Auxiliary brakes, which are characterized by maintaining a constant speed of the vehicle, but also by reducing it. In this way, they increase the effect of the service brake while lightening it, thereby extending its service life [35].

2.1. Types of Brake Systems

Two basic types of brake systems are used in today’s cars, which differ in their construction and have their own advantages and disadvantages:
  • Drum brakes—use drum-shaped housing where the brake shoes are pressed against the inner surface to create friction. They are durable and cost-effective for rear wheels.
  • Disc brakes—use a disc-shaped rotor that rotates with the wheel and the brake pads press against it to brake. Due to better heat dissipation and stopping power, they are usually used in front-wheel and high-performance vehicles.
The advantages and disadvantages of this solution are introduced in Table 1.
Another criterion for the division of brake systems involves the method of their control. According to this criterion, brake systems are divided into conventional brake systems and electronic brake systems. Conventional braking systems are controlled by the driver’s power, while the driver not only determines the magnitude of the braking pressure with his foot but also the magnitude of the braking moments on the wheels of the car. The force of the driver creates hydraulic pressure in the master brake cylinder, which is transmitted to the wheel brakes with the help of brake fluid. In most light commercial vehicles and passenger cars, this hydraulic pressure is increased by means of a brake booster. The basic essence of generating braking force in electronic braking systems is based on the same principle as in conventional braking systems. The difference lies in the so-called “intelligent braking”, where the braking effect is achieved through hydraulic and electronic parts of the system [35]. The use of intelligent braking and electronic safety elements using the brake system leads to much more frequent braking and, thus, longer periods of contact between the lining and the friction surface of the brake disc compared to conventional braking. The result is greater wear of the friction material. Therefore, the development is directed toward the optimization of brake systems and their parts, as well as the increase in energy recuperation [37,38,39]. The most common types of brake systems used in passenger cars are direct-acting fluid brakes. These brakes are based on Pascal’s law, which refers to the uniform spread of pressure in liquids in all possible directions. The rule applies that pressure in a liquid propagates at the speed of sound. With this rule, the braking start-up time and the braking distance itself will be shortened. An important property of the working fluid is its incompressibility at normal pressures in the system. Equalizing and distribution devices, which are necessary for mechanical brakes, can be replaced with working fluid. Fluid brakes consist of the brake pedal, brake master cylinder, brake booster, pipe system, brake caliper with brake rollers, and brake effect limiter.
The main principle of braking is the creation of a braking force by means of friction, which causes the kinetic energy of the vehicle to be hindered. With disc brakes (which are the most widely used today and which this article deals with), friction is caused by pressing the brake pads against the braking surface of the brake disc using pistons controlled by the pressure of the liquid in the brake system.
Nowadays, several designs of disc brakes are used. These types are distinguished from each other mainly due to the different construction of the brake caliper. The most widespread are disc brakes with fixed calipers (Figure 1) and disc brakes with floating calipers. The advantages and disadvantages of such disc brakes are shown in Table 2.

2.2. Residual Torque

Today, vehicles are subject to strict emission standards that began to be applied as early as 1992 (EURO 1). For this reason, vehicle manufacturers place great emphasis on the gradual reduction of emissions. All periods of validity for individual standards and permissible values for CO and particulate matter (PM) emissions referenced in this article are listed in Table 3, where one can see how significantly they are restricted. Currently, the EURO 7 standard is applied to eliminate the majority of undesirable substances that affect the overall air quality, and for the first time, sets limits for the production of emissions from parts of the vehicle other than the engine, specifically particulate matter emissions from brakes and tires. Brake emissions are in the range of PM10 with a diameter of 10 microns or less, or PM 2.5, which is fine dust with a diameter of 2.5 microns or less [41]. Brake dust production occurs at the greatest extent during braking, but thanks to the residual moment of the brake, it also forms after braking. The residual torque of the brake is created when the pressure in the brake system is released (when the brake pad is still in contact with the brake disc). With a fixed caliper design, this contact is less than that with a floating caliper. This is because the plate with the pistons on both sides is pulled back due to the deformation of the sealing ring and the release of pressure in the system. Backlash due to disc vibrations is minimal in this case. In the construction solution with a floating caliper, it is obvious that the pistons are only on one side. After the pressure is released and due to the deformation of the sealing ring, the brake pad retracts on only one side. The pad, on the other side, is imprinted only by the influence of vibrations and some throwing on the disc. Here, there is significantly greater contact between the brake pad and the disc, which adversely affects the vehicle’s operating parameters. Contact creates increased friction, which, in addition to the formation of brake dust, also leads to increased fuel consumption, which is reflected in increased production of gas emissions.

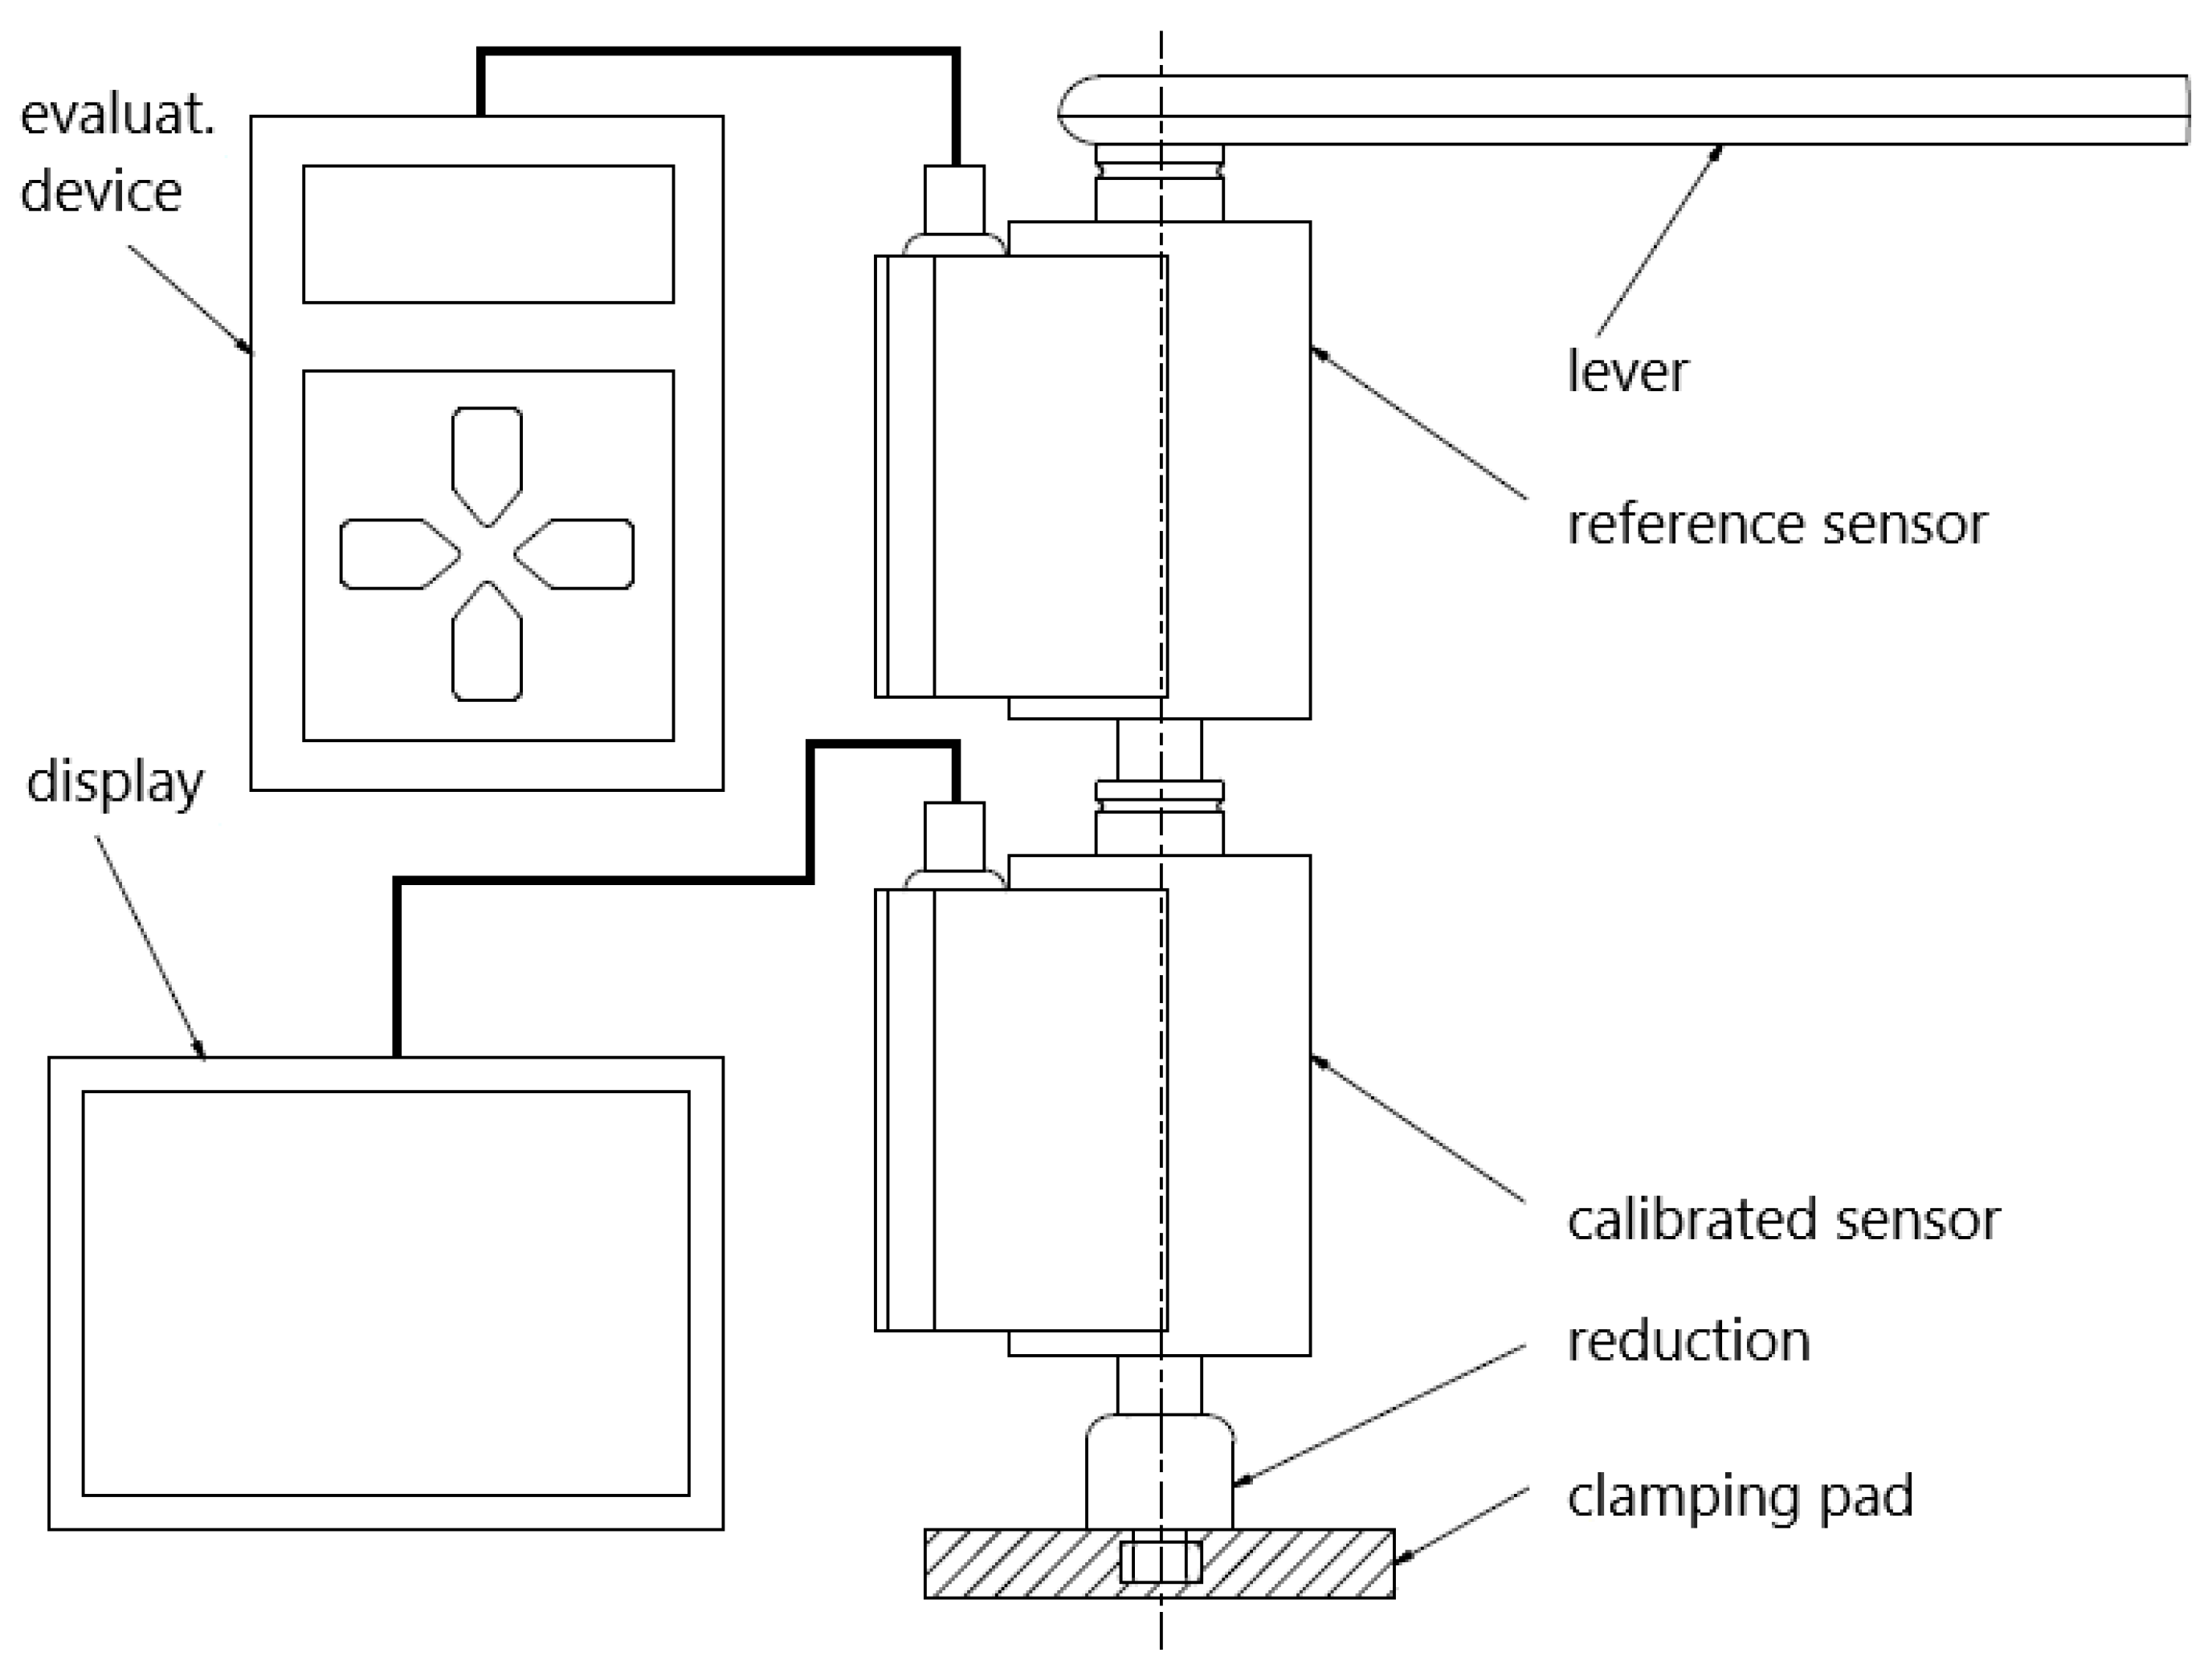
3. Description of the Measuring Device

The measuring device intended for measuring the residual torque on the disc brake enables the performance of functional static tests of hydraulic brake calipers. It is a fully automated device that is constructed from several electrical, hydraulic, and pneumatic circuits. The device is used for performing tests on hydraulic brakes with fixed or floating calipers. The device consists of the following parts, which are shown in Figure 2:
  • Bases 1 and 2 serve to fix the universal plate and the brake disc. Base 2 is equipped at one end with a simple mechanism for clamping the torque sensor.
  • A universal plate serves to fasten the measured brake caliper.
  • A brake disc is used for measurements. It is fixed through the flange on base 2.
  • Gearbox system with an el. motor, which serves to rotate the brake disc.
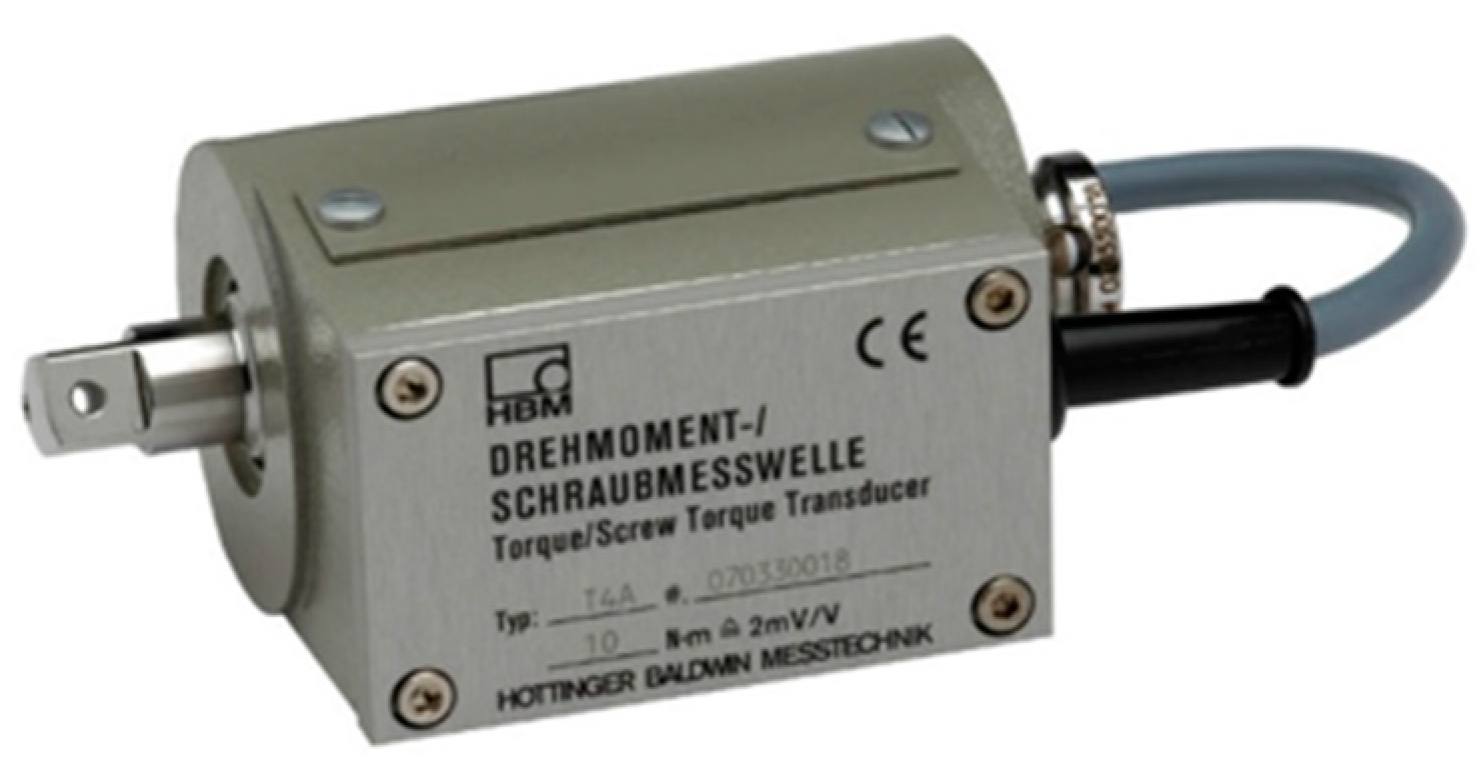
  • Torque sensor, which is used to measure the residual torque on the brake disc.
The torque sensor is the most important part of the entire measuring chain, and its accuracy has the greatest influence on the accuracy of the entire measuring device. For this reason, it was necessary to design an accurate, simple, and reliable calibration device that would introduce errors into the measured values as little as possible.
Figure 3 shows a used torque sensor from HBM. To measure the residual torque of the brake, a sensor with a nominal range of 10 Nm to 20 Nm is used.
Sensor parameters [44,45] are as follows:
  • Type: T4A.
  • Accuracy class: 0.1.
  • Nominal (measuring) range: 10 Nm; 20 Nm.
  • Nominal (measurement) sensitivity: 2 mV/V < ±0.2%.
  • Amount of rotation at the nominal (measuring) torque: 0.9° for a 10 Nm sensor and 1.1° for a 20 Nm sensor.

4. Calibration Equipment Models

Four types of construction design of calibration devices are proposed; in three cases, a torque sensor was used as a standard, and in one case a calibrated weight was used as a standard. The CAD program Autodesk Inventor Professional 2023 was used to create the models.

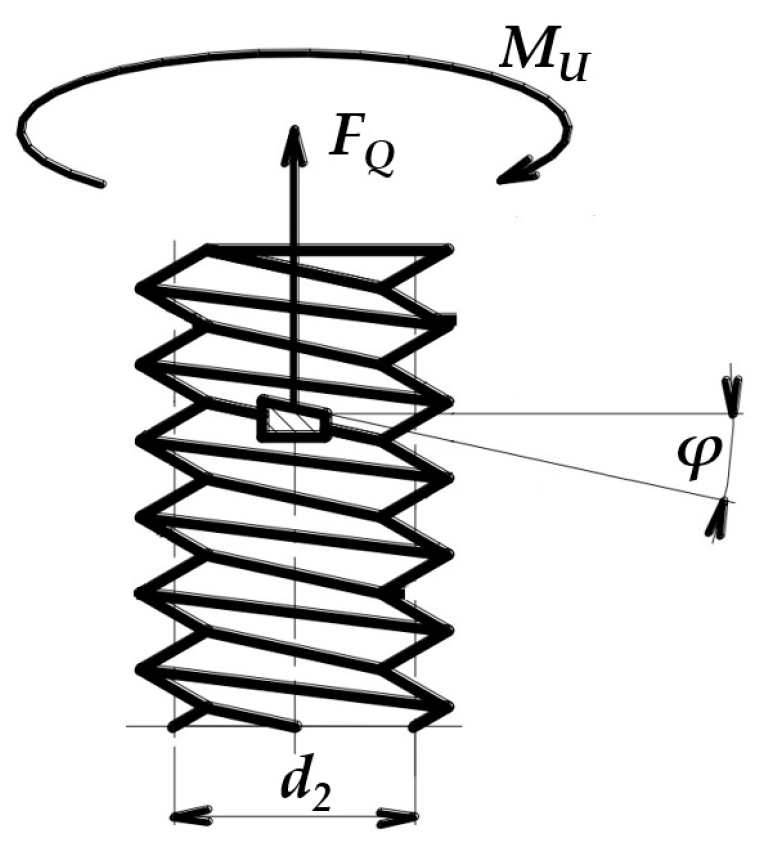
4.1. Design of a Calibration Device with a Threaded Rod

Figure 4 shows the model of the calibration device, where the torque is induced using a threaded rod, and a torque sensor is used as a standard. In this version, the torque is generated in both directions of rotation. The disadvantages of this design involve the more time-consuming setting of the torque value using a threaded rod and the problematic axial setting of the torque sensor to the standard. In this design, the device contains bearings that would cause resistance during calibration and thereby introduce unwanted measurement errors into the calibration.
The wanted torque on the shaft with the torque sensor M S is given as follows:
M S = F Q · L
where
  • F Q denotes the force in the treaded rod [N].
  • L denotes the distance between the shaft axis and the treaded rod axis (Figure 4).
Further, the force FQ is calculated by means of the known relations for a screw joint (Figure 5).
The torque MU, which is caused by an operator, is calculated as follows:
M U = F Q · 1 2 · d 2 · t a n φ + φ z + f p · D p ,
where
  • d 2 denotes the mean screw diameter [m].
  • φ denotes the pitch angle of the thread [rad].
  • φ z denotes the friction angle [rad].
  • f p denotes the friction coefficient in a thread.
  • D p denotes the mean diameter of the contact surface [m].
As the next step, the torque MU is also given by the following formula (Figure 5):
M U = F r · R ,
where
  • F r denotes the force on a handle of a threaded screw deduced by an operator [N].
  • R denotes the diameter of a threaded screw handle [m].

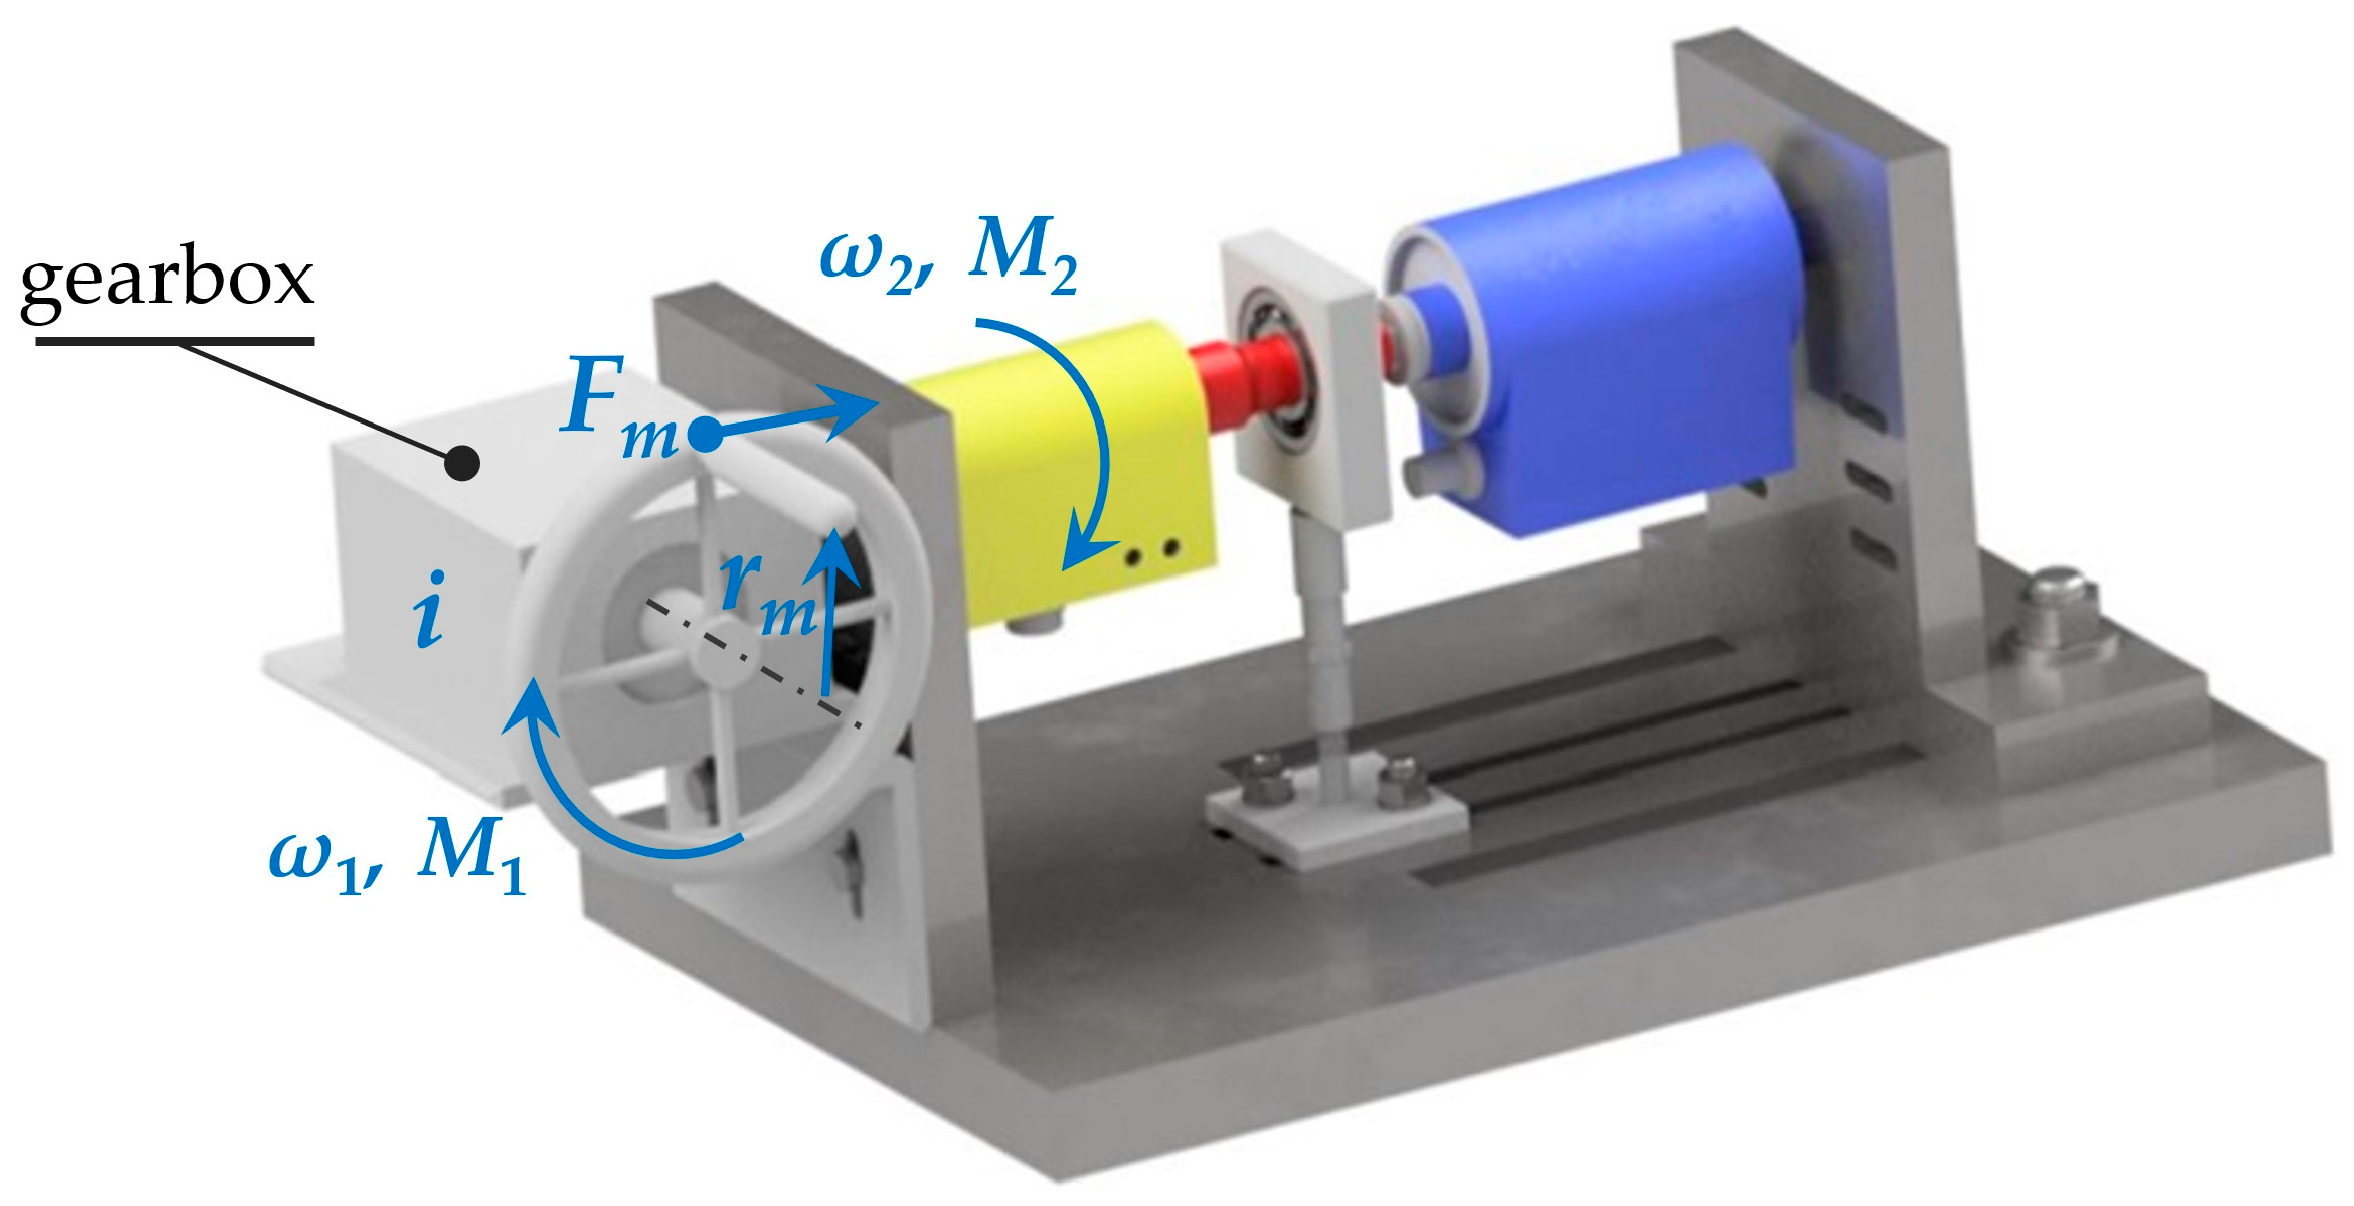
4.2. Design with the Angular Gearbox

With this design, the problematic and time-consuming settings of the torque were eliminated. This was achieved by replacing the threaded rod with an angle gear with a given gear ratio. The advantage is an easier and faster setting of the torque value, which could be set in both directions of rotation. The disadvantages include the problematic axial adjustment of the torque sensor to the standard and the introduction of errors due to the effect of rolling bearings. By using the gearbox, the built-in dimensions of the entire calibration device were increased, which significantly increased the entire weight of the device. A rather complicated gearbox with a high gear ratio and a self-locking mechanism meant that this device was not developed further. Figure 6 shows the model of this device.
The determination of torque M2 requires knowledge of torque M1. The wheel has a radius (rm) and includes a crank. An operator causes the force, Fm. Then, the torque in the gearbox input M 1 is given by the following formulation:
M 1 = F m · r m
where
  • M 1 denotes the torque on the gearbox input [Nm].
  • F m denotes the force induced by an operator [N].
  • r m denotes the wheel radius [m].
The gear ratio of gearbox i can be calculated based on the input and output angular velocities, ω 1 and ω 2 , as follows:
i = ω 1 ω 2
Then, torque M 2 is given by the following equation:
M 2 = M 1 · i · η
where
  • η denotes the mechanical efficiency of the gearbox.
Substituting Formulae (4) and (5) to Equation (6), torque M 2 is calculated as follows:
M 2 = F m · r m · ω 1 ω 2 · η

4.3. Design with Weight Carriers

In this case, a torque sensor is used as the standard. Weight carriers placed on an arm of a known length serve to store a set of weights that cause a moment of force on this arm. The advantages of this version include a simpler design and a lighter version compared to the version with an angular gearbox. The disadvantages include the errors introduced into the overall calibration due to the occurrence of rolling bearings and the problematic provision of the sensor’s axial position relative to the standard. With this design, there is an imperfect alignment of the system, which is caused by friction between the arm and the weight carriers. Figure 7 shows such a model with weight carriers.
The mathematical description of this device comes from the principle of the lever mechanism’s moment equilibrium, as follows:
M R = M L F R · l R = F L · l L
where
  • F R , F L denote the gravitational forces due to the weights [N].
  • l R , l L denote the lengths of the arms that the weights act on [m].

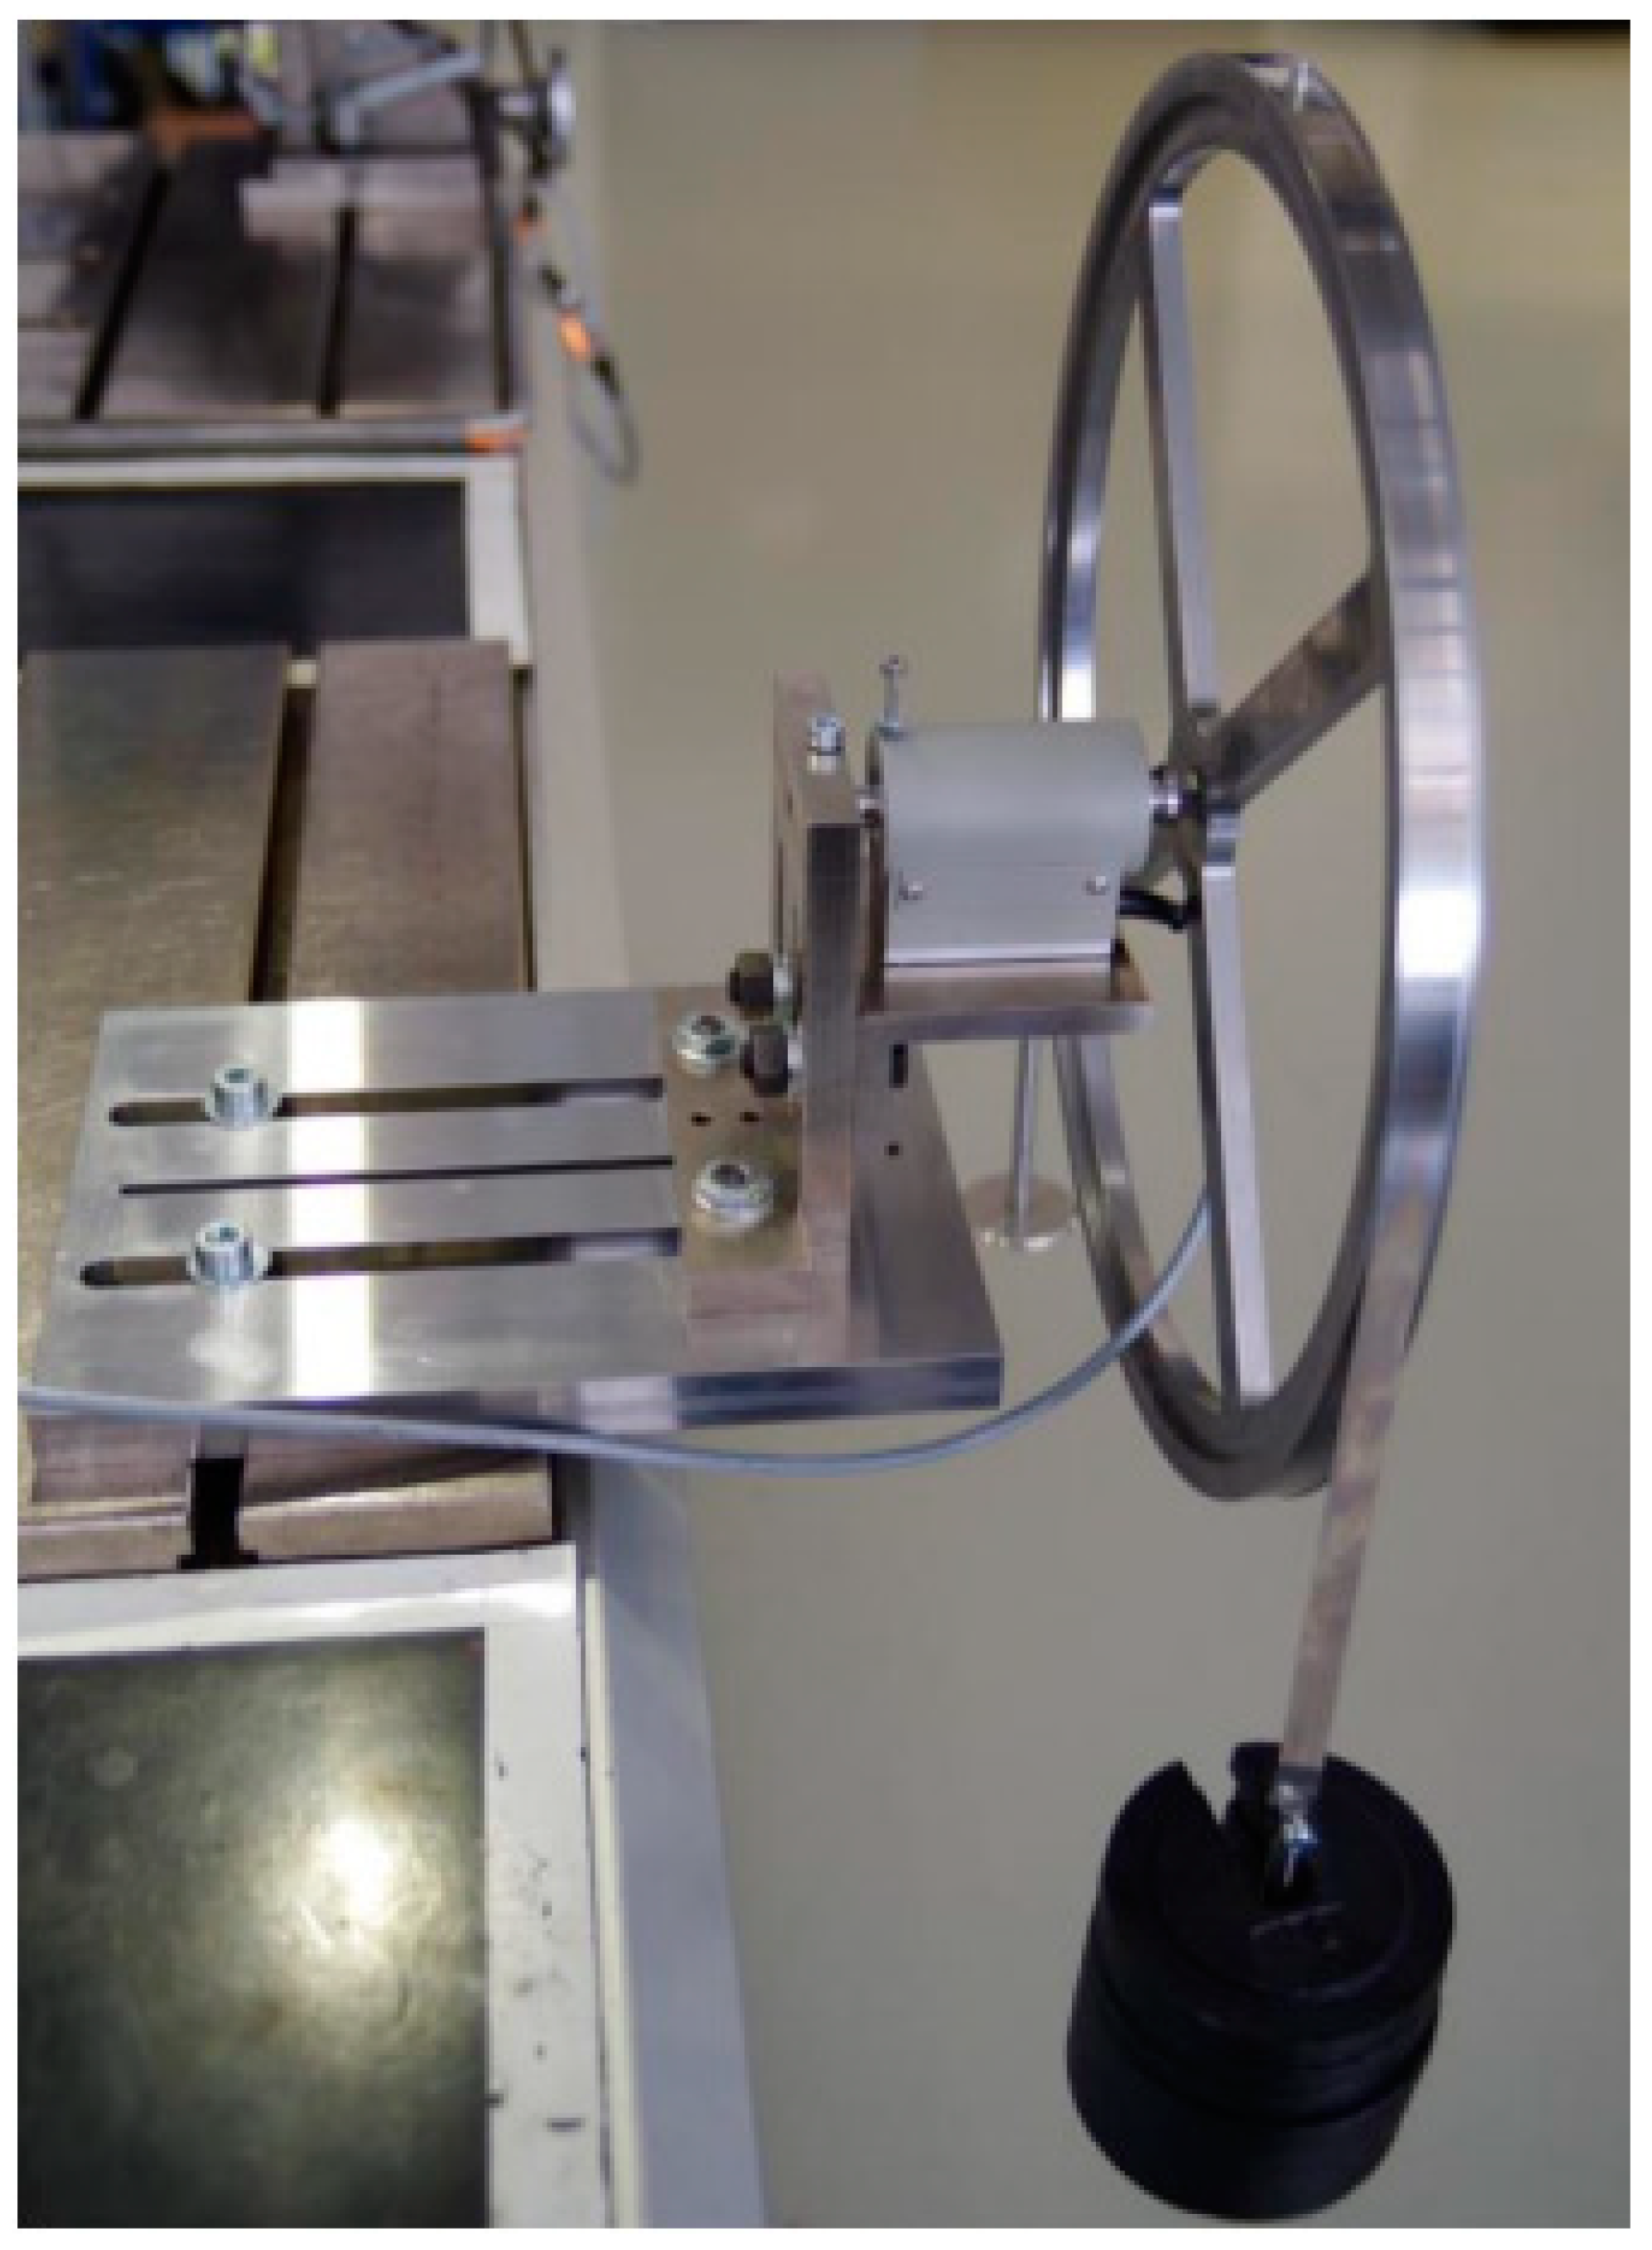
4.4. Design with a Calibration Wheel

In previous designs, errors introduced by friction from rolling bearings, problematic settings of the measuring assembly, and relatively complex construction affected the calibration process; thus, it was necessary to eliminate these influencing factors. For this reason, a design solution was proposed, where a set of calibrated weights was used as a standard and the occurrence of rolling bearings was removed. This design, which is shown in Figure 8, minimized the influence of external factors affecting the calibration results and simplified the construction of the entire device, which resulted in a reduction of the total weight. Significant advantages include easy handling, good securing of the position of the calibration device on the measuring device, and reliable clamping of the sensor in this calibration device. The advantage of this device is that it can be used for all torque sensors used in the measuring laboratory. By using a calibration wheel with a given radius, it was ensured that after the steel strip with the weight carriers was established, the system was able to stabilize itself in an equilibrium position.
This calibration device works on the principle of creating a moment of force according to the following relationship:
M = F · r = m · g · r
where
  • M denotes the force moment [Nm].
  • F denotes the force induced by the calibration weight [N].
  • r denotes the length of the arm on which the force F acts [m].
  • m denotes the weight of the weight [kg].
  • g denotes the local gravity acceleration [m/s2].
The calibration device with a calibration wheel works on the principle of creating a torque M [Nm]. A force F [N] acts on the calibration wheel with the radius r [m] representing the arm. This force F is induced using a set of calibration weights m, whose value is recalculated and determined in newtons based on the local gravity acceleration g [m/s2]. The force, F , induced by means of weights, acts on the arm (radius of the calibration wheel) and creates the required torque, which is necessary for the calibration of the torque sensors. The device is designed in such a way that it is possible to induce a moment of force in both the right and left directions of rotation. When designing the selected device, its load during operation was also taken into account. For this reason, the steel strip was determined as the weakest member of the system. This strip serves as a connecting member between the calibration wheel and the weight carriers and also as a holder for the weight carriers themselves. From this point of view, it was necessary to verify this steel strip for its maximum load. Verification was performed on a Zwick/Roell Z030 test rig. The condition for compliance was that the used steel strip with a thickness of h = 0.07 mm could withstand a load of at least F = 80 N. After the test was completed, it was found that the beginning of the deformation occurred at a force of F = 362.3 N, which in the case of the calibration device is satisfactory. Even a certain degree of oversizing was achieved.
Based on a comparison of the advantages and disadvantages with the previous three proposals of calibration devices, which are listed in Table 4, variant 4 (with a calibration wheel) was shown to be the most suitable solution; therefore, the next part of this paper is devoted to its use for the calibration of the torque sensor.

5. Calculation of the Calibration Device Error

In order to verify the possible error that arose due to the inaccurate production of the calibration wheel and inaccurate production of calibration weights, the theoretical error of the calibration device was calculated. For this reason, it was necessary to find out the manufacturing tolerance of the calibration weights given by the manufacturer and to find out the actual diameter of the calibration wheel. The calculation was based on known tolerance values for calibration weights given by the manufacturer, which are shown in Table 3, and the known value of the local gravitational acceleration, g = 9.80853 m/s2, calculated by the weight manufacturer based on geographical coordinates. An important piece of information was the actual diameter of the calibration wheel, which was found using a 3D scanner, the value of which was ds = 400.1334 mm. Since the value of the weight was given in newtons, it was necessary to calculate the value of the mass of the weight using relation (10), as follows:
m i = F i g i = { 2.5 ;   5 ;   10 ;   50 }
where
  • m i is the mass of the given weight [kg].
  • F i is the value of the given calibration weight [N].
  • g is the local gravitational acceleration [m/s2].
m 2.5 = F i g = 2.5 9.80853 = 0.25488   k
Subsequently, the weight tolerance value is added or subtracted from the weight value according to relation (11), as follows:
m i ± μ = m i ± μ i i = { 2.5 ;   5 ;   10 ;   50 }
where
  • m i ± μ is the mass of the weight increased or reduced by the tolerance value [kg].
  • m i is the value of the mass of the given calibration weight [kg].
  • μ i is the tolerance value for the given weight [kg].
The calculation example for a weight of 2.5 is as follows:
m 2.5 + μ = m 2.5 + μ 2.5 = 0.25488019 + 0.00005 = 0.25488519   kg
m 2.5 μ = m 2.5 μ 2.5 = 0.25488019 0.00005 = 0.25487519   kg
In the next step, the values of the maximum and minimum forces induced by the weight with the given tolerance were calculated according to relation (12), as follows:
F i m a x / m i n = m i ± μ · g i = { 2.5 ;   5 ;   10 ;   50 }
F 2.5 m a x = m 2.5 + μ · g = 0.25488519 · 9.80853 = 2.50004903   N
F 2.5 m a x = m 2.5 μ · g = 0.25487519 · 9.80853 = 2.49995095   N
The values for other calibration weights were calculated in the same way and the results are shown in Table 5.
Since the actual diameter of the calibration wheel detected by the 3D scanner, which measures with an uncertainty of U = ±1.2 μm, is ds = 400.1334 mm, it was necessary to add or subtract this uncertainty from the actual value of the diameter of the calibration wheel according to relation (13):
d s ± U = d s ± U
where
  • d s ± U is the actual diameter of the calibration wheel enlarged or reduced by the uncertainty of the 3D scanner [m].
  • d s is the actual diameter of the calibration wheel [m].
  • U is the uncertainty of the 3D scanner [m].
d s + U = d s + U = 0.4001334 + 0.0000012 = 0.4001346   m
d s U = d s U = 0.4001334 0.0000012 = 0.4001322   m
Subsequently, the actual maximum and minimum values of the radius of the calibration wheel could be calculated, where half the thickness of the steel strip with a thickness of hp = 0.07 mm was added. This radius was calculated using relation (14), as follows:
r m a x / m i n = d s ± U 2 + h p / 2
where
  • r m a x / m i n is the maximum or minimum radius of the calibration wheel [m].
  • d s ± U is the actual diameter of the calibration wheel enlarged or reduced by the uncertainty of the 3D scanner [m].
  • h p / 2 is half the thickness of the steel strip [m].
r m a x = d s + U 2 + h p / 2 = 0.4001346 2 + 0.000035 = 0.2001023   m
r m a x = d s U 2 + h p / 2 = 0.4001322 2 + 0.000035 = 0.2001011   m
After finding the actual maximum and minimum radii of the calibration wheel, the maximum and minimum values of the torque induced by the force of the weight on the given arm could be calculated according to relations (15) and (16):
M i m a x = F i m a x · r m a x i = { 2.5 ;   5 ;   10 ;   50 }
M i m i n = F i m i n · r m i n i = { 2.5 ;   5 ;   10 ;   50 }
where
  • M i m a x / m i n is the maximum or minimum value of the torque induced by the given weight [Nm].
  • F i m a x / m i n is the maximum or minimum value of the calibration weight [N].
  • r m a x / m i n is the maximum or minimum value of the radius of the calibration wheel [m].
M 2.5 m a x = F 2.5 m a x · r m a x = 2.50004903 · 0.2001023 = 0.50026556   m
M 2.5 m i n = F 2.5 m i n · r m a x = 2.49995095 · 0.2001011 = 0.50024294   m
The calculation procedure for other calibration weights is the same as in the previous calculation and the results are shown in Table 6.
During calibration, the required torque values were achieved by combining calibration weights. Therefore, it was necessary to calculate the tolerance for each torque value (MM = 0.5, 1, 2, 3, 4, 5, 6, 7, 8, 9, 10, 15) depending on the weight combination used. In this calculation, the law of propagation of uncertainties was applied, and the maximum and minimum tolerance values were calculated according to relations (17) and (18):
σ M m a x = i M i m a x 2 i = { 2.5 ;   5 ;   10 ;   50 }
σ M m i n = i M i m i n 2 i = { 2.5 ;   5 ;   10 ;   50 }
where
  • σ M m a x / m i n is the sum of the maximum or minimum torque value induced for a given combination of calibration weights [Nm].
  • M i m a x / m i n is the maximum or minimum torque value induced by the given weight [Nm].
σ 0.5 m a x = 2.5 M 2.5 m a x 2 = 2.5 0.50026556 2
σ 0.5 m i n = 2.5 M 2.5 m i n 2 = 2.5 0.50024294 2
All the results of the maximum and minimum torque tolerance values for the given combinations of the calibrated weight are shown in Table 7.
From these values, the range of changes in determined according was determined according to relation (19):
± z M m a x = σ M m a x σ M m i n M = 0.5 ;   1 ;   2 ;   3 ;   4 ;   5 ;   6 ;   7 ;   8 ;   9 ;   10 ;   15
where
  • ± z M m a x is the range of deviations from the nominal value [Nm].
  • M m a x is the sum of maximum torque values for a given combination of calibration weights [Nm].
  • M m i n is the sum of the minimum torque values for the given combination of calibration weights [Nm].
The results of the z M m a x calculations are shown in Table 8.
± z 0.5 m a x = σ 0.5 m a x σ 0.5 m i n = 0.50026556 0.5024294 = 0.00002262   Nm
From the calculated results, the value z M m a x = ± z M m a x 2 necessary for the subsequent calculation of the standard uncertainty of the considered source uBz was subsequently determined according to relation (20), as follows:
u B z M = z M m a x k M = 0.5 ;   1 ;   2 ;   3 ;   4 ;   5 ;   6 ;   7 ;   8 ;   9 ;   10 ;   15
where
  • u B z M is the standard uncertainty of the considered source [Nm].
  • z M m a x is the range of deviations from the nominal value of torque [Nm].
  • k is the value of the chosen approximation of the probability distribution, while for this type of approximation of the distribution, the uniform distribution k = 3 was chosen.
u B z M = z 0.5 m a x k = 0.00001131 3 = 0.0000065298   [ Nm ]
The calculations for other required torque values are similar. The calculation results are shown in Table 9.
Theoretical calculations revealed that the largest theoretical error reaches a standard uncertainty of u B z 15 = 0.000077235 Nm. This verified that the error introduced by the calibration due to the imprecise production of the calibrated weight and the imprecise production of the calibration wheel will only minimally affect the measured values during calibration. This statement is based on the fact that the values measured during calibration are measured to three decimal places, i.e., thousandths, and the largest theoretical error affects the measurement only in the fourth decimal place, i.e., ten-thousandths.

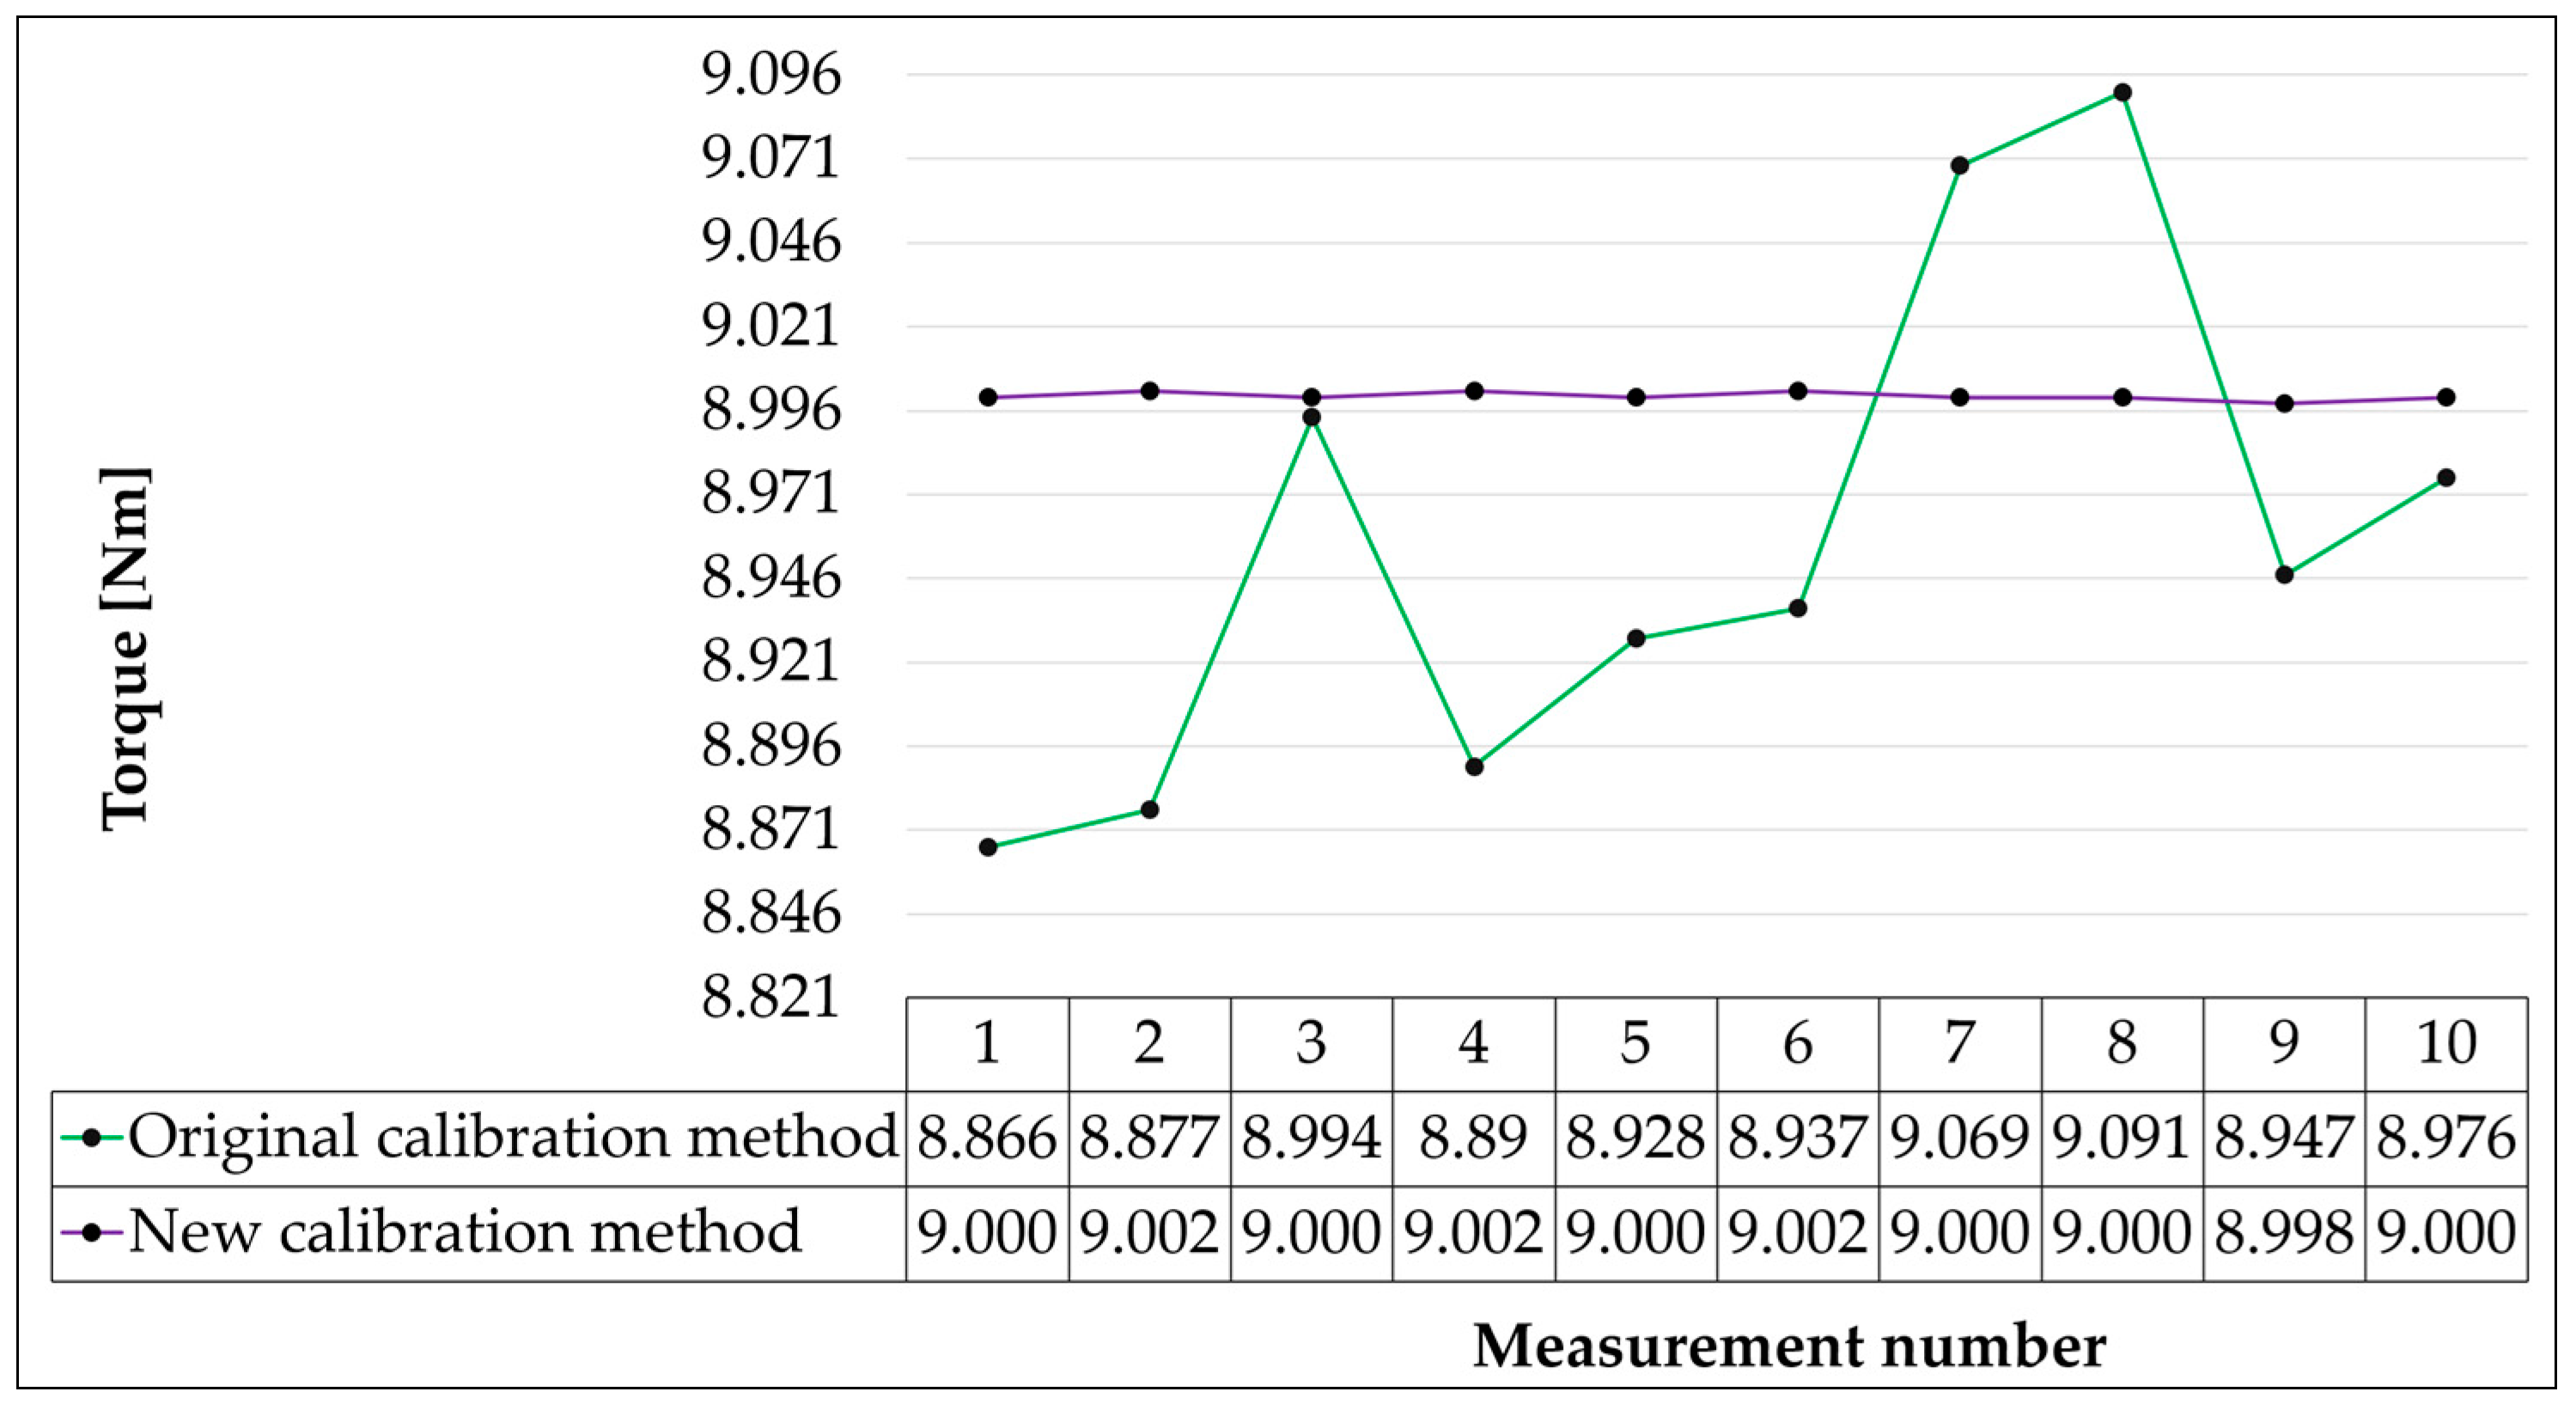
6. Calibration Measurements That Were Performed

After the theoretical calculations, calibration measurements were performed with the given calibration device (Figure 9). The torque sensor pulled from the measuring chain was inserted into the prepared calibration device together with the calibration wheel and weight carriers. After running the calibration program on the measuring computer, the sensor was loaded three times to its maximum value in the calibrated direction using a set of calibrated weights to ensure its mobility throughout the measurement range. Calibration was performed gradually from the smallest required value by a suitable combination of calibration weights that were added to the weight carrier. A torque was created on the arm of the calibration wheel, which was subsequently compared with the value displayed by the program on the measuring device. Calibration consisted of loading the sensor to preselected values with ten consecutive repetitions. Figure 10, Figure 11, Figure 12, Figure 13, Figure 14, Figure 15 and Figure 16 show the measured values for a torque of 1–5, 7 and 9 Nm.
During calibration, the measured values were read from the display of the measuring device to which the calibrated sensor was connected. The settings of the given measuring device made it possible to display the measured values in three decimal places.
After finishing the measurement by this method, the analysis of the measurement was carried out and the measurement was carried out with the original calibration device (Figure 17) using the standard torque sensor loaded by means of a lever. In this type of calibration, a Lorenz DR-12 torque sensor with a measuring range of ±25 Nm and an accuracy class of 0.1 was used as the standard. By carrying out both compared calibration measurements in a short time span, the same conditions were ensured for both measurements.

7. Discussion

As can be seen from Figure 10, Figure 11, Figure 12, Figure 13, Figure 14, Figure 15 and Figure 16, the original calibration method worked with relatively large differences between the measured values. The smallest differences were measured in the case of a required torque value of 4 Nm. The difference between the maximum and minimum deviation from the desired value was 0.076 Nm. On the contrary, the values at the required torque values of 2 and 9 Nm represented the largest differences, where the maximum and minimum torque values were 0.212 and 0.225 Nm. The distribution of the measured values in relation to the desired value also played a significant role. While in calibration values at 2, 3, 7, and 9 Nm, the measured values oscillated around the required torque values; with calibration at 1 Nm, almost all measured values were above the required value, and in the case of calibration at 4 and 5 Nm, all measured values were below the required value of the torque. The variance values of the measured torque values reached a maximum in the case of calibration at 9 Nm (0.00527 Nm) and a minimum in the case of calibration at 4 Nm (0.00059 Nm). On average, the variance of the original calibration method was 0.00275 Nm.
The new calibration method proved to be much more accurate. The differences between the maximum and minimum deviations of the measured values from the desired value were only from 0.004 to 0.007 Nm, with the highest differences found with calibration at torque 1 (0.006 Nm) and 2 Nm (0.007 Nm) and the smallest difference of 0.004 Nm in the remaining measurement moments. The variance values for the new method were very small; they ranged from 1.16 × 10⁻⁶ when calibrated to 7 Nm and to 3.56 × 10⁻⁶ when calibrated to 1 Nm. It can be seen from this that the measured values were very close to the required values and showed a high measurement stability.
The proposed new torque sensor calibration method has positively contributed to the accuracy of torque sensor calibration, which will significantly increase the reliability and accuracy of measuring the residual torque of automobile brakes. Due to the method’s simplicity, it can also be used when calibrating other torque sensors used for various purposes, of course when checking the stability of the calibration wheel strip for the expected load.

8. Conclusions

The studies showed a significant difference in the accuracy of the original calibration method compared to the new method.
Similarly, different accuracy values were measured for other verified torque values. It can be said that the new calibration device has increased the accuracy of the measuring device, which makes it possible to record even tiny values of the residual torque and enables even better detection of the causes of its occurrence. During the analysis of the original method, several factors were found that affected the results and accuracy of the calibration, namely the following:
  • The necessity of exactly setting the torque sensor and the standard on “one axis” and maintaining the stability of this position.
  • Ensuring the temperature stability of the measuring device.
  • Selecting a suitable accuracy class for the reference sensor.
The new method simplified the operation and reduced the number of people required during calibration from two to one; thus, the efficiency of the calibration increased, and the measurement time was shortened.

Author Contributions

Conceptualization, D.B., S.K., J.D., and A.D.; methodology, D.B., S.K., J.D., and A.D.; formal analysis, D.B., S.K., J.D., and A.D.; investigation, D.B., S.K., J.D., and A.D.; data curation, D.B., S.K., J.D., and A.D.; writing—original draft preparation, D.B., S.K., J.D., and A.D.; writing—review and editing, D.B., S.K., J.D., and A.D.; visualization, D.B., S.K., J.D., and A.D. All authors have read and agreed to the published version of the manuscript.

Funding

This research received no external funding.

Institutional Review Board Statement

Not applicable.

Informed Consent Statement

Not applicable.

Data Availability Statement

The original contributions presented in the study are included in the article, further inquiries can be directed to the corresponding author.

Acknowledgments

This publication was supported by the Cultural and Educational Grant Agency of the Ministry of Education of the Slovak Republic within the project KEGA 031ŽU-4/2023: Development of key competencies of the graduate of the study program Vehicles and Engines.

Conflicts of Interest

The authors declare no conflict of interest.

References

  1. Songkitti, W.; Wirojsakunchai, E.; Aroonsrisopon, T. Identifying Factors that Affect Brake Wear PM Emissions during Real-World Test Conditions; SAE Technical Paper; SAE International: Pittsburgh, PA, USA, 2022; p. 2022-01-0570. [Google Scholar] [CrossRef]
  2. Amato, F. Non-Exhaust Emissions: An Urban Air Quality Problem for Public Health; Impact and Mitigation Measures, 1st ed.; Academic Press: Cambridge, MA, USA, 2018. [Google Scholar]
  3. Grigoratos, T.; Martini, G. Brake wear particle emissions: A review. Environ. Sci. Pollut. Res. Int. 2015, 22, 2491–2504. [Google Scholar] [CrossRef] [PubMed]
  4. Harrison, R.M.; Jones, A.M.; Gietl, J.; Yin, J.; Green, D.C. Estimation of the contributions of brake dust, tire wear, and resuspension to nonexhaust traffic particles derived from atmospheric measurement. Environ. Sci. Technol. 2012, 46, 6523–6529. [Google Scholar] [CrossRef] [PubMed]
  5. Thorpe, A.; Harrison, R.M. Sources and properties of non-exhaust particulate matter from road traffic: A review. Sci. Total Environ. 2008, 400, 270–282. [Google Scholar] [CrossRef]
  6. Wahid, S.M.S. Automotive brake wear: A review. Environ. Sci. Pollut. Res. Int. 2018, 25, 174–180. [Google Scholar] [CrossRef]
  7. Timmers, V.R.J.H.; Achten, P.A.J. Non-exhaust PM emissions from electric vehicles. Atmos. Environ. 2016, 134, 10–17. [Google Scholar] [CrossRef]
  8. Beddows, D.C.S.; Harrison, R.M. PM10 and PM2.5 emission factors for non-exhaust particles from road vehicles: Dependence upon vehicle mass and implications for battery electric vehicles. Atmos. Environ. 2021, 244, 117886. [Google Scholar] [CrossRef]
  9. Jiang, R.; Liu, Y.; Hu, D.; Zhu, L. Exhaust and non-exhaust airborne particles from diesel and electric buses in Xi’an: A comparative analysis. Chemosphere 2022, 306, 135523. [Google Scholar] [CrossRef]
  10. Woo, S.-H.; Jang, H.; Lee, S.-B.; Lee, S. Comparison of total PM emissions emitted from electric and internal combustion engine vehicles: An experimental analysis. Sci. Total Environ. 2022, 842, 156961. [Google Scholar] [CrossRef]
  11. Gramstat, S.; Mertens, T.; Waninger, R.; Lugovyy, D. Impacts on brake particle emission testing. Atmosphere 2020, 11, 1132. [Google Scholar] [CrossRef]
  12. Kozuch, P.; Hujo, L.; Kaszkowiak, J.; Markiewicz-Patalon, M. Evaluation of service brake braking of selected group of vehicles depending on wear of brake system’s parts. Acta Technol. Agric. 2024, 27, 101–107. [Google Scholar] [CrossRef]
  13. Zhong, C.; Sun, J.; Liu, Z.; Niu, H.; Zhang, J.; Liang, X.; Yin, J.; Wu, L.; Peng, J.; Zhang, Q.; et al. Size distribution of brake wear particulate matter based on a brake dynamometer investigation. Front. Future Transp. 2024, 5, 1407660. [Google Scholar] [CrossRef]
  14. Mathissen, M.; Grochowicz, J.; Schmidt, C.; Vogt, R.; Hagen, F.H.F.; Grabiec, T.; Steven, H.; Grigoratos, T. A novel real-world braking cycle for studying brake wear particle emissions. Wear 2018, 414–415, 219–226. [Google Scholar] [CrossRef]
  15. Kukutschová, J.; Moravec, P.; Tomásek, V.; Matejka, V.; Smolík, J.; Schwarz, J.; Seidlerová, J.; Safárová, K.; Filip, P. On airborne nano/micro-sized wear particles released from low-metallic automotive brakes. Environ. Pollut. 2011, 159, 998–1006. [Google Scholar] [CrossRef] [PubMed]
  16. Straffelini, G.; Gialanella, S. Airborne particulate matter from brake systems: An assessment of the relevant tribological formation mechanisms. Wear 2021, 478–479, 203883. [Google Scholar] [CrossRef]
  17. Kozuch, P.; Hujo, L.; Muślewski, L.; Markiewicz-Patalon, M. Dynamic and stationary testing of vehicle braking systems. Acta Technol. Agric. 2023, 26, 238–243. [Google Scholar] [CrossRef]
  18. Otto, J.; Ostermeyer, G.P. High-frequency vibrations in the contact of brake systems. Facta Univ.-Ser. Mech. Eng. 2019, 17, 103. [Google Scholar] [CrossRef]
  19. Koch, S.; Gödecker, H.; von Wagner, U. On the interrelation of equilibrium positions and work of friction forces on brake squeal. Arch. Appl. Mech. 2022, 92, 771–784. [Google Scholar] [CrossRef]
  20. Koch, S.; Köppen, E.; Gräbner, N.; von Wagner, U. On the influence of multiple equilibrium positions on brake noise. Facta Univ.-Ser. Mech. Eng. 2021, 19, 613–632. [Google Scholar] [CrossRef]
  21. Kim, Y.; Kwon, T.; Lee, S. Analysis of the effect of the wedged type brake caliper piston on brake drag. In Proceedings of the 39th Annual Brake Colloquium and Exhibition, BRAKE 2021, Virtual Event, 17–20 October 2021. [Google Scholar] [CrossRef]
  22. Mohan, S.; Dake, P.; Mullapudi, D.; Ingole, S. A method to capture and analyze brake dynamic drag. In Proceedings of the 17th Symposium on International Automotive Technology, SIAT 2021, Virtual Event, 29 September–1 October 2021. [Google Scholar] [CrossRef]
  23. Synák, F.; Rievaj, V.; Kucera, M.; Sebök, M.; Skrúcany, T. Effect of repeated vehicle braking on the warming of selected parts of the vehicle. Sci. J. Silesian Univ. Technol.-Ser. Transp. 2020, 107, 183–196. [Google Scholar] [CrossRef]
  24. Vecchiato, L.; Vecchiato, L.; Negri, M.; Picci, G.; Viale, L.; Zaltron, G.; Giacometti, S.; Meneghetti, G. Design and development of a brake test bench for formula SAE Race Cars. Machines 2024, 12, 135. [Google Scholar] [CrossRef]
  25. Dixit, C.; Gaurkar, P.; Ramakrishnan, R.; Shankar Ram, C.S.; Vivekanandan, G.; Sivaram, S. Calibration of an inertial measurement unit and its impact on antilock braking system performance. In Proceedings of the 18th Symposium on International Automotive Technology, SIAT 2024, Pune, India, 23–25 January 2024. [Google Scholar] [CrossRef]
  26. Tawadros, P.; Awadallah, M.; Walker, P.; Zhang, N. Using a low-cost bluetooth torque sensor for vehicle jerk and transient torque measurement. Proc. Inst. Mech. Eng. Part D-J. Automob. Eng. 2020, 234, 095440701986161. [Google Scholar] [CrossRef]
  27. Zhang, C.; Li, Z.P.; Chen, J.; Qiu, F.; Na, S.D. Design and research of a novel non-contact vertical inductive torque sensor. Measurements 2021, 177, 109252. [Google Scholar] [CrossRef]
  28. De Carvalho Pinheiro, H.; Sisca, L.; Carello, M.; Ferraris, A.; Airale, A.G.; Falossi, M.; Carlevaris, A. methodology and application on LOAD monitoring using strain-gauged bolts in brake calipers. In Proceedings of the SAE 2022 Annual World Congress Experience, WCX 2022, Virtual Event, 5–7 April 2022. [Google Scholar] [CrossRef]
  29. Wheatley, G.; Rubel, R.I. An autonomous braking control system for a 2017 Yamaha Grizzly 700. Sci. J. Silesian Univ. Technol.-Ser. Transp. 2022, 115, 211–226. [Google Scholar] [CrossRef]
  30. Jneid, M.S.; Harth, P. Integrated torque vectoring control using vehicle yaw rate and sideslip angle for improving steering and stability of all off wheel-motor drive electric vehicles. Acta Polytech. Hung. 2024, 21, 87–106. [Google Scholar] [CrossRef]
  31. Ishak, M.R.; Abu Bakar, A.R.; Belhocine, A.; Taib, J.M.; Omar, W.Z.W. Brake torque analysis of fully mechanical parking brake system: Theoretical and experimental approach. Measurements 2016, 64, 487–497. [Google Scholar] [CrossRef]
  32. Panchenko, S.; Gerlici, J.; Vatulia, G.; Lovska, A.; Ravlyuk, V.; Harusinec, J. Studying the load of composite brake pads under high-temperature impact from the rolling surface of wheels. EUREKA Phys. Eng. 2023, 2023, 155–167. [Google Scholar] [CrossRef]
  33. Panchenko, S.; Gerlici, J.; Lovska, A.; Vatulia, G.; Ravlyuk, V.; Rybin, A. Method for Determining the Factor of Dual Wedge-Shaped Wear of Composite Brake Pads for Freight Wagons. Commun.-Sci. Lett. Univ. Zilina 2024, 26, B31–B40. [Google Scholar] [CrossRef]
  34. Panchenko, S.; Gerlici, J.; Lovska, A.; Ravlyuk, V. The Service Life Prediction for Brake Pads of Freight Wagons. Commun.-Sci. Lett. Univ. Zilina 2024, 26, B80–B89. [Google Scholar] [CrossRef]
  35. Hu, C.; Pan, G.; Kong, L.; Yu, J. Research of brake by wire system. J. Phys.-Conf. Ser. 2023, 2479, 012051. [Google Scholar] [CrossRef]
  36. Testbook. 2023. Available online: https://testbook.com/mechanical-engineering/drum-brakes-vs-disc-brakes (accessed on 21 August 2024).
  37. Zhou, X.; Wu, G.; Wang, C.; Zhang, R.; Shi, S.; Zhao, W. Cooperative optimization of energy recovery and braking feel based on vehicle speed prediction under downshifting conditions. Energy 2024, 301, 131699. [Google Scholar] [CrossRef]
  38. Li, W.; Zheng, H.Y.; Zong, C.F. A brake pad wear control algorithm for electronic brake system. Adv. Mater. Res. 2013, 694–697, 2099–2105. [Google Scholar] [CrossRef]
  39. Gerlici, J.; Kravchenko, K.; Fomina, Y. Development of an innovative technical solution to improve the efficiency of rolling stock friction brake elements operation. In Transbaltica XII: Transportation Science and Technology; Springer: Berlin/Heidelberg, Germany, 2022; pp. 28–38. [Google Scholar]
  40. Ledbestov. 2020. Available online: https://ledbestov.live/product_details/9746208.html (accessed on 5 May 2024).
  41. SAE. 2024. Available online: https://www.sae.org/news/2023/05/brakes-sustainability-dust-regulations (accessed on 21 August 2024).
  42. ACEA. 2023. Available online: https://www.acea.auto/fact/euro-standards/ (accessed on 21 August 2024).
  43. Dieselnet. 2024. Available online: https://dieselnet.com/standards/eu/ld.php (accessed on 21 August 2024).
  44. NOTA, S. Design of a Device for Calibration Torque Sensor for Measuring Residual Brake Moment. Master’s Thesis, University of Žilina, Žilina, Slovensko, 2019. [Google Scholar]
  45. HBM. 2019. Available online: https://www.sensor-hbm.com/upload/product-file/b0591.pdf (accessed on 18 May 2024).
Figure 1. Disc brake with a fixed caliper [40].
Applsci 14 07927 g001
Figure 2. Measuring chain for the measurement of residual torque.
Applsci 14 07927 g002
Figure 3. Torque sensor T4A from HBM.
Applsci 14 07927 g003
Figure 4. Design of a calibration device with a threaded rod.
Applsci 14 07927 g004
Figure 5. A scheme of a screw joint.
Applsci 14 07927 g005
Figure 6. Design of a calibration device with an angular gearbox.
Applsci 14 07927 g006
Figure 7. Design of the calibration device with weight carriers.
Applsci 14 07927 g007
Figure 8. Design of a calibration device with a calibration wheel.
Applsci 14 07927 g008
Figure 9. Calibration device with weights and the calibrated torque sensor.
Applsci 14 07927 g009
Figure 10. Graph of measured values for the required torque value of 1 Nm.
Applsci 14 07927 g010
Figure 11. Graph of measured values for the required torque value of 2 Nm.
Applsci 14 07927 g011
Figure 12. Graph of measured values for the required torque value of 3 Nm.
Applsci 14 07927 g012
Figure 13. Graph of measured values for the required torque value of 4 Nm.
Applsci 14 07927 g013
Figure 14. Graph of measured values for the required torque value of 5 Nm.
Applsci 14 07927 g014
Figure 15. Graph of measured values for the required torque value of 7 Nm.
Applsci 14 07927 g015
Figure 16. Graph of measured values for the required torque value of 9 Nm.
Applsci 14 07927 g016
Figure 17. Scheme of the original calibration device.
Applsci 14 07927 g017
Table 1. The advantages and disadvantages of drum brakes and disc brakes [36].
AspectDrum BrakesDisc Brakes
DesignEnclosed design with brake shoes inside a drumOpen design with brake pads gripping a rotor
Heat dissipationLess efficient heat dissipationMore efficient heat dissipation
CoolingLimited cooling due to enclosed designBetter cooling due to open design
Brake fadeMore susceptible to brake fadeLess susceptible to brake fade
Stopping distancesGenerally longer stopping distancesShorter stopping distances
MaintenanceRequire periodic adjustments for optimal performanceRequire less maintenance and adjustments
NoiseProduce less noise during brakingCan produce more noise during braking
CorrosionGenerally less susceptible to corrosionMore susceptible to corrosion in rotor and caliper
Brake dustGenerate less brake dustGenerate more brake dust
Complex componentsSimpler design with fewer componentsMore complex with calipers, pistons, and rotors
Typically more affordableGenerally more expensive
Parking brakeIntegrated parking brake mechanismParking brake functionality may vary
WeightHeavier compared to disc brakesLighter compared to drum brakes
Table 2. The advantages and disadvantages of disc brakes.
Type of BrakeAdvantagesDisadvantages
Disc brake with a floating caliperBetter heat dissipation,
smaller built-in dimensions,
lower weight,
Uneven-wear brake pads;
option to use (at most) two
brake pistons
Disc brake with a fixed caliperlower residual torque
Possibility of using several brake pistons;
stronger construction
Higher weight,
larger dimensions
Table 3. Development of emission standards [41,42,43].
StandardEURO 1EURO 2EURO 3EURO 4EURO 5EURO 6EURO 7
Valid fromJuly 1992January 1996January 2000January 2005September 2009September 2014November 2026
CO [g/km]
Petrol diesel
2.72
2.72
1.0
2.2
0.64
2.3
0.5
1.0
0.5
1.0
0.5
1.0
0.5
1.0
PM [g/km]
Diesel eng.
0.140.08–0.10.050.0250.0050.00450.0045
PM [g/km]
Petrol eng.
----0.005 *0.0045 *0.0045
PM [g/km]
Brakes, tires
------0.003 EL
0.007 CE,
0.007 HY
* only for direct injection engines. EL—electric cars, CE—cars with combustion engines, HY—hybrid cars.
Table 4. Comparison of designed calibration devices.
Variant of Calibration DeviceAdvantagesDisadvantages
1. Threaded rodThe possibility of simple clamping on the measuring table.More time-consuming setting of the torque value using a threaded rod and it was problematic to set the torque sensor with the standard on one axis. Bearings that would cause resistance during calibration.
2. Angular gearboxEasier and faster setting of the torque value, which could be set in both directions of rotation.Problematic axial adjustment of the torque sensor to the standard and the introduction of errors due to the effect of rolling bearings. Higher mass and size due to the gearbox.
3. Weight carriersSimpler and lighter construction.There is an imperfect alignment of the system caused by friction between the arm and the weight carriers. There remains a problem with the axial adjustment of the torque sensor to the standard and with errors caused by the rolling of bearings.
4. Calibration wheelEliminated errors due to friction from rolling bearings, problematic adjustment of the measuring assembly, and relatively massive construction. Easy handling and good positioning of the calibration device on the measuring device. The universality of using the calibration device for various measuring devices of the laboratory. The system can stabilize itself into an equilibrium position.A need to adapt the thickness of the steel strip to the load.
Table 5. Table of calculated values.
Weight Value [N]Max. Mass Value [kg] Max. Weight Value [N]Min. Mass Value [kg]Min. Weight Value [N]
2.50.254885192.500049030.254875192.49995095
50.509765385.000049020.509755384.99995094
101.0195307610.000098051.019510769.99990187
505.0976538250.000490425.0975538249.99950957
Table 6. Calculated values of maximum and minimum torque values.
Calibrated Weight Value [N]Value of Torque M [Nm]Min. Value of Torque M i m a x [Nm]Max. Value of Torque M i m i n [Nm]
2.50.50.500242940.50026556
511.000495681.00052131
1022.000991362.00104262
501010.0049568610.00521313
Table 7. Maximum and minimum torque tolerance values.
Required Torque Value [Nm]Calibrated Weight Value [N]Combination of WeightsMaximum Torque Tolerance σMmax [Nm]Minimum Torque Tolerance σMmin [Nm]
0.52.51 × 2.5N0.500265560.50024294
151 × 5N1.000521311.00049568
2101 × 10N2.001042622.00099136
3151 × 10N + 1 × 5N2.237233662.23717635
4202 × 10N2.829901612.82982912
5252 × 10N + 1 × 5N3.001563933.00148704
7353 × 10N + 1 × 5N3.607430893.60733847
9454 × 10N + 1 × 5N4.125255044.12514937
10501 × 50N10.0052131310.00495686
15751 × 50N + 2 × 10N + 1 × 5N10.4457491710.44548162
Table 8. Calculated values of the range of deviation changes.
Required Torque Value [Nm]Calibrated Weight Value [N]The Range of Deviation Changes ± z M m a x [Nm] z M m a x [Nm]
0.52.50.000022620.000011310
150.000025630.000012815
2100.000051260.000025630
3150.000057310.000028655
4200.000072490.000036245
5250.000076890.000038445
7350.000092420.000046210
9450.000105670.000052835
10500.000256270.000128135
15750.000267550.000133775
Table 9. Calculated values of the standard uncertainty of the considered source.
Required Torque Value [Nm]Calibrated Weight Value [N]Standard Uncertainty of the Considered Source [Nm]
0.52.50.0000065298
150.0000073987
2100.0000147975
3150.0000165439
4200.0000209261
5250.0000221962
7350.0000266793
9450.0000305043
10500.0000739788
15750.000077235
Disclaimer/Publisher’s Note: The statements, opinions and data contained in all publications are solely those of the individual author(s) and contributor(s) and not of MDPI and/or the editor(s). MDPI and/or the editor(s) disclaim responsibility for any injury to people or property resulting from any ideas, methods, instructions or products referred to in the content.

