Article

Assessment of Fatigue Crack Growth Characteristics of Laminated Biaxial/Triaxial Hybrid Composite in Wind Turbine Blades

1
The Innovation Research Center for Giant Wind Turbine System, Kunsan National University, Gunsan-si 54150, Republic of Korea
2
Department of Mechanical Engineering, Kunsan National University, Gunsan-si 54150, Republic of Korea
*
Author to whom correspondence should be addressed.
Appl. Sci. 2024, 14(17), 7929; https://doi.org/10.3390/app14177929
Submission received: 28 May 2024 / Revised: 9 August 2024 / Accepted: 17 August 2024 / Published: 5 September 2024
(This article belongs to the Section Materials Science and Engineering)

Abstract

:
The composite blade is integral to megawatt-class wind turbines and frequently incurs interlaminar damages such as adhesive failures, cracks, and fractures, which may originate from manufacturing flaws or sustained external fatigue loads. Notably, adhesive joint failure in the spar–web and trailing edge (TE) represents a predominant damage mode. This study systematically explores the failure mechanism in these regions, using mode I fracture toughness tests for an in-depth, quantitative analysis of the adhesive joint’s fatigue crack growth characteristics. Additionally, we conducted extensive material and technical evaluations on specimen units, aiming to validate the reliability of techniques employed for wind blade damage modeling. A damage model, inspired by the NREL 5 MW wind generator’s composite blade structure, meticulously considers the interactions between the TE and spar–web. Utilizing the virtual crack closure technique (VCCT), this model effectively simulates crack growth dynamics in wind blade adhesive joints, while the extended finite element method (XFEM) aids in analyzing crack propagation trajectories under repetitive fatigue loading. By applying this integrated methodology, we successfully determined the lifespan of the spar–web adhesive joint under constant load amplitudes, providing crucial insights into the resilience and longevity of critical wind turbine components.

1. Introduction

Composite blades are engineered for a lifespan exceeding 25 years and often fail prematurely during operation. Addressing this issue necessitates a methodology to elucidate and monitor the progression of debonding damage in the adhesive joint area, a critical defect in blades. This approach should identify the specific failure mechanisms. Wind turbine composite blades, in particular, incorporate uniaxial, biaxial, and triaxial composite materials in their upper and lower skins and shear webs to balance lightness and load-bearing capacity, thereby enhancing structural performance. The performance of these hybrid composites varies, as they are tailored to offset the limitations of each laminated composite’s properties [1,2]. The design strategy evaluates the mechanical properties of each material, but the failure characteristics of hybrid composites may differ from single materials [3].
Recent research has focused on the occurrence and progression of debonding damage. Eder et al. [4] identified cracks in the trailing edge (TE) through specimen tests and theoretical analysis. Othman et al. [5] and Robert et al. [6] offered methods for detecting and assessing internal debonding and delamination in wind blades. Notably, Hasan et al. [7] conducted debonding analyses for wind blade T-Joints, and Ji et al. [8] devised a failure dynamics method for joint damage, using cohesive zone modeling (CZM) for the spar–web joint and mode II sliding mode test data. However, the TE and leading edge (LE) adhesive joints, vital for bonding suction and pressure sections, also present vulnerabilities [9,10,11,12], underscoring the need for their examination in prior studies. Accurate evaluation and prediction of blade joint debonding damage necessitate comprehensive test data for mode I (double cantilever beam, DCB), mode II (end-notched flexure, ENF), and mixed mode (mixed mode bending, MMB), along with the validation of material properties based on these testing techniques [13,14,15].
Debonding damage in wind turbine blades’ adhesive joints arises from external loads, necessitating a thorough examination of the loads impacting the turbine. Wind conditions and environmental factors contribute to operational loads, subjecting the blades to combined stresses. Studies indicate that these combined loads significantly compromise blade structural integrity more than unidirectional loading [16]. Therefore, analyzing debonding damage under these combined load conditions is essential.
Adhesive joint modeling in wind turbine blades offers an efficient method for failure mechanism analysis, yet it often relies on predefined assumptions about damage mechanisms. For instance, Shokrieh and Raffiee [17] applied a cumulative fatigue damage model to simulate blade fatigue damage. They first conducted static analysis to pinpoint risk positions, particularly on the upper flange of the blade support unit, followed by fatigue crack growth analysis at these critical points. Similarly, Raman et al. [18] undertook a numerical analysis of blades under static bending and torsional loads to identify stress-prone areas, revealing the root section and TE as particularly vulnerable. Various analytical methods and accident reports underscore the need for a comprehensive understanding of factors influencing blade damage, including operational conditions, location, weather, and manufacturing processes. However, such analyses often overlook discrepancies between design and operational conditions. Notably, the state of blades that are 10, 15, or 20 years old differs significantly from those produced currently in terms of materials, quality control, technology, and size.
Full-scale testing of wind turbine blades in a laboratory during the design phase is typically feasible only for smaller turbines and does not accurately reflect real-world operating conditions. This approach also incurs significant expenses due to the use of laboratory-fabricated materials and structures, which may exhibit different or fewer manufacturing defects compared to those deployed in the field. The physical finite element model, adaptable to various conditions, offers high efficiency and broad applicability. However, its effective application necessitates prior knowledge of anticipated damage mechanisms. Developing procedures for constructing physical models that accurately represent actual blade damage mechanisms and fatigue loading conditions is thus essential for effective damage mechanism analysis [19].
The assessment of lifespan reduction in wind turbine blade adhesive joints necessitates determining the composite interlaminar fracture toughness, as well as the fracture toughness based on the fatigue crack growth rate, at the specimen level. The dynamic properties of this adhesive model were characterized through tests targeting the critical displacement point in mode I (opening). For crack growth analysis, the fracture energy rate, derived from the fatigue crack growth velocity in mode I tests, was calculated. Furthermore, the virtual crack closure technique (VCCT), integrated with the extended finite element method (XFEM), was utilized to interpret fatigue crack growth characteristics in blade adhesive joints. The validity of this analytical modeling technique was affirmed by comparing and analyzing its results with experimental data. Employing the XFEM-VCCT-based fatigue crack growth modeling approach, the crack growth life of blade-level adhesive joints under fatigue loading was analyzed, focusing on constant amplitude load conditions.

2. Experimental and Numerical Failure Analysis of Adhesive Joints

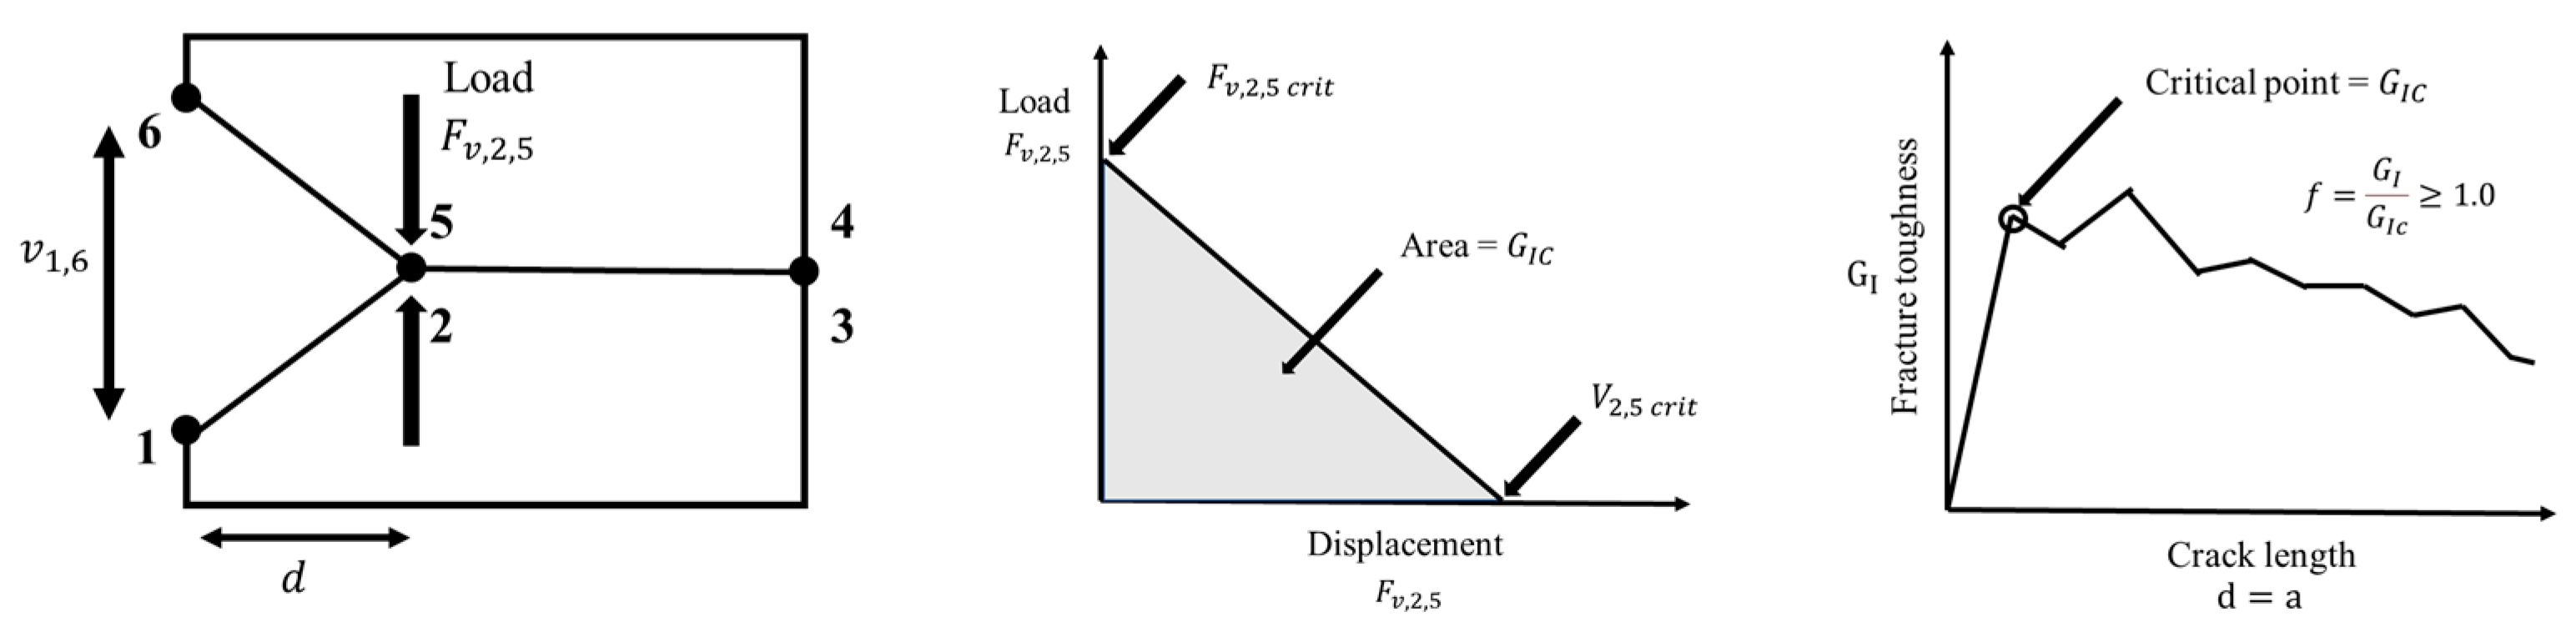
2.1. Theoretical Background

Considering the composite blade is subject to combined loads, it is essential to account for the interactions of opening mode, shearing mode, and mixed mode. This study’s analytical approach to adhesives encompasses four stages. Initially, the onset of failure is assessed using the quadratic nominal stress criterion (QNS criterion) proposed by Cui et al. [20], as outlined in Equation (1). This assessment is based on the adhesive’s strength. Subsequently, upon the initiation of failure, crack growth occurs. To analyze this, a fracture energy rate-based crack growth criterion, considering mixed mode conditions as per Equation (2) proposed by Benzeggagh and Kenane [21], is applied for progressive failure analysis.
σ n N m a x 2 + σ s T m a x 2 + σ t S m a x 2 = 1 ,
G I C + G I I C G I C G I I G I + G I I η = G C , G C = 3 P δ 2 b a .
where N m a x represents the normal tensile strength, T m a x represents the interlaminar shear strength, S m a x denotes the transverse interlaminar shear strength, σ n denotes the nominal stress, σ s denotes the shear stress, σ t is the transverse shear stress, G I C is the critical fracture toughness of mode I, G I I C is the critical fracture toughness of mode II, G I is the fracture toughness of mode I, G I I is the fracture toughness of mode II, G C is the critical fracture toughness, and η represents the material exponent of the mixed mode.
As a third step, the VCCT is employed for the analytical interpretation based on the criteria for crack initiation and growing fracture toughness values. VCCT is a widely used and well-developed method for analyzing adhesive joints and has been successfully applied to various issues, including complex delamination, skin tightener detachment, and adhesive joint failure.
The VCCT was originally developed by Rybicki and Kanninen [22] to calculate the strain energy release rate from crack tips by modifying Erwin’s principle of crack closure integration. VCCT operates on the principle that the energy released during crack growth is equivalent to the energy needed to restore the crack to its initial length. Typically, nodes at the crack tips exhibit a bound configuration. As shown in Figure 1 under mode I loading, the rate of energy release is calculated using the opening displacement (vertical displacement) and the vertical crack closure force (connectivity) as follows: v 1,6 is displacement 6 to 1 node. F 2,5 is load 5 to 2.
Conditions for determining fracture toughness according to crack propagation are as follows:
G I C = 1 2 F 2,5 v 1,6 b d ,
Crack propagation is assumed to occur if the following condition is satisfied:
f = G I G I c 1.0 ,
where G I and G I C are the calculated energy release rate and the critical strain energy release rate of matter, respectively. Then, 1, 2, 5, and 6 denote the specific node locations. The contact between node 2 and node 5 breaks, allowing the crack to propagate by d and forming a new crack tip.
As a fourth step, while VCCT is traditionally applied under a singular load condition, this study necessitates additional analytical criteria to evaluate crack growth life under fatigue loads, including cycle numbers. To address this, the NASA-2017 report introduced the VCCT-XFEM method [23] based on Paris’s theory [24]. This approach involves applying a material factor derived from load, displacement, and crack growth length data obtained from fatigue crack growth tests to the analytical technique. The resistance to fatigue crack growth is then determined using Equations (5)–(7).
Where a is the crack length and da/dN is the fatigue crack growth for a load cycle N. The material coefficients C and β are obtained experimentally and also depend on environment, frequency, temperature, and stress ratio.
d a d N = C · Δ G I β ,
N = A · G I b ,
A = c 1 ,     b = c 2 ,     C = c 3 ,       β = c 4 .
0 < G t h < G P l < 1 .

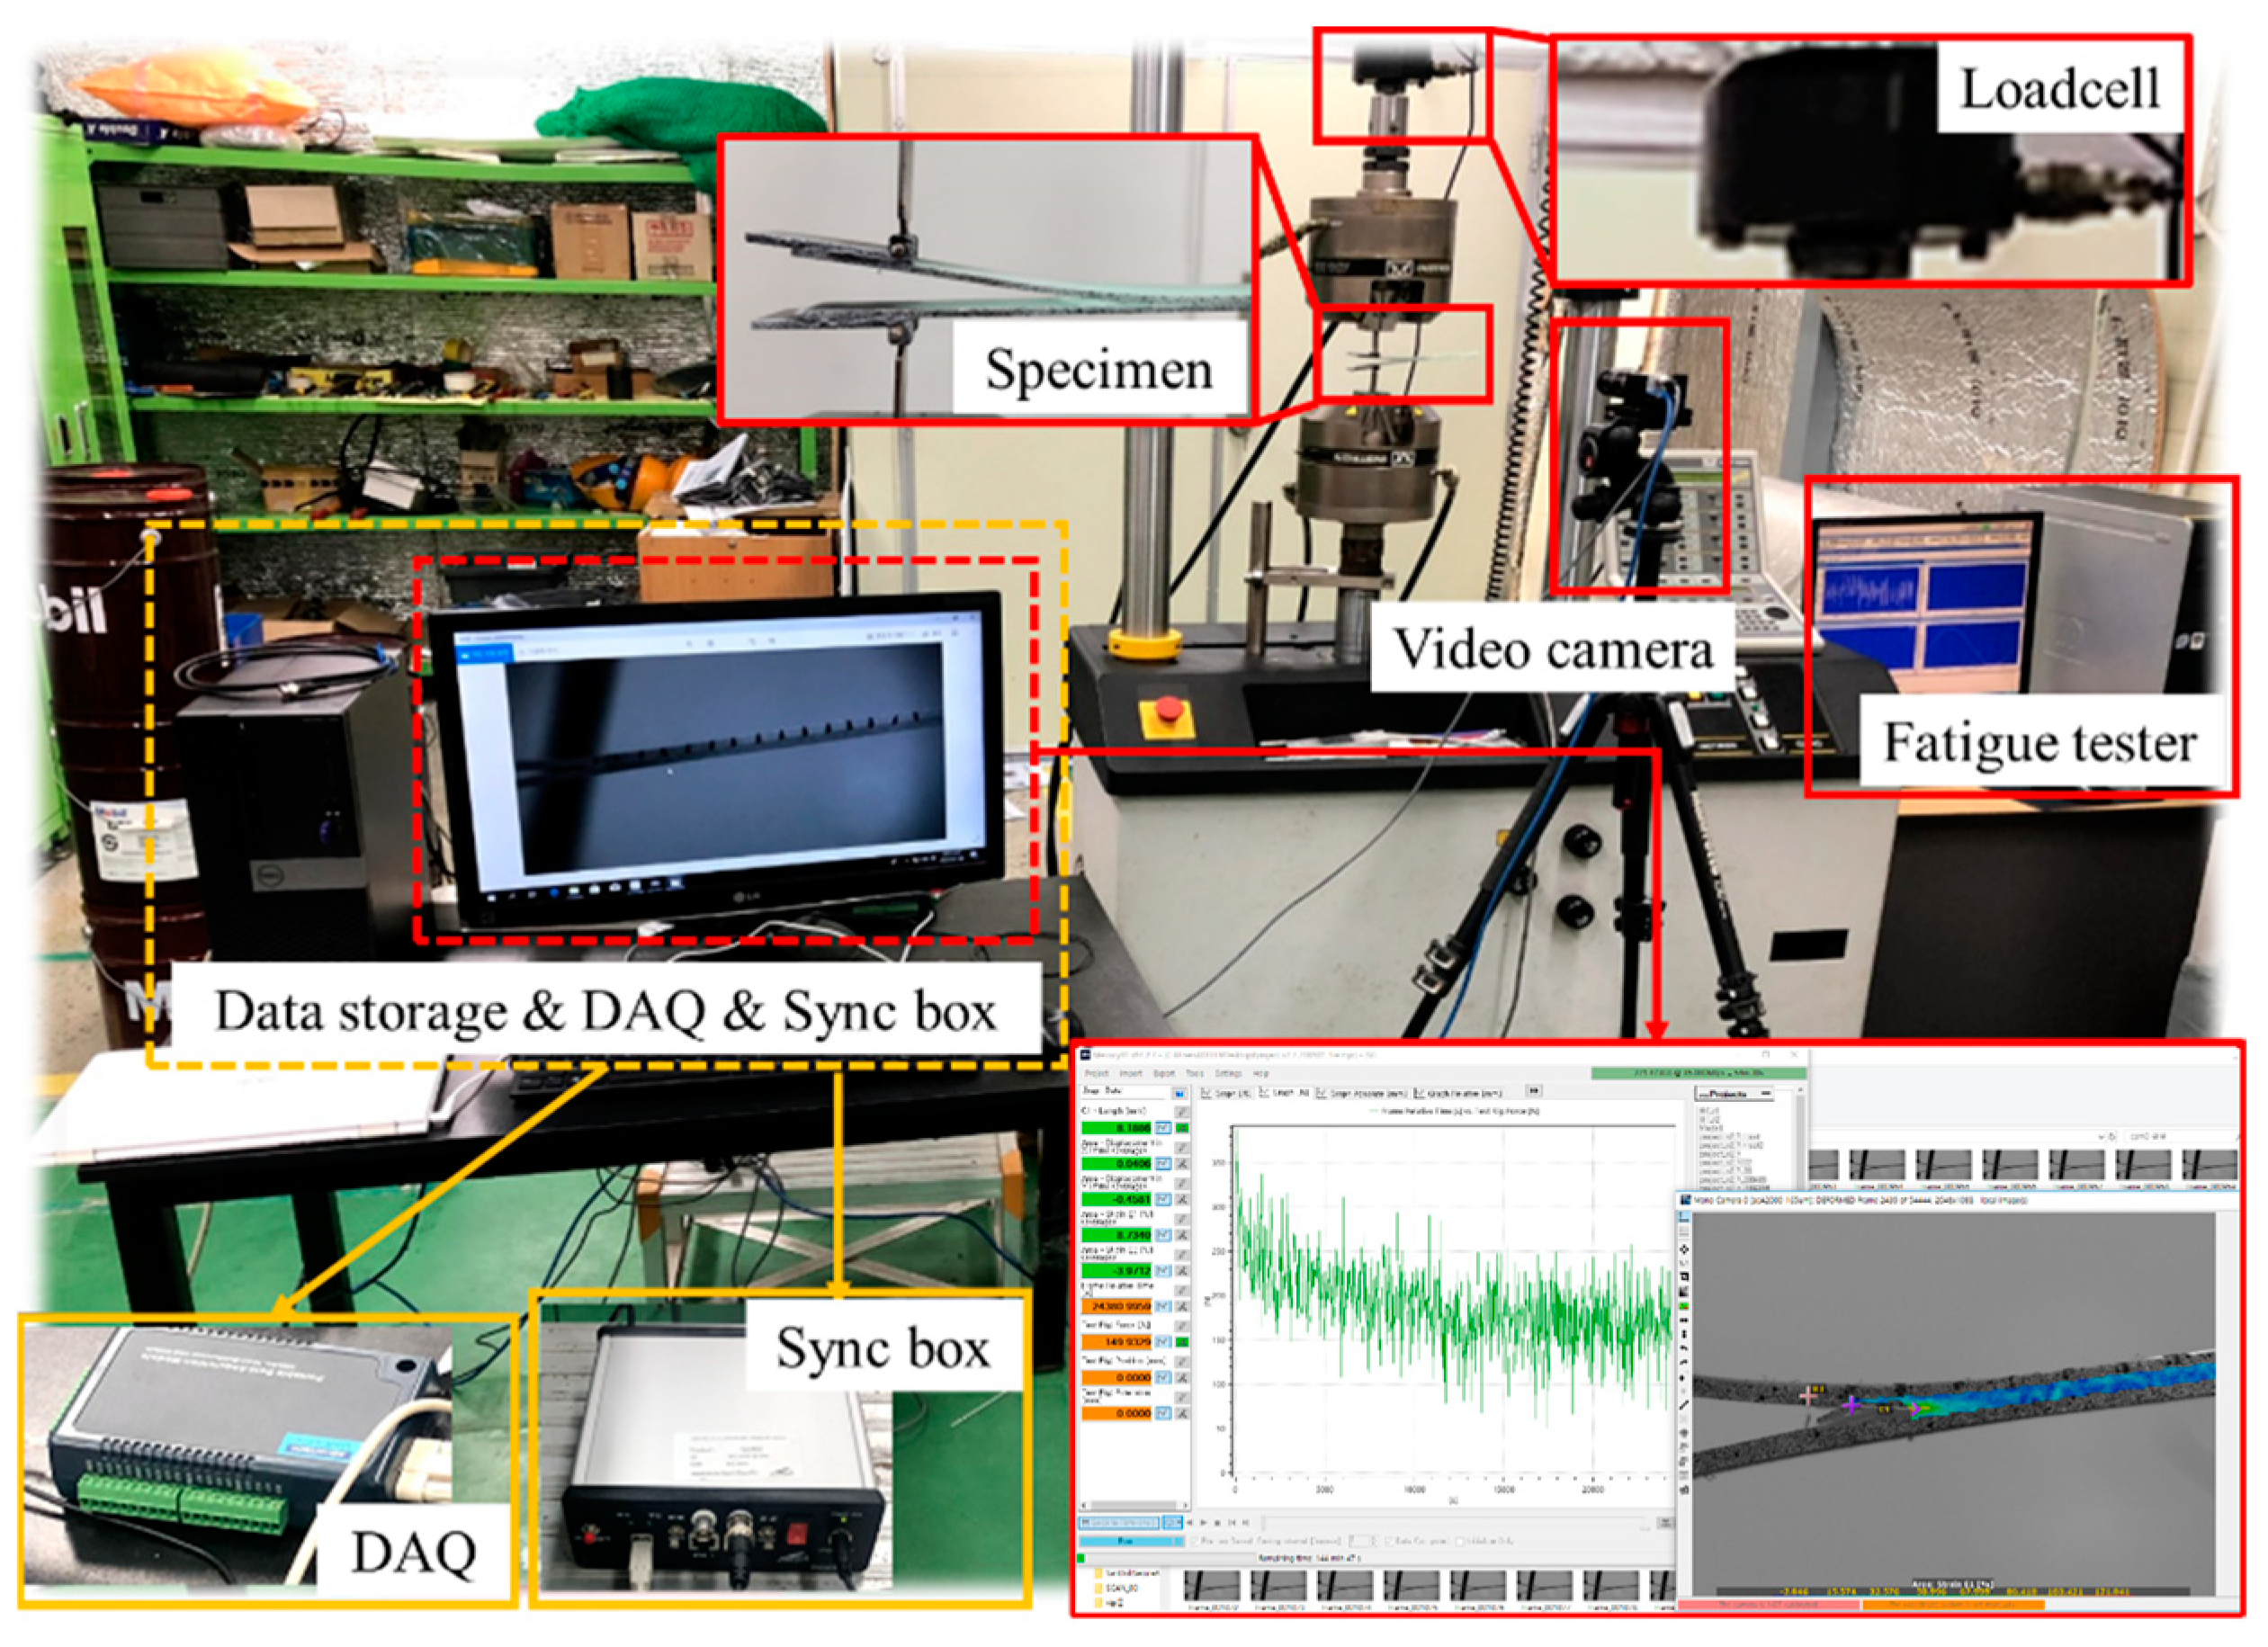
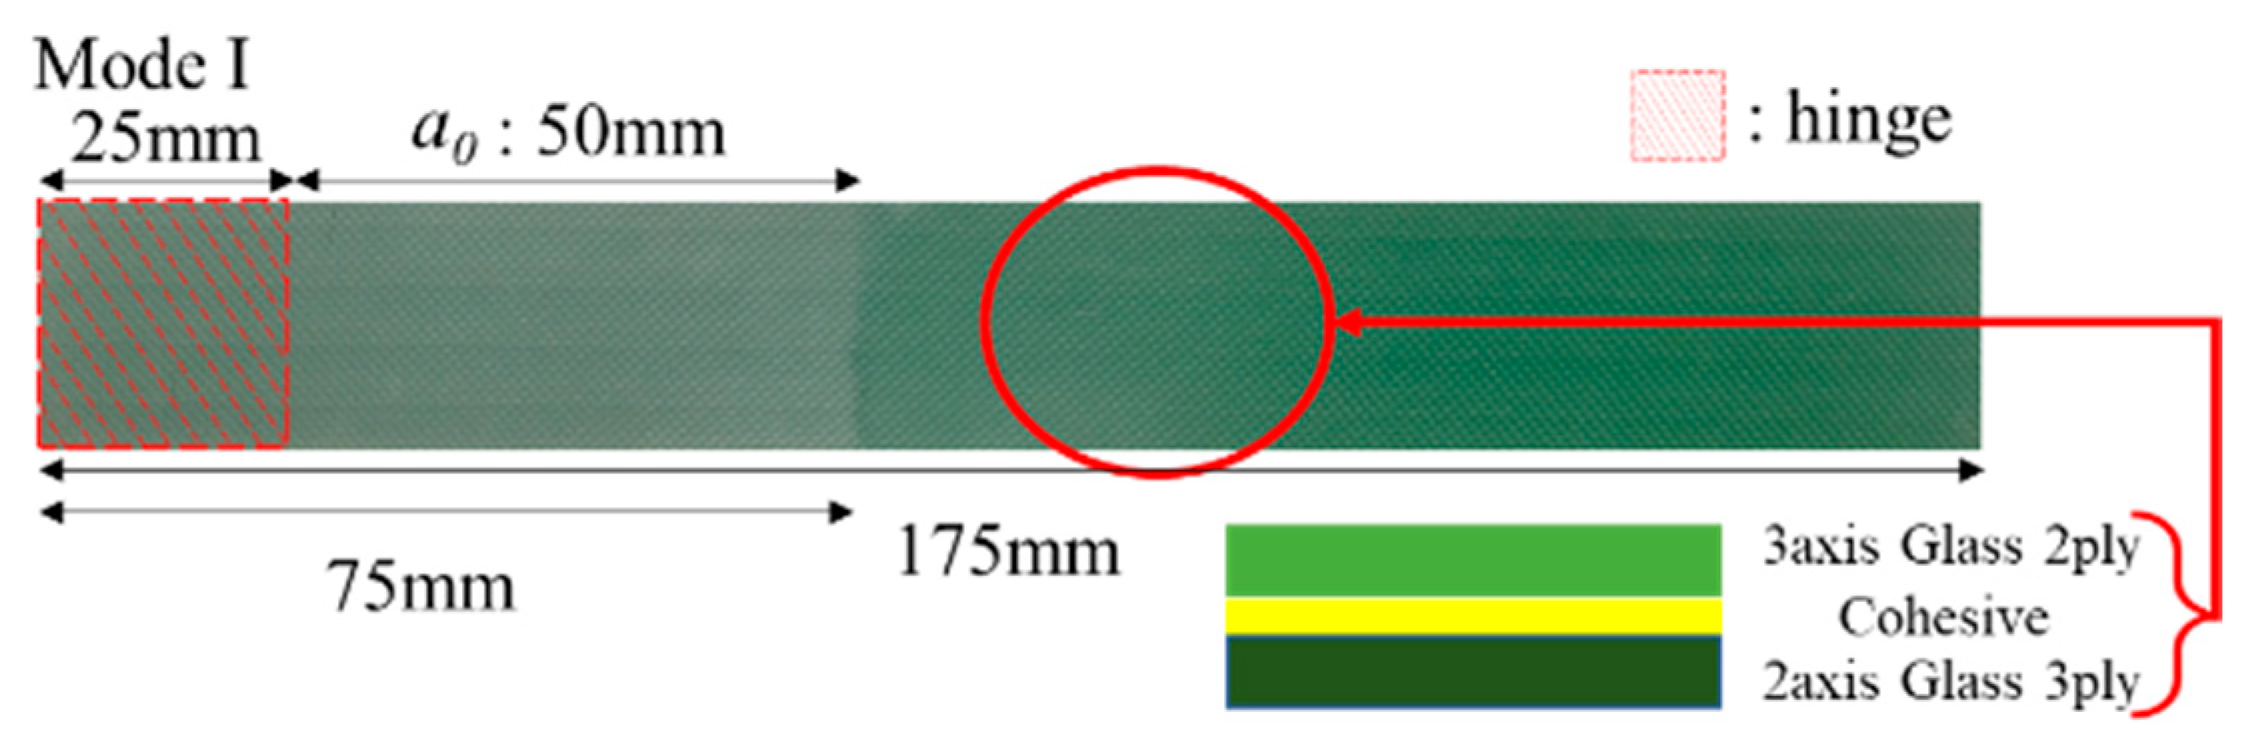
2.2. Experimental Test Procedure

The fatigue crack growth behavior in wind turbine blade adhesive joints is influenced by changes in fracture energy rate and crack growth rate [25]. Quantitative analysis at the specimen level is essential to understand the crack growth behavior and failure process. For analyzing crack growth characteristics under fatigue loading in mode I, paralleling static test conditions, test parameters were selected in line with ASTM E647 [26]. The DCB specimen, used in interlaminar fracture toughness tests, was employed. Fatigue loading was applied at 1 Hz using an Instron fatigue tester, as illustrated in Figure 2. To facilitate low-load fatigue crack growth testing, a 5 kN capacity load cell was integrated with the tester. A data acquisition (DAQ) device sets the crack measurement intervals and synchronizes measurement times. Real-time crack length analysis and measurement were performed using Mercury software v2.9, a 75 mm lens, and a 5MPx camera [27]. The test results were evaluated through the relationship between crack growth rate and fracture energy rate across three regions. For the analytical model, the material constant was derived based on the correlation between fracture mechanics parameters—energy release rate and fatigue crack growth rate.
The specimen for testing failure to determine the interlaminar fracture toughness of the laminated biaxial/triaxial hybrid composite was designed and fabricated similarly, as shown in Figure 3, using a mode I DCB specimen. The specimen, composed of a 2-axis glass fiber reinforced composite material, measured 175 mm × 25 mm, featuring 3 plies with a total thickness of 1.68 mm (0.56 mm/ply). Additionally, a 3-axis composite material was laminated with 2 plies, totaling 1.82 mm in thickness (0.91 mm/ply). A 0.2 mm thick Teflon film, inserted between the biaxial and triaxial laminations, initiated cracks while adhesive securing the remaining parts. The initial crack length ( a 0 ) was set to 50 mm. A self-manufactured aluminum hinge was attached to facilitate connection with the load cell of the tester during the experiment.
Test conditions were selected to be displacement-controlled, aligning with the methodology of the Wind Turbine Materials and Constructions Research Center [25]. The evaluation was based on the minimum-to-maximum displacement ratio, setting the maximum displacement ( δ m a x ) at 18 mm, a critical value δ C m a x determined from the static test’s critical fracture toughness. Minimum displacements ( δ m i n ) were established at 1.8 mm, 5.4 mm, and 9 mm under three reference load conditions (R values) of 0.1, 0.3, and 0.5 to examine the impact of loading displacement on crack growth characteristics. Accordingly, crack growth rate was analyzed with respect to cycle count (N), crack growth length (a), N-fracture energy rate (G), and the da/dN-G relationship across three representative regions. Notably, the crack growth rate is significantly affected by the loading force. Under varying load conditions, the fracture energy rate either accelerates or decelerates crack propagation compared to a constant loading scenario, influenced by the sequence of loading [27].

2.3. FE Analysis—Numerical Test and Blade Modeling Method

To validate the specimen-level fatigue crack growth model, failure analysis utilized the VCCT-XFEM technique in the ABAQUS ver.2022 software [28]. The finite element model employed S4R elements, while COH3D8 elements were used for the adhesive. The adhesive element size was modeled at 0.1 mm, as depicted in Figure 4, to enhance crack growth behavior variability and analysis convergence.
The adhesive properties used in specimen fabrication are detailed in Table 1, while the fiberglass material properties, applied as per specifications from Human Composite Co., Ltd.(Gunsan-si, Republic of Korea), are presented in Table 2. Regarding load application, a load was exerted up to 20 mm from the lever position through displacement control. Subsequent measurements of load, displacement, and crack growth length facilitated fracture toughness calculation, enabling comparison with experimental results.
To assess the reliability of the adhesive model applied to wind turbine blades, specimen-specific modeling was conducted using the VCCT [5,6]. This technique effectively simulates the crack growth characteristics in the adhesive joint. Additionally, the XFEM was employed to analyze crack growth behavior under fatigue loading. The thickness of the adhesive was omitted in accordance with the VCCT approach. Fatigue loading was applied as per the test conditions, with R-ratios of 0.1, 0.3, and 0.5 at a maximum displacement of 18 mm, as illustrated in Figure 5.

2.4. Numerical Composite Blade Modeling Method

Identifying damage locations on the wind blade necessitates initial damage information. First, the target blade model, as specified in Table 3, was established, and principal damage sites were identified as spar cap–shear web joints 1 and spar cap–shear web joints 2, depicted in Figure 6. These adhesive joints were modeled using the XFEM-VCCT, a technique validated in the previous section. An initial crack length of 200 mm was assigned, and loading was applied at a node with a distributed load positioned 55% from the root. This loading mirrored the constant amplitude loading condition, as demonstrated in Figure 7. The crack growth shape following initial damage application and its impact on the composite blade’s crack growth life were analyzed. The blade model’s adhesive joint modeling method was based on the spar cap–shear web part damage analysis review by Ji et al. [8]. Additionally, the modeling technique, drawing upon the adhesive model implementation and influence analysis results for the solid model of the Trailing Edge (TE) part proposed by Rafiee et al. [10], was incorporated in this study’s adhesive joint model.

3. Results and Discussion

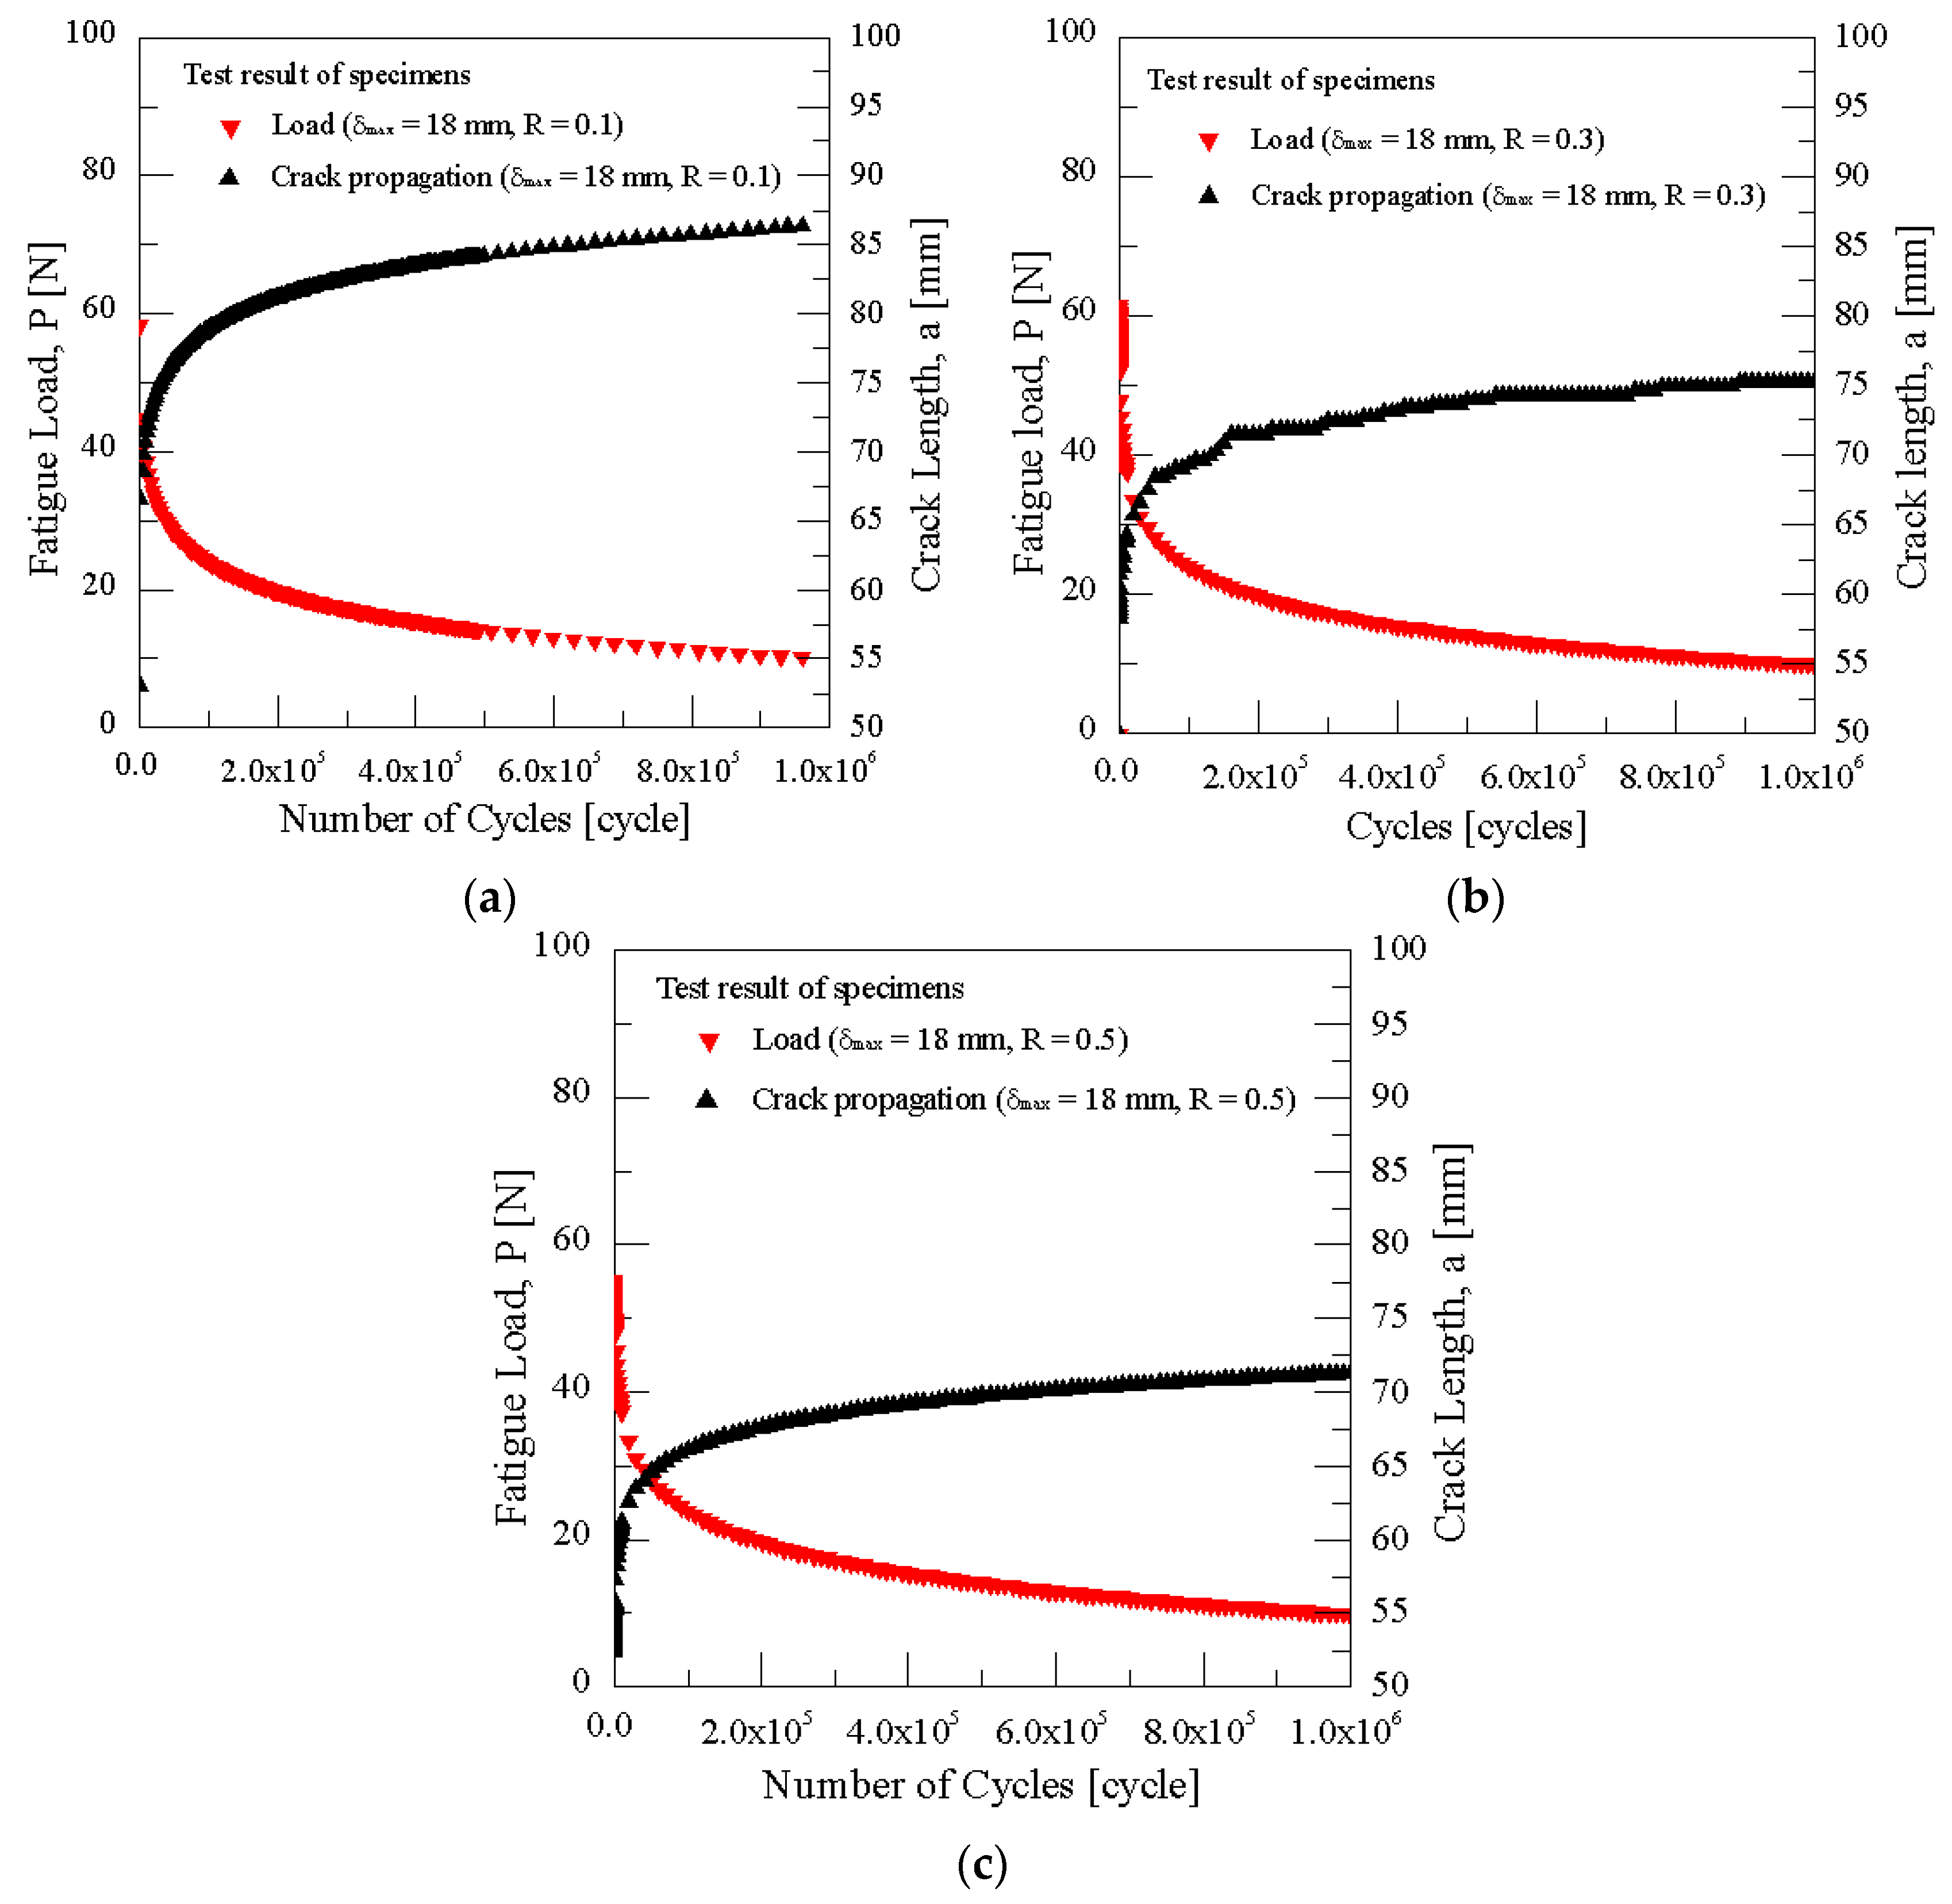
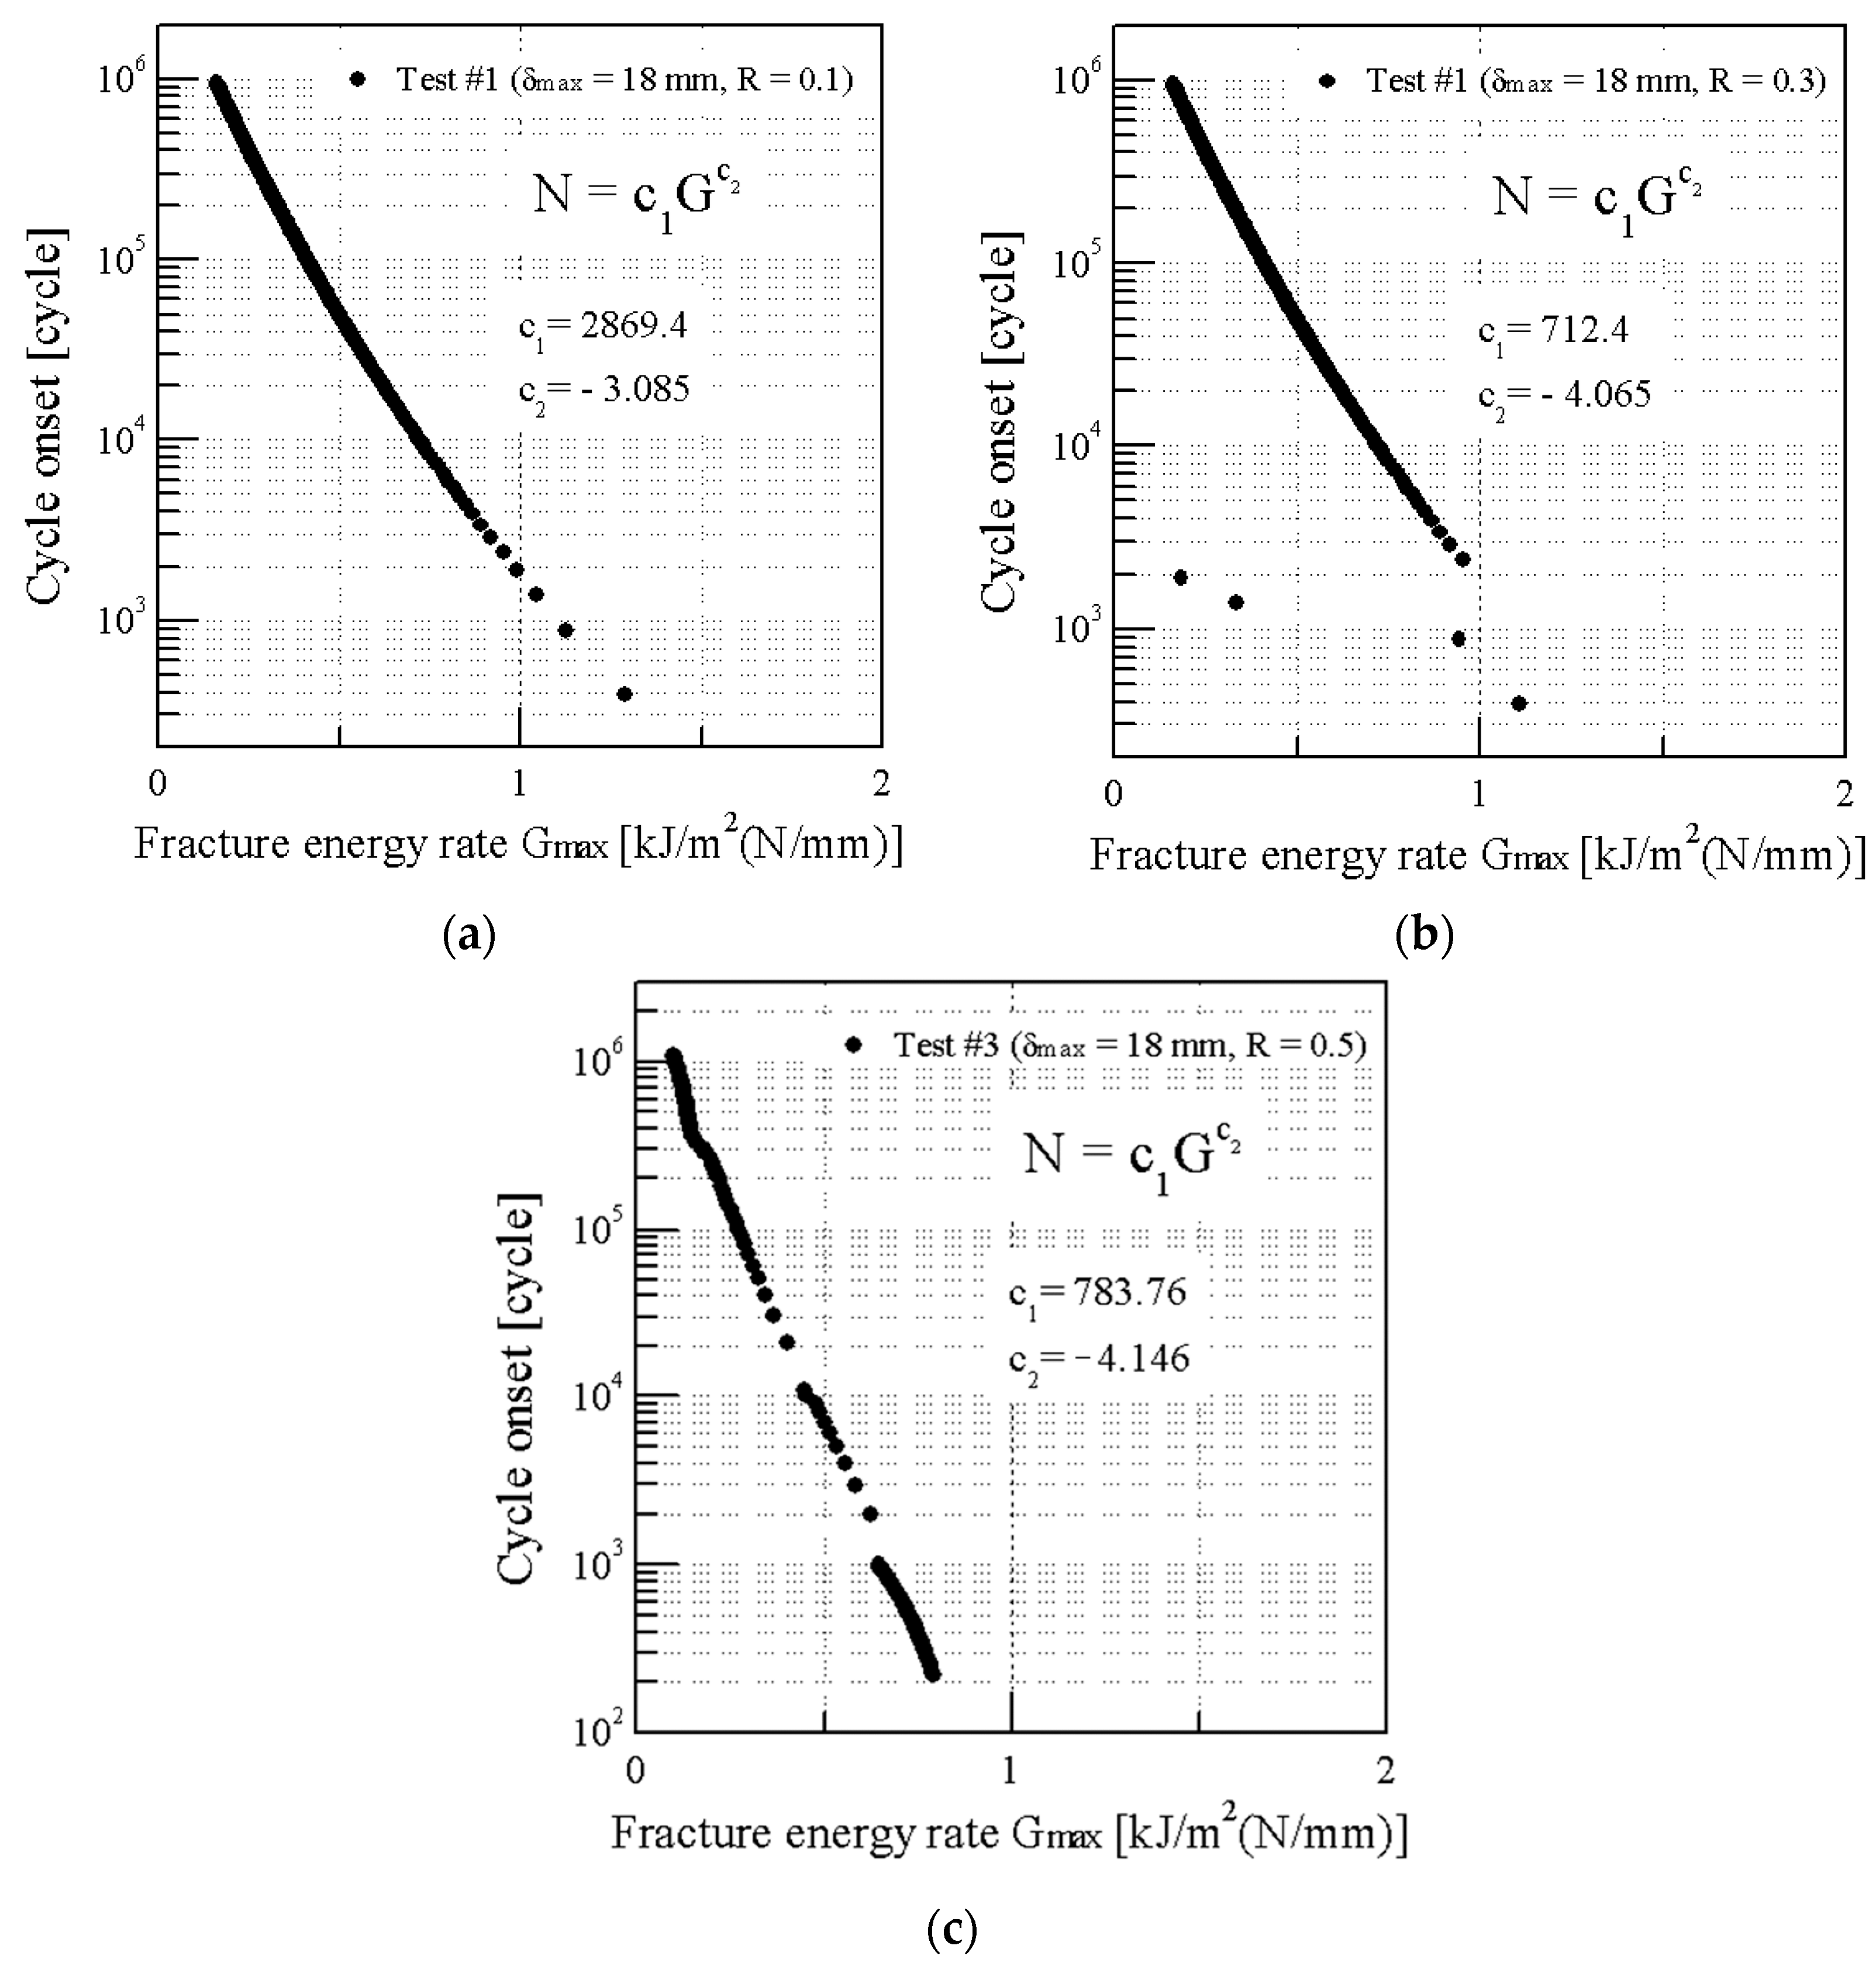
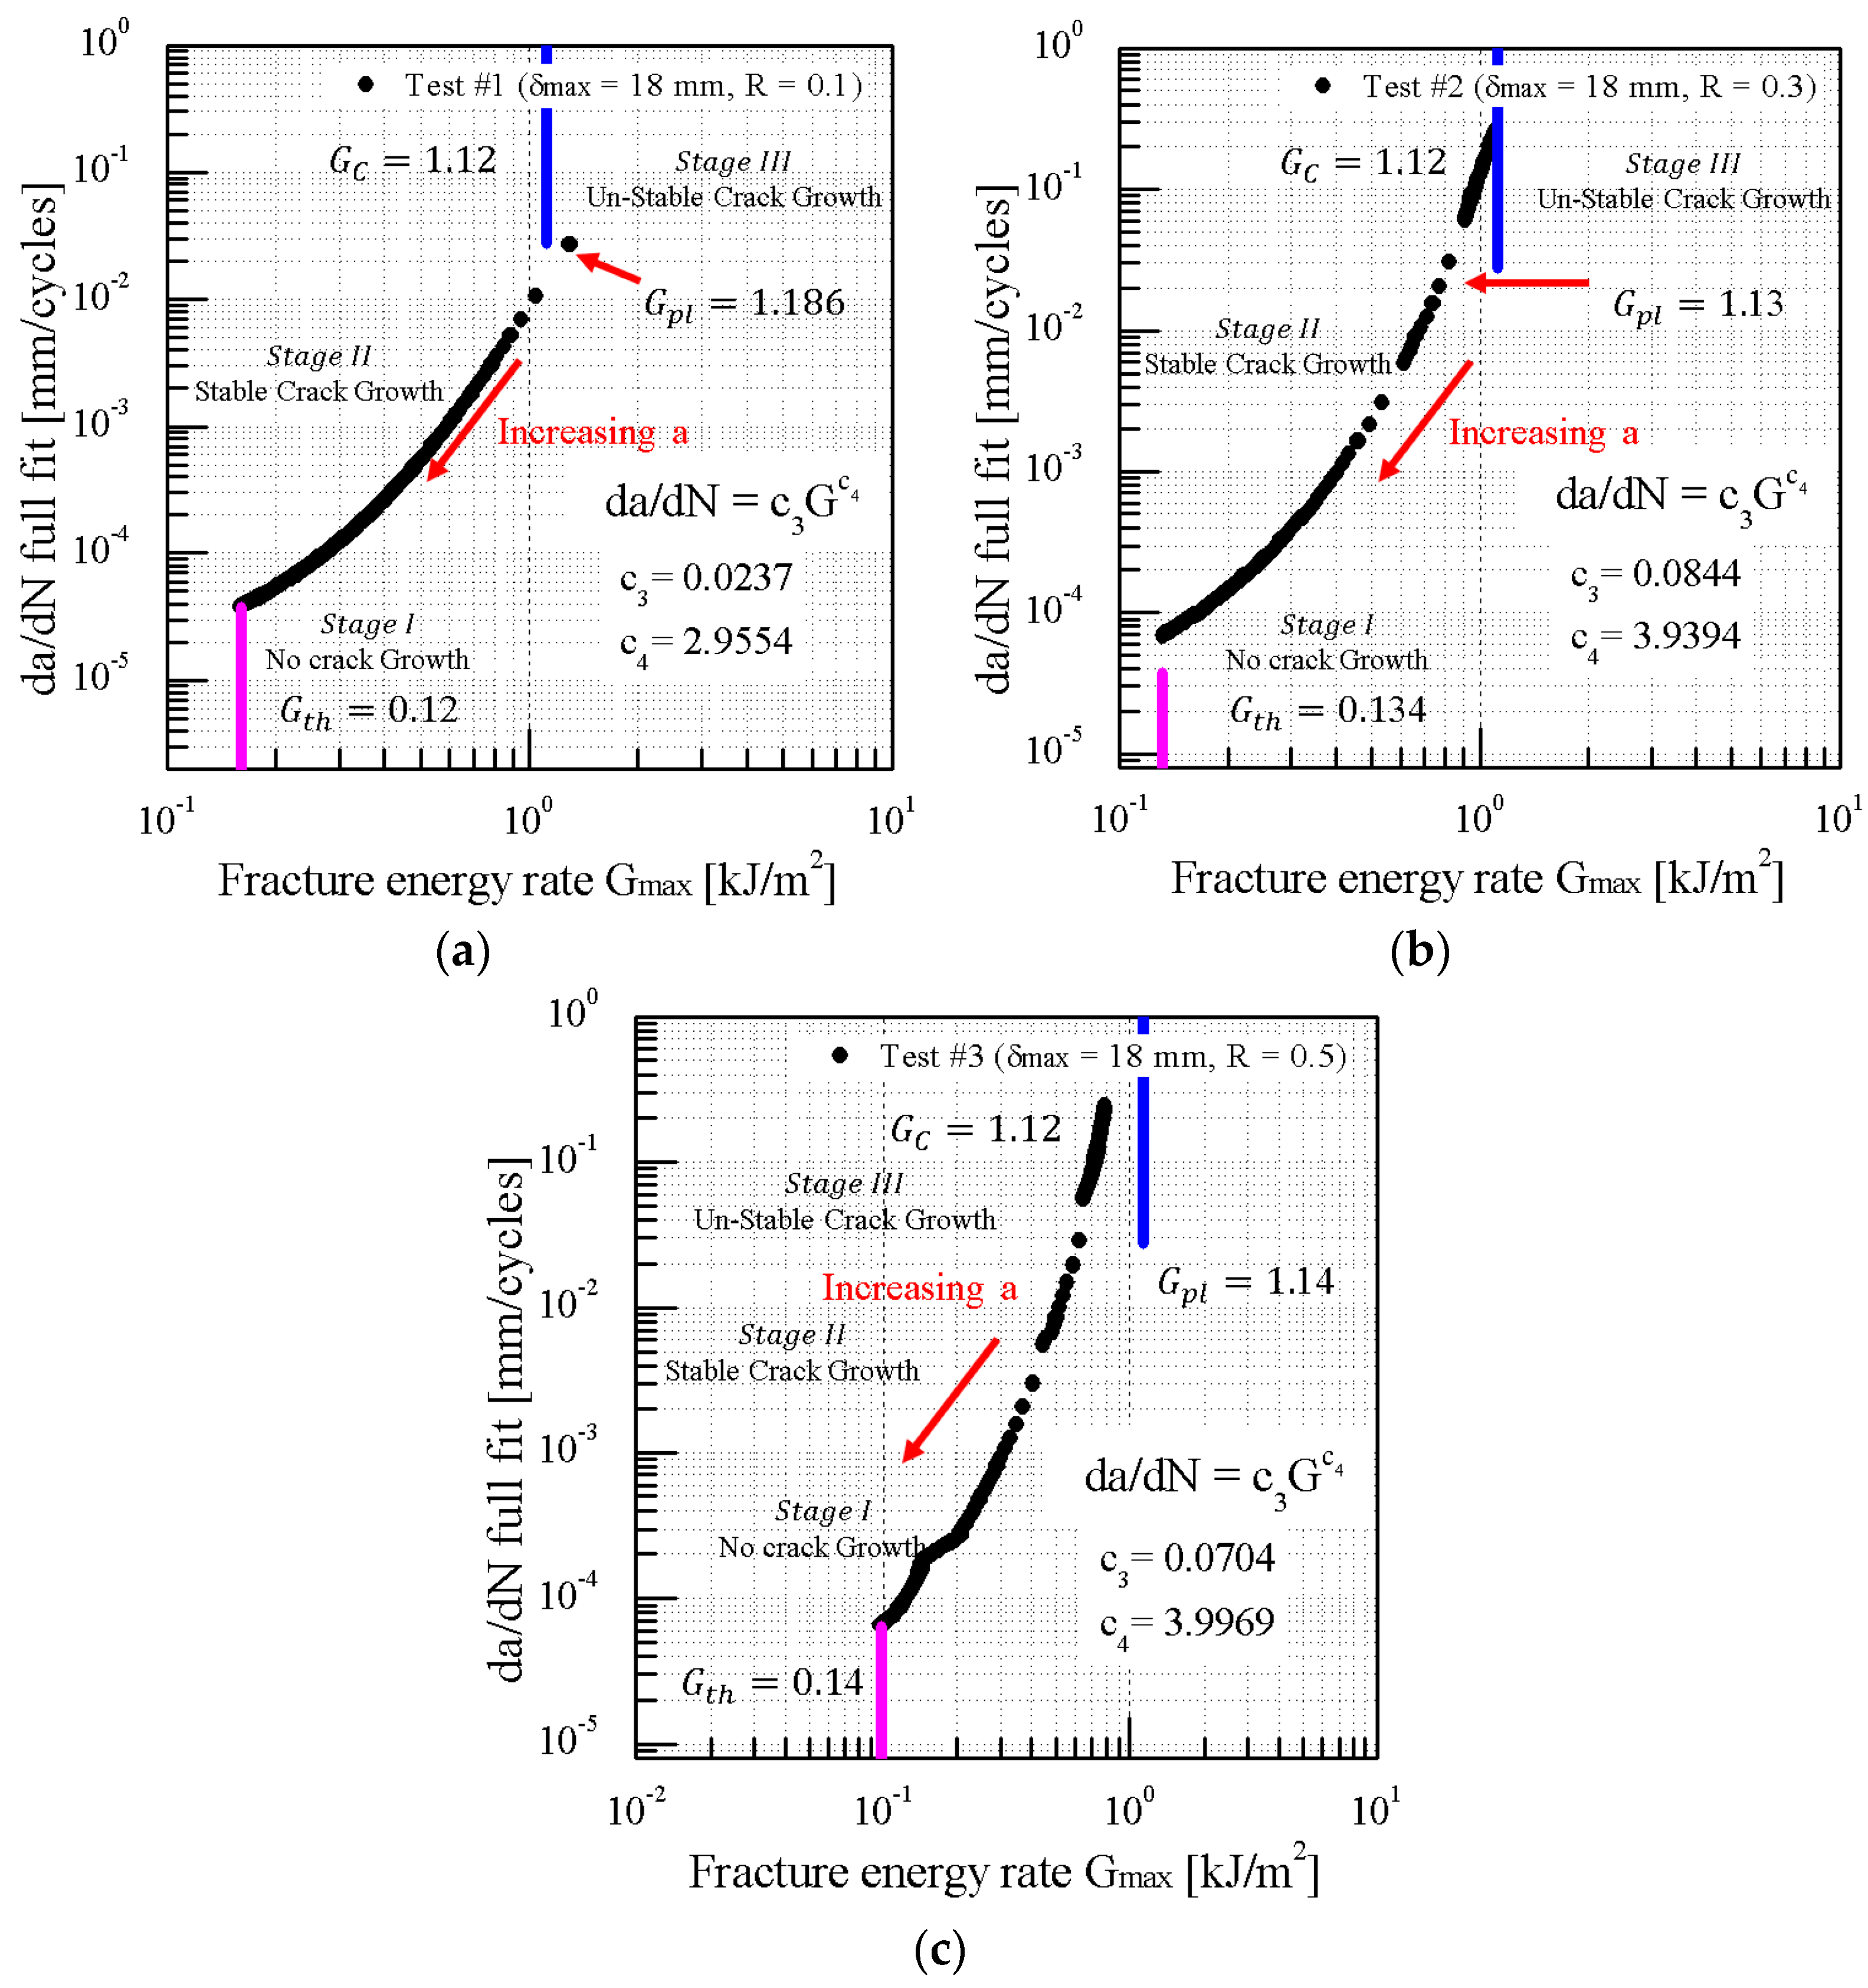
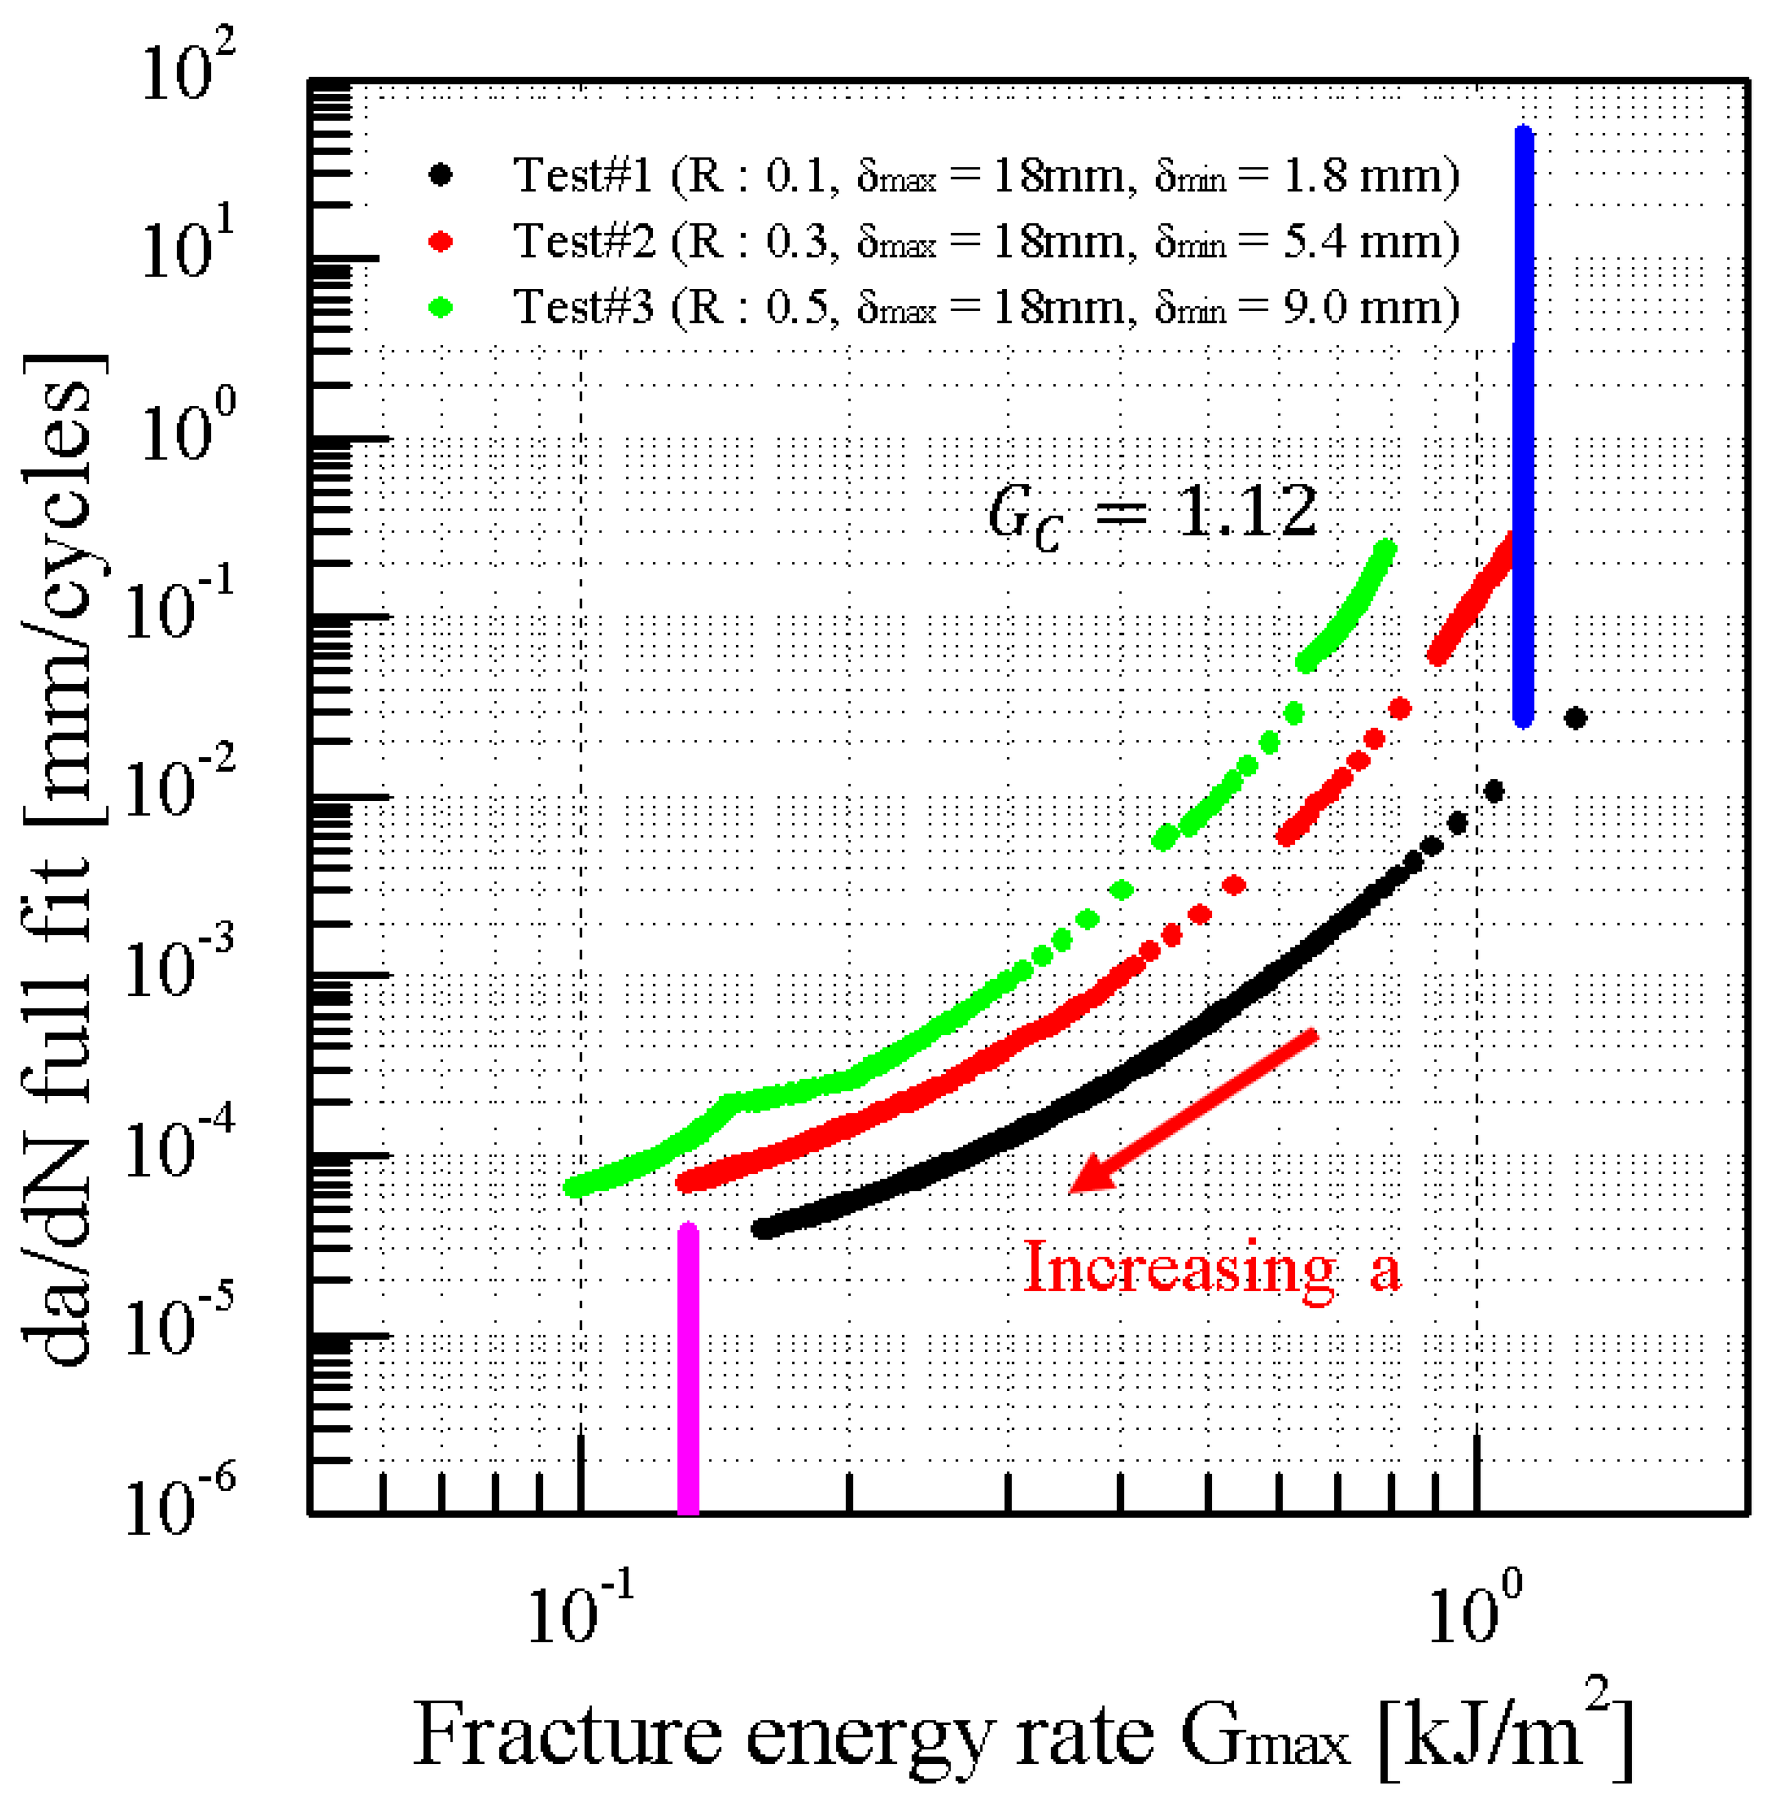
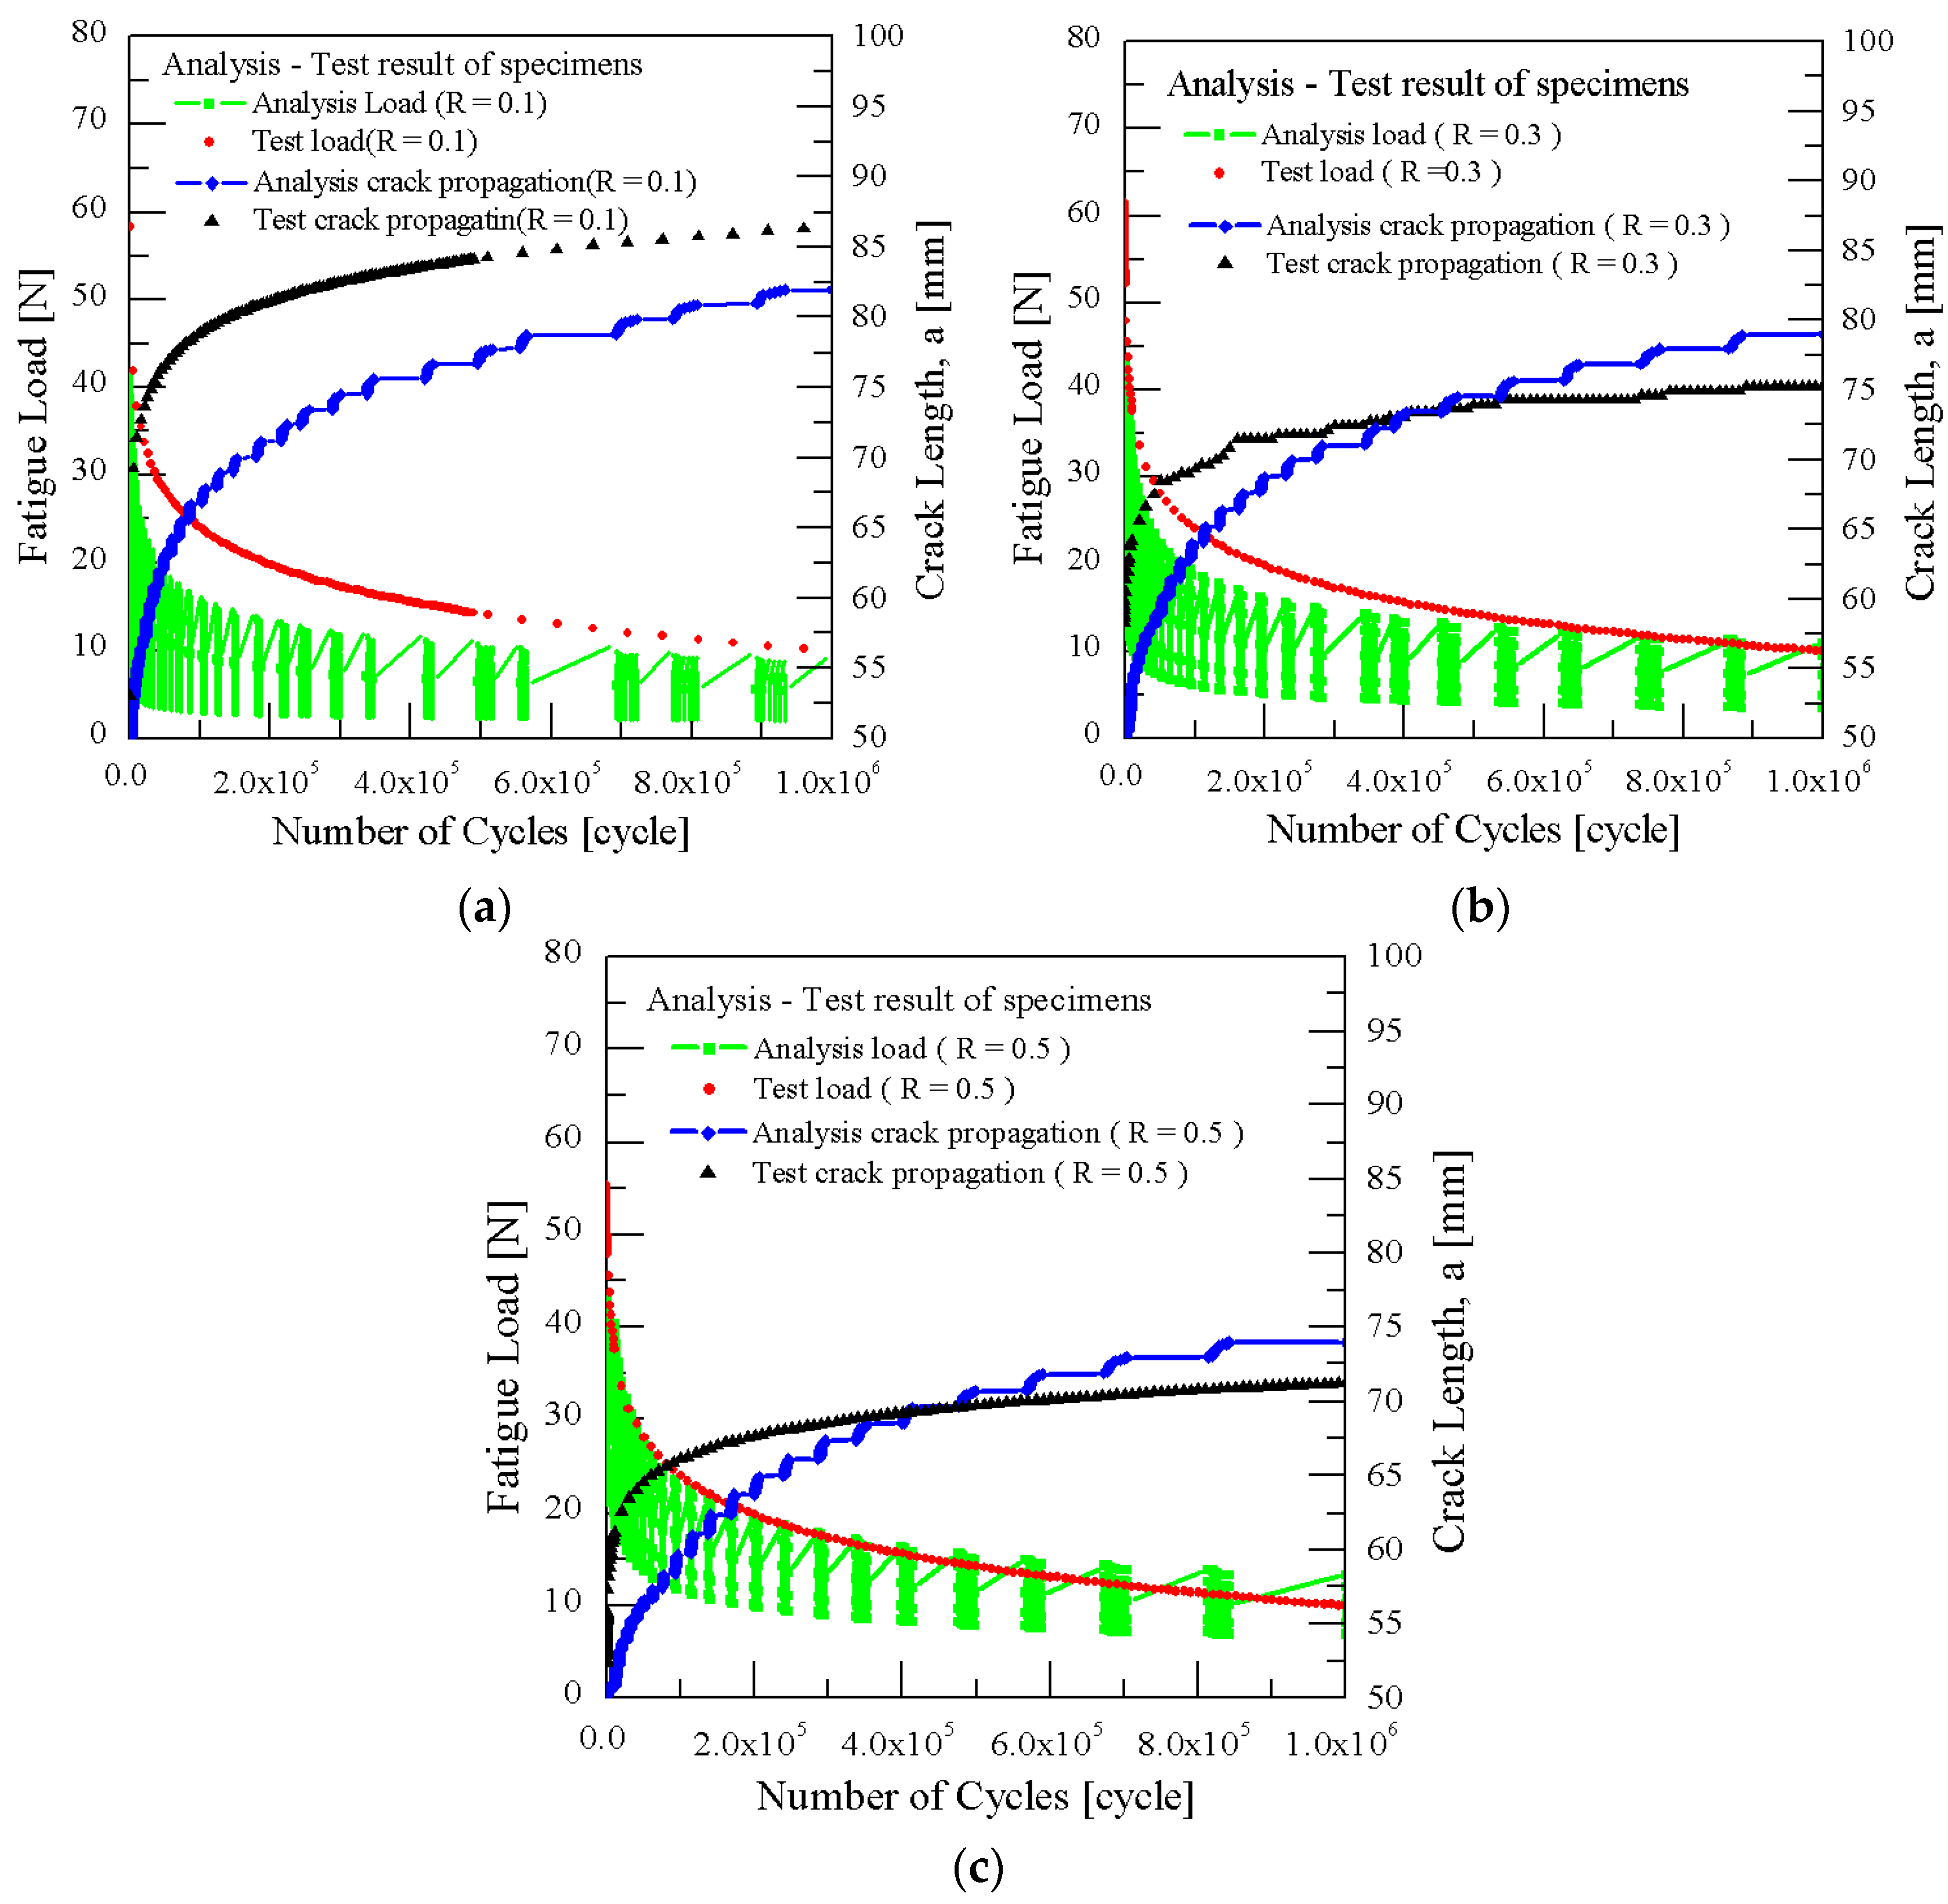
3.1. Fatigue Crack Growth for Mode I Test

At a minimum displacement of 1.8 mm, an increased load leads to rapid crack growth length in the initial cycles, indicating swift crack progression in the low cycle range (N < 104) as testing commences at maximum displacement. The region of highest loading was also pinpointed. This rapid crack growth behavior, consistent across R values of 0.3 and 0.5, as depicted in Figure 8, shows that higher R values correspond to slower crack growth rates. This pattern differs from that observed in isotropic and notched specimens, where the crack growth rate typically increases with higher loads nearing R = 1 [29]. Such behavior in double cantilever beam (DCB) specimens is likely attributable to their low fatigue crack growth/delamination resistance and thin adhesive layers [30]. It is also observed that maximum displacement has a more pronounced effect on crack growth rate than high loading rate. At fatigue crack growth rates (da/dN) between 10−4 mm/cycle and 10−5 mm/cycle, the fatigue crack fracture energy rate, calculated using Equations (8) and (9), diminishes to the more cycles there are, as illustrated in Figure 9a–c. Consequently, crack growth decelerates in the high cycle range (N > 104). However, the results of the three tests show that the crack growth rate increases overall as R = 1 approaches. The total crack growth length is larger as R = 0 approaches, but the ratio of crack length per cycle (da/dN) increases as R = 1 approaches. This is because the test was conducted based on the fracture toughness value at the critical point. If a more stable crack growth rate is to be obtained, it could be considered that a lower standard value rather than the critical fracture toughness standard should be used.
G m a x = 3 P 2 C 2 b a ,
C = δ P ,
Further analysis, in accordance with Paris’s law across three regions, reveals varied fracture energy rates. At a critical fracture toughness G C of 1.12 kJ/m2, the fracture energy rate G p l in the unstable state is 1.186 kJ/m2, and G t h the almost crack-free state is at 0.12 kJ/m2, as shown in Figure 10. For R = 0.3, the values of G C is 1.12 kJ/m2, G p l is 1.13 kJ/m2, and G t h is 0.134 kJ/m2, as indicated in Figure 10. The slowest crack growth rate at R = 0.5 is illustrated in Figure 10.
Across all R conditions, differences in crack growth characteristics are observed in Stable I, II, and III sections, as depicted in Figure 11. The fatigue crack growth test shape aims to emulate the defect morphology in wind blade adhesive joints under various conditions. This study’s primary parameters are the material factors listed in Table 4 and Table 5. These factors c 1 and c 2 are derived from the G m a x –cycles curve relationship, while c 3 and c 4 are obtained from the - d a / d N - G m a x curve. Here, r 1 and r 2 , representing the initial state crack characteristics and crack limit point characteristics, are calculated using the equations G t h / G c = r 1 and G p l / G c = r 2 , respectively.

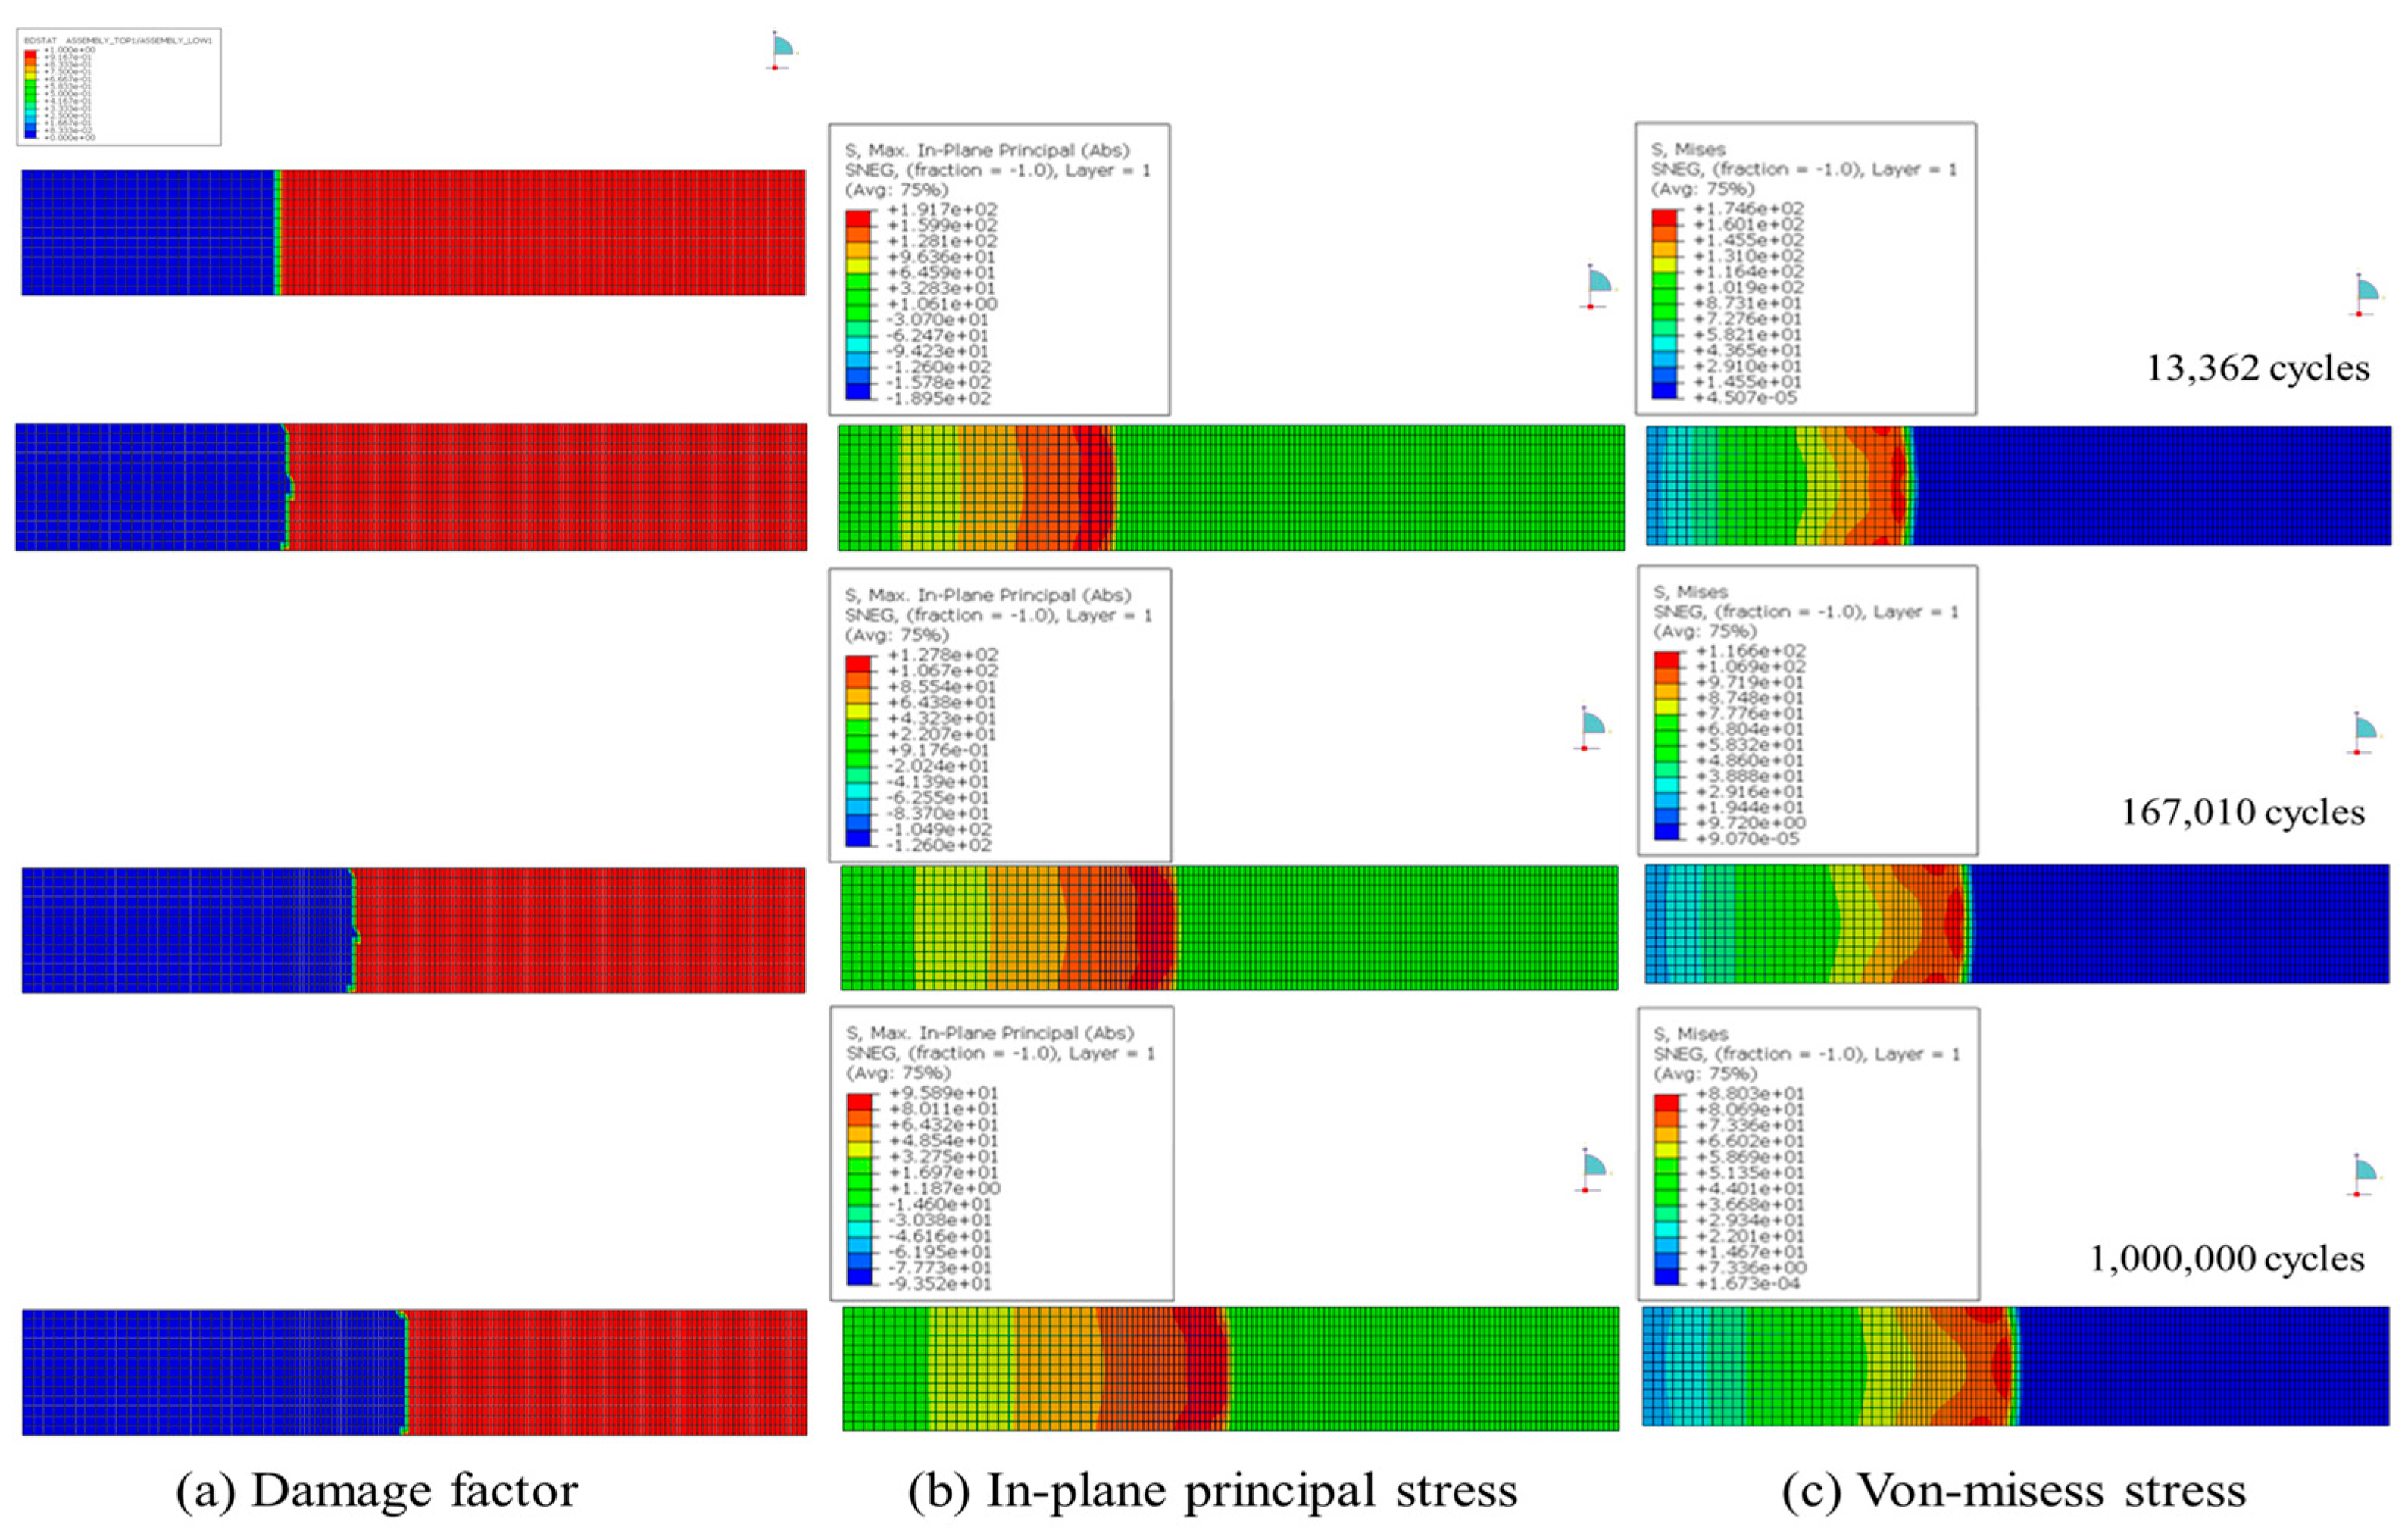
3.2. Discussion of FE Analysis

3.2.1. Mode I Test

In Figure 12a, we can observe the crack growth behavior characterized by a maximum load of 45 N and a minimum load of 5 N. Furthermore, as we adjust the displacement conditions to 0.3 and 0.5, we note that the minimum load increases to 9 N (Figure 12b) and 14 N (Figure 12c), respectively. This shift in behavior is consistent with loading in the high displacement range. However, it is important to acknowledge that our test data were collected solely at the point of maximum displacement, necessitating confirmation through subsequent analysis. Additionally, we conducted reliability verification, which exhibited behavior similar to the test results, albeit with generally lower load levels. This discrepancy is attributed to the lower critical load for fatigue crack growth tests, influenced by both the dynamic load of the testing apparatus and environmental factors. Importantly, these variations have minimal impact on the properties of the blade unit.
The material characteristics within the three regions analyzed at the specimen unit are closely linked to the slope, which is evident in the fatigue crack growth test data. Consequently, our analysis is grounded in the critical interlaminar fracture toughness values derived from mode I, mode II, and mixed mode tests conducted under static conditions. These values are then integrated into the XFEM within our finite element model.
Furthermore, following the insights of Ubamanyu et al. [31], fatigue crack growth characteristics typically align with the conditions G t h / G c = 0.01 and G p l / G c = 0.85. Notably, the employed G p l in our study exceeds the G c , suggesting the rapid occurrence of unstable crack growth behavior. To establish a stabilized material factor parameter, we selected a value of 0.95 kJ/m2 to ensure compliance with G p l / G c = 0.85. Additionally, to meet the requirements of G t h / G c = 0.01, it is imperative to extend the testing cycle to minimize crack occurrences as much as possible.
To achieve this, we selected a value of 0.011 kJ/m2 in accordance with the criteria proposed by Ubamanyu et al. Based on this selection, we conducted an analysis of stress propagation geometry and changes in principal stress within the glass fiber for R = 0.1, 0.3, and 0.5, as depicted in Figure 13, Figure 14 and Figure 15. Specifically, our observations indicated a behavior similar to the evolution of mode I. In Figure 12, at R = 0.1, we noted a maximum in-plane principal stress of 147.3 MPa occurring within the first 11,274 cycles, with an average Von Mises adhesive stress of 144.3 MPa. After 159,020 cycles, the principal stress reduced to 101.7 MPa, and the adhesive’s average stress decreased to 92.64 MPa, signifying a gradual stress reduction. Similarly, at R = 0.3, the principal stress was 119.6 MPa with an average adhesive stress of 108.9 MPa within 11,284 cycles, indicating lower stress levels compared to R = 0.1. Consequently, we observed that the crack growth rate was influenced by R, with the crack growth behavior slowing down as stress gradually decreased. Notably, there was a notable concentration of stress at the initial crack, followed by a sharp reduction in stress after approximately 100,000 cycles. Our analysis demonstrated that the analytical model exhibits a similar phenomenon when the fatigue crack growth rate per cycle (da/dN) analyzed in the previous test approaches the range of 10−4 mm/cycle to 10−5 mm/cycle. As a result, we validated the reliability of XFEM-VCCT in simulating crack growth behavior when the initial crack occurs in the adhesive joint within the wind blade unit model.

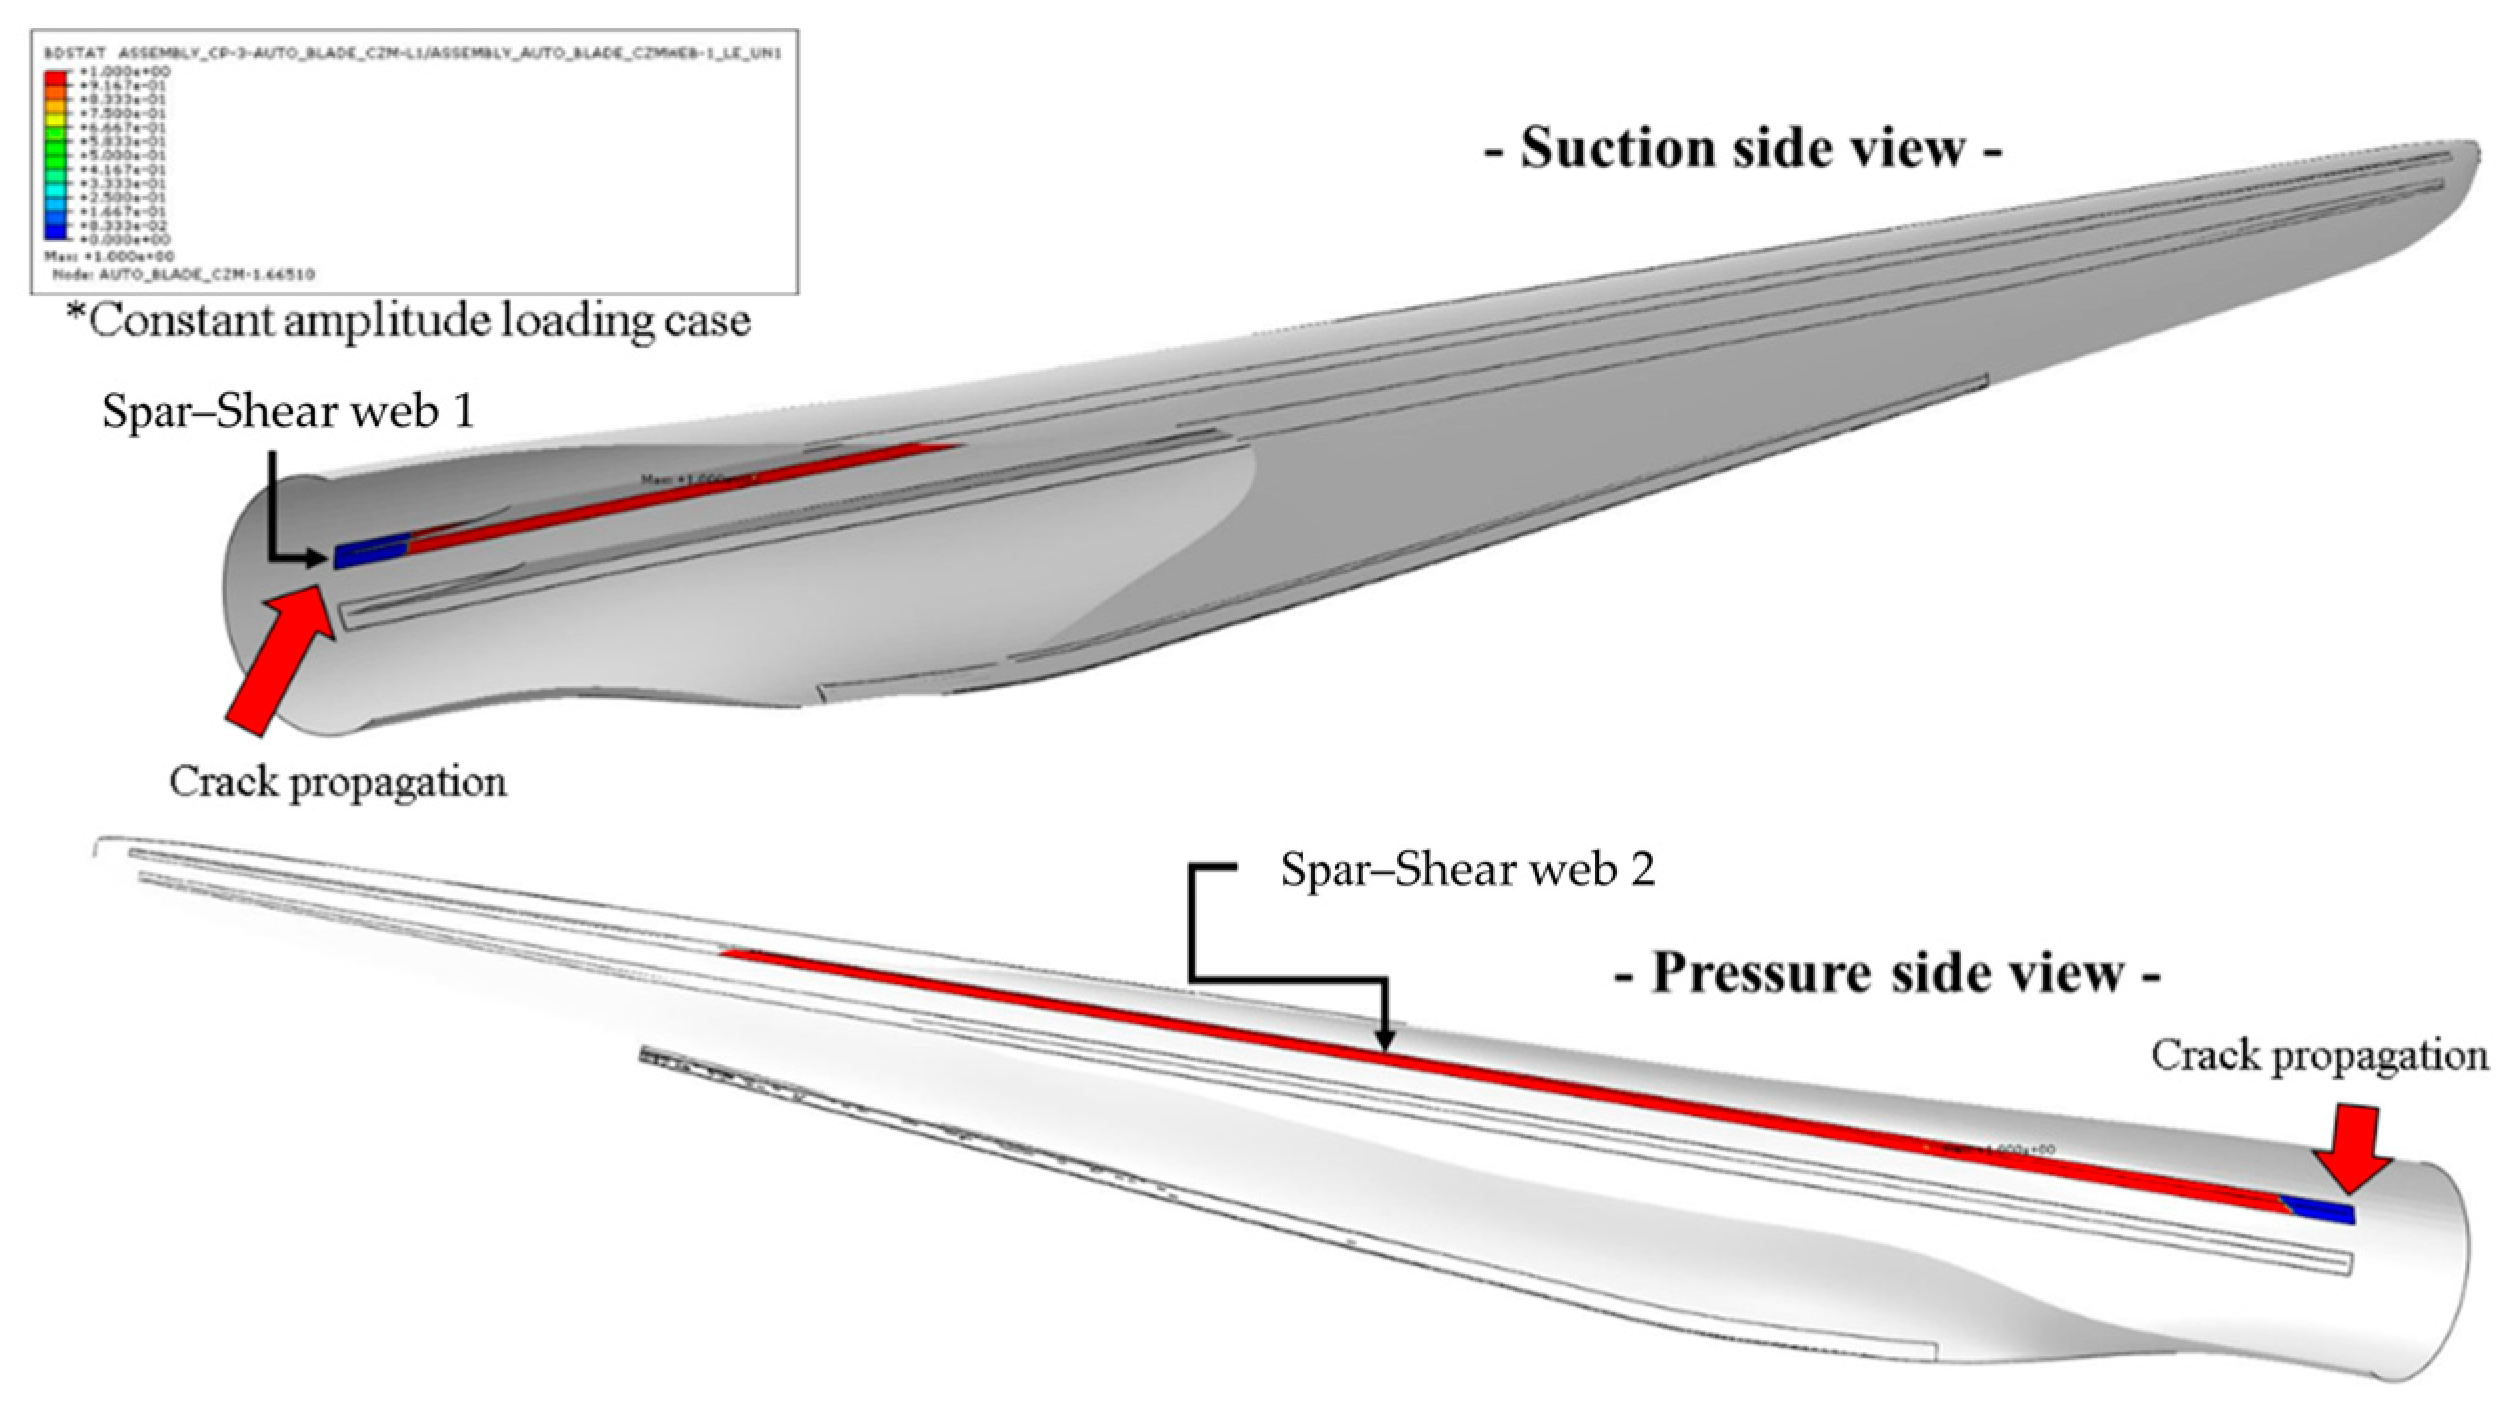
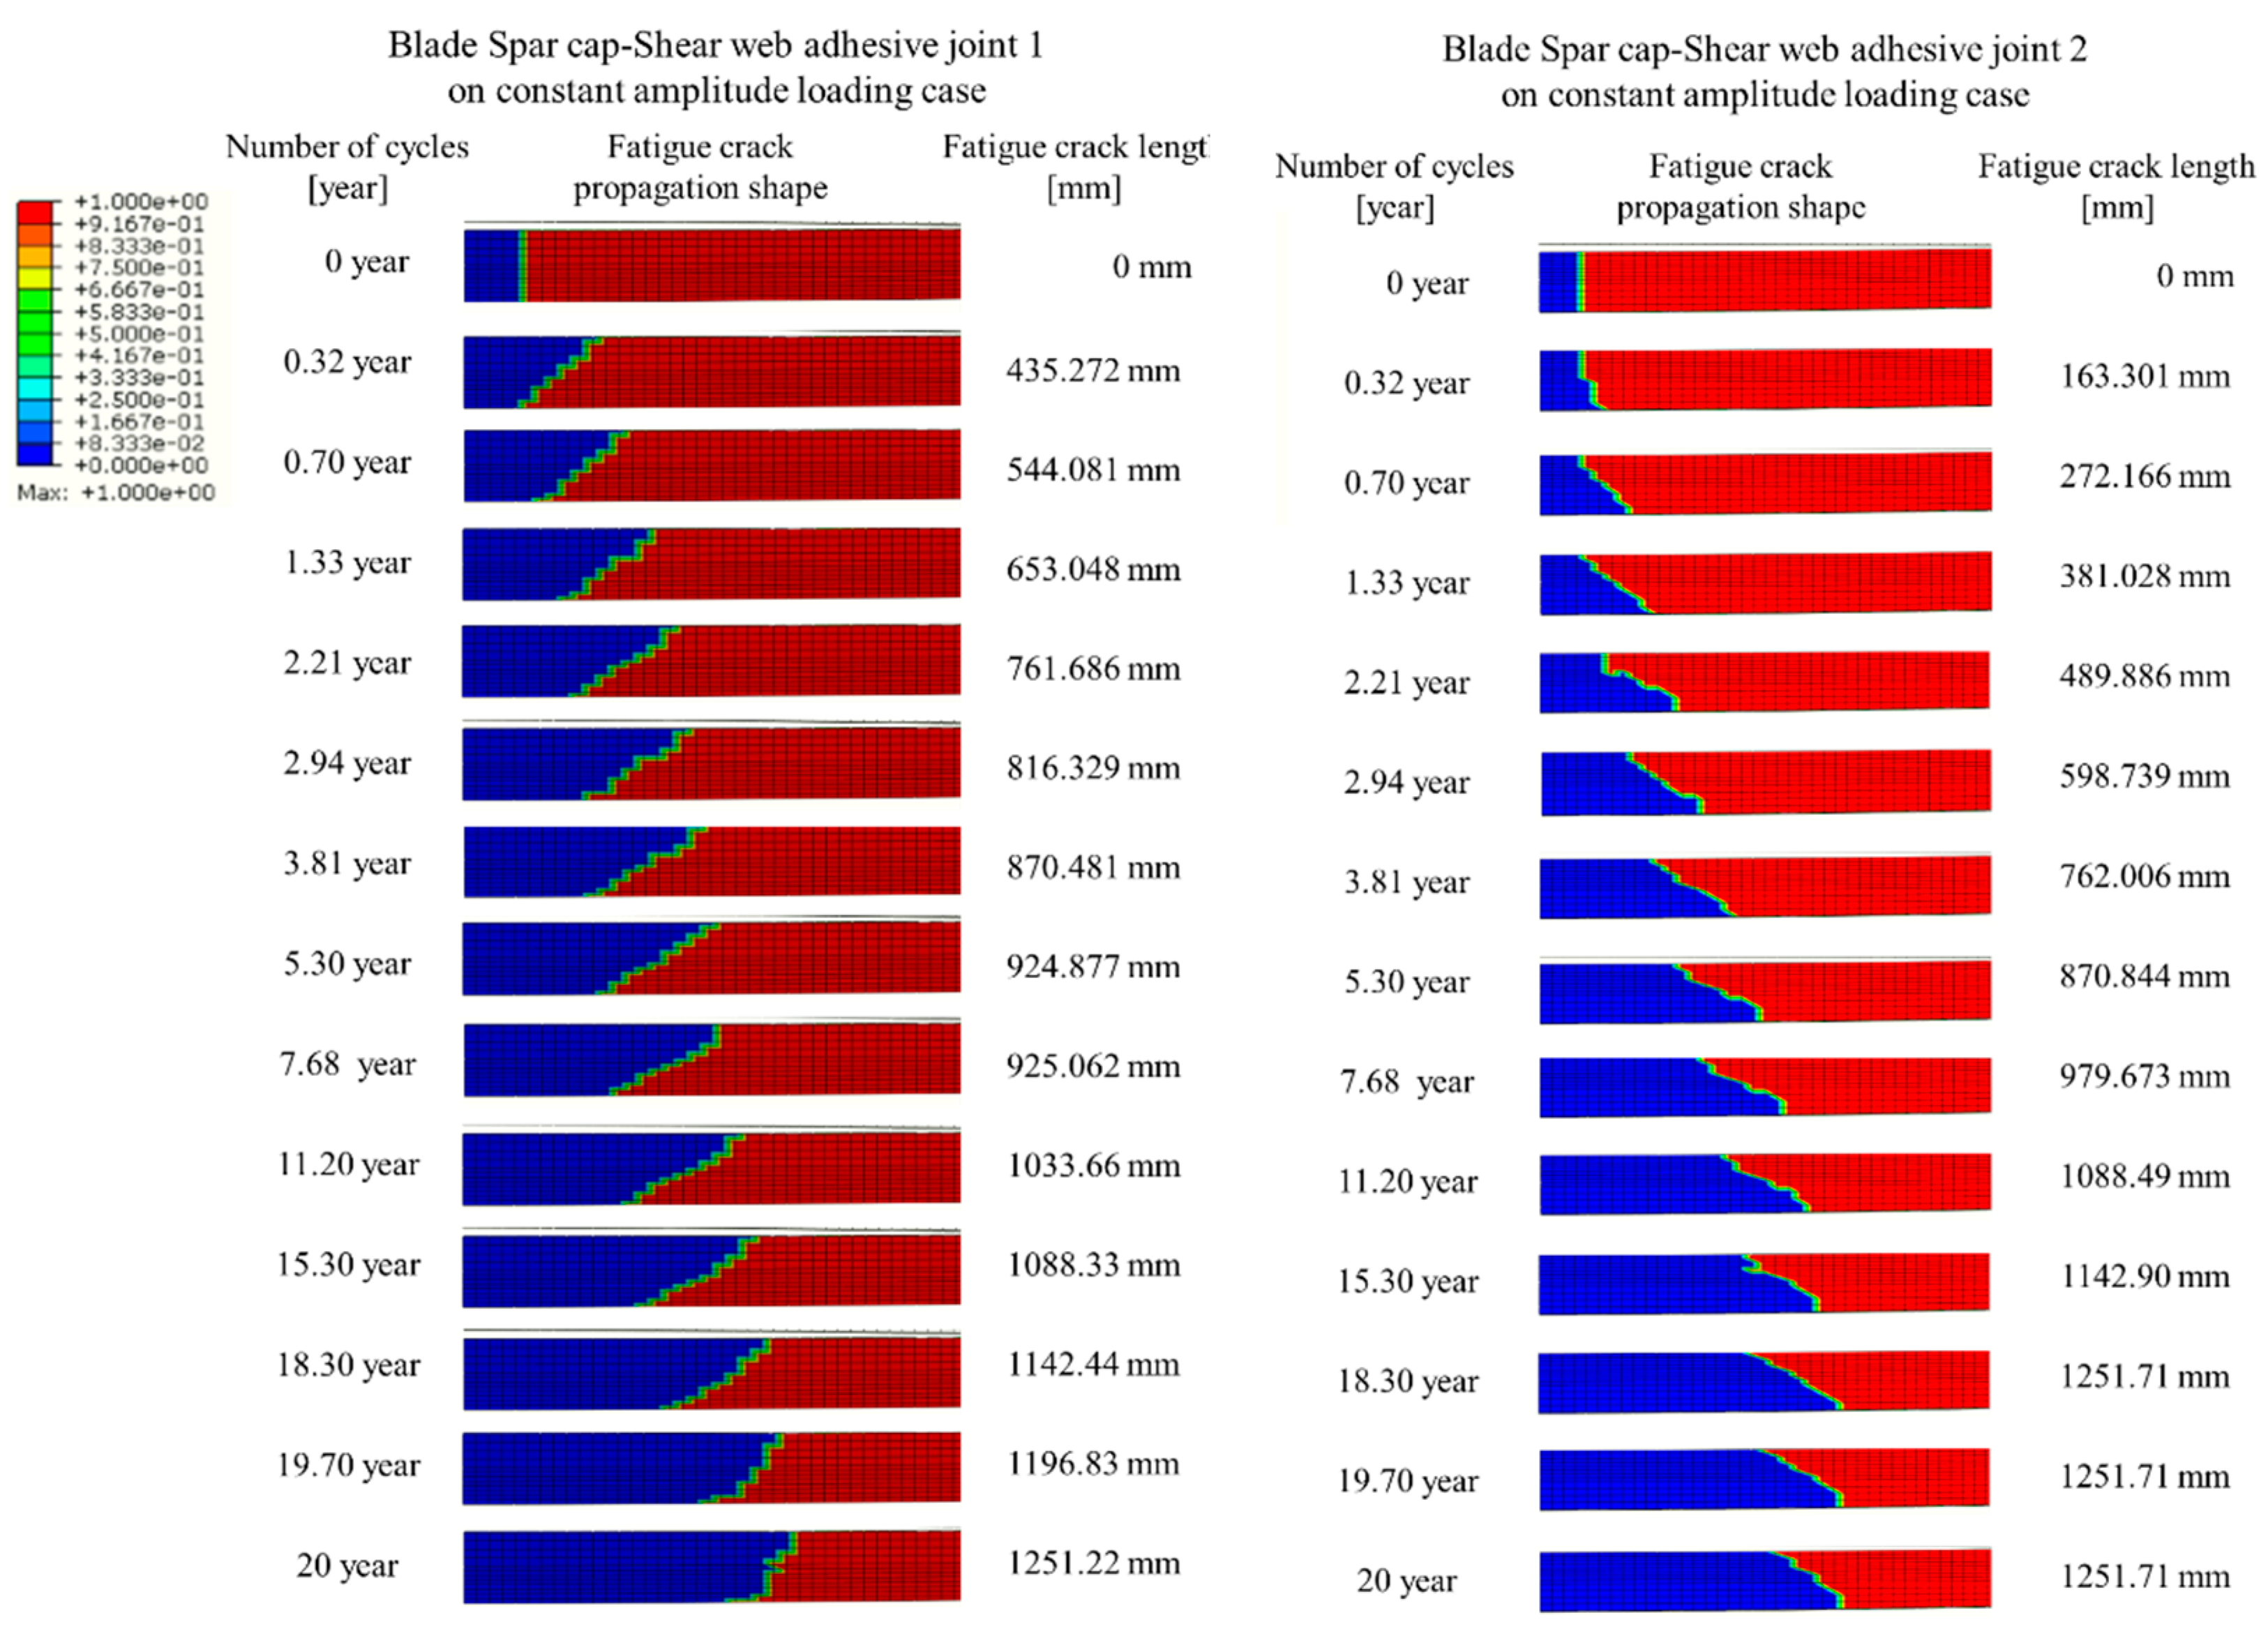
3.2.2. Wind Turbine Blade FE Model

To simulate the load acting on the blade structure over a 20-year period, we applied a load equivalent to 20 years at a position 33.825 m from the root, which corresponds to 55% of the blade length. This load was based on the constant amplitude of the static load state in the flap direction, a factor that significantly impacts the overall load distribution. We then conducted a detailed analysis of fatigue crack growth behavior in three key regions of the blade: spar cap–shear web joints 1 and spar cap–shear web joints 2, all of which began with an initial crack length of 200 mm. After the 20-year simulation, the final crack length was observed only in spar cap–shear web joints 1 and spar cap–shear web joints 2, as depicted in Figure 16.
For each adhesive joint, we examined the fatigue crack growth length in depth. As illustrated in Figure 17, the crack growth behavior in spar cap–shear web joints 1 is primarily in the flap direction under constant load, leading to the initial crack occurring at the top of the adhesive joint based on the blade skin airfoil geometry. In contrast, spar cap–shear web joints 2 exhibited a later initiation of crack growth compared to spar cap–shear web joints 1, but eventually, both experienced similar crack growth patterns. To provide a relative analysis of these characteristics, we summarized the crack growth behaviors of spar cap–shear web joints 1 and 2 in Figure 18.
It is worth noting that in spar cap–shear web joints 1, the initial crack growth occurs rapidly, primarily due to the flap load’s influence, which is directed toward the pressure side at the beginning of the loading process. However, crack growth was not observed in the TE part of the blade. As mentioned earlier, the crack growth rate in the spar cap–shear web joints is highly influenced by the flap load, whereas the TE part experiences less impact from these loading conditions.

4. Conclusions

In summary, this comprehensive study has yielded valuable insights into adhesive joint crack growth within hybrid composite laminates applied to wind turbine composite blades. Through meticulous property acquisition tests at the unit level, we have successfully quantified crack resistance across various loading conditions. Furthermore, the application of the VCCT-XFEM technique for simulating fatigue crack growth characteristics at the specimen level has bolstered the reliability of our analytical model. The thorough comparison and analysis of simulation results have enriched our findings. Significantly, our research has culminated in the computation of fatigue crack growth life for adhesive joints, incorporating our chosen analytical method with 20 years of cyclic loading data at the structural level. This analysis has provided a deeper understanding of the intricate mechanisms governing crack growth life in wind turbine blades following the initial crack’s detection. In essence, our study not only contributes to the field of wind energy technology but also establishes a robust framework for further research and development aimed at enhancing the reliability and longevity of wind turbine components. These findings hold promise for advancing the sustainable utilization of wind power on a global scale. In addition, the crack propagation speed in the blade of fatigue cracks that occur under such repetitive loads was examined. However, since only single-sized cracks were considered in this study, it was confirmed that the crack propagation speed progressed slowly, even at relatively high loads. These results ultimately predict that the crack propagation speed will increase rapidly in the future under complex multiple-crack conditions. These cracks inevitably occur in the process section as wind turbine blades become larger, and additional small cracks occur due to rapid load changes and differences between materials during operation. If these cracks progress and connect, the crack speed will rapidly increase, which is expected to shorten the blade breakage and maintenance cycle within the design life.

Author Contributions

Conceptualization, H.-G.K.; project administration, K.-W.K. All authors have read and agreed to the published version of the manuscript.

Funding

This work was partly supported by Korea Institute of Energy Technology Evaluation and Planning(KETEP) grant funded by the Korea government(MOTIE)(20224000000040, Innovation Research Center for Giant Wind Turbine System) and KETEP grant funded by the Korea government(MOTIE)(20228520020050, Development of 25MW Offshore Wind Turbine Reference Model and Conceptual Design Technology).

Data Availability Statement

The original contributions presented in the study are included in the article, further inquiries can be directed to the corresponding author.

Conflicts of Interest

The authors declare no conflicts of interest.

References

  1. Kretsis, G. A review of the tensile, compressive, flexural and shear properties of hybrid fibre-reinforced plastic. Composites 1989, 18, 13–23. [Google Scholar] [CrossRef]
  2. Swolfs, Y.; Gorbatikh, L.; Verpoest, I. Fibre hybridisation in polymer composites: A review. Compos. Part A 2014, 67, 181–200. [Google Scholar] [CrossRef]
  3. Getahun, T.; Sarp, A.; Glen, B. Flexural failure properties of fiber-reinforced hybrid laminated beam subject to three-point bending. Sci. Rep. 2024, 14, 9792. [Google Scholar]
  4. Eder, M.A.; Bitsche, R.D. Fracture analysis of adhesive joints in wind turbine blades. Wind Energy 2015, 18, 1007–1022. [Google Scholar] [CrossRef]
  5. Othman, A.K.; Homayoun, H.; Christian, L.; Gavin, G.; Peter, G.; Kirsten, D. Full-Scale Fatigue Testing of a Wind Turbine Blade in Flapwise Direction and Examining the Effect of Crack Propagation on the Blade Performance. Materials 2017, 10, 1152. [Google Scholar] [CrossRef] [PubMed]
  6. Martin, R.W.; Sabato, A.; Schoenberg, A.; Giles, R.H.; Niezrecki, C. Comparison of nondestructive testing techniques for the inspection of wind turbine blades spar caps. Wind Energy 2018, 21, 980–996. [Google Scholar] [CrossRef]
  7. Hansan, G.; Demirkan, C. Delamination-Debond Behaviour of Composite T-Joints in Wind turbine Blades. J. Phys. Conf. Ser. 2014, 524, 012043. [Google Scholar]
  8. Ji, Y.M.; Han, K.S. Fracture mechanics approach for failure of adhesive joints in wind turbine blades. Renew. Energy 2014, 65, 23–28. [Google Scholar] [CrossRef]
  9. Philipp, U.H.; Kim, B. Effect of Trailing Edge Damage on Full-Scale Wind Turbine Blade Failure. In Proceedings of the 20th International Conference on Composite Materials, Copenhagen, Denmark, 19–24 July 2015. [Google Scholar]
  10. Rafiee, R.; Hashemi-Taheri, M.R. Failure analysis of a composite wind turbine blade at the adhesive joint of the trailing edge. Eng. Fail. Anal. 2021, 121, 105148. [Google Scholar] [CrossRef]
  11. Lahuerta, F.; Ruiter, M.J.; Espinosa, L.; Koorn, N.; Smissaert, D. Assessment of Wind Turbine Blade Trailing Edge Failure with Sub-Component Tests. In Proceedings of the 21st International Conference on Composite Materials, Xi’an, China, 20–25 August 2017. [Google Scholar]
  12. Haselbach, P.U. An advanced structural trailing edge modelling method for wind turbine blades. Compos. Struct. 2017, 180, 521–530. [Google Scholar] [CrossRef]
  13. ASTM D5528; Standard Test Method for Mode I Interlaminar Fracture Toughness of Unidirectional Fiber-Reinforced Polymer Matrix Composites. ASTM International: West Conshohocken, PA, USA, 2007.
  14. ASTM D7905/D7905M; Standard Test Method for Determination of the Mode II Interlaminar Fracture Toughness of Unidirectional Fiber Reinforced Polymer Matrix Composites. ASTM International: West Conshohocken, PA, USA, 2014.
  15. ASTM D6671/D6671M; Standard Test Method for Mixed Mode I-Mode II Interlaminar Fracture Toughness of Unidirectional Fiber Reinforced Polymer Matrix Composites. ASTM International: West Conshohocken, PA, USA, 2006.
  16. Kim, H.G.; Jang, Y.J.; Kang, K.W. Evaluation of Interlayer Fracture Toughness of Laminated Biaxial/Triaxial Hybrid Composite for Wind Turbine Blade. J. Wind Energy 2021, 12, 68–79. [Google Scholar]
  17. Shokrieh, M.M.; Rafiee, R. Simulation of fatigue failure in a full composite wind turbine blade. Compos. Struct. 2006, 74, 332–342. [Google Scholar] [CrossRef]
  18. Raman, V.; Drissi-Habti, M.; Guillaumat, L.; Khadhour, A. Numerical simulation analysis as a tool to identify areas of weakness in a turbine wind-blade and solutions for their reinforcement. Compos. Part B Eng. 2016, 103, 23–29. [Google Scholar] [CrossRef]
  19. Jang, Y.J.; Jin, J.W.; Lee, J.H.; Lee, S.I.; Kang, K.W. Long-term durability of offshore wind turbine composite blades based on nonlinear load behavior due to pitch movement. J. Mech. Sci. Technol. 2020, 34, 2347–2355. [Google Scholar] [CrossRef]
  20. Cui, W.C.; Wisnom, M.R.; Jones, M.A. Comparison of Failure Criteria to Predict Delamination of Unidirectional Glass/Epoxy Specimens Waisted Through the Thickness. Composites 1992, 23, 158–166. [Google Scholar] [CrossRef]
  21. Benzeggagh, M.L.; Kenane, M. Measurement of Mixed-Mode Delamination Fracture Toughness of Unidirectional Glass/Epoxy Composites with Mixed-Mode Bending Apparatus. Compos. Sci. Technol. 1996, 56, 439–449. [Google Scholar] [CrossRef]
  22. Rybicki, E.F.; Kanninen, M.F. A Finite element calculation of stress intensity factors by a modified crack closure integral. Eng. Fract. Mech. 1977, 9, 931–938. [Google Scholar] [CrossRef]
  23. Deobald, L.; Mabson, G.; Engelstad, S.; Rao, M.; Gurvich, M.; Seneviratne, W.; Perera, S.; O’Brien, T.; Murri, G.; Ratcliffe, J.; et al. Guidelines for VCCT-Based Interlaminar Fatigue and Progressive Failure Finite Element Analysis; NASA/TM-2017-219663; 2017. Available online: https://ntrs.nasa.gov/citations/20170011484 (accessed on 10 August 2024).
  24. Paris, P.; Gomaz, M.; Anderson, W. A Rational Analytic Theory of Fatigue. Trend Eng. 1961, 13, 9–14. [Google Scholar]
  25. Francisco, L.; Rogier, N. “Testing Methods for Thick Laminates and Fracture models Calibrations”, Wind Turbine Materials and Constructions (WMC) Knowledge Centre. Available online: https://www.bondvoormaterialenkennis.nl/wp-content/uploads/2021/05/Testing-Methods-for-Thick-Laminates-and-Fracture-Models-Calibrations_R.-Lahuerta.pdf (accessed on 10 August 2024).
  26. ASTM E647; Standard Test Method for Measurement of Fatigue Crack Growth Rates. ASTM International: West Conshohocken, PA, USA, 2015.
  27. SOBRIETY Corp. MercuryRT Real-Time Tracking System. Available online: http://www.dynrot.eu/t_testing_en.htm (accessed on 10 August 2024).
  28. ABAQUS 2021 User’s Manual; Dassault System’s Simulia Corp.: Providence, RI, USA, 2021.
  29. Boscolo, M.; Zhang, X. A modelling technique for calculating stress intensity factors for structures reinforced by bonded straps. Part II: Validation. Eng. Fract. Mech. 2010, 6, 896–907. [Google Scholar] [CrossRef]
  30. Sekiguchi, Y.; Sato, C. Effect of Bond-Line Thickness on Fatigue Crack Growth of Structural Acrylic Adhesive Joints. Materials 2021, 14, 1723. [Google Scholar] [CrossRef]
  31. Mallikarachchi, H.M.Y.C.; Ubamanyu, K. Predicting Residual Fatigue Life with Finite Element Analysis. Conf. Pap. 2016. Available online: https://www.researchgate.net/publication/309727305_Predicting_Residual_Fatigue_Life_with_Finite_Element_Analysis (accessed on 10 August 2024).
Figure 1. Finite element propagation characteristics of pure mode 1.
Applsci 14 07929 g001
Figure 2. Experimental equipment of fatigue crack growth test.
Applsci 14 07929 g002
Figure 3. Test specimen of DCB (mode I).
Applsci 14 07929 g003
Figure 4. Fatigue analysis conditions by specimens.
Applsci 14 07929 g004
Figure 5. Analysis of fatigue loading conditions by specimens.
Applsci 14 07929 g005
Figure 6. Blade fatigue crack propagation analysis model.
Applsci 14 07929 g006
Figure 7. Constant amplitude flap load condition (Case 1).
Applsci 14 07929 g007
Figure 8. Fatigue test crack length curve at different load ratios: (a) R = 0.1; (b) R = 0.3; (c) R = 0.5.
Applsci 14 07929 g008
Figure 9. Cycles–fracture energy rate curve of fatigue test at different load ratios: (a) R = 0.1; (b) R = 0.3; (c) R = 0.5.
Applsci 14 07929 g009
Figure 10. da/dN–fracture energy rate curve of fatigue test at different load ratios: (a) R = 0.1; (b) R = 0.3; (c) R = 0.5.
Applsci 14 07929 g010
Figure 11. da/dN–fracture energy rate curve of fatigue test at total.
Applsci 14 07929 g011
Figure 12. Analysis and test results of specimens at different load ratios: (a) R = 0.1; (b) R = 0.3; (c) R = 0.5.
Applsci 14 07929 g012
Figure 13. Analysis results of specimens at R = 0.1.
Applsci 14 07929 g013
Figure 14. Analysis results of specimens at R = 0.3.
Applsci 14 07929 g014
Figure 15. Analysis results of specimens at R = 0.5.
Applsci 14 07929 g015
Figure 16. Fatigue crack propagation shape of blade under constant load conditions.
Applsci 14 07929 g016
Figure 17. Fatigue crack propagation shape of the blade at spar cap–shear web joint 1 and joint 2 under constant load conditions.
Applsci 14 07929 g017
Figure 18. Fatigue crack length of blade at spar cap–shear web joints under constant load conditions.
Applsci 14 07929 g018
Table 1. Material properties of FM73.
FM73
Stiffness [MPa]KI4500
KII4270
KIII4270
Strength [MPa]SI6492
SII113
SII113
Table 2. Material properties of GFRP composites.
3axis GFRP2axis GFRP
E11 [MPa]26,70010,900
E22 [MPa]13,30010,900
G13 [MPa]74,60011,600
ν0.5130.646
ρ [kg/m3]22672243
Table 3. Specifications for a 5 MW wind turbine.
Rated power (MW)5Blade set angle (°)0
ClassIIARotor shaft tilt angle (°)5
No. of blades3Maximum chord length (m)4.1
Blade length (m)61.5Rotor overhang (m)5
Hub height (m)90.55Rotor positionUpwind
Tower height (m)88.15TransmissionGearbox
Cut-in wind speed (m/s)3Power controlPitch
Rated wind speed (m/s)11.4Fixed/VariableVariable
Cut-out wind speed (m/s)25Gear Ratio97
Rated rotational speed (rpm)12.1Substructure typeJacket
Table 4. Fracture energy rate of GFRP specimens.
TestR
( δ m i n / δ m a x )
Fracture   Energy   Rate   [   K J / m 2 ]
G c G p l G t h
10.11.121.180.12
20.31.121.130.13
30.51.121.140.14
Table 5. Material properties factor of GFRP composites.
TestR c 1 c 2 c 3 c 4 r 1 r 2
10.12869.4−3.0850.02372.95540.1071.058
20.3712.4−4.0650.08443.93940.1191.008
30.5783.76−4.1460.07043.99690.1251.017
Disclaimer/Publisher’s Note: The statements, opinions and data contained in all publications are solely those of the individual author(s) and contributor(s) and not of MDPI and/or the editor(s). MDPI and/or the editor(s) disclaim responsibility for any injury to people or property resulting from any ideas, methods, instructions or products referred to in the content.

