Article

Towards Green and Low-Carbon Transformation via Optimized Polygeneration System: A Case Study of the Iron and Steel Industry

1
Institute of Mineral Resources, Chinese Academy of Geological Sciences, 26 Baiwanzhuang Street, Beijing 100037, China
2
State Key Joint Laboratory of Environment Simulation and Pollution Control (SKLESPC), School of Environment, Tsinghua University, Beijing 100084, China
3
School for Business and Society, University of York, York YO10 5GH, UK
4
Department of Civil Engineering, The University of Hong Kong, Hong Kong 999077, China
*
Authors to whom correspondence should be addressed.
Appl. Sci. 2024, 14(17), 8052; https://doi.org/10.3390/app14178052
Submission received: 30 July 2024 / Revised: 29 August 2024 / Accepted: 2 September 2024 / Published: 9 September 2024
(This article belongs to the Section Green Sustainable Science and Technology)

Abstract

:
Polygeneration systems have significant potential for energy conservation and emission reduction and can effectively promote green and low-carbon development in energy-intensive industries, such as the iron and steel industry. However, its application faces the difficulty in technology selection under multiple objectives simultaneously, which is to determine the technology portfolio to achieve the synergy of energy conservation goals and air pollutant emission reduction goals, as well as ensure the economic benefits of the enterprises. This study investigated a case polygeneration system where the iron and steel plant are the core with four polygeneration paths and twenty polygeneration technologies. A multi-objective optimization model is developed to select the optimal technology combination of each polygeneration path under energy conservation, emission reduction, and cost control objectives, which is solved by the non-dominated sorting genetic algorithm-II (NSGA-II). The optimal results can reach significant energy conservation and emission reduction effects while obtaining economic benefits. However, synergistic and conflicting relationships among the objectives exist in both scales of iron and steel plants. The final decision scheme can achieve the mitigations equivalent to 15.9–27.1% and 16.3–42.6% of the energy consumption and air pollutant emissions of the steel enterprises with annual production of 3 Mt/a and 9 Mt/a, respectively. There are thirteen and twelve technologies that are selected as the final decision scheme in the polygeneration system in these two case enterprises. These findings demonstrate the significant roles the polygeneration system plays and provide critical insights and methodology in the technical selection of the polygeneration system.

1. Introduction

Over the past few decades, energy conservation and air pollutant emission control have been key environmental management issues for the world [1,2,3,4]. As the important source of energy consumption and pollution emissions, the industrial sector has long been the concern for energy conservation and emission reduction, especially for the iron and steel industry [5,6,7,8]. Iron and steel production is accompanied by a large amount of energy consumption and pollutant emissions (including SO2, NOx, PM, and other pollutants), so how to achieve low-carbon and clean production in the iron and steel industry has always been a concern of the government, enterprises, and scholars. Among many energy conservation and pollutant emission reduction technologies, polygeneration systems have gained attention due to their significant energy, environmental, and economic benefits [9,10,11,12].
In general, a polygeneration system for the industrial sector consists of two or more industries, and in which waste or by-products produced by some industries can be consumed by other industries [13,14], thus their overall environmental and energy impact could be reduced, and in some cases, additional economic benefit will also be created. Therefore, polygeneration systems are an important way to promote circular economy and enhance the efficiency of resource utilization.
There is a large amount of waste or by-products that will be produced in the production process of iron and steel [15,16], such as steel slag, waste heat, and waste pressure. These wastes or by-products can be used in the chemical, building materials, and power industries. In other words, extensive material and energy utilization pathways exist between the iron and steel, chemical, building materials, and power industries. For instance, coke oven gas and blast furnace gas in the iron and steel industry can be used to manufacture chemical products, blast furnace slag can be used to prepare building materials, and the waste heat and pressure generated from sintering, coking, and blast furnaces can be used to generate electricity.
The contribution of this study is to establish a comprehensive technical selection framework for the polygeneration system based on the chain of “supplier—waste/by-products—technologies—adopter”, and the trade-off of energy, environmental, and economic benefits was considered, as well as the trade-off between various environmental targets, such as SO2 reduction and NOx reduction. A multi-objective optimization model was developed in this study to address the above issues, and the iron and steel industry was taken as an example for analysis. The results of this study can provide insights for energy conservation and emission reduction in the iron and steel, power, chemical, and building materials industries, and these methods can also be applied to other industrial sectors.
The remainder of this study is organized as follows: Section 2 is the literature review. Section 3 introduces the methods and materials, including the polygeneration system simulation, multi-objective optimization model, and data processing. The results and discussion are presented in Section 4, while Section 5 reports the main conclusions of this study and some suggestions for the promotion of polygeneration systems in the iron and steel, chemical, building materials, and power industries in China.

2. Literature Review

Compared to the energy conservation and emission reduction system within a single industry, the system based on the polygeneration process is more complex and uncertain [17,18,19]. As a result, many studies have focused on the simulation and performance evaluation of polygeneration systems. Among them, techno-economic evaluation is a typical evaluation criterion since the economic effect is the primary motivation to build the system. For example, Kim et al. [20] and Lee et al. [21] had conducted techno-economic evaluation in a polygeneration system from coke oven gas and steel-mill off-gases, while similar evaluations can be seen in the system based on the LNG-regasification [22,23], catalytic hydropyrolysis [24], and agricultural residue [25]. In addition, energy efficiency is widely regarded as a vital evaluation indicator, especially in the polygeneration system of energy [26,27]. Shi et al. [28] have compared a custom coal-fired power plant with air-blown IGCC polygeneration ones and found that there is a 6% increase in energy efficiency after adopting the polygeneration system. Soutullo et al. [29] have taken three Spanish cities as examples to investigate the energy performance of the power–heat polygeneration plant in different ways. Environmental indicators have been considered in studies via a series of methods such as emission coefficient [30], life-cycle assessment [31,32,33], and environmental cost analysis [34]. These methods have proved the advantages of polygeneration systems via different evaluation criteria. However, since the evaluation could only be conducted among limited scenarios, these studies have usually focused on the current status of the system and thus cannot support the decision-makers to select the technologies in the polygeneration system and choose the optimal schemes.
To overcome this shortcoming, many studies have focused on the optimization and design of the polygeneration and have adopted multiple optimal methods. Among them, mixed-integer programming is a common model, usually taking best economic performance as the objective. Liu et al. [35] have built a mixed-integer nonlinear programming model to search for an optimal economic profit in an electricity–methanol polygeneration plant. Urbanucci [36] has summarized the advantages and limitations of mixed-integer nonlinear programming in solving the problems of polygeneration system designs. Other research has also adopted this method to optimize biomass co-generating technology selection [37], the selection of the contracted power from the grid within different renewable sources [38], and the building of microgrid polygeneration systems [39]. Though these studies have supported the improvement of polygeneration systems, they have solved single objective optimization problems and neglected other energy and environmental objectives as well as the trade-off relationship between them. In this situation, the optimal results they have obtained may have biases from the comprehensive optimal ones.
Some other studies have avoided this problem and have considered two or more objectives simultaneously. Khanmohammadi and Atashkari et al. [40] have investigated the optimal material and energy flows in a biomass polygeneration system under maximum exergy efficiency and minimum cost. Yeşilkaya et al. [41] have focused on the forest industry and designed a bi-objective model to seek for the lowest economic cost and highest ecological effects. These studies have transferred multi-objectives into single ones through different methods, such as the monetary and weighted sum method, with the relationship between objectives subjectively defined. Another type of multi-objective solution method is the searching algorithm, which also has wide applications. For example, both Ahmadi et al. [42] and Liu et al. [43] have adopted evolutionary algorithms in energy polygeneration system designs by combining energy, exergy, and economic objectives.
Compared with single emission reduction technology, polygeneration systems have many advantages in energy efficiency, economic benefits, and coordinated emission reduction, especially in the iron and steel industry, which is an energy- and emission-intensive industry. Through the cascade of waste or by-product utilization technologies, a polygeneration system can be formed with the core of the iron and steel industry, including the chemical, building materials, and power industries. However, it should be emphasized that the technical system of the polygeneration system is quite complex, and its quantitative evaluation needs to be based on system simulation. Meanwhile, it is necessary to manage the polygeneration system from the perspective of multi-objective optimization because the system involves multiple objectives and there are synergetic and conflicting relationships among them. To sum up, the simulation and analysis of the entire polygeneration system will be carried out in this study in order to quantify the benefits of different technologies and determine the optimal technology path under multiple objectives and constraints, as well as put forward the finial optimal scheme.

3. Method and Material

3.1. Polygeneration System Simulation

In this section, the material and energy metabolism paths of steel, chemical, building materials, and power industries will be identified first, and then the simulation of polygeneration systems will be modeled based on the bottom-up modeling method. The modeling process follows the chain of “supplier—waste/by-products—technologies—adopter”, where the iron and steel industry are the suppliers in this study and the chemical, building materials, and power industries are the adopters. The production of wastes and by-products in the iron and steel industry is shown in Figure 1 [44,45].
It can be seen from Figure 1 that there are eight types of waste/by-products in the steel industry, which are coke sensible heat, sintering waste heat, blast furnace gas residual pressure, coke oven gas, blast furnace gas, desorbed gas, blast furnace slag, and converter slag, respectively. According to the utilization approaches of these waste/by-products and the matching and applicability issues of raw materials, processes, and technologies in the polygeneration system, 4 polygeneration paths are designed in this study, and a total of 20 technologies (No. T1–T20) are identified in this study to address these waste/by-products [46,47,48], as follows:
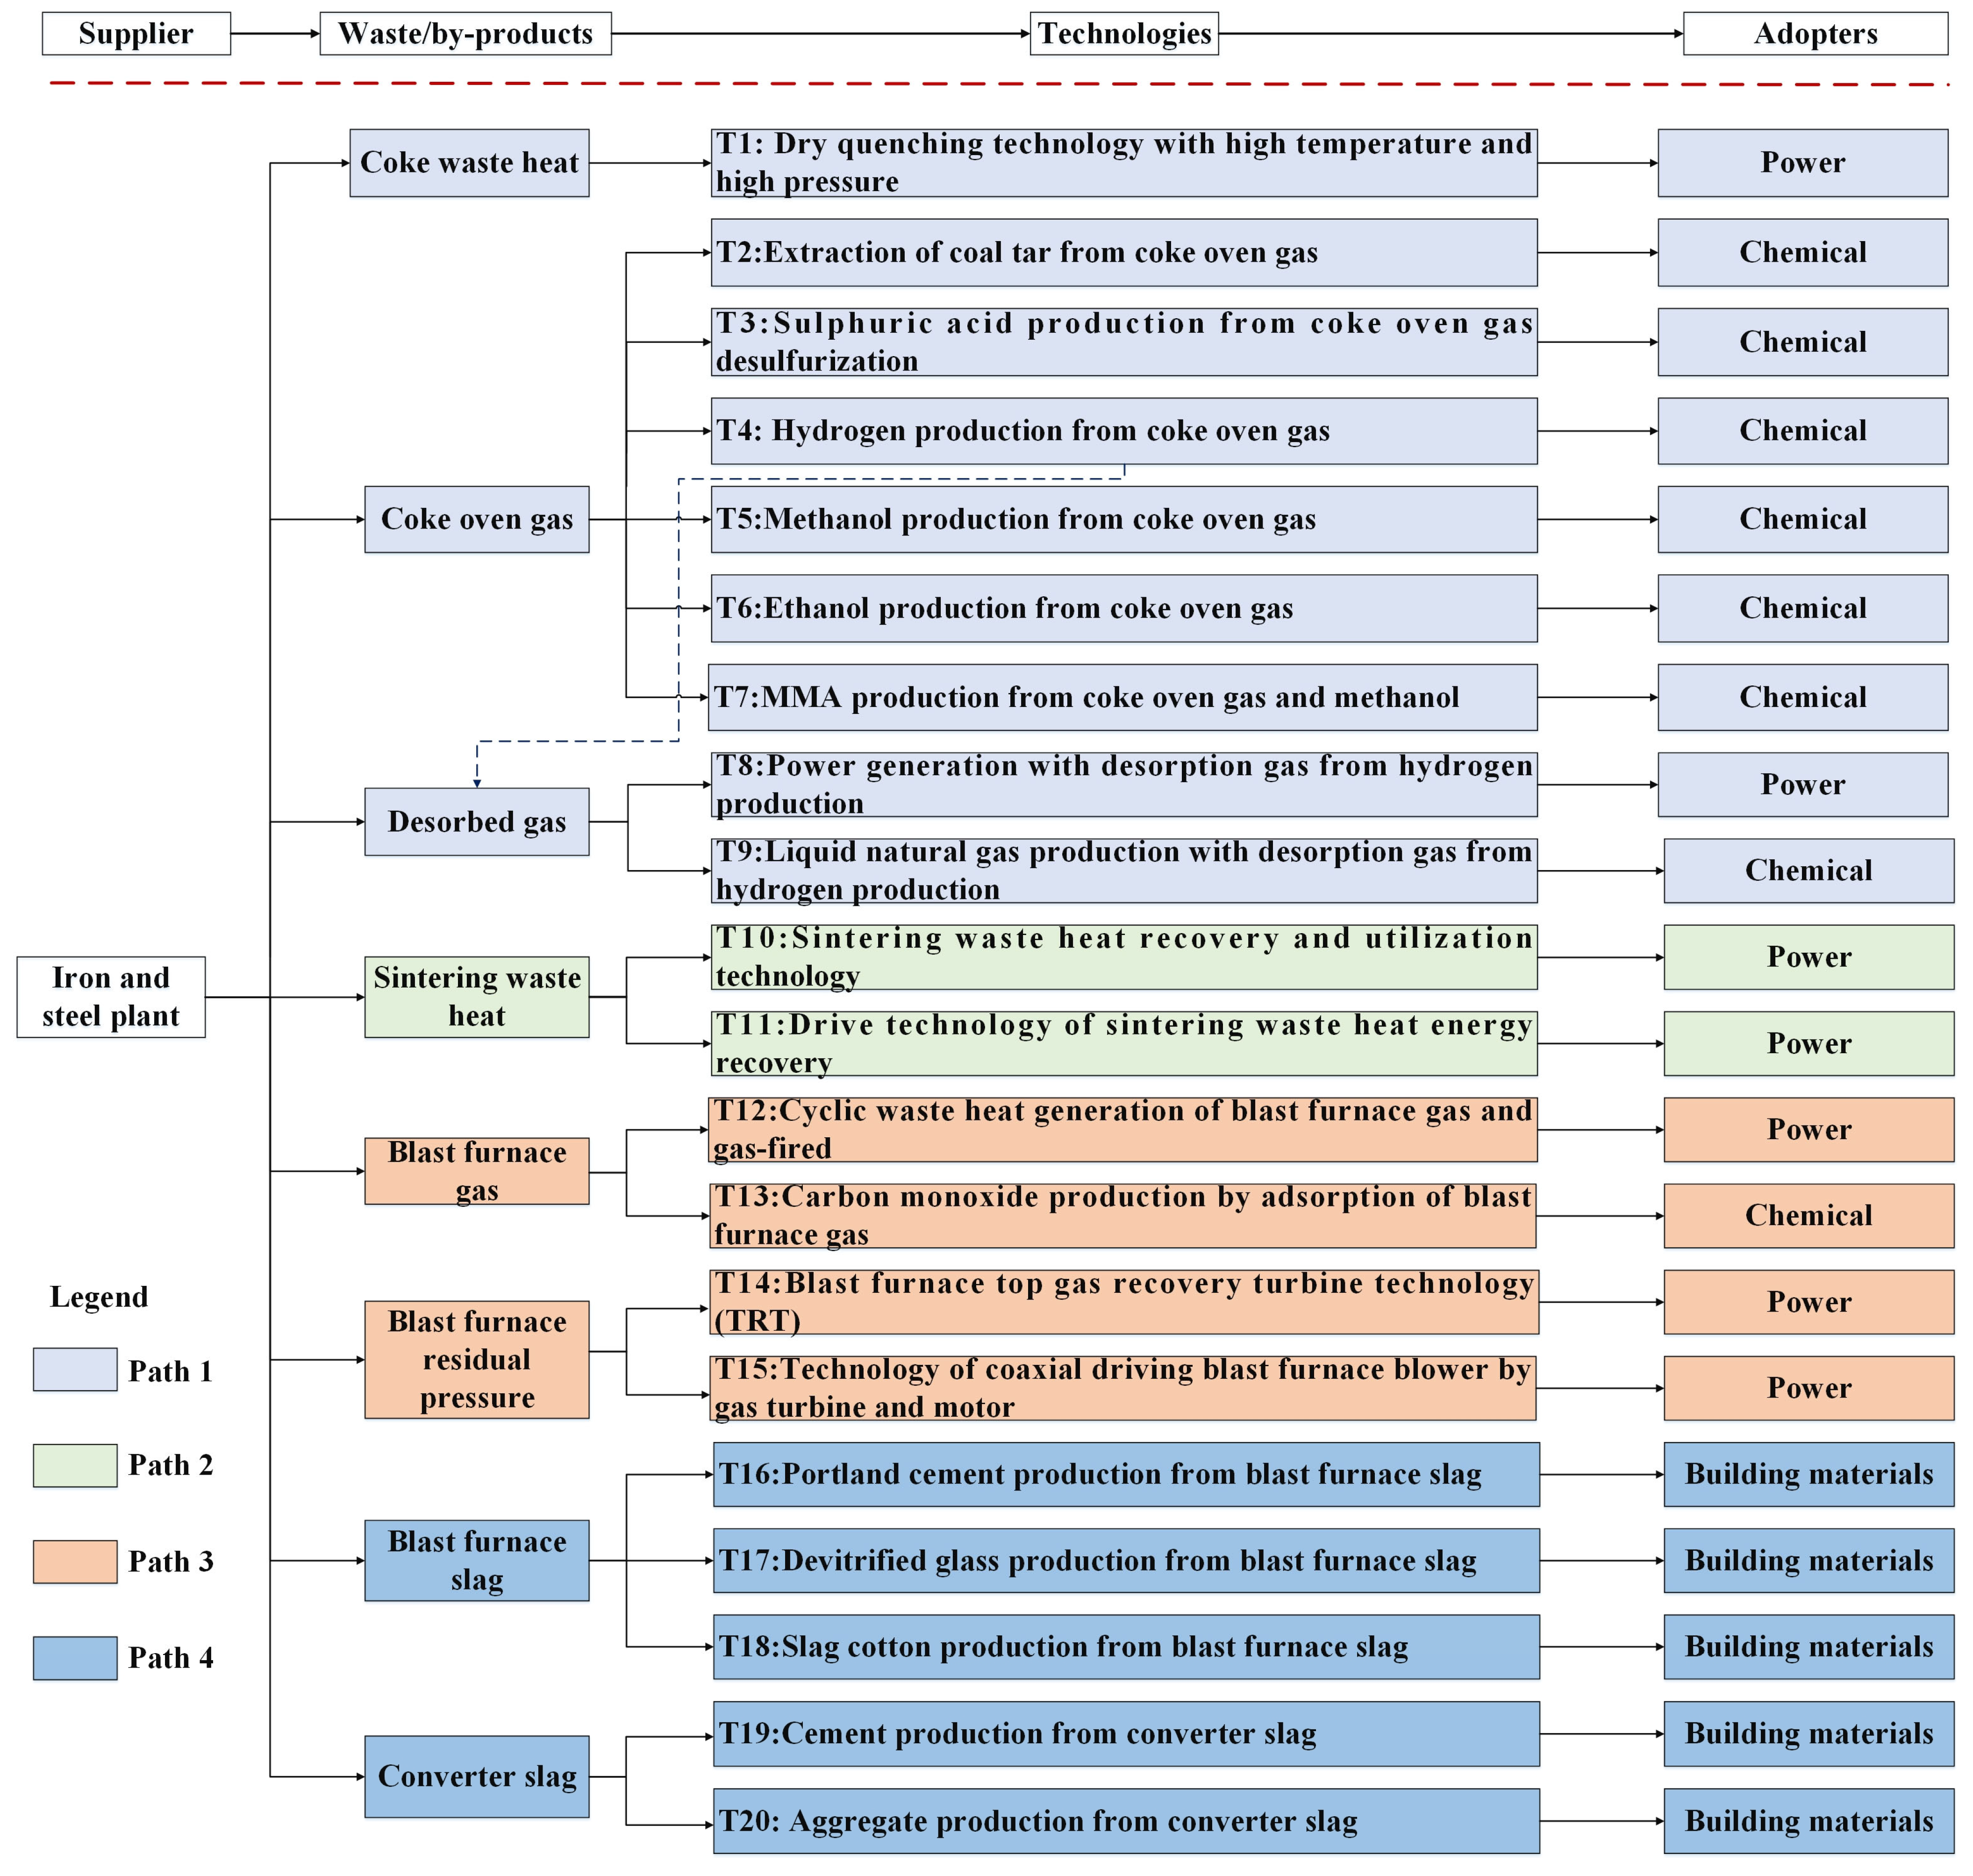
  • Path 1: Coke waste heat/Coke oven gas/Desorbed gas → T1–T9 → Power/Chemical products.
  • Path 2: Sintering waste heat → T10 and T11 → Power.
  • Path 3: Blast furnace gas/Blast furnace residual pressure → T12–T15 → Power/Chemical products.
  • Path 4: Blast furnace slag/Converter slag → T16–T20 → Building materials. The specific information was shown in Figure 2.
(a)
Path 1: Polygeneration system of iron and steel industry, chemical industry, and power industry based on coking process. In this path, coke waste heat and coke oven gas generated in the coking process would be used for power generation and chemical product production, including coal tar, sulfuric acid, methanol, ethanol, and methyl methacrylate (MMA).
(b)
Path 2: Polygeneration system of iron and steel industry and power industry based on sintering process. In this path, sensible heat from the sintering process would be used for power generation and directly converted into coupling-driven kinetic energy.
(c)
Path 3: Polygeneration system of iron and steel industry, chemical industry, and power industry based on ironmaking process. In this path, the blast furnace gas, blast furnace top pressure, and other by-products generated in the ironmaking process would be used for power generation or the preparation of carbon monoxide (CO).
(d)
Path 4: Polygeneration system of the iron and steel industry and building materials industry based on ironmaking and steelmaking processes. In this path, blast furnace slag, converter slag, and other major solid by-products would be used to prepare building materials, such as cement, devitrified glass, and aggregate.
It can be seen from Figure 2 that a total of 9 technologies are included in polygeneration path 1, i.e., T1–T9. Similarly, there are 2, 4, and 5 technologies embodied in polygeneration path 2 (T10, T11), polygeneration path 3 (T12–T15), and polygeneration path 4 (T16–T20), respectively.

3.2. Multi-Objective Optimization Model for Polygeneration System

In this section, the energy, environmental, and economic benefits of each polygeneration path will be evaluated. However, these quantitative results cannot be directly used to guide the polygeneration path application because the issue of technology selection in the actual polygeneration system is not considered in these theoretical results. Given the output of waste/by-products and the scale economy issue, there must be a choice between various technical paths, which means only one or several technologies in the polygeneration system can be adopted as the final application scheme. Therefore, a multi-objective optimization model will also be developed in this section to select the optimal technology or technology combination of each polygeneration path so as to maximize the energy, environmental, and economic benefits and guide enterprises to adopt the optimal path to realize the comprehensive utilization of waste/by-products.

3.2.1. Variables

The variables are the utilization ratios of the technologies. Here, the utilization ratio of a technology is defined as the proportion of by-products that are utilized by the technology to their total generation amounts. Therefore, the variables should range between 0 and 1.

3.2.2. Objectives

In addition to ensuring the realization of single-dimension environmental goals, including energy conservation and pollution emission reduction, the synergistic and conflicting effects of various technologies on environmental objectives and the corresponding economic benefit are also considered in this study. Consequently, three optimization objectives are set in this study, including: (a) the maximum of energy conservation; (b) the maximum of pollutants emission reduction; and (c) the maximum of economic benefits. It should be emphasized that SO2, NOx, and PM will be converted into unified pollutant emission indicators according to their pollutant emission trading prices in order to simplify the calculation.
The energy benefit of polygeneration systems includes two parts: direct energy benefit and indirect benefit. The former refers to energy saved, or secondary energy generated in the way of energy utilization, while the latter refers to the energy consumption of resources. Production and processing can be reduced by reducing the resource consumption of the given sink industry under the resource utilization approach. Thus, the energy benefit of the polygeneration system can be calculated by Equation (1).
E C = C S O × p r o b p t S R p r o × G F p r o , b p × R a t i o p r o , b p , t × ( e E t , e × E c o e e + r e s E t , r e s × E c o e r e s )
where E C represents the energy benefit of a polygeneration system; C S O is the crude steel output; p r o is the production process; b p is the by-product; t is the polygeneration technology; e is the type of fuel; r e s is the type of resource; S R p r o is the process product coefficient of p r o ; G F p r o , b p is the production coefficient of by-product b p from the production process p r o ; R a t i o p r o , b p , t is the utilization ratio of by-products b p from the production process p r o when applying technology t ; E t , e is the conservation amount of fuel e contributed by technology t ; E c o e e is the conversion coefficient of fuel e to standard coal; E t , r e s is the conservation amount of resource r e s contributed by technology t ; and E c o e r e s is the energy consumption coefficient of resource r e s in the production process.
The environmental benefits of polygeneration systems are mainly reflected in the reduction in three types of air pollutants in this study, which are SO2, NOx, and PM, respectively. Similar to energy benefit, environmental benefit can also be divided into direct and indirect benefit, where direct benefit refers to the pollutants emissions reduction from the polygeneration system with polygeneration technologies application, and indirect benefit refers to the pollutants emissions avoided by saving energy and resources with polygeneration technologies application. Therefore, the environmental benefit of polygeneration systems can be calculated by Equation (2).
E R p = C S O × p r o b p t S R p r o × G F p r o , b p × R a t i o p r o , b p , t × ( D E R t , p + e E t , e × E F e , p + r e s E t , r e s × E F r e s , p )
where E R is the emission reduction amount of pollutant p ; D E R t , p is the direct emission reduction effect of technology t on pollutant p ; E F e , p is the pollutant p mission factor of fuel e during the production or combustion process; and E F r e s , p is the pollutant p mission factor of resource r e s during the production process.
The economic benefits of polygeneration systems are mainly determined by investment in fixed assets, operation and maintenance expenses, and the economic benefits of by-products. The investment in fixed assets refers to the equipment investment required by various polygeneration technology applications. The operation and maintenance expenses include the labor costs, material costs, and equipment depreciation required by polygeneration technologies to address the by-products. The economic benefit of by-products is contributed by energy and resources saved, as well as the symbiotic products. In short, the economic benefit of polygeneration systems can be calculated by Equation (3).
E B = C S O × p r o b p t S R p r o × G F p r o , b p × R a t i o p r o , b p , t × ( b p B t b p + e B t , e + r e s B t , r e s O C t F I t × A R t )
where E B represents the energy benefit of polygeneration system; B t b p is the economic benefit of by-product b p tackled by symbiotic technology t ; B t , e is the economic benefit of technology t through energy conservation; B t , r e s is the economic benefit of technology t through resource conservation; F I t and O C t are the fixed investment cost and operation and maintenance (O&M) cost of technology t , respectively; and A R t is the annualized ratio of fixed investment in technology t .
As mentioned above, even for the same waste/by-product, different utilization approaches will create different energy, environmental, and economic benefits. Consequentially, determining the use approaches and amounts of various waste/by-products is the key to completing the optimization of the polygeneration system. Given this situation, in this study, the optimization variables in the polygeneration system are the utilization ratio of by-products b p from the production process p r o , i.e., R a t i o p r o , b p , t .

3.2.3. Constraints

Three constraints are considered in the modeling process, as follows:
The constraint of waste/by-product utilization. In general, when the capacity of the iron and steel plant is given, the quantity of waste/by-products generated is also fixed. To be specific, the total utilization amount of a given waste/by-product by all technologies in the polygeneration system does not exceed its total production, as shown in Equation (4).
t C O N t , b p     C S O × p r o t S R p r o × G F p r o , b p   ,   for   b p
where C O N t , b p is the total utilization amount of by-product b p by technology t .
The constraint of technological matching. The desorbed gas is generated by the tail gas of hydrogen production from coke oven gas, so the output of the desorbed gas should not be higher than 60% of the coke oven gas used for hydrogen production, as shown in Equation (5).
0     O P d g     Q c o g h × 60 %
where O P d g is the output of the desorbed gas, and Q c o g h is the amount of coke oven gas used for hydrogen production.
The logical constraint. The utilization ratio of each waste/by-product should be between 0 and 100%, i.e.,
0     t C O N t , b p / ( C S O × p r o t S R p r o × G F p r o , b p )     100 % ,   for   b p

3.2.4. The Multi-Objective Optimization Method (NSGA-II)

It could be found that there are multiple optimization objectives in the optimization model, and the correlation between them is significant. In addition, there are also many variables and constraints in the optimization model, and these variables follow a continuous distribution. Given this situation and referring to the previous studies [49,50,51], the non-dominated sorting genetic algorithm-II (NSGA-II) is developed in this study to solve the multi-objective optimization model.
NSGA-II is a kind of genetic algorithm. Its basic idea is to complete the coding of decision variables in a specific way and calculate the objective function of the initial population and the crowding distance of the population, which will be used as the basis for non-dominated sorting. Then, the better solution from the population will be selected as the parent, and the genetic, crossover, and variation operators are designed to generate new offspring. The above processes will be repeated until the maximum number of iterations is reached, at which time the final optimization results are output.
The non-dominated stratification method used by NSGA-II allows good individuals to have a greater chance of being inherited by the next generation. And the fitness sharing strategy makes the individuals on the quasi-Pamto plane evenly distributed, maintains the diversity of the population, overcomes the excessive reproduction of super individuals, and prevents premature convergence. The specific explanation and operation processes of NSGA-II have been presented in previous studies [49].

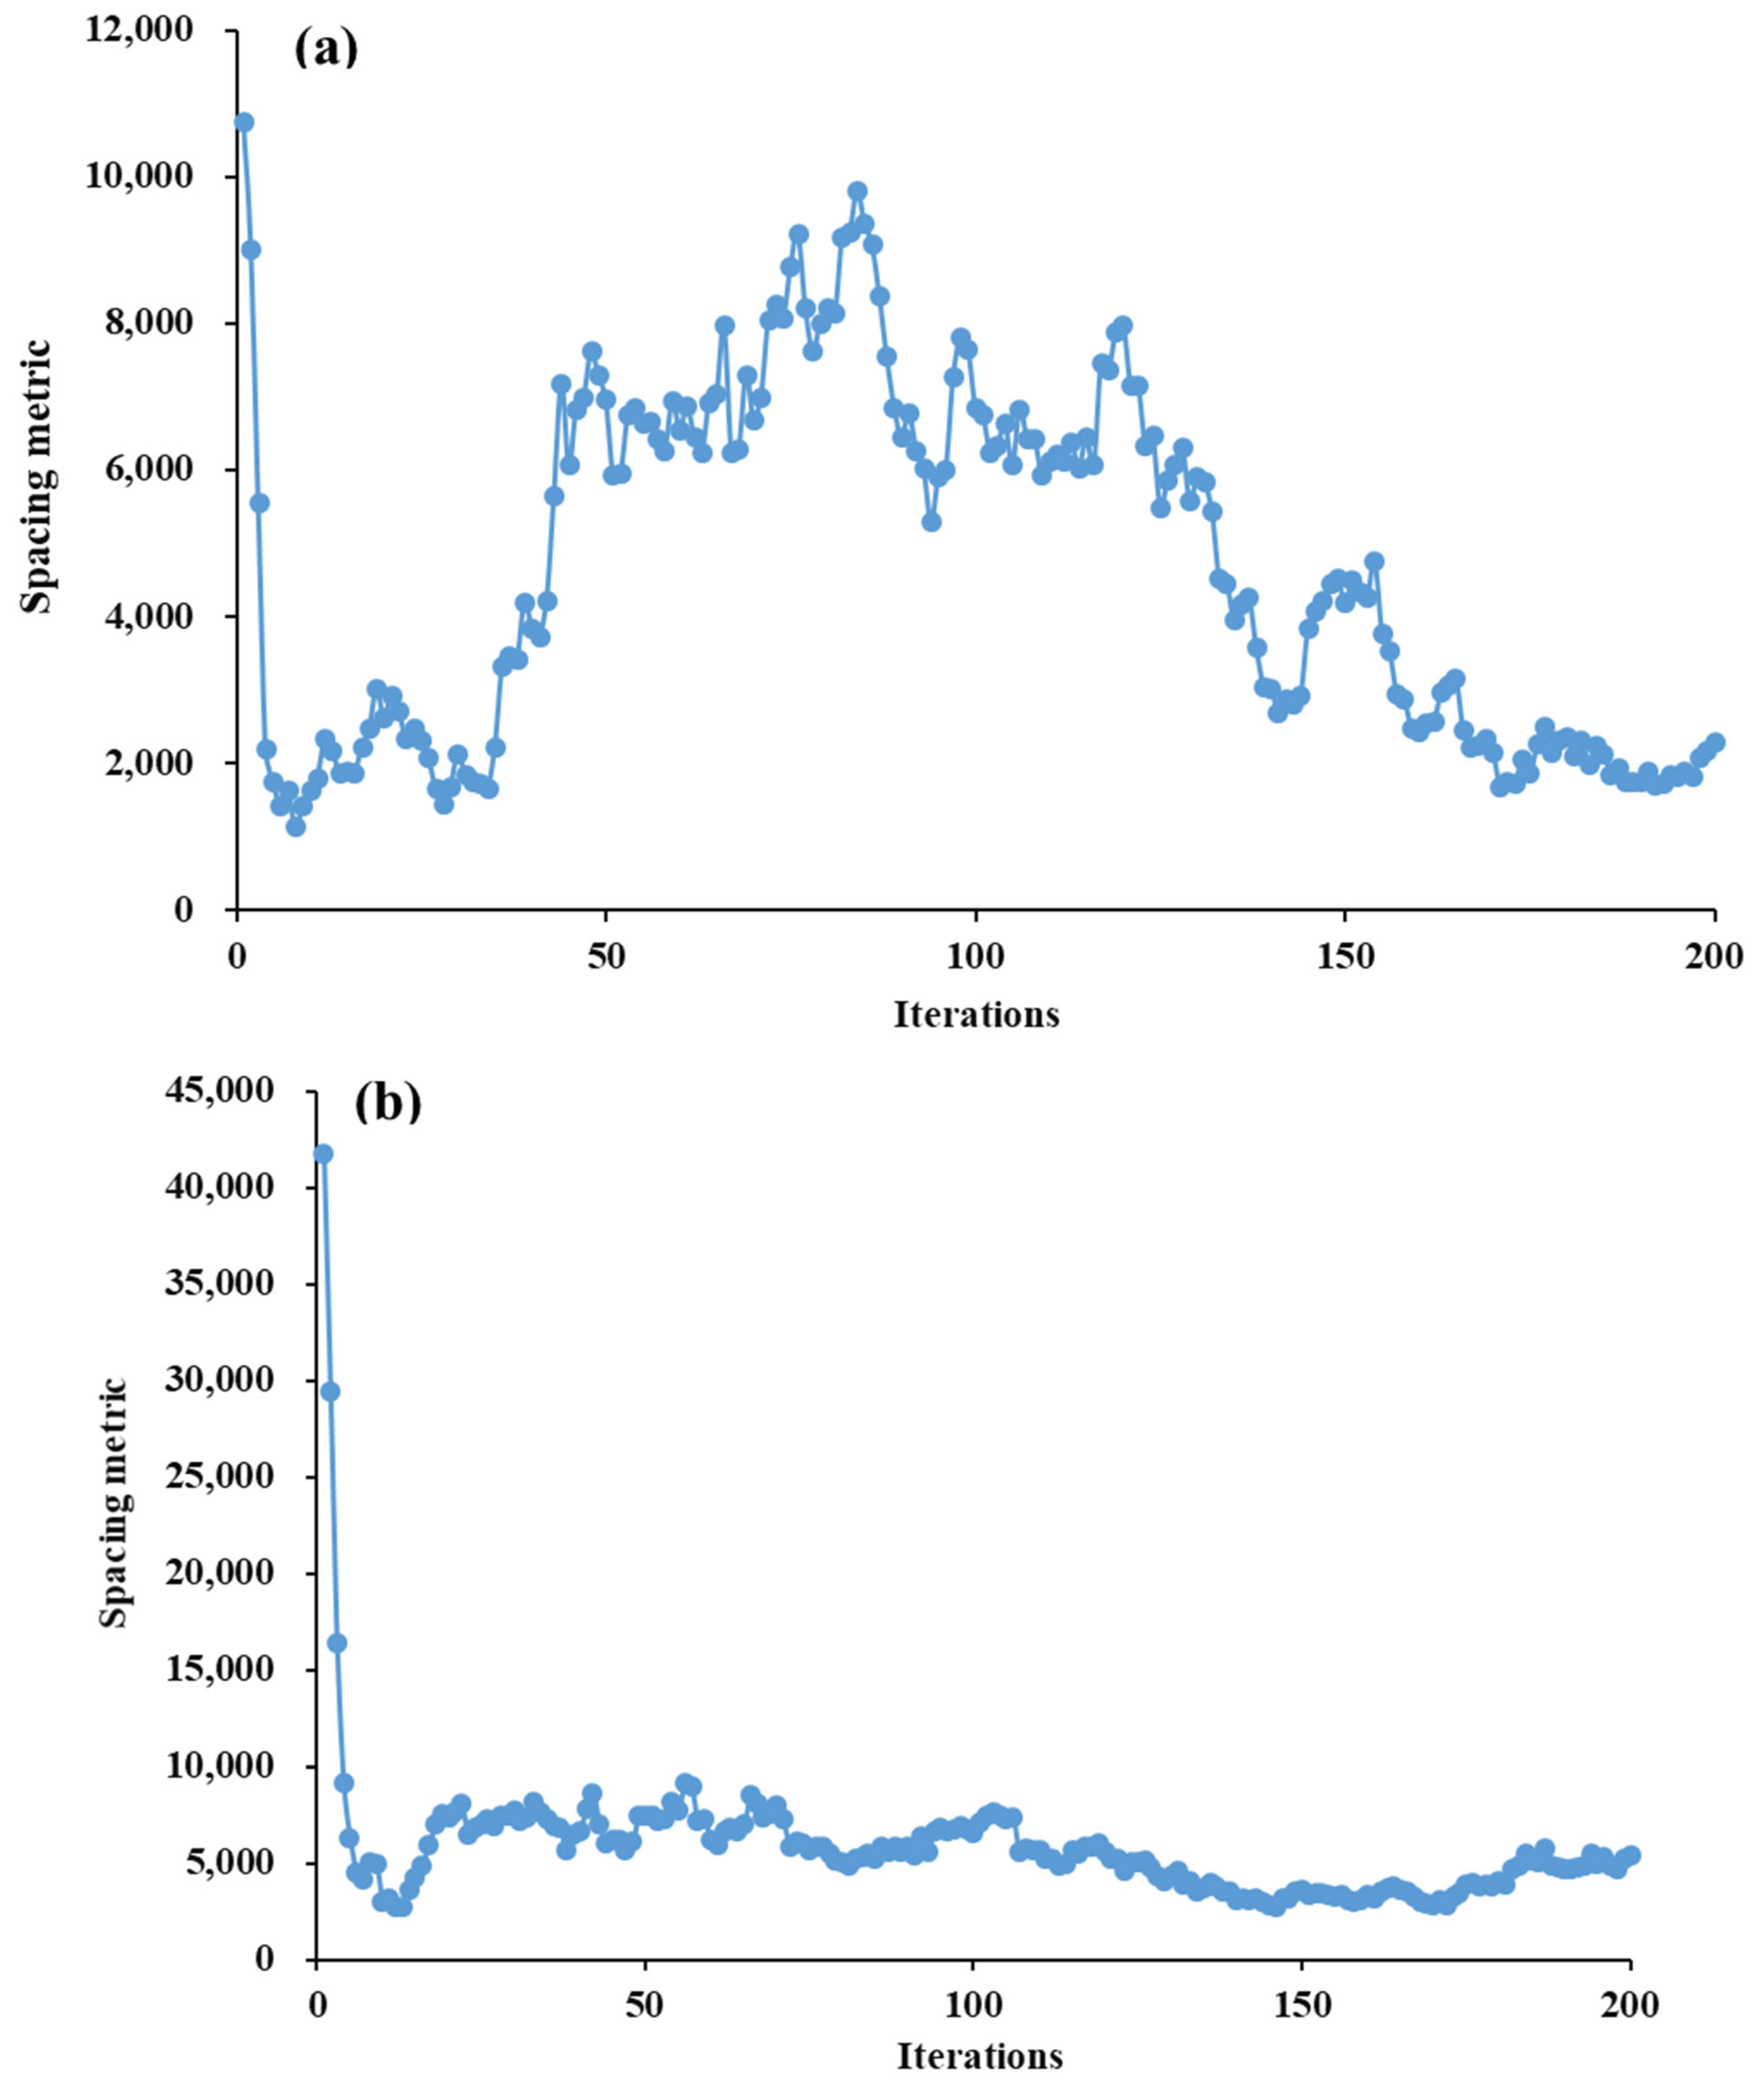
3.2.5. Performance Evaluation of NSGA-II

Two indexes are developed in this study to verify the performance of NSGA-II and ensure reliable optimization results, as follows:
(a) Index 1: Spacing distribution uniformity of solution set (spacing metric). This index is used to evaluate the uniformity of solution set distribution. In general, the more uniform the distribution of the solution set, the lower the possibility of the results falling into the local optimum, and the more the solution set can reflect the synergistic and conflict relationship between various objectives. The principle of this method is to calculate the standard deviation of the Euclidean distance between two adjacent points, and the lower the standard deviation, the smaller the difference in the solution set, as shown in Equation (7).
S M = 1 N 2 n = 1 N 1 ( d n d ¯ )
where S M is the spacing metric; N represents the population size; and d n represents the distance between the n th and n + 1 th points and d represents the average distance.
(b) Index 2: Mean value of solution set. The mean value of the solution set could reflect the convergence and overall change trend of the solution set simultaneously. On the one hand, if the solution set converges after a certain number of optimization generations, it indicates that the optimization result has become stable and reliable. On the other hand, the mean value of the solution set can also reflect the improvement of the solution set in the optimization process.

3.3. Data Processing

In 2020, the global crude steel production was about 1878 million tons (Mt), with more than 56% contributed by China [52], which means China is the largest steel producer in the world. Based on this, the iron and steel plants in China were selected as cases in this study. To be specific, two types of typical iron and steel plants in China are selected as cases for modeling analysis in this study. One is a medium-scale iron and steel plant with a capacity of 3 Mt/a, and the other is a large-scale iron and steel plant with a capacity of 9 Mt/a. The related parameters are listed in Table 1.
In addition to the above data, industrial production data, material transformation data, technology data, and economic data are also collected in order to quantify the benefits of different polygeneration paths and determine the final optimization scheme. The production data are shown in Table 2.
The numerical characterization of energy, environmental, and economic benefits of by-product utilization technologies in the iron and steel industry is the key to evaluating the benefits of polygeneration systems. For the same waste/by-product, different utilization approaches will present different energy, environmental, and economic benefits. Therefore, it is necessary to decide which technology to choose according to the utilization approach of by-products and determine the energy, environmental, and economic benefits of this technology compared with the reference benchmark technology. Based on the previous studies [53,54,55,56] and surveys, the numerical characterization information of by-product utilization technologies in the iron and steel industry is shown in Table 3.
In addition, to improve the calculation efficiency and optimization quality of NSGA-II, the related parameters also should be determined properly. There are six types of parameters involved in NSGA-II: population size, maximum iteration times, crossover probability, mutation scale, mutation probability, and division of reference points, which are set as 200, 200, 0.9, 0.1, 0.2, and 4, respectively [56].

4. Results and Discussion

4.1. Performance Evaluation Results of NSGA-II

For index 1 (i.e., spacing metric), the results of two types of iron and steel plants are shown in Figure 3. It could be found that the spatial distribution uniformity of solution sets for the two optimization issues increases in the first 100 generations and decreases in the next 100 generations and tends to a low value at the end of the optimization process, which indicates that the distribution of optimization results is uniform.
For the index 2 (i.e., mean value of solution set), the results are shown in Figure 4. It can be seen that for the two optimization issues, the mean value of solution sets in all dimensions has been improved to some extent, and convergence has been achieved after 150 generations. In conclusion, the evaluation results of the two indexes are reasonable, which verify the reliability of the NSGA-II proposed in this study.

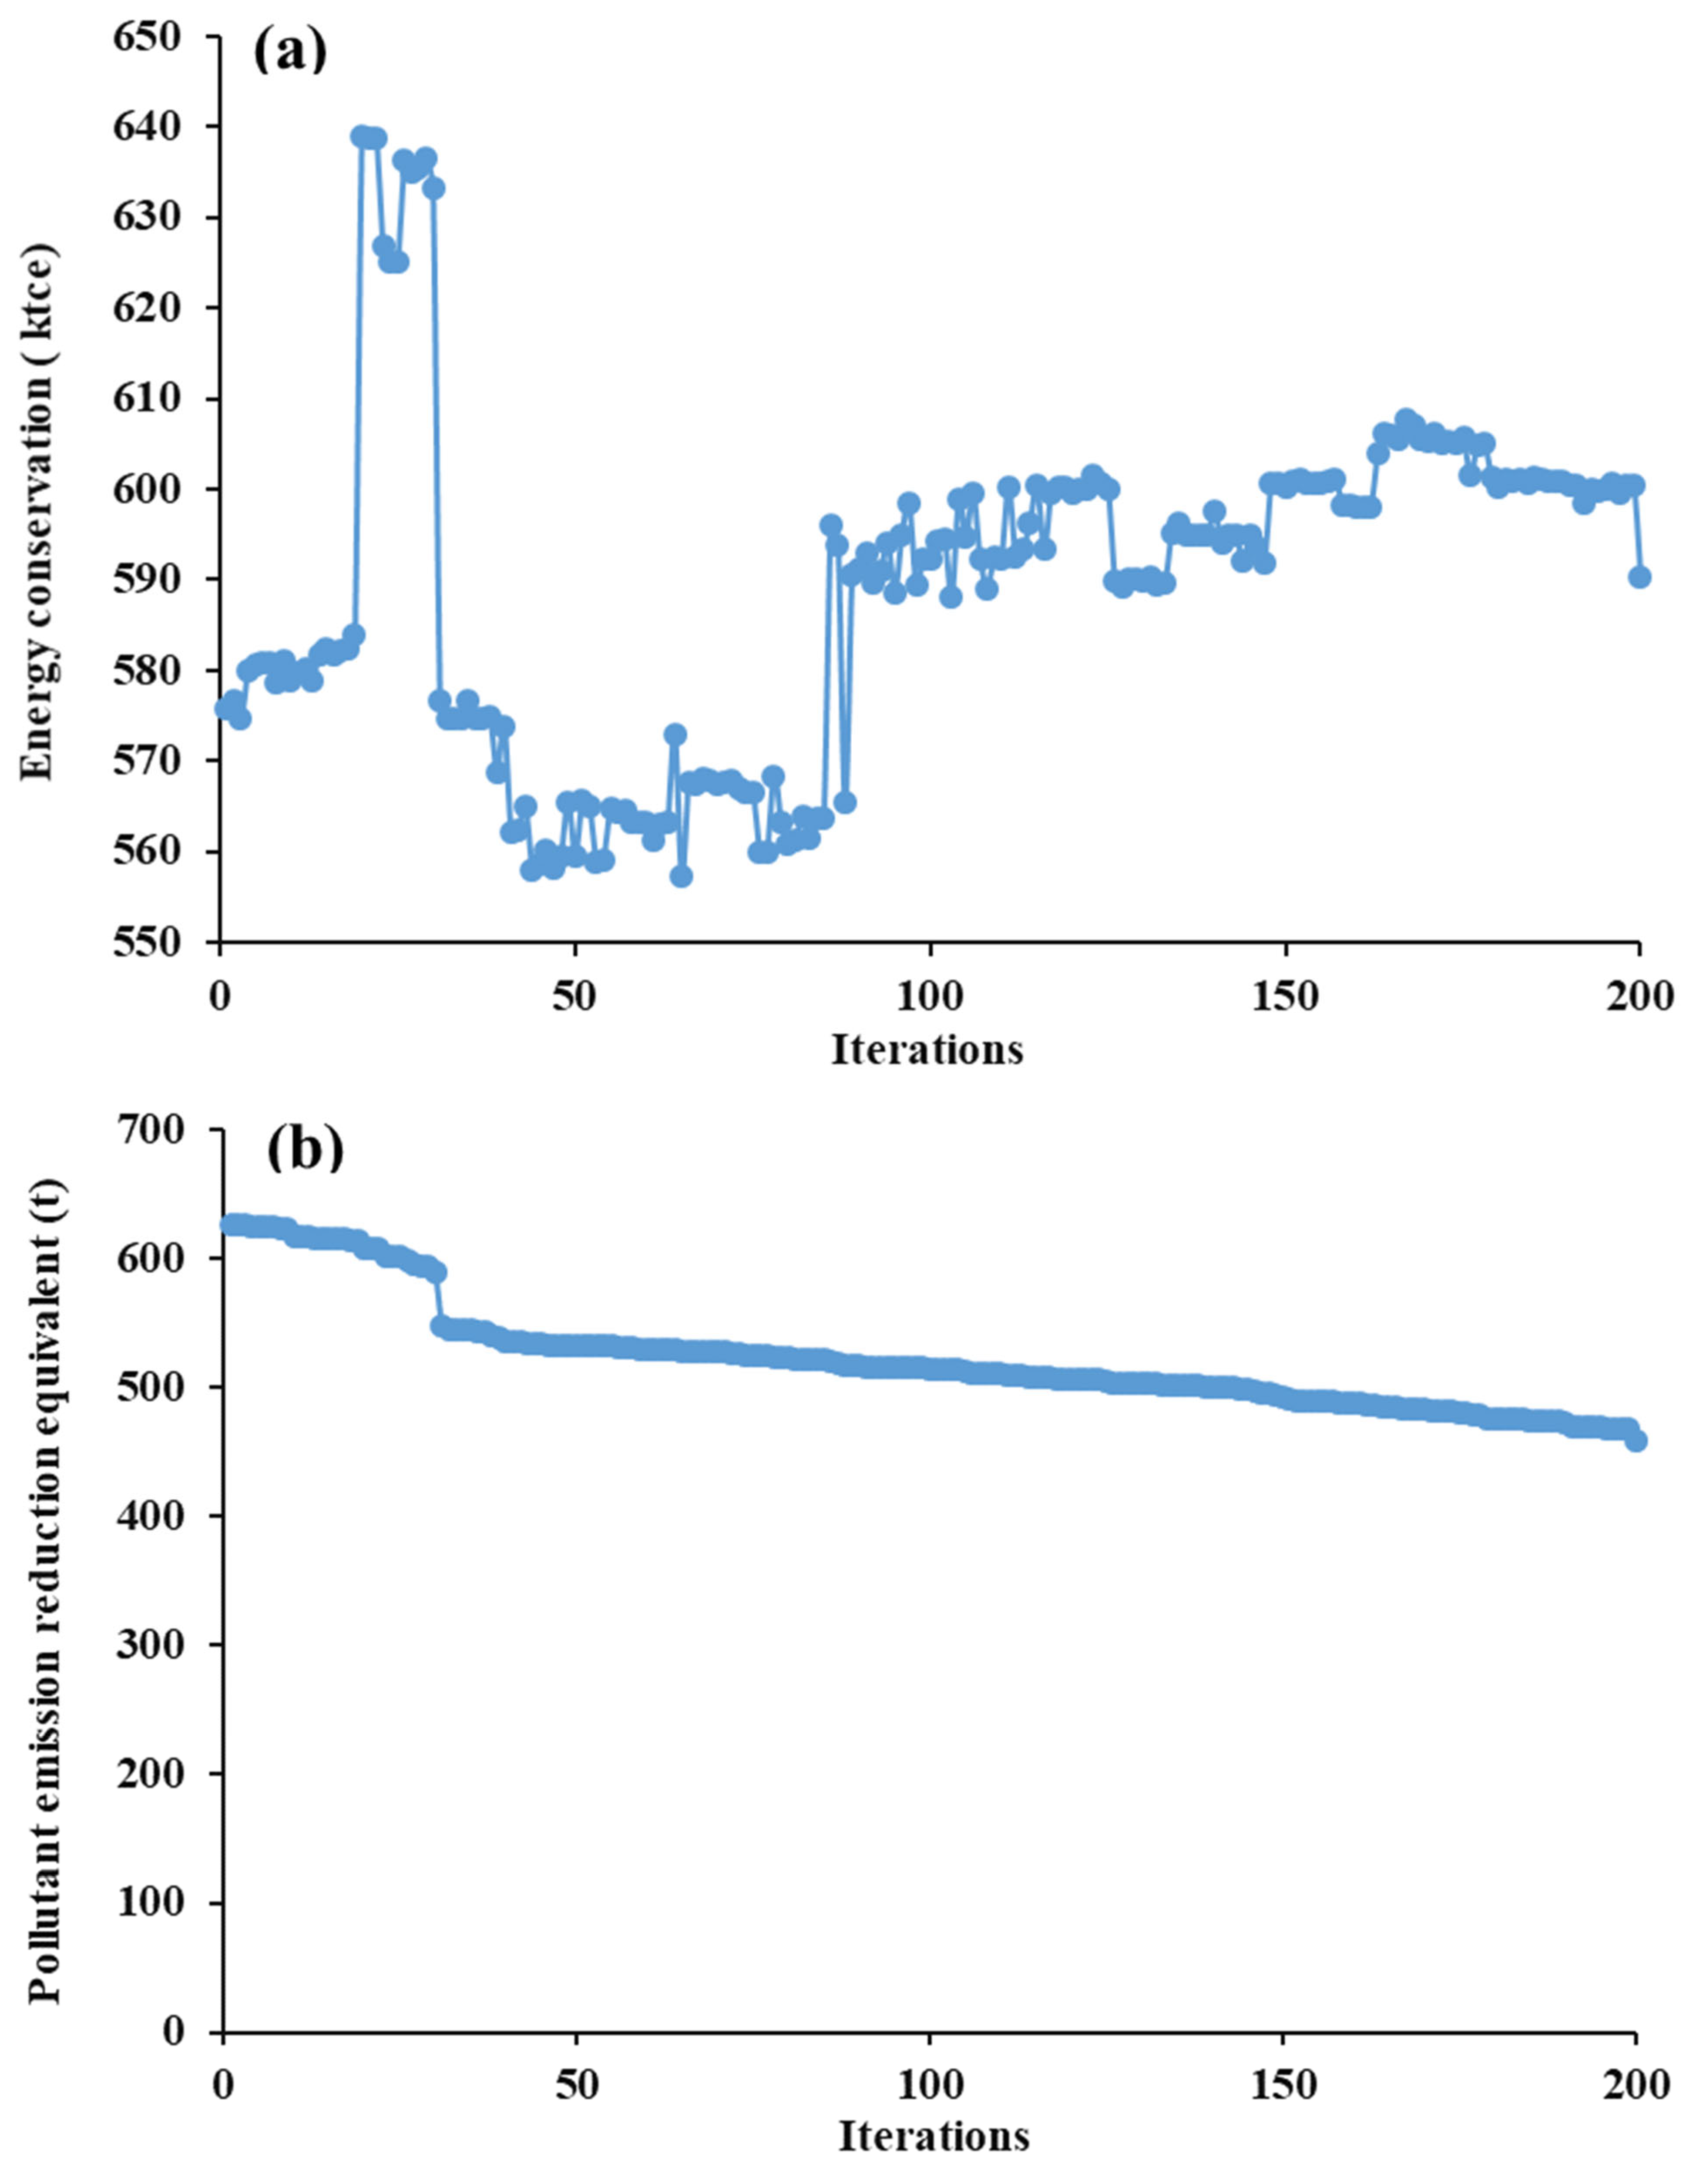
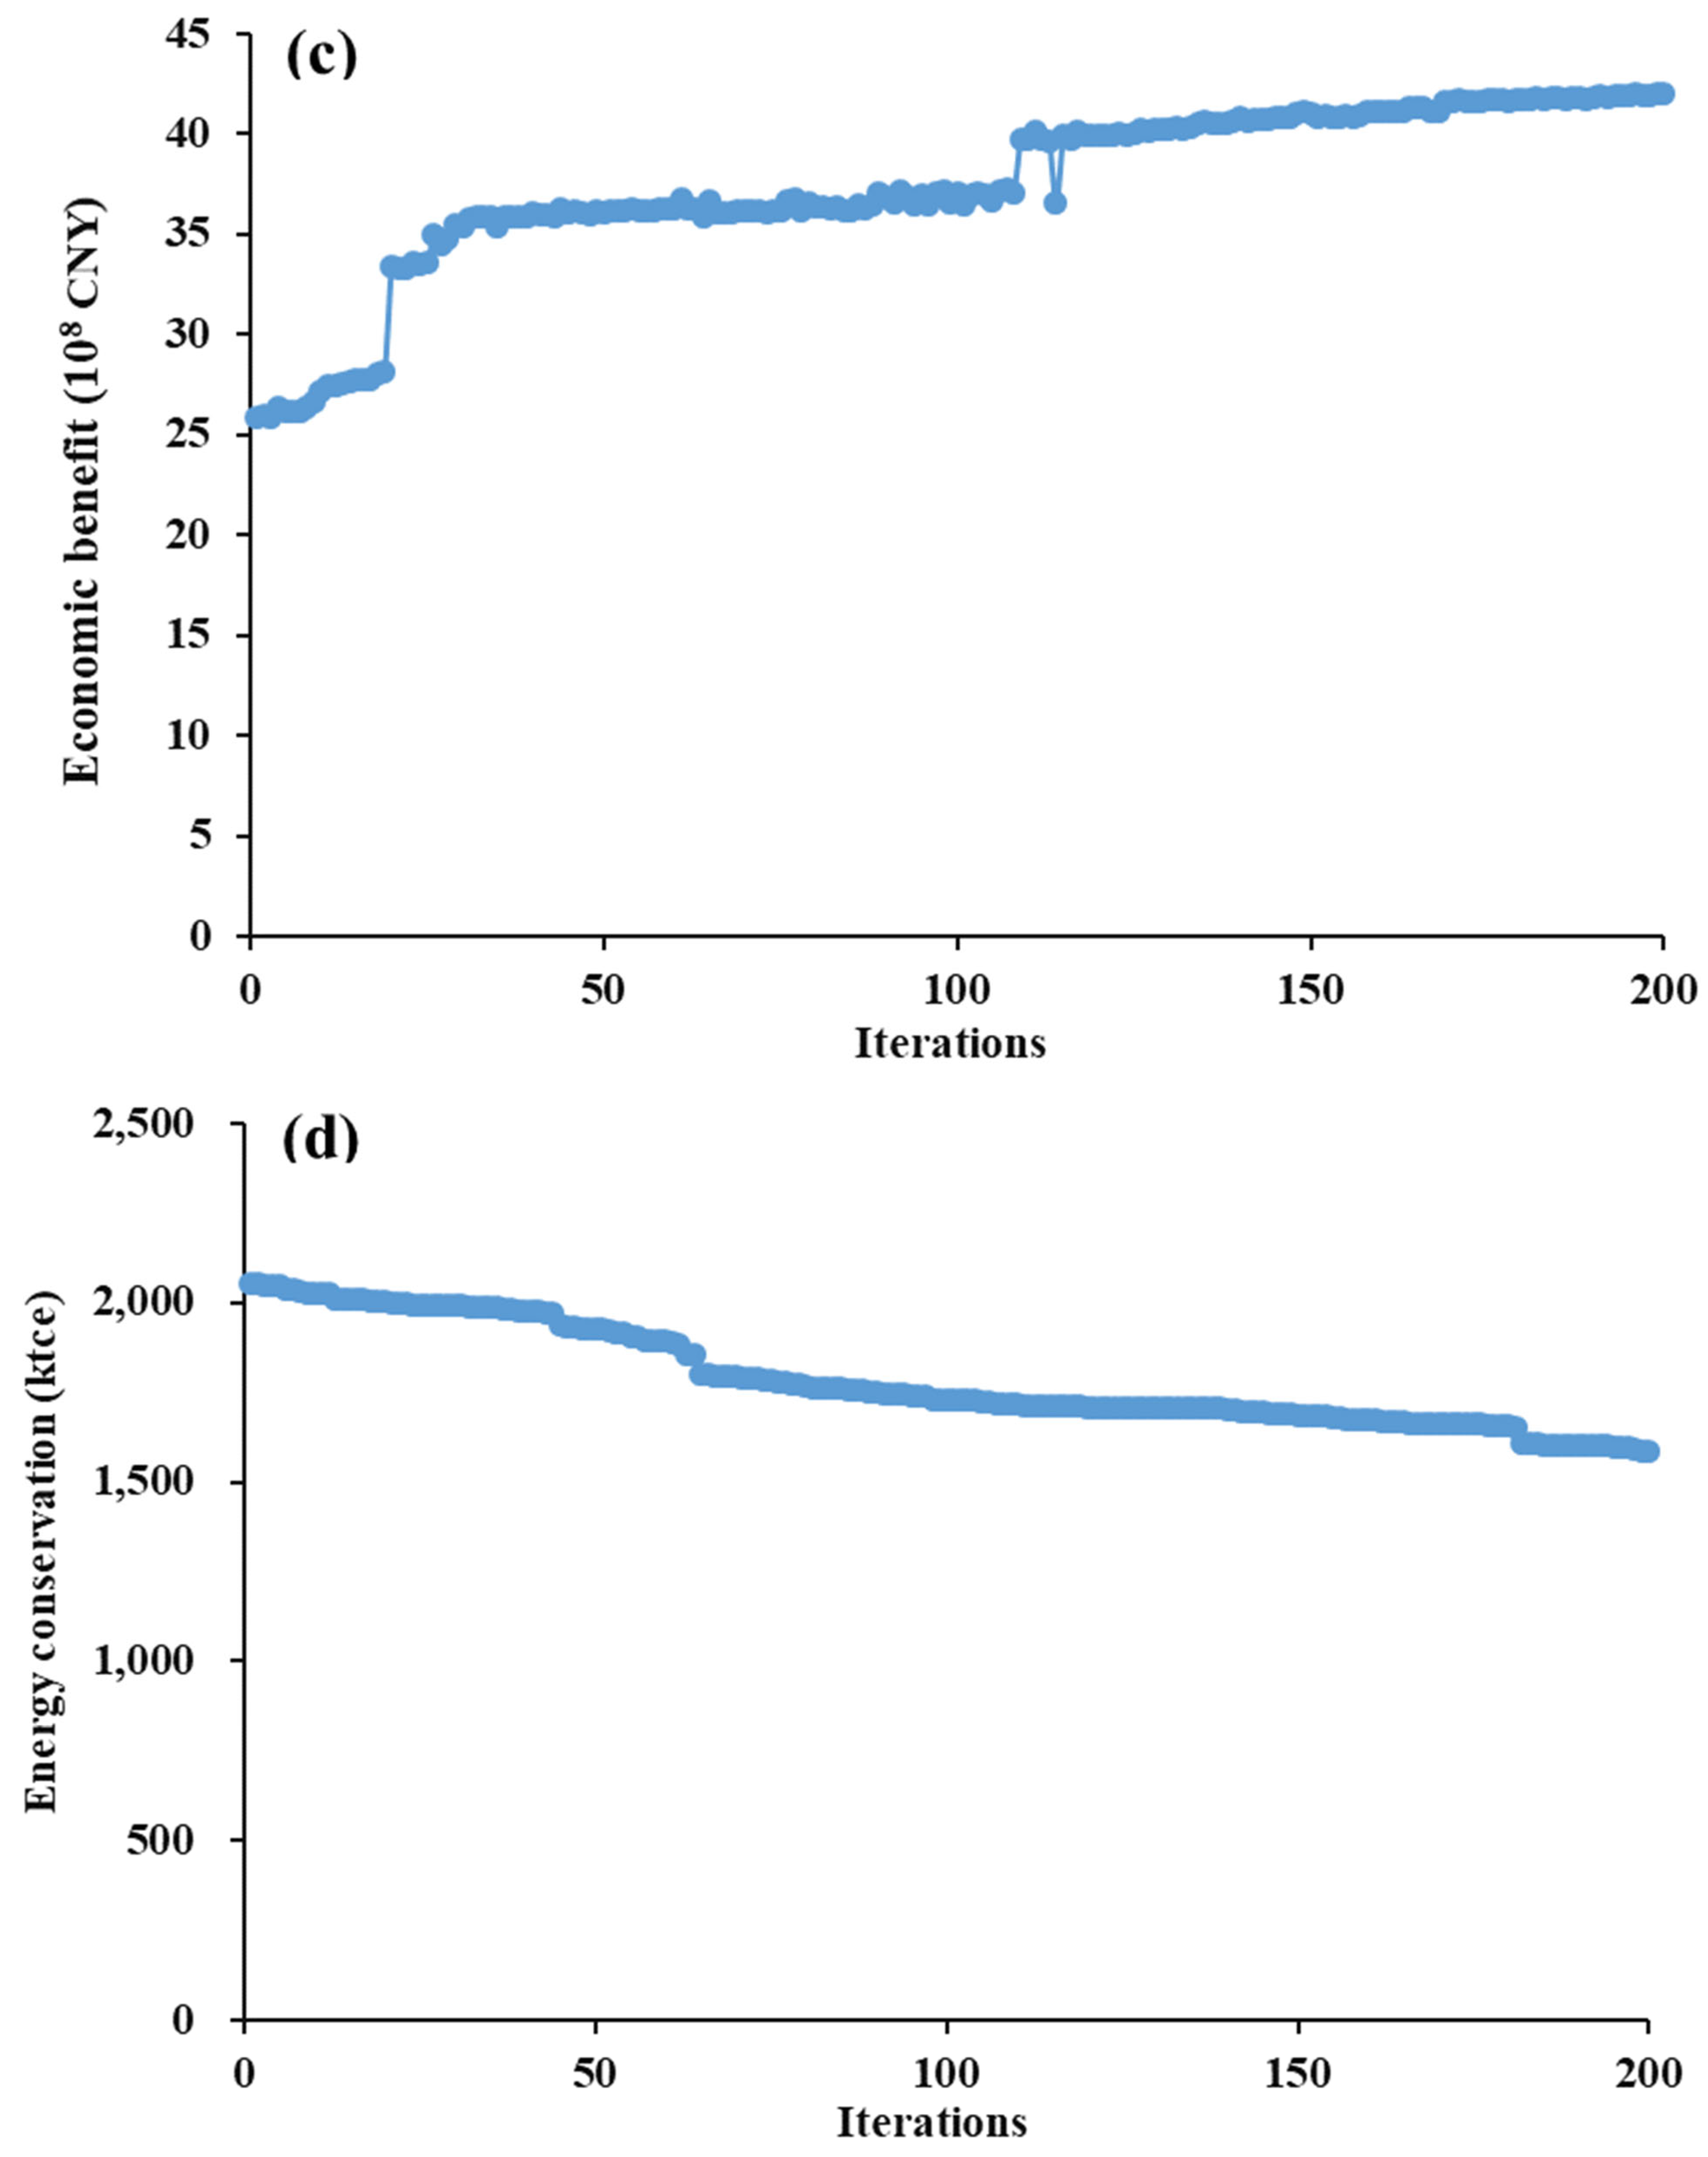
4.2. Optimization Results

The optimization results of energy conservation and emission reduction in the iron and steel plants obtained by the NSGA-II are shown in Table 4. For the iron and steel plant with 3 Mt/a capacity, the average value of energy conservation, SO2 reduction, NOx reduction, PM reduction, and economic benefit of the optimization scheme are 588.98 ktce, 45.86 t, 61.53 t, 47.03 t, and CNY 3.74 billion, respectively. For the iron and steel plant with 9 Mt/a capacity, the five optimized indicators are 1786.95 ktce, 133.02 t, 147.90 t, 145.50 t, and CNY 12.33 billion, respectively. These results showed that the polygeneration system can achieve good energy, environmental, and economic benefits, and there is a synergistic relationship between energy conservation and emission reduction on the whole in the polygeneration system.
As shown in Figure 5, there are synergistic and conflicting relationships among energy, environmental, and economic goals in both scales of iron and steel plants, which are also closely related to the scale of iron and steel plants. More specifically, for the iron and steel plant with 3 Mt/a capacity, the goals of economic benefit, PM reduction, and energy conservation are synergistic, while the energy conservation goal is in conflict with the SO2 and NOx reduction goals. This is mainly because the energy consumption and cost of some SO2 and NOx reduction technologies are high in the middle-scale iron and steel plants. For the iron and steel plant with 9 Mt/a capacity, the goals of energy conservation, SO2 and NOx reduction are synergistic, which means compared with the middle-scale iron and steel plant, the large-scale iron and steel plant may have more advantages in energy conservation, SO2 and NOx reduction. However, the energy conservation goal is in conflict with the goals of economic benefit and PM reduction in this case. In short, it is necessary to make technology selection to avoid conflicts between different objectives when establishing the polygeneration system, and the scale of iron and steel plants should also be considered in this process.

4.3. Final Decision Schemes

As for the optimal variables, the average utilization ratio results of 20 technologies in the polygeneration system are shown in Figure 6. In general, the average utilization ratio of about half of the technologies in two steel plants with different production is similar. On the contrary, there exist some differences in the utilization of several by-products, such as coke oven gas (T2–T7), blast furnace gas (T12 and T13), and blast furnace slag (T16–T18), due to the scale effects of the technologies. This result demonstrates the necessity of considering the plant’s scale in technical selection.
The polygeneration system’s decision-making scheme is discrete, which means the above optimal results cannot be used directly to guide business decisions. Therefore, it is necessary to transfer the solution set to obtain the final decision scheme in order to select the polygeneration technologies from the perspective of iron and steel enterprises. When considering the scale economy, 13 technologies should be adopted by the iron and steel plant with 3 Mt/a capacity and 12 technologies should be adopted by the iron and steel plant with 9 Mt/a capacity, and the technology selection under various polygeneration paths is shown in Table 5.
Based on the scheme and the technical scheme proposed in Table 5, various types of products can be produced by using the by-products or wastes from the iron and steel plant. To be specific, for the iron and steel plant with 3 Mt/a of capacity, 407 GWh of power, 31.5 kt of hydrogen (H2), 935.9 kt of cement, 218.4 kt of devitrified glass, 42.1 kt of sulfuric acid (H2SO4), 47.3 kt of coal tar, and 263.0 kt of MMA will be output with the application of the above 12 technologies in the polygeneration system. It should be noted that methanol is also produced in the above process, but it is used as a raw material for MMA production. However, for the iron and steel plant with 9 Mt/a capacity, the technical scheme of its polygeneration system is different from that of the iron and steel plant with 3 Mt/a capacity, which also leads to differences in their final products. Under the optimized technical scheme, 1308 GWh of power, 338.8 kt of methanol, 1.5 million tons of cement, 300 m3 of liquified natural gas (LNG), 1.3 million tons of devitrified glass, 129.1 kt of H2SO4, 145.3 kt of coal tar, 807.1 kt of MMA, and 147.4 kt of aggregate can be produced through the polygeneration system with an iron and steel plant with 9 Mt/a capacity as its core.
Polygeneration systems can bring significant energy, environmental, and economic benefits by providing a large number of electricity and other industrial products.
According to the final technical scheme, the iron and steel plant with 3 Mt/a capacity can achieve energy conservation with 410.53 ktce, SO2 reduction with 37.85 t, NOx reduction with 68.34 t, PM reduction with 31.89 t, and the economic benefit is CNY 244.92 million. In other words, the energy and environmental benefits of the polygeneration system can reduce the energy consumption, SO2 emission, NOx emission, and PM emission of the iron and steel plant by 25.3%, 17.5%, 27.1%, and 15.9%, respectively. With the expansion of iron and steel plants’ capacity, the energy, environmental, and economic benefits of polygeneration systems are also improved. For the iron and steel plant with 9 Mt/a capacity, the energy conservation, SO2 reduction, NOx reduction, PM reduction, and economic benefit are 2124.49 ktce, 159.99 t, 206.67 t, 100.67 t, and CNY 1088.93 million, respectively, and the energy and environmental benefits of the polygeneration system are equivalent to reducing the energy consumption, SO2 emission, NOx emission, and PM emission of the iron and steel plant by 42.6%, 24.1%, 26.7%, and 16.3%, respectively.
The difference in the performance of the polygeneration system caused by the scale of iron and steel plants can be explained from two aspects. One reason is that the output of by-products or waste of iron and steel plants does not change linearly with their capacity. The output of coke oven gas and blast furnace gas in the iron and steel plant with 9 Mt/a capacity is more than three times that of the iron and steel plant with 3 Mt/a capacity, while the output of blast furnace slag and converter slag of the former is three times lower than that of the latter. The other reason is that the output of by-products or waste determines the optimal technology selection scheme of the polygeneration system. For instance, the utilization of residual heat and pressure is different for two iron and steel plants with different scales (T14 and T15 for the iron and steel plant with 3 Mt/a capacity, while T12 and T15 for the iron and steel plant with 9 Mt/a capacity). In addition, there are also differences in the products of the polygeneration system. For example, aggregate and cement will be generated at the same time by using converter slag if the capacity of the iron and steel plant is 9 Mt/a, while only cement will be generated if the capacity is 3 Mt/a.
At present, China’s iron and steel industry is continuing to carry out mergers and acquisitions, and the industrial concentration is further improved. Initially, these activities are affected by the national environmental protection goals; simultaneously, we believe that it is conducive to improving the energy conservation and emission reduction potential of the polygeneration system in the future based on the results of this study.
Another fact reflected by the above results is that polygeneration systems are an important approach to broadening the space for energy conservation and pollutant emission reduction in industrial sectors, which is of great significance for the industrial sectors to achieve the carbon emission control target and pollutant emission reduction target. In 2023, the crude steel production in China will have reached about 1.02 billion tons [57]. Based on the energy and environmental benefits of an iron and steel plant with 3 Mt/a capacity, in the case of widely promoted polygeneration systems in the iron and steel industry in China, it can save energy over 139 million tce (accounting for approximately 2.4% of China’s total energy consumption in 2023) per year and reduce SO2, NOx, and PM with 12.86 kt/a, 23.22 kt/a, and 10.83 kt/a, respectively. Most of these benefits can be achieved through policy guidance and incentives, which provides an important idea for the formulation of carbon and pollutant reduction policies in industrial sectors in China.

5. Conclusions

In this study, the iron and steel industry is selected as the by-product industry, while the chemical, building materials, and power industries are selected as the sink industries to simulate the polygeneration system, and four typical polygeneration paths are set up. And then, the technology structure system of the polygeneration process is modeled based on the bottom–up method, and the modeling process follows the chain of “supplier—waste/by-products—technologies—adopter”. Based on the above, a polygeneration process model including eight types of by-products and 20 technologies has been established. Apart from this, a multi-objective optimization model is developed in this study to select the optimal technology or technology combination of each polygeneration path under the constraints of energy, environmental, and economic objectives, as well as guide enterprises to adopt the optimal path to realize the comprehensive utilization of by-products. The main conclusions of this study are concluded below.
(1)
The energy conservation and emission reduction measures have an impact on multiple goals such as energy, environment, and economy during the application process. There are complex collaborative and conflicting relationships between different targets, and there is a risk of implicit transfer between various goals. The multi-objective optimization algorithm represented by the NSGA-II algorithm can well handle the above issues, which can provide various solutions for decision-makers, and decision-makers can formulate energy conservation and emission reduction strategies based on their preferences.
(2)
There are synergistic and conflicting relationships among energy, environmental, and economic goals in the process of applying polygeneration technologies in the iron and steel industry, which is also closely related to the scale of iron and steel plants. Therefore, it is necessary to make technology selection to avoid conflicts between different objectives when establishing the polygeneration system, as well as maximize the energy, environmental, and economic benefits for iron and steel plants with different scales.
(3)
Polygeneration systems can significantly improve the energy conservation and pollutant emission reduction potential of the iron and steel industry, which is crucial for achieving the pollution and CO2 reduction targets of China’s industrial sector in the future. Polygeneration technologies can fully utilize waste or by-products in the iron and steel plants, such as coke oven gas, sintering waste heat, and steel slag, which will be converted into industrial products, including chemical products, electricity, building materials, and others. The independent energy conservation and emission reduction potential of a single industry is limited currently. And it has become a trend for the industrial sector to fully utilize by-products/wastes from different industries through the establishment of polygeneration systems to save energy and reduce emissions. In the future, it is necessary to focus on the multi-level utilization of energy in the industrial sector and the application of circular economy measures.
In conclusion, critical insights are provided in this study in the energy and environmental management of iron and steel through establishing an inter-industry polygeneration system with the iron and steel industry as the core and multi-objective optimization model. The results of this study can provide references for energy conservation and emission reduction management in the global iron and steel, chemical, building materials, and power industries.

Author Contributions

Conceptualization, M.X., Y.W. and Q.L.; methodology, M.X. and Y.W.; formal analysis, M.X. and Y.W.; investigation, M.X., S.L., Y.W. and Q.L.; data curation: M.X. and Y.W.; writing—original draft preparation, M.X.; writing—review and editing, M.X., S.L., Y.W. and Q.L.; funding acquisition, M.X. and Q.L.; project administration, M.X. and Q.L. All authors have read and agreed to the published version of the manuscript.

Funding

This study was funded by the National Natural Science Foundation of China (72074199, 71991483), the China Geological Survey (DD20221795), and the Shanghai Tongji Gao Tingyao Environmental Protection Technology Development Foundation.

Institutional Review Board Statement

Not applicable.

Informed Consent Statement

Not applicable.

Data Availability Statement

The authors confirm that all data generated or analyzed during this study are included in this article.

Conflicts of Interest

The authors declare no conflicts of interest.

References

  1. Du, Z.L.; Wang, Y. Does energy-saving and emission reduction policy affects carbon reduction performance? A quasi-experimental evidence in China. Appl. Energy 2022, 324, 119758. [Google Scholar] [CrossRef]
  2. Feng, R.; Fang, X.K. China’s pathways to synchronize the emission reductions of air pollutants and greenhouse gases: Pros and cons. Resour. Conserv. Recycl. 2022, 184, 106392. [Google Scholar] [CrossRef]
  3. Du, H.B.; Guo, Y.Q.; Lin, Z.G.; Qiu, Y.M.; Xiao, X. Effects of the joint prevention and control of atmospheric pollution policy on air pollutants-A quantitative analysis of Chinese policy texts. J. Environ. Manag. 2021, 300, 113721. [Google Scholar]
  4. Huang, K.; Eckelman, M.J. Estimating future industrial emissions of hazardous air pollutants in the United States using the National Energy Modeling System (NEMS). Resour. Conserv. Recycl. 2021, 169, 105465. [Google Scholar] [CrossRef]
  5. Li, F.; Chu, M.S.; Tang, J.; Liu, Z.G.; Zhao, Z.C.; Liu, P.J.; Yan, R.J. Quantifying the energy saving potential and environmental benefit of hydrogen-based steelmaking process: Status and future prospect. Appl. Therm. Eng. 2022, 211, 118489. [Google Scholar] [CrossRef]
  6. Gao, C.K.; Na, H.M.; Song, K.H.; Tian, F.; Strawa, N.; Du, T. Technologies-based potential analysis on saving energy and water of China’s iron and steel industry. Sci. Total Environ. 2020, 699, 134225. [Google Scholar] [CrossRef]
  7. Tanaka, K. A comparison study of EU and Japan methods to assess CO2 emission reduction and energy saving in the iron and steel industry. Energy Policy 2012, 51, 578–585. [Google Scholar] [CrossRef]
  8. Wen, Z.G.; Chen, M.; Meng, F. Evaluation of energy saving potential in China’s cement industry using the Asian-Pacific Integrated Model and the technology promotion policy analysis. Energy Policy 2015, 77, 227–237. [Google Scholar] [CrossRef]
  9. Pinto, E.S.; Serra, L.M.; Lázaro, A. Energy communities approach applied to optimize polygeneration systems in residential buildings: Case study in Zaragoza, Spain. Sustain. Cities. Soc. 2022, 82, 103885. [Google Scholar] [CrossRef]
  10. Thomas, S.; Sahoo, S.S.; Ajithkumar, G.; Thomas, S.; Rout, A.; Mahapatra, S.K. Socio-economic and environmental analysis on solar thermal energy-based polygeneration system for rural livelihoods applications on an Island through interventions in the energy-water-food nexus. Energy Convers. Manag. 2022, 270, 116235. [Google Scholar] [CrossRef]
  11. Liu, B.; Huang, B.; Feng, L.; Raise, A. Analysis of a high-performance polygeneration system for efficient waste heat recovery of an organic flash cycle: Multi-criteria analysis and optimization. Appl. Therm. Eng. 2022, 213, 118772. [Google Scholar]
  12. Zhu, Y.; Li, K.; Wang, Q.; Cen, J.; Fang, M.; Luo, Z. Low-rank coal pyrolysis polygeneration technology with semi-coke heat carrier based on the dual-fluidized bed to co-produce electricity, oil and chemical products: Process simulation and techno-economic evaluation. Fuel. Process. Technol. 2022, 230, 107217. [Google Scholar] [CrossRef]
  13. Rabeti, S.A.M.; Manesh, M.H.K.; Amidpour, M. An innovative optimal 4E solar-biomass waste polygeneration system for power, methanol, and freshwater production. J. Clean. Prod. 2023, 412, 137267. [Google Scholar] [CrossRef]
  14. Bose, A.; O’Shea, R.; Lin, R.; Long, A.; Rajendran, K.; Wall, D.; De, S.; Murphy, J.D. Evaluation of a biomethane, food and biofertiliser polygeneration system in a circular economy system. Renew. Sustain. Energy Rev. 2022, 170, 112960. [Google Scholar]
  15. Huang, D.; Dinga, C.D.; Wen, Z.G.; Razmadze, D. Industrial-environmental management in China’s iron and steel industry under multiple objectives and uncertainties. J. Environ. Manag. 2022, 310, 114785. [Google Scholar] [CrossRef]
  16. Gao, R.; Zhang, C.; Kwak, G.; Lee, Y.J.; Kang, S.C.; Guan, G. Techno-economic evaluation of methanol production using by-product gases from iron and steel works. Energy Convers. Manag. 2020, 213, 112819. [Google Scholar] [CrossRef]
  17. Lei, M.; Alves, J.; Alotaibi, M.; Chen, J. A novel polygeneration process integrated into a gas turbine cycle toward an environmentally friendly framework; Application of a comprehensive 4E study. Energy 2024, 307, 132728. [Google Scholar] [CrossRef]
  18. Ghema, M.; El, F.; Achkari, O. Capacity of waste heat recovery-based polygeneration to achieve sustainable development goals. Sci. Total Environ. 2024, 927, 171983. [Google Scholar] [CrossRef] [PubMed]
  19. Lu, R.; Zhu, H.; Wang, A.; Li, J.; Dong, H. A coal-based polygeneration system of synthetic natural gas, methanol and ethylene glycol: Process modeling and techno-economic evaluation. Sep. Purif. Technol. 2023, 320, 124122. [Google Scholar] [CrossRef]
  20. Kim, S.; Kim, M.; Kim, Y.T.; Kwak, G.; Kim, J. Techno-economic evaluation of the integrated polygeneration system of methanol, power and heat production from coke oven gas. Energy Convers. Manag. 2019, 182, 240–250. [Google Scholar] [CrossRef]
  21. Lee, J.K.; Shin, S.; Kwak, G.J.; Lee, M.K.; Lee, I.B.; Yoon, Y.S. Techno-economic evaluation of polygeneration system for olefins and power by using steel-mill off-gases. Energy Convers. Manag. 2020, 224, 113316. [Google Scholar] [CrossRef]
  22. Atienza-Márquez, A.; Ayou, D.S.; Bruno, J.C.; Coronas, A. Energy polygeneration systems based on LNG-regasification: Comprehensive overview and techno-economic feasibility. Therm. Sci. Eng. Prog. 2020, 20, 100677. [Google Scholar] [CrossRef]
  23. Liang, P.; Guo, Y.; Chauhdary, S.; Agrawal, M.; Ahmad, S.; Ahmad, A.; Ifseisi, A.; Li, T. Sustainable development and multi-aspect analysis of a novel polygeneration system using biogas upgrading and LNG regasification processes, producing power, heating, fresh water and liquid CO2. Process. Saf. Environ. 2024, 183, 417–436. [Google Scholar] [CrossRef]
  24. Nguyen, T.V.; Clausen, L.R. Techno-economic analysis of polygeneration systems based on catalytic hydropyrolysis for the production of bio-oil and fuels. Energy Convers. Manag. 2019, 184, 539–558. [Google Scholar] [CrossRef]
  25. Jana, K.; De, S. Techno-economic evaluation of a polygeneration using agricultural residue–a case study for an Indian district. Bioresour. Technol. 2015, 181, 163–173. [Google Scholar] [CrossRef] [PubMed]
  26. Shamsi, M.; Karami, B.; Cheraghdar, A.; Mousavian, S.; Makki, M.; Rooeentan, S. Evaluation of an environmentally-friendly poly-generation system driven by geothermal energy for green ammonia production. Fuel 2024, 365, 131037. [Google Scholar] [CrossRef]
  27. Farhang, B.; Ghaebi, H.; Javani, N. Techno-economic modeling of a novel poly-generation system based on biogas for power, hydrogen, freshwater, and ammonia production. J. Clean. Prod. 2023, 417, 137907. [Google Scholar] [CrossRef]
  28. Shi, B.; Wen, F.; Wu, W. Performance evaluation of air-blown IGCC polygeneration plants using chemical looping hydrogen generation and methanol synthesis loop. Energy 2020, 200, 117564. [Google Scholar] [CrossRef]
  29. Soutullo, S.; Bujedo, L.A.; Samaniego, J.; Borge, D.; Ferrer, J.A.; Carazo, R.; Heras, M.R. Energy performance assessment of a polygeneration plant in different weather conditions through simulation tools. Energy Build. 2016, 124, 7–18. [Google Scholar] [CrossRef]
  30. Ramadhani, F.; Hussain, M.A.; Mokhlis, H.; Illias, H.A. Optimal heat recovery using photovoltaic thermal and thermoelectric generator for solid oxide fuel cell-based polygeneration system: Techno-economic and environmental assessments. Appl. Therm. Eng. 2020, 181, 116015. [Google Scholar] [CrossRef]
  31. Mendecka, B.; Tribioli, L.; Cozzolino, R. Life Cycle Assessment of a stand-alone solar-based polygeneration power plant for a commercial building in different climate zones. Renew. Energy 2020, 154, 1132–1143. [Google Scholar] [CrossRef]
  32. Yu, P.; Luo, Z.; Wang, Q.; Fang, M. Life cycle assessment of transformation from a sub-critical power plant into a polygeneration plant. Energy Convers. Manag. 2019, 198, 111801. [Google Scholar] [CrossRef]
  33. Jana, K.; De, S. Environmental impact of an agro-waste based polygeneration without and with CO2 storage: Life cycle assessment approach. Bioresour. Technol. 2016, 216, 931–940. [Google Scholar] [CrossRef]
  34. Gładysz, P.; Saari, J.; Czarnowska, L. Thermo-ecological cost analysis of cogeneration and polygeneration energy systems-Case study for thermal conversion of biomass. Renew. Energy 2020, 145, 1748–1760. [Google Scholar] [CrossRef]
  35. Liu, P.; Pistikopoulos, E.N.; Li, Z. A mixed-integer optimization approach for polygeneration energy systems design. Comput. Chem. Eng. 2009, 33, 759–768. [Google Scholar] [CrossRef]
  36. Urbanucci, L. Limits and potentials of Mixed Integer Linear Programming methods for optimization of polygeneration energy systems. Energy Procedia 2018, 148, 1199–1205. [Google Scholar] [CrossRef]
  37. Wu, N.; Zhan, X.; Zhu, X.; Zhang, Z.; Lin, J.; Xie, S.; Meng, C.; Cao, L.; Wang, X.; Shah, N.; et al. Analysis of biomass polygeneration integrated energy system based on a mixed-integer nonlinear programming optimization method. J. Clean. Prod. 2020, 271, 122761. [Google Scholar] [CrossRef]
  38. Pinto, E.S.; Serra, L.M.; Lázaro, A. Evaluation of methods to select representative days for the optimization of polygeneration systems. Renew. Energy 2020, 151, 488–502. [Google Scholar] [CrossRef]
  39. Bracco, S.; Delfino, F.; Pampararo, F.; Robba, M.; Rossi, M. A dynamic optimization-based architecture for polygeneration microgrids with tri-generation, renewables, storage systems and electrical vehicles. Energy Convers. Manag. 2015, 96, 511–520. [Google Scholar] [CrossRef]
  40. Khanmohammadi, S.; Atashkari, K. Modeling and multi-objective optimization of a novel biomass feed polygeneration system integrated with multi effect desalination unit. Therm. Sci. Eng. Prog. 2018, 8, 269–283. [Google Scholar] [CrossRef]
  41. Yeşilkaya, M.; Daş, G.S.; Türker, A.K. A multi-objective multi-period mathematical model for an industrial symbiosis network based on the forest products industry. Comput. Ind. Eng. 2020, 150, 106883. [Google Scholar] [CrossRef]
  42. Ahmadi, P.; Rosen, M.A.; Dincer, I. Multi-objective exergy-based optimization of a polygeneration energy system using an evolutionary algorithm. Energy 2012, 46, 21–31. [Google Scholar] [CrossRef]
  43. Liu, Y.; Han, J.; You, H. Exergoeconomic analysis and multi-objective optimization of a CCHP system based on LNG cold energy utilization and flue gas waste heat recovery with CO2 capture. Energy 2020, 190, 116201. [Google Scholar] [CrossRef]
  44. Yu, J.Y.; Xu, R.S.; Zhang, J.L.; Zheng, A.Y. A review on reduction technology of air pollutant in current China’s iron and steel industry. J. Clean. Prod. 2023, 414, 137659. [Google Scholar] [CrossRef]
  45. Yue, Q.; Chai, X.C.; Zhang, Y.J.; Wang, Q.; Wang, H.M.; Zhao, F.; Ji, W.; Lu, Y.Q. Analysis of iron and steel production paths on the energy demand and carbon emission in China’s iron and steel industry. Environ. Dev. Sustain. 2023, 25, 4065–4085. [Google Scholar] [CrossRef]
  46. Inayat, A. Current progress of process integration for waste heat recovery in steel and iron industries. Fuel 2023, 338, 127237. [Google Scholar] [CrossRef]
  47. Yuan, Y.X.; Na, H.M.; Du, T.; Qiu, Z.Y.; Sun, J.C.; Yan, T.Y.; Che, Z.C. Multi-objective optimization and analysis of material and energy flows in a typical steel plant. Energy 2023, 263, 125874. [Google Scholar] [CrossRef]
  48. Li, Z.; Shen, A.Q.; Yang, X.R.; Guo, Y.C.; Liu, Y.W. A review of steel slag as a substitute for natural aggregate applied to cement concrete. Road Mater. Pavement Des. 2023, 24, 537–559. [Google Scholar]
  49. Huang, D.; Dinga, C.D.; Tao, Y.; Wen, Z.G.; Wang, Y.H. Multi-objective optimization of energy conservation and emission reduction in China’s iron and steel industry based on dimensionality reduction. J. Clean. Prod. 2022, 368, 133131. [Google Scholar] [CrossRef]
  50. Zou, D.; Li, S.; Xuan, K.; Ouyang, H. A NSGA-II variant for the dynamic economic emission dispatch considering plug-in electric vehicles. Comput. Ind. Eng. 2022, 173, 108717. [Google Scholar] [CrossRef]
  51. Delpasand, M.; Bozorg-Haddad, O.; Loáiciga, H.A. Integrated virtual water trade management considering self-sufficient production of strategic agricultural and industrial products. Sci. Total Environ. 2020, 743, 140797. [Google Scholar] [CrossRef] [PubMed]
  52. World Steel Association. World Steel Statistics 2021; World Steel Association: Brussels, Belgium, 2021. [Google Scholar]
  53. Cao, X.; Wen, Z.G.; Xu, J.; De Clercq, D.; Wang, Y.; Tao, Y. Many-objective optimization of technology implementation in the industrial symbiosis system based on a modified NSGA-III. J. Clean. Prod. 2020, 245, 118810. [Google Scholar] [CrossRef]
  54. Cao, X.; Wen, Z.G.; Zhao, X.; Wang, Y.; Zhang, H. Quantitative assessment of energy conservation and emission reduction effects of nationwide industrial symbiosis in China. Sci. Total Environ. 2020, 717, 137114. [Google Scholar] [CrossRef] [PubMed]
  55. Wang, Y.H.; Chen, C.; Tao, Y.; Wen, Z.G.; Chen, B.; Zhang, H. A many-objective optimization of industrial environmental management using NSGA-III: A case of China’s iron and steel industry. Appl. Energy 2019, 242, 46–56. [Google Scholar]
  56. Wang, Y.H.; Wen, Z.G.; Yao, J.; Dinga, C.D. Multi-objective optimization of synergic energy conservation and CO2 emission reduction in China’s iron and steel industry under uncertainty. Renew. Sust. Energy Rev. 2020, 134, 110128. [Google Scholar] [CrossRef]
  57. National Bureau Statistics of China. 2024. Available online: https://data.stats.gov.cn/easyquery.htm?cn=C01 (accessed on 7 July 2024).
Figure 1. Production of wastes and by-products in the iron and steel industry. Note: ② ④ ⑥ ⑨ ⑭: Residual heat and pressure will be generated from sinter, coking, blast furnace ironmaking, converter steelmaking, and steel rolling processes. ① ③ ⑦ ⑩ ⑪ ⑮: Various by-products or waste will be generated from sinter, coking, blast furnace ironmaking, converter steelmaking, electric furnace steelmaking, and steel rolling processes. ⑤ ⑧ ⑫ ⑬: The sequence between different processes.
Applsci 14 08052 g001
Figure 2. Polygeneration process simulation of the iron and steel industry, chemical industry, building materials industry, and power industry.
Applsci 14 08052 g002
Figure 3. Spacing metrics in different generations. (a) For the iron and steel plant with 3 Mt/a capacity and (b) for the iron and steel plant with 9 Mt/a.
Applsci 14 08052 g003
Figure 4. Mean values of the solution set. (ac) For energy conservation, pollutant emission reduction equivalent and economic benefit of the iron and steel plant with 3 Mt/a capacity, respectively; (df) for energy conservation, pollutant emission reduction equivalent and economic benefit of the iron and steel plant with 9 Mt/a capacity, respectively.
Applsci 14 08052 g004aApplsci 14 08052 g004bApplsci 14 08052 g004c
Figure 5. Spearman analysis results of target correlation. (a) For the iron and steel plant with 3 Mt/a capacity; (b) for the iron and steel plant with 9 Mt/a capacity. EC = Energy conservation goal; EB = Economic benefit goal; SO2 = SO2 reduction goal; NOx = NOx reduction goal; PM = PM reduction goal.
Applsci 14 08052 g005
Figure 6. The utilization ratio of by-products/waste of 20 technologies in the polygeneration system for the iron and steel plants with 3 Mt/a and 9 Mt/a capacity.
Applsci 14 08052 g006
Table 1. Main equipment and scale parameters of iron and steel plants with a capacity of 3 Mt/a and 9 Mt/a.
Technical ParameterWorking Time of Main Equipment (d)
Grade of lump ore62%Ratio of steel scrap10%/8% 1Sintering machine330
Grade of sintering55%Ratio of molten iron90%/92% 1Blast furnace350
Grade of pellet63%Coefficient of sintering machine1.45 t/(m2·h)Converter320
Ratio of lump ore10%Coefficient of blast furnace2.40 t/(m3·d)Continuous casting320
Ratio of sintering60%/67.3% 1Withdrawing speed of continuous casting2.3–2.6 m/minRolling mill300
Ratio of pellet30%/23.7% 1Comprehensive grade58.1%
Note: 1 60%, 30%, 10%, and 90% are the parameters for iron and steel plants with a capacity of 3 Mt/a, while 67.3%, 23.7%, 8%, and 92% are the parameters for iron and steel plants with a capacity of 9 Mt/a.
Table 2. Production data of the iron and steel industry.
ParameterValueUnit
Coke production/crude steel production0.355/
Sinter production/crude steel production0.991/
Pelletizing production/crude steel production0.495/
Iron production/crude steel production0.938/
Coke oven gas production435.0m3/t coke
Blast furnace gas production1621.0m3/t iron
Flash gas production5940.0m3/t iron
Converter gas production100.0m3/t steel
Blast furnace slag/flash slag production0.310t/t iron
Converter slag production0.110t/t tseel
Desorption gas output from hydrogen production0.6m3/m3 coke oven gas for hydrogen production
Table 3. Material transformation data, technology data, and economic data.
No.Energy Conservation
(kgce/t Product)
SO2 Reduction
(g/t Product)
NOx Reduction
(g/t Product)
PM Reduction
(g/t Product)
Fixed Cost
(CNY/t Product)
O&M Cost
(CNY/t Product)
Technical Life (Years)Benefits per Unit of Raw Material
(CNY/t Product)
T112.6510.0029.901.90130.0018.892534.64
T219.002.682.870.492.500.502510.90
T345.7020.0024.004.002.500.50255.40
T419.607.407.921.3641.6014.002532.00
T594.626.401.201.6022.4263.7225120.84
T627.6244.007.2046.80116.7521.162544.56
T75.7013.0014.0012.501259.301219.10141367.90
T812.237.807.201.6012.236.93259.18
T912.509.6010.8010.2012.506.362513.50
T1076.7556.0067.0012.60164.4593.2525120.84
T1116.3719.5018.004.0016.374.16256.51
T1223.0817.8012.0014.6023.0812.372525.85
T1316.0016.0032.0048.00160.00255.0025291.00
T1416.5233.0097.7247.43162.56104.4225150.00
T1572.0042.7028.6049.927.20180.0025220.00
T1633.9429.6026.30107.0093.94442.5025530.00
T1724.6231.6792.4641.0524.6219.572527.93
T183.8920.6014.7020.303.8912.842530.00
T190.050.270.290.050.540.07250.08
T200.050.000.020.000.020.02250.11
Table 4. The average optimization results of energy conservation and emission reduction in the iron and steel plants.
Iron and Steel Plant with 3 Mt/a Capacity
Energy Conservation
(ktce)
SO2 Reduction
(t)
NOx Reduction
(t)
PM Reduction
(t)
Economic Benefit
(CNY 108)
Maximum638.8851.3984.1054.034.20
Minimum557.3139.7048.3239.942.59
Average588.9845.8661.5347.033.740
Iron and Steel Plant with 9 Mt/a Capacity
Energy Conservation
(ktce)
SO2 Reduction
(t)
NOx Reduction
(t)
PM Reduction
(t)
Economic Benefit
(CNY 108)
Maximum2051.71156.65200.29185.0213.75
Minimum1584.24116.70117.40127.529.79
Average1786.95133.02147.90145.5012.33
Table 5. Polygeneration technology selection under the final decision scheme.
Polygeneration PathIron and Steel Plant with 3 Mt/a CapacityIron and Steel Plant with 9 Mt/a Capacity
Path 1T1, T2, T3, T4, T5, and T8T1, T2, T3, T5, and T8
Path 2T10 and T11T10
Path 3T14 and T15T12 and T15
Path 4T16, T17, and T19T16, T17, T19, and T20
Disclaimer/Publisher’s Note: The statements, opinions and data contained in all publications are solely those of the individual author(s) and contributor(s) and not of MDPI and/or the editor(s). MDPI and/or the editor(s) disclaim responsibility for any injury to people or property resulting from any ideas, methods, instructions or products referred to in the content.

