Article

Engineering Vehicle Detection Based on Improved YOLOv6

1
School of Information and Control Engineering, China University of Mining and Technology, Xuzhou 221116, China
2
School of Mechanical Engineering, Zhejiang University, Hangzhou 310058, China
*
Author to whom correspondence should be addressed.
Appl. Sci. 2024, 14(17), 8054; https://doi.org/10.3390/app14178054
Submission received: 4 August 2024 / Revised: 26 August 2024 / Accepted: 2 September 2024 / Published: 9 September 2024

Abstract

:
Engineering vehicles play a vital role in supporting construction projects. However, due to their substantial size, heavy tonnage, and significant blind spots while in motion, they present a potential threat to road maintenance, pedestrian safety, and the well-being of other vehicles. Hence, monitoring engineering vehicles holds considerable importance. This paper introduces an engineering vehicle detection model based on improved YOLOv6. First, a Swin Transformer is employed for feature extraction, capturing comprehensive image features to improve the detection capability of incomplete objects. Subsequently, the SimMIM self-supervised training paradigm is implemented to address challenges related to insufficient data and high labeling costs. Experimental results demonstrate the model’s superior performance, with a m A P 50 : 95 value of 88.5% and m A P 50 value of 95.9% on the dataset of four types of engineering vehicles, surpassing existing mainstream models and proving its effectiveness in engineering vehicle detection.

1. Introduction

Engineering vehicles are heavy machinery dedicated to performing construction engineering tasks on the site, and take a proactive part in supporting the smooth progress of various construction projects [1]. Amidst the rapid growth of both the construction and transportation sectors, the requirement for different types of engineering vehicles is increasing, and problems with the management of engineering vehicles have emerged [2]. Compared with ordinary civilian vehicles, engineering vehicles have the characteristics of having a large cargo load, driving blind spots, large emissions, and an overly wide body, which seriously affect the maintenance of roads and their facilities, as well as traffic safety [3]. To ensure the safe operation of engineering vehicles in urban environments, relevant authorities have issued regulations that impose strict controls on the time, speed, and routes these vehicles may use within cities. This is particularly important for monitoring restricted or time-limited zones, such as city center roads and elevated highways.
Nonetheless, compliance issues arise as some engineering vehicles bypass these regulations through unauthorized detours or nocturnal operations, compromising the safety of other road users and inflating traffic supervision costs [4]. This misconduct introduces numerous road traffic safety concerns. Streamlining with advancements in computer technology and artificial intelligence, vehicle detection technologies have been integrated into intelligent transportation systems. These technologies, through sophisticated algorithms and camera systems, enable precise identification and tracking of engineering vehicles. Such measures significantly mitigate traffic management expenses and bolster the safety of pedestrians and other vehicles. As the foundation of an engineering vehicle monitoring system, accurate detection technology is crucial for ensuring the effectiveness of the entire monitoring process. Therefore, developing an algorithm capable of achieving high-precision detection has become an urgent need in current research.
To address the challenges of detecting engineering vehicles, this study proposes an innovative detection model that integrates the efficient object detection capabilities of YOLOv6 [5], the deep feature extraction power of a Swin Transformer [6], and the advantages of self-supervised learning offered by a simple framework for masked image modeling (SimMIM) [7]. YOLOv6 is a leading object detection algorithm, distinguished by its quick and reliable detection results. As a member of the sixth generation of the YOLO series, it is crafted specifically for tasks requiring immediate object detection [5]. The Swin Transformer, a vision model based on the Transformer architecture, effectively captures both comprehensive and detailed features through its hierarchical feature representation and self-attention mechanism, showing significant potential in the field of visual recognition [6]. SimMIM, a novel self-supervised learning framework, achieves feature learning without labeled data by masking image regions and predicting their content, providing a solution for data-scarce scenarios [7]. By combining these technologies, the main achievements of this study are as follows:
  • Within this research, we combine a Swin Transformer with YOLOv6, specifically optimized for the task of detecting engineering vehicles. The incorporation of the Swin Transformer, with its exceptional global feature extraction and interpretation capabilities, notably boosts the model’s precision in recognizing partially occluded vehicles. This technological integration not only represents a major breakthrough compared to traditional convolutional neural network (CNN) methods but also demonstrates higher detection precision and robustness in diverse operational environments.
  • Given the economic challenges associated with data collection and annotation in the field of engineering vehicle detection, we adopt the SimMIM self-supervised learning paradigm to address this issue. Through this strategy, we significantly reduced the reliance on large-scale annotated datasets, thereby alleviating the financial and time costs associated with model training. The results of this study not only confirm that self-supervised learning is capable of maintaining or even elevating the efficacy of detection models without expensive annotation work, but also provide an economically efficient solution for resource-constrained projects and research.

2. Related Work

Engineering vehicle detection refers to identifying these vehicles within a given area, pinpointing their locations, and accurately classifying their types. Traditional object detection algorithms mainly rely on manually extracted features. For instance, Viola et al. developed a fast and efficient face detection framework based on integral images. They extracted Haar-like features by computing the pixel intensity differences within an image window and used adaptive boosting to enhance the detection process [8]. Dalal et al. divided the image window into small spatial regions and then extracted the gradient information [9]. By statistically analyzing the direction and magnitude of gradients in the image to capture local features, they obtained a histogram of oriented gradients (HOG) features. The processed HOG features were then input into a support vector machine (SVM) to effectively recognize pedestrian objects [10]. Felzenszwalb et al. advanced this by leveraging enhanced HOG features and a pictorial structure model with Latent SVM, effectively detecting deformed objects. This approach, complemented by non-maximum suppression, proved effective in detecting deformed objects with varying attitudes [11]. While traditional object detection algorithms yielded satisfactory results at the time, many of these methods involved multiple steps and demanded substantial manual effort, highlighting the need for improvements in efficiency and accuracy.
The rise of deep learning, propelled by advancements in computer technology and computational power, has significantly outperformed traditional algorithms in object detection. Generally, it can be divided into the one-stage method and the two-stage method. The algorithm of the two-stage method typically involves two stages: region proposal, and object classification and location regression. The first stage often employs a CNN to produce a refined region proposal. In the second stage, leveraging the selected region proposal, the algorithm performs object classification and regression, ultimately yielding the object classes and precise coordinates. The prominent two-stage networks encompass R-CNN and its improved algorithms [12]. R-CNN is a pioneering object detection algorithm that extracts candidate regions through selective search and then uses a CNN to perform feature extraction and classification for each region [12]. Fast R-CNN is an improvement over R-CNN, it runs the CNN once on the entire image and then extracts features for each candidate region, which improves detection speed [13]. Faster R-CNN introduces a region proposal network that works in parallel with the CNN, achieving an end-to-end object detection process [14]. Cascade R-CNN is a cascade architecture of R-CNN that progressively improves detection accuracy through multiple stages of detection and refinement, particularly excelling at handling objects of different sizes [15]. R-FCN directly performs feature extraction and classification on candidate regions using a fully convolutional network, eliminating the need for deep feature extraction during the region proposal process, thus improving efficiency [16]. The one-stage algorithm performs the task of bounding box estimation and object classification in a single operation. The YOLO series [5,17,18,19,20,21] and single shot multibox detector (SSD) [22] are widely recognized as standard one-stage algorithms. YOLO is a single-stage detection algorithm known for its fast detection speed. It directly predicts bounding boxes and class probabilities on the image without the need for a region proposal. SSD is also a single-stage detection algorithm that detects objects of various sizes by using default boxes on feature maps at different scales. Compared to two-stage algorithms, one-stage algorithms typically exhibit better real-time performance.
Within the domain of vehicle detection, numerous references and methods are available, with some vehicle detection approaches still holding reference significance in the context of engineering vehicle detection. Traditional vehicle detection algorithms still depend on the manual extraction of features. Liu et al. applied HOG features to identify engineering vehicles within high-definition images [23]. Choudhury et al. employed Haar-like features based on Haar feature-based cascade classifiers to swiftly and efficiently detect vehicles in real-time closed-circuit television footages [24]. Harjoko et al. implemented a Haar cascade classifier and optical flow technique for the purpose of identifying and following vehicles [25]. As deep learning technology has advanced, it has been extensively utilized for vehicle and engineering vehicle detection across various applications. Su et al. enhanced the region proposal network structure of the Faster R-CNN to achieve the detection of three common types of vehicles encountered in traffic scenarios [26]. Sang et al. enhanced the anchor boxes selection method for YOLOv2 and employed a multi-layer feature fusion strategy [27]. Guo et al. introduced a novel feature fusion module alongside an orientation-aware bounding box proposal module. Combined with the SSD algorithm, this approach achieved the detection of dense engineering vehicles in drone images [28]. Zhang et al. implemented an advanced version of YOLOv5 for vehicle detection across diverse traffic contexts, leveraging the flip-mosaic to boost detection of small objects and diminish the rate of false vehicle detections [29]. Xiang et al. improved the YOLOv4-Tiny model by incorporating a split-attention module and a dynamic ReLU function to optimize detection in raw material warehouse scenarios. Despite these improvements, the model’s generalizability is restricted due to the specialized warehouse environment in which the data was collected [4].
While existing studies offer valuable contributions, most focus on general vehicle detection or are limited by specific environmental conditions, such as camera angles or scene settings. Our research addresses these limitations by developing a more versatile and adaptable detection method, aimed at fulfilling the urgent need for intelligent detection of engineering vehicles in diverse scenarios within intelligent transportation systems.

3. Methods

3.1. Backbone

The Swin Transformer [6], recognized as a versatile backbone for general-purpose computer vision, has attracted significant attention since its introduction. In real-world traffic scenarios, engineering vehicles are often partially obscured by other vehicles, utility poles, green belts, and other obstacles, leading to incomplete captures, posing a common challenge in detection tasks. To address this challenge, we selected the Swin Transformer as the backbone. Its strength lies in its excellent global feature extraction capability and hierarchical feature representation mechanism, which enables the network to capture both fine-grained and coarse-grained features. This ability not only ensures effective detection of local features but also adapts to the challenges posed by varying object sizes, making it well-suited for the accurate detection requirements in intelligent transportation systems.
The Vision Transformer (ViT) is a model that harnesses the Transformer architecture to a visual domain. It processes visual data by dividing images into multiple small patches and applying self-attention mechanisms. Compared to the ViT, the Swin Transformer introduces a patch merging operation, which allows it to seize features on multiple scales across various levels. It improves its efficacy in dealing with objects of notably different dimensions [30,31]. As is shown in Figure 1, building upon the ViT, the Swin Transformer initiates processing with smaller patches and gradually consolidates adjacent patches as it delves into deeper layers of the Transformer architecture. This process constructs a hierarchical representation, empowering the backbone to effectively process both fine-grained and coarse-grained information at various levels.
For this study, we employ a Swin Transformer as feature extraction network for the object detection model and extract features from engineering vehicles in the dataset [6]. The framework of the Swin Transformer is illustrated within the blue dashed lines in Figure 2, which denotes the backbone segment. The Swin Transformer comprises four primary stages. Analogous to the structure of CNN, the feature dimension is halved, and the channel count is doubled at the end of each stage.
The original images are preprocessed using methods such as Mosaic, random affine transformation, MixUp, HSV color space adjustment, and random flipping. After preprocessing, the image is dissected into several patches by the Patch Partition module, preparing for subsequent feature extraction and self-attention calculations. After going through the linear embedding layer mapping, the image is input into the Swin Transformer block to calculate self-attention. Figure 3 displays a diagram of the Swin Transformer block’s architecture.
Unlike the multi-head self-attention in the ViT [31], the Swin Transformer replaces it with W-MSA, a variant of the self-attention mechanism that reduces computation load by processing self-attention independently in isolated local windows. W-MSA divides the feature map into local windows with no overlap, and each window independently performs self-attention calculations. This update simplifies the computation of the attention mechanism.
To tackle the challenge of facilitating information sharing among different windows, the second part utilizes the SW-MSA module. It is an enhanced version of W-MSA, which improves information interaction between windows by shifting the window partition lines, thereby enhancing the model’s ability to capture global image features. This is illustrated in Figure 4. The SW-MSA module shifts the partition line of the window to the lower right, creating a novel window configuration. Within these newly constructed windows, four of them encompass certain features from the original adjacent windows, facilitating information interaction between them. This strategy enhances information exchange among various regions in the input, thereby improving the model’s overall perception capability.
In the task of engineering vehicle detection, various scales and distributions of engineering vehicles exist. The Swin Transformer, serving as a feature extraction network, demonstrates superior capability in extracting global features from images compared to CNN.

3.2. Self-Supervised Pre-Training Backbone

Self-supervised learning involves deriving supervised signals from unlabeled data. The emergence of self-supervised learning has led to a shift in the field of computer vision, with self-supervised pre-training followed by fine-tuning for downstream tasks becoming more prevalent than the conventional method of supervised pre-training combined with task fine-tuning. The use of a self-supervised learning pre-trained backbone holds significant importance in addressing the challenge of insufficient data annotation in large-scale image datasets. Through leveraging the inherent structural information within images, self-supervised learning is capable of acquiring valuable feature representations. As a result, the pre-trained backbone network weights exhibit enhanced effectiveness when applied to subsequent tasks.
In our research, we utilize SimMIM for the training of the backbone, specifically the Swin Transformer. The diagrammatic representation of the SimMIM learning paradigm is illustrated in Figure 5. SimMIM uses a simple mask image modeling framework. The original image is partitioned into multiple patches, and a random subset is masked based on a specified proportion. These masked patches are then input into the encoder. Following feature extraction network coding, a lightweight predictive head decodes the information. The resulting output mask region is compared with the original image region, facilitating self-supervised learning. The experiments of SimMIM have demonstrated that even a very lightweight decoder can yield satisfactory results. Therefore, the prediction head in this paper employs only a single linear layer [7].
The original image is resized to 192 × 192 and partitioned into 32 patches. Random masking is applied to these patches with a mask ratio of 0.6. The predicted results and the ground truth are calculated by L s l , which is defined as:
L s l = 1 Ω ( I M ) O M I M 1
where I and O represent the input and output pixel values, respectively, M denotes the collection of masked pixels, and Ω ( · ) signifies the pixel count [7]. To bolster the ability to extract features and harness the advantages of self-supervised learning with large-scale datasets, the ImageNet-1K dataset [32] is included in the training process alongside the engineering vehicle dataset. Throughout the object detection model training process, the Swin Transformer directly incorporates the pre-training weights obtained from self-supervised learning.

3.3. YOLOv6 Algorithm

YOLOv6 represents a YOLO model introduced by Meituan. This study builds upon YOLOv6 by enhancing its network architecture, substituting the feature extraction network with the Swin Transformer while retaining the neck and head components of YOLOv6-L. The improved YOLOv6 network architecture used in this study is shown in Figure 2.
In the neck section, the PAN (Path Aggregation Network) [33] topology serves as the backbone for aggregating feature maps from various levels. This approach ensures comprehensive utilization of information in each feature map, thereby enhancing the preservation of details within low-resolution feature maps [34]. The goal of integrating the CSPStackRep block into YOLOv6 is to strike a superior balance between computational load and accuracy. The configuration of the CSPStackRep module is depicted in Figure 6a [5,35]. The CSPStackRep blocks leverage cross stage partial connections to enhance performance without introducing excessive computational costs. In YOLOv6-L, the module consists of three 1 × 1 convolutions and six double RepBlocks, each with residual connection. The RepBlock comprises a RepVGG and ReLU activation function, as depicted in Figure 6b. Throughout the training phase, the RepVGG module features three branches, enhancing the availability of gradient information. During inference, RepVGG seamlessly transforms into a convolutional module, named RepConv, employing structural parameter reconstruction technology to minimize computational load in the model inference process. Figure 6c provides an illustration of the RepConv [36]. YOLOv6 employs an efficient decoupled head that incorporates the unique channel method to create an effective decoupled head for classification and localization tasks. This enhancement contributes to improved overall network efficiency and prediction accuracy. Additionally, YOLOv6 incorporates anchor point-based anchor-free detectors to reduce the time cost associated with post-processing [5].

3.4. Loss Functions

Object detection involves both classification and localization, where classification pertains to the classification loss and localization refers to the loss associated with predicting the bounding boxes. To address classification losses, YOLOv6 utilizes VariFocal Loss, which reduces the weight of negative examples and concentrates training on high-quality positive examples. For box regression losses, YOLOv6 utilizes GIoU for intersection over union (IoU) losses and distribution focal loss for probability losses [37].

4. Experiments

4.1. Devices, Environments, and Hyperparameters

The setup of the experimental platform is depicted in Table 1. We utilized four 24 GB NVIDIA GeForce RTX 4090 GPUs for our experiment. The experiment was conducted on Ubuntu 20.04 systems, utilizing Python 3.8.18 and CUDA 11.3. The implementation was conducted using PyTorch 1.11.0, leveraging the mmyolo [38] and mmdetection [39] frameworks from the OpenMMLab open-source project.
For the models’ training, hyperparameters were configured to allow for 60 epochs with a batch size of 16. The input images were resized to 640 × 640 , and the starting learning rate was established at 2.5 × 10 3 , with further adjustment using CosineAnnealing.

4.2. Dataset

We collected 6282 images of four classes of engineering vehicles from the Internet, including pump truck, excavator, road roller, and dump truck. The dataset includes images of engineering vehicles with varying sizes, locations, and backgrounds to improve the model’s resilience post-training. Factoring in the dispersion of various engineering vehicle types, we roughly assigned 80% of the dataset to training, and equally divided the remaining 20% between validation and testing. Specifically, 5025 images were designated for training, 628 for validation, and 629 for testing. The quantity distribution of the four types of engineering vehicles is depicted in Figure 7. The schematic diagram of the four classes of engineering vehicles is illustrated in Figure 8. To facilitate observation, rectangles are used to mark the objects, with all images adjusted to a consistent size.

4.3. Evaluation Metrics

Mean average precision ( m A P ) is employed to gauge the model’s effectiveness by offering a comprehensive assessment that accounts for precision and recall. The formulae for precision and recall are as follows:
P r e c i s i o n = T P T P + F P
R e c a l l = T P T P + F N
where T P represents the true positive count, indicating the number of objects predicted to be positive that are actually positive, F P represents the false positive count, indicating the number of objects predicted to be positive that are actually negative, and F N represents the false negative count, indicating the count of objects that were falsely identified as negative instead of being positive. The area under the precision–recall curve under different classification thresholds signifies the mean accuracy of a classification, which is expressed as follows:
A P = 0 1 P ( R ) d R
where P ( R ) denotes the precision of the model when the recall is R. m A P represents the average A P for all classes, and m A P is defined as follows:
m A P = 1 N i = 1 N A P i
where N denotes the variety of engineering vehicle classes, and A P i denotes the average accuracy of class i engineering vehicles. Calculations of m A P are conducted at predefined IoU thresholds, with m A P 50 corresponding to an IoU of 0.5, and m A P 50 : 95 reflecting the mean of m A P values at thresholds incrementally set from 0.5 to 0.95.

4.4. Experimental Results

In this research, we evaluated the efficacy of our model by comparing it with prevalent object detection methods. Additionally, ablation studies were conducted to substantiate the effectiveness of particular modules or approaches.

4.4.1. Comparison between Different Models

We contrast the results of experiments on engineering vehicle detection using the current popular YOLO series algorithm and a subset of two-stage algorithms. Detailed performances are displayed in Table 2.
As shown in Table 2, in contrast to the current mainstream YOLO series algorithms and two-stage models such as Faster R-CNN, the proposed improved YOLOv6 model has achieved the best results in m A P 50 : 95 and other indicators, in which m A P 50 : 95 reached 88.5% and m A P 50 reached 95.9%.
To further evaluate the accuracy and robustness of our model’s predictions, we conducted a statistical analysis by calculating the mean and standard deviation of the IoU between the predicted results and the ground truth. This analysis allows us to assess the uniformity and consistency of the model’s prediction accuracy. Additionally, we computed the mean and standard deviation of the IoU based on the ground truth to evaluate the uniformity and consistency of detection coverage. Furthermore, to demonstrate that our proposed algorithm is significantly better than other methods, we also calculated the significance level at which the mean IoU of our proposed method is greater than that of other algorithms. The results are detailed in Table 3.
As shown in Table 3, our proposed method achieves the highest prediction accuracy among several common object detection methods, with only a slightly lower consistency compared to YOLOv5-L. Except for YOLOv8-L and YOLOv5-L, the significance levels are all below 0.05, indicating that our proposed method is significantly more accurate in detection than most other algorithms. This slight difference is attributable to YOLOv5-L detecting fewer targets, as it has stricter detection criteria. This stricter criterion results in YOLOv5-L having a lower mean IoU based on ground truth, indicating poorer detection coverage. In contrast, our proposed approach outperforms others in both detection coverage and consistency, with significance levels all below 0.05, demonstrating that our method provides a comprehensive and balanced detection for all ground truth.

4.4.2. Contrasting Various Backbone Architectures

To assess the performance of the Swin Transformer, we replaced multiple feature extraction networks of YOLOv6 and compared the corresponding experimental results [40,41].
According to the results presented in Table 4, YOLOv6 utilizing the Swin Transformer base as its backbone outperforms other backbone options. In comparison to the default EfficientRep and PVTv2-B5, our proposed method exhibited improvements in m A P 50 : 95 performance by 5.7% and 0.7%, respectively, affirming the effectiveness of the Swin Transformer.

4.4.3. Comparing Different Pre-Training Weights

To assess the impact of the self-supervised pre-training network on effectiveness, we conducted experiments comparing results with different pre-training weights and without utilizing any pre-training weight. The metrics of specific experiments are illustrated in Table 5, where ’Scratch’ indicates no pre-training weight, ’Supervised’ denotes the use of weight trained on the ImageNet-1K dataset [32], and ’SimMIM’ indicates the use of weight trained without supervision.
The experimental results indicate that, in comparison to pre-training weights without pre-training and those with supervised training, pre-training weights trained with the SimMIM self-supervised learning paradigm exhibit increases of 13.8% and 5.9%, respectively, in m A P 50 : 95 . The SimMIM self-supervised learning paradigm is capable of learning effective feature representations across a diverse set of unlabeled datasets, enhancing the representational capacity of the network. It aids in the network’s ability to glean more effective features from engineering vehicle imagery, ultimately improving its overall performance.

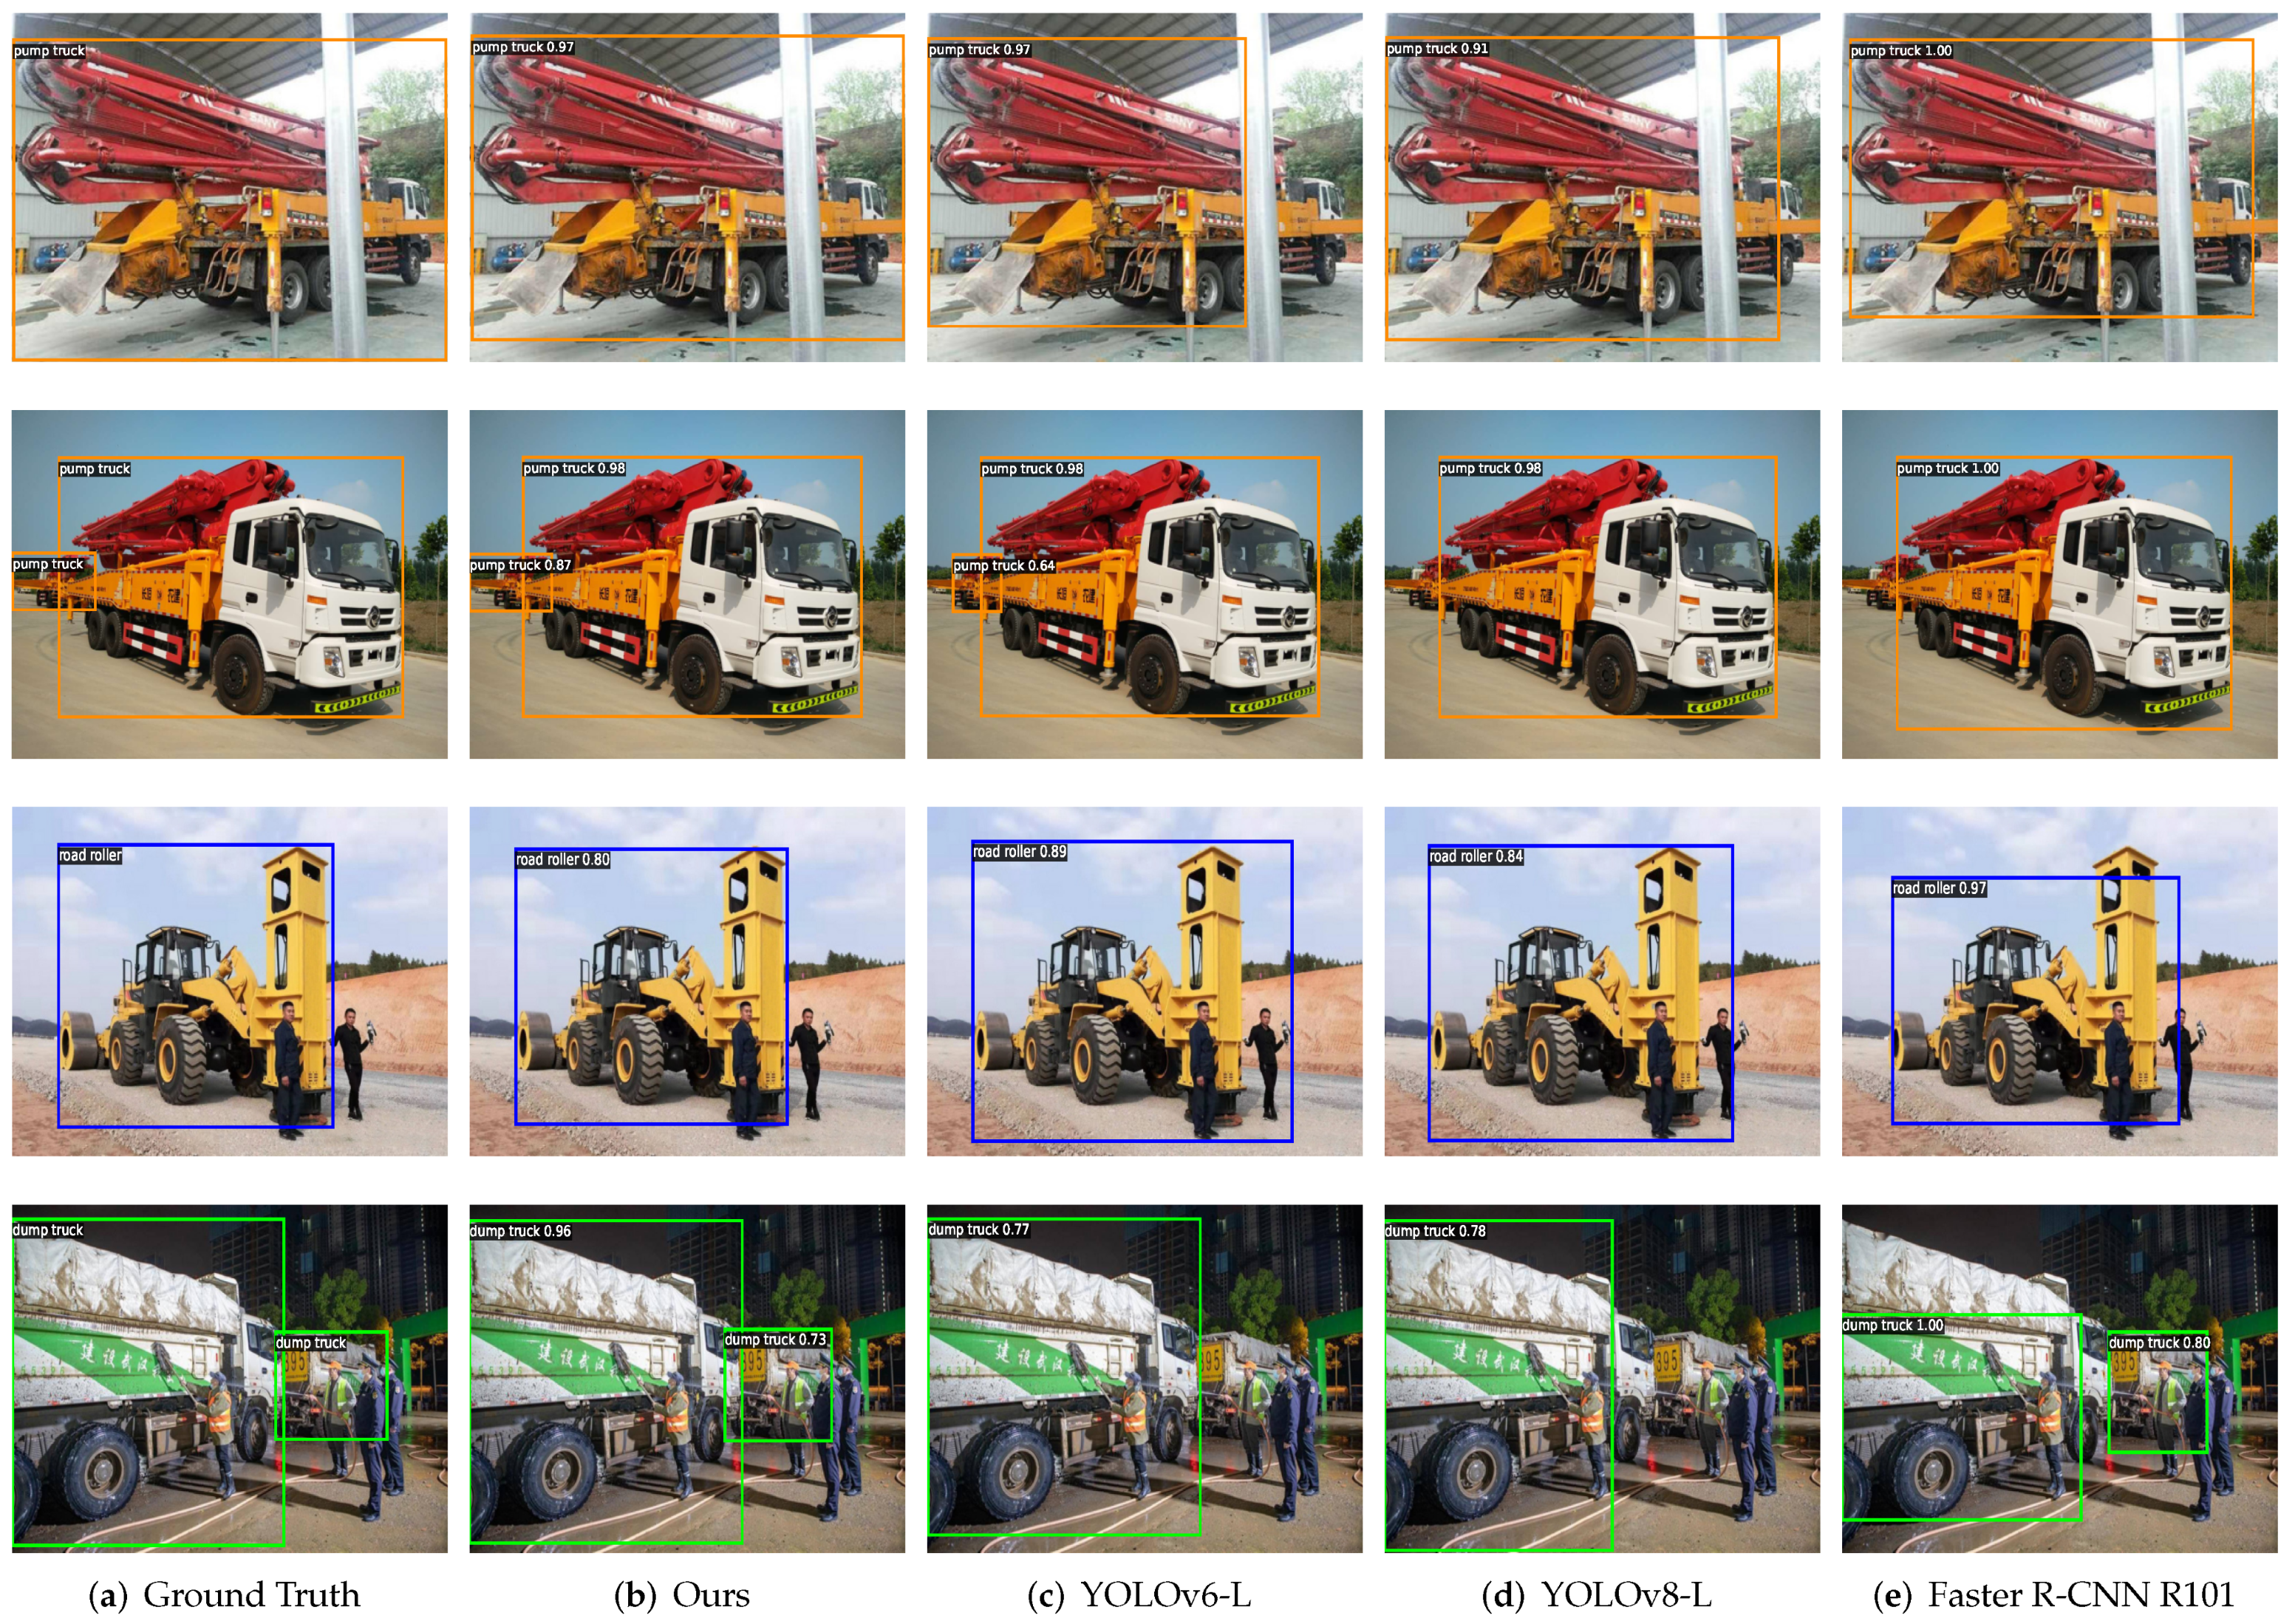
4.4.4. Comparison of Examples

To additionally demonstrate the efficacy of our proposed algorithm for engineering vehicles, we present several cases from the test set along with their corresponding inference results, as depicted in Figure 9. During inference, we have established a score threshold of 0.5, visualizing the results with scores exceeding 0.5 in the images.
As evident from the comparison in Figure 9, our method successfully extracts global features from images. In comparison to classical object detection algorithms like YOLOv6, YOLOv8, and Faster R-CNN, our method demonstrates superior capability in identifying objects with occlusion and interference in the images.

5. Conclusions

This study introduces an improved YOLOv6 model incorporating the Swin Transformer to address the challenge of detecting engineering vehicles. Inspired by the outstanding performance of the Swin Transformer in capturing global image features, we apply it in YOLOv6 as a backbone feature extraction network to improve the extraction of features that are important for identifying engineering vehicles, facilitating more precise detection of incomplete engineering vehicle objects in images. To tackle the challenges arising from the intricate data acquisition process and the high costs of labeling for the engineering vehicle dataset, we employ the SimMIM self-supervised training paradigm in training the backbone. This approach enhances the backbone’s capability to represent valuable features, leading to a higher level of accuracy in the model. In comparison to the current mainstream object detection algorithms, our improved YOLOv6 attains superior performance with an 88.5% m A P 50 : 95 and 95.9% m A P 50 on the test set, surpassing other algorithms. These results affirm the feasibility and efficacy of the improved YOLOv6 algorithm in the field of engineering vehicle detection. A future consideration involves expanding the existing dataset by incorporating additional classes of engineering vehicle images, thereby further enhancing the model’s applicability and effectiveness.

Author Contributions

Conceptualization, H.L. and Y.Z.; Methodology, H.L.; Software, H.L. and Y.Z.; Validation, M.L.; Investigation, H.L. and Y.Z.; Resources, Y.Z.; Writing—original draft, H.L. and T.Z.; Writing—review & editing, Y.Z. and M.L.; Visualization, T.Z.; Project administration, Y.Z. and M.L.; Funding acquisition, Y.Z. and M.L. All authors have read and agreed to the published version of the manuscript.

Funding

The National Natural Science Foundation of China (Grant Number: 62373360, 62473368), the Science and Technology Project of Xuzhou (Grant Number: KC22020), the Postgraduate Research & Practice Innovation Program of Jiangsu Province (Grant number: KYCX23_2718), and the Graduate Innovation Program of China University of Mining and Technology (Grant number: 2023WLJCRCZL118).

Institutional Review Board Statement

Not applicable.

Informed Consent Statement

Not applicable.

Data Availability Statement

The original contributions presented in the study are included in the article, further inquiries can be directed to the corresponding author.

Conflicts of Interest

The authors declare no conflict of interest.

References

  1. Zheng, Z.; Wang, F.; Gong, G.; Yang, H.; Han, D. Intelligent technologies for construction machinery using data-driven methods. Autom. Constr. 2023, 147, 104711. [Google Scholar] [CrossRef]
  2. Guo, Y.; Xu, Y.; Niu, J.; Li, S. Anchor-free arbitrary-oriented construction vehicle detection with orientation-aware Gaussian heatmap. Comput.-Aided Civ. Infrastruct. Eng. 2023, 38, 907–919. [Google Scholar] [CrossRef]
  3. Fang, W.; Ding, L.; Love, P.E.; Luo, H.; Li, H.; Pena-Mora, F.; Zhong, B.; Zhou, C. Computer vision applications in construction safety assurance. Autom. Constr. 2020, 110, 103013. [Google Scholar] [CrossRef]
  4. Xiang, X.; Meng, F.; Lv, N.; Yin, H. Engineering vehicles detection for warehouse surveillance system based on modified YOLOv4-Tiny. Neural Process. Lett. 2023, 55, 2743–2759. [Google Scholar] [CrossRef]
  5. Li, C.; Li, L.; Jiang, H.; Weng, K.; Geng, Y.; Li, L.; Ke, Z.; Li, Q.; Cheng, M.; Nie, W.; et al. YOLOv6: A single-stage object detection framework for industrial applications. arXiv 2022, arXiv:2209.02976. [Google Scholar]
  6. Liu, Z.; Lin, Y.; Cao, Y.; Hu, H.; Wei, Y.; Zhang, Z.; Lin, S.; Guo, B. Swin transformer: Hierarchical vision transformer using shifted windows. In Proceedings of the IEEE/CVF International Conference on Computer Vision, Montreal, BC, Canada, 11–17 October 2021; pp. 10012–10022. [Google Scholar]
  7. Xie, Z.; Zhang, Z.; Cao, Y.; Lin, Y.; Bao, J.; Yao, Z.; Dai, Q.; Hu, H. Simmim: A simple framework for masked image modeling. In Proceedings of the IEEE/CVF Conference on Computer Vision and Pattern Recognition, New Orleans, LA, USA, 19–24 June 2022; pp. 9653–9663. [Google Scholar]
  8. Viola, P.; Jones, M.J. Robust real-time face detection. Int. J. Comput. Vis. 2004, 57, 137–154. [Google Scholar] [CrossRef]
  9. Dalal, N.; Triggs, B. Histograms of oriented gradients for human detection. In Proceedings of the 2005 IEEE Computer Society Conference on Computer Vision and Pattern Recognition, San Diego, CA, USA, 20–25 June 2005; pp. 886–893. [Google Scholar]
  10. Cortes, C.; Vapnik, V. Support-vector networks. Mach. Learn. 1995, 20, 273–297. [Google Scholar] [CrossRef]
  11. Felzenszwalb, P.F.; Girshick, R.B.; McAllester, D.; Ramanan, D. Object Detection with Discriminatively Trained Part-Based Models. IEEE Trans. Pattern Anal. Mach. Intell. 2010, 32, 1627–1645. [Google Scholar] [CrossRef] [PubMed]
  12. Girshick, R.; Donahue, J.; Darrell, T.; Malik, J. Rich feature hierarchies for accurate object detection and semantic segmentation. In Proceedings of the IEEE Conference on Computer Vision and Pattern Recognition, Columbus, OH, USA, 23–28 June 2014; pp. 580–587. [Google Scholar]
  13. Girshick, R. Fast r-cnn. In Proceedings of the IEEE International Conference on Computer Vision, Santiago, Chile, 7–13 December 2015; pp. 1440–1448. [Google Scholar]
  14. Ren, S.; He, K.; Girshick, R.; Sun, J. Faster R-CNN: Towards real-time object detection with region proposal networks. IEEE Trans. Pattern Anal. Mach. Intell. 2016, 39, 1137–1149. [Google Scholar] [CrossRef] [PubMed]
  15. Cai, Z.; Vasconcelos, N. Cascade r-cnn: Delving into high quality object detection. In Proceedings of the IEEE Conference on Computer Vision and Pattern Recognition, Salt Lake City, UT, USA, 18–23 June 2018; pp. 6154–6162. [Google Scholar]
  16. Dai, J.; Li, Y.; He, K.; Sun, J. R-fcn: Object detection via region-based fully convolutional networks. In Proceedings of the Advances in Neural Information Processing Systems, Barcelona, Spain, 5–10 December 2016; pp. 379–387. [Google Scholar]
  17. Bochkovskiy, A.; Wang, C.Y.; Liao, H.Y.M. Yolov4: Optimal speed and accuracy of object detection. arXiv 2020, arXiv:2004.10934. [Google Scholar]
  18. Ultralytics. YOLOv5, V7.0; Ultralytics: Los Angeles, CA, USA, 2022. Available online: https://github.com/ultralytics/yolov5 (accessed on 2 August 2024).
  19. Wang, C.Y.; Bochkovskiy, A.; Liao, H.Y.M. YOLOv7: Trainable bag-of-freebies sets new state-of-the-art for real-time object detectors. In Proceedings of the IEEE/CVF Conference on Computer Vision and Pattern Recognition, Vancouver, BC, Canada, 18–23 June 2023; pp. 7464–7475. [Google Scholar]
  20. Ultralytics. YOLO by Ultralytics. 2023. Available online: https://github.com/ultralytics/ultralytics (accessed on 2 August 2024).
  21. Ge, Z.; Liu, S.; Wang, F.; Li, Z.; Sun, J. Yolox: Exceeding yolo series in 2021. arXiv 2021, arXiv:2107.08430. [Google Scholar]
  22. Liu, W.; Anguelov, D.; Erhan, D.; Szegedy, C.; Reed, S.; Fu, C.Y.; Berg, A.C. SSD: Single shot multibox detector. In Proceedings of the Computer Vision–ECCV 2016: 14th European Conference, Amsterdam, The Netherlands, 11–14 October 2016; pp. 21–37. [Google Scholar]
  23. Liu, X.; Zhang, Y.; Zhang, S.y.; Wang, Y.; Liang, Z.y.; Ye, X.z. Detection of engineering vehicles in high-resolution monitoring images. Front. Inf. Technol. Electron. Eng. 2015, 16, 346–357. [Google Scholar] [CrossRef]
  24. Choudhury, S.; Chattopadhyay, S.P.; Hazra, T.K. Vehicle detection and counting using haar feature-based classifier. In Proceedings of the 2017 8th Annual Industrial Automation and Electromechanical Engineering Conference, Bangkok, Thailand, 16–18 August 2017; pp. 106–109. [Google Scholar]
  25. Harjoko, A.; Candradewi, I.; Bakhtiar, A.A. Intelligent traffic monitoring systems: Vehicles detection, tracking, and counting using Haar cascade classifier and optical flow. In Proceedings of the International Conference on Video and Image Processing, Singapore, 27–29 December 2017; pp. 49–55. [Google Scholar]
  26. Suhao, L.; Jinzhao, L.; Guoquan, L.; Tong, B.; Huiqian, W.; Yu, P. Vehicle type detection based on deep learning in traffic scene. Procedia Comput. Sci. 2018, 131, 564–572. [Google Scholar] [CrossRef]
  27. Sang, J.; Wu, Z.; Guo, P.; Hu, H.; Xiang, H.; Zhang, Q.; Cai, B. An improved YOLOv2 for vehicle detection. Sensors 2018, 18, 4272. [Google Scholar] [CrossRef] [PubMed]
  28. Guo, Y.; Xu, Y.; Li, S. Dense construction vehicle detection based on orientation-aware feature fusion convolutional neural network. Autom. Constr. 2020, 112, 103124. [Google Scholar] [CrossRef]
  29. Zhang, Y.; Guo, Z.; Wu, J.; Tian, Y.; Tang, H.; Guo, X. Real-time vehicle detection based on improved yolo v5. Sustainability 2022, 14, 12274. [Google Scholar] [CrossRef]
  30. Vaswani, A.; Shazeer, N.; Parmar, N.; Uszkoreit, J.; Jones, L.; Gomez, A.N.; Kaiser, L.; Polosukhin, I. Attention is all you need. In Proceedings of the Advances in Neural Information Processing Systems, Long Beach, CA, USA, 4–9 December 2017; pp. 5998–6008. [Google Scholar]
  31. Dosovitskiy, A.; Beyer, L.; Kolesnikov, A.; Weissenborn, D.; Zhai, X.; Unterthiner, T.; Dehghani, M.; Minderer, M.; Heigold, G.; Gelly, S.; et al. An image is worth 16x16 words: Transformers for image recognition at scale. arXiv 2020, arXiv:2010.11929. [Google Scholar]
  32. Deng, J.; Dong, W.; Socher, R.; Li, L.J.; Li, K.; Fei-Fei, L. ImageNet: A Large-Scale Hierarchical Image Database. In Proceedings of the IEEE Conference on Computer Vision and Pattern Recognition, Miami, FL, USA, 20–25 June 2009; pp. 248–255. [Google Scholar]
  33. Liu, S.; Qi, L.; Qin, H.; Shi, J.; Jia, J. Path aggregation network for instance segmentation. In Proceedings of the IEEE/CVF Conference on Computer Vision and Pattern Recognition, Salt Lake City, UT, USA, 18–23 June 2018; pp. 8759–8768. [Google Scholar]
  34. Wang, W.; Xie, E.; Song, X.; Zang, Y.; Wang, W.; Lu, T.; Yu, G.; Shen, C. Efficient and accurate arbitrary-shaped text detection with pixel aggregation network. In Proceedings of the IEEE/CVF International Conference on Computer Vision, Seoul, Republic of Korea, 27 October–2 November 2019; pp. 8440–8449. [Google Scholar]
  35. Wang, C.Y.; Liao, H.Y.M.; Wu, Y.H.; Chen, P.Y.; Hsieh, J.W.; Yeh, I.H. CSPNet: A new backbone that can enhance learning capability of CNN. In Proceedings of the IEEE/CVF Conference on Computer Vision and Pattern Recognition Workshops, Seattle, WA, USA, 14–19 June 2020; pp. 390–391. [Google Scholar]
  36. Ding, X.; Zhang, X.; Ma, N.; Han, J.; Ding, G.; Sun, J. Repvgg: Making vgg-style convnets great again. In Proceedings of the IEEE/CVF Conference on Computer Vision and Pattern Recognition, Nashville, TN, USA, 19–25 June 2021; pp. 13733–13742. [Google Scholar]
  37. Rezatofighi, H.; Tsoi, N.; Gwak, J.; Sadeghian, A.; Reid, I.; Savarese, S. Generalized intersection over union: A metric and a loss for bounding box regression. In Proceedings of the IEEE/CVF Conference on Computer Vision and Pattern Recognition, Long Beach, CA, USA, 16–20 June 2019; pp. 658–666. [Google Scholar]
  38. Contributors, M. MMYOLO: OpenMMLab YOLO Series Toolbox and Benchmark. 2022. Available online: https://github.com/open-mmlab/mmyolo (accessed on 2 August 2024).
  39. Chen, K.; Wang, J.; Pang, J.; Cao, Y.; Xiong, Y.; Li, X.; Sun, S.; Feng, W.; Liu, Z.; Xu, J.; et al. MMDetection: Open MMLab Detection Toolbox and Benchmark. arXiv 2019, arXiv:1906.07155. [Google Scholar]
  40. Wang, W.; Xie, E.; Li, X.; Fan, D.P.; Song, K.; Liang, D.; Lu, T.; Luo, P.; Shao, L. Pyramid vision transformer: A versatile backbone for dense prediction without convolutions. In Proceedings of the IEEE/CVF International Conference on Computer Vision, Montreal, BC, Canada, 11–17 October 2021; pp. 568–578. [Google Scholar]
  41. Wang, W.; Xie, E.; Li, X.; Fan, D.P.; Song, K.; Liang, D.; Lu, T.; Luo, P.; Shao, L. Pvtv2: Improved baselines with pyramid vision transformer. Comput. Vis. Media 2022, 8, 415–424. [Google Scholar] [CrossRef]
Figure 1. Hierarchical feature mapping diagram built by the Swin Transformer.
Applsci 14 08054 g001
Figure 2. The framework of the improved YOLOv6.
Applsci 14 08054 g002
Figure 3. Swin Transformer block structure diagram. The multi-head self-attention modules of the Transformer are replaced with window multi-head self-attention (W-MSA) and shifted window multi-head self-attention (SW-MSA). This substitution is advantageous for diminishing the computational complexity associated with self-attention.
Applsci 14 08054 g003
Figure 4. Diagram illustrating the segmentation of W-MSA and SW-MSA. The SW-MSA facilitates information exchange between windows through window translation.
Applsci 14 08054 g004
Figure 5. Diagram of SimMIM. The trained weight will be migrated to the YOLOv6 backbone.
Applsci 14 08054 g005
Figure 6. Diagram of CSPStackRep module structure.
Applsci 14 08054 g006
Figure 7. The dataset’s composition in terms of different object quantities.
Applsci 14 08054 g007
Figure 8. Schematic diagram illustrating four types of engineering vehicles. Objects in the images are marked by rectangular boxes, and all four images are resized to a uniform size.
Applsci 14 08054 g008
Figure 9. The predictions of different models.
Applsci 14 08054 g009
Table 1. Experiment hardware and software setup.
Hardware or SoftwareDetailed Specifications
CPUIntel(R) Xeon(R) Platinum 8336C CPU @ 2.30 GHz
GPUNVIDIA GeForce RTX 4090 24 GB × 4
Operating SystemUbuntu 20.04.6 LTS
Miniconda23.5.2
Python3.8.18
PyTorch1.11.0
CUDA11.3
Table 2. An analysis of the experimental outcomes among various models.
Model mAP 50 : 95 (%) mAP 50 (%) mAP 75 (%)
YOLOv5-L [18]76.591.583.0
YOLOv6-L [5]82.893.486.2
YOLOv7-L [19]70.089.077.7
YOLOv8-L [20]85.094.088.2
YOLOx-L [21]71.891.580.8
Faster R-CNN R50 [14]70.390.179.4
Faster R-CNN R101 [14]68.889.978.3
Casade R-CNN R50 [15]70.590.479.4
Casade R-CNN R101 [15]70.489.279.4
YOLOv6-L Swin-B (Ours)88.595.991.7
Table 3. The mean, standard deviation and significance level of sample IoU based on prediction results, and the mean, standard deviation and significance level of sample IoU based on ground truth. p-value represents the significance level. The significance level indicates that the mean IoU of our proposed method is significantly greater than that of the corresponding methods.
ModelIoU Based on Prediction ResultsIoU Based on Ground Truth
Number Mean Standard Deviation p -Value Number Mean Standard Deviation p -Value
YOLOv5-L [18]6790.880.190.1028220.740.360.000
YOLOv6-L [5]7930.870.240.0058220.840.280.005
YOLOv7-L [19]6650.850.220.0008220.700.370.000
YOLOv8-L [20]7640.890.220.2228220.830.300.002
YOLOx-L [21]7750.820.240.0008220.780.290.000
Faster R-CNN R50 [14]8680.780.270.0008220.800.250.000
Faster R-CNN R101 [14]8790.770.280.0008220.790.270.000
Casade R-CNN R50 [15]7920.810.240.0008220.790.270.000
Casade R-CNN R101 [15]7880.820.240.0008220.780.280.000
YOLOv6-L Swin-B (Ours)7950.900.220.5008220.870.250.500
Table 4. An examination of the experimental outcomes across various backbone architectures.
Model mAP 50 : 95 (%) mAP 50 (%) mAP 75 (%)
YOLOv6-L EfficientRep [5]82.893.486.2
YOLOv6-L PVT-L [40]76.189.281.4
YOLOv6-L PVTv2-B5 [41]87.895.991.3
YOLOv6-L Swin-B (Ours)88.595.991.7
Table 5. Experimental outcomes across various pre-trained weights.
Model mAP 50 : 95 (%) mAP 50 (%) mAP 75 (%)
Scratch0.7470.8380.792
Supervised0.8260.8910.856
SimMIM0.8850.9590.917
Disclaimer/Publisher’s Note: The statements, opinions and data contained in all publications are solely those of the individual author(s) and contributor(s) and not of MDPI and/or the editor(s). MDPI and/or the editor(s) disclaim responsibility for any injury to people or property resulting from any ideas, methods, instructions or products referred to in the content.

