Abstract
The parallel mechanism exhibits high stiffness and excellent dynamic response, making it ideal for high-precision applications. In our early work, a novel 6-DOF redundant parallel posture mechanism with four limbs for solar wing docking has been proposed; each limb consists of three links and four joints. This paper primarily focuses on optimization design of the mechanism. The calculation of workspace volume reveals that factors influencing the range of posture adjustment include dynamic platform parameters, static platform parameters, the drive trajectory of each kinematic pair, and the angles between each kinematic pair. A sensitivity analysis was conducted to examine the impact of each parameter on the range of posture adjustment. To reduce computational complexity and improve analysis efficiency, a combined approach of single-factor analysis and response surface methodology (RSM) is used in the paper. Single-factor analysis is utilized to evaluate the effect of each parameter on the posture adjustment range. Based on these results, RSM is used to establish a regression model for parameters; thereby, the optimal parameter combination for the mechanism is determined. The regression coefficient R2 = 0.9374 attests to the validity of the proposed model. Finally, a comparison of the posture adjustment range before and after optimization is presented, providing a foundation for the practical application of the redundant parallel mechanism. This paper introduces a novel structural design concept aimed at resolving the conflict between heavy loads and compact sizes in redundant parallel mechanisms while providing valuable insights for miniaturized design.
1. Introduction
With the rapid development of aerospace technology, the development of large spacecraft has become an inevitable trend. In the aerospace field, macro–micro robotic systems are typically used in assembling large components, where the wheeled mobile system composed of Mecanum wheels is used for long-distance component transport in the macro-motion stage, while the docking mechanism is used to adjust the posture of components in the micro-motion stage. There are three types of docking equipment in common use, namely Pogo positioning platforms, rail-mounted platforms, and industrial robotic arms [1], all of which are composed of serial structures. Serial mechanisms can increase joint motion, thereby expanding the workspace of the end effector. However, serial mechanisms tend to accumulate deformation, which reduces the stiffness of the docking equipment [2,3]. Since less stiffness is not conducive to carrying large and heavy components, parallel mechanisms (PMs) can be used [4,5]. Parallel mechanisms support a single end effector with multiple kinematic limbs and offer several advantages over traditional serial mechanisms, such as a high load-to-weight ratio, greater stiffness, compact structure, low inertia, and good dynamic response [6,7,8]. However, compared to serial mechanisms, parallel mechanisms have a smaller workspace. Most parallel mechanisms are unable to improve performance such as working space while increasing stiffness. To enhance the performance of parallel mechanisms, many researchers have introduced redundancy actuation [9,10,11]. Redundant actuation can effectively eliminate certain singular configurations, increase the workspace, enhance stiffness, and improve the dynamic performance of the mechanism [12,13,14].
Furthermore, the performance of parallel mechanisms can vary significantly based on their configuration, structure, and parameters [15,16]. Design optimization aims to enhance performance indicator by adjusting mechanism parameters [17,18]. The primary objective of mechanism optimization is to meet diverse engineering requirements such as stiffness, mass, and workspace. Due to the complexity and variety of performance metrics, design optimization problems are typically characterized by constraints, nonlinearity, and multimodality, often lacking a closed-form solution [19]. Consequently, identifying optimal parameters that meet various task requirements is a significant challenge. In the optimization of PMs, performance indicators are typically treated as objectives, mechanism parameters as design variables, and constraints are dictated by design requirements. With these objectives, design variables, and constraints in place, advanced optimization algorithms can be utilized to determine the optimal parameters [20,21,22,23]. The kinematic design mainly involves the determination of the geometric parameter sizes and the range of drive joint variables.
Workspace plays a critical role in mechanism optimization, and the volume of the non-singularity workspace is commonly used to evaluate the performance of PMs [24]. Fu and Gao [25] proposed a method to determine the workspace, Karimi et al. [26] solved the maximum non-singularity workspace of a 6-UPS mechanism by convex optimization, and Kaloorazi et al. [27] used a geometric method to solve the 3-PRR mechanism’s maximum non-singular workspace.
However, these methods often overlook the volume of the mechanism itself. This paper introduces the spatial occupancy function (volume ratio), which considers both the workspace volume and the mechanism’s volume, to avoid an unlimited increase in the mechanism volume, which can evaluate the workspace utilization of the 4-SPPP mechanism more comprehensively.
Currently, the primary optimization methods are divided into two categories: the objective function method [28,29] and the performance atlas method [30,31]. The objective function method obtains results by creating an objective function and using an optimization algorithm; genetic algorithm [32] is one of the popular choices due to its parallel computation and global search capabilities. However, its main drawback is the potential convergence to local optima during numerical computation [33]. In contrast, probabilistic direct search algorithms such as Differential Evolution (DE) [34] and Particle Swarm Optimization (PSO) [35,36,37] are more suitable for complex design problems.
To obtain optimal mechanism parameters, it is essential to employ scientifically sound methods. The response surface methodology, proposed by Box and Wilson [38], combines statistical and mathematical techniques to analyze the relationship between explanatory variables and one or more responses, or to maximize the response by adjusting individual variables. In addition, this approach requires relatively few experimental runs, thus improving optimization efficiency. Response surface methodology has higher efficiency and fitting accuracy compared to genetic and neural network algorithms [39].
In summary, the existing methods still have some difficulties in achieving multi-parameter multi-objective optimization, and new methods need to be further explored and proposed to better serve the engineering application needs of complex parallel robots. In order to improve the stiffness of the parallel mechanism and increase the workspace, this paper addresses the optimization design of a novel 6-DOF redundant parallel posture adjustment mechanism with three links and four joints for solar wing docking proposed in our early work [40]. To reduce the number of calculations and improve the efficiency of the analysis, a combination of the one-factor method and the response surface method is used. Section 2 carries out the mechanism description and establishes the mechanism coordinate system. Section 3 analyzes the sensitivity of various link parameters on the posture adjustment range of the parallel mechanism based on volume. The single-factor method was utilized to analyze the effect of parameters such as moving and fixed platform parameters, the drive trajectory of kinematic pairs, and angles between kinematic pairs on the posture adjustment range. Section 4 establishes the performance index. In Section 5, the parameter optimization design was carried out by response surface methodology. Firstly, the Plackett–Burman test was used to identify parameters with significant effects on performance metrics. Secondly, the steepest climb test was used to determine the optimal range of significant parameters. Then RSM was used to establish regression models for the parameters and to identify the optimal parameter combination for the mechanism. Finally, the workspaces before and after optimization are compared, which provides a basis for the practical application of the redundant parallel mechanism.
2. Mechanism Description
During the docking process of the solar wing and satellite, the solar wing is fixed, and the position and posture of the satellite is adjusted in real time by a posture adjustment platform. The docking process can be divided into two stages according to the motion range of the satellite, that is, the macro-motion stage and the micro-motion stage.
A movable heavy-load reconfigurable redundant posture adjustment platform (RrPAP) with dual motion modes is proposed in our early work. The RrPAP consists of a wheeled mobile platform (WMP) and a reconfigurable parallel posture adjustment mechanism (PAM), as shown in Figure 1. The wheeled mobile platform (WMP) is used in the macro-motion stage, while the PM is used as a posture adjustment mechanism (PAM) in the micro-motion stage.
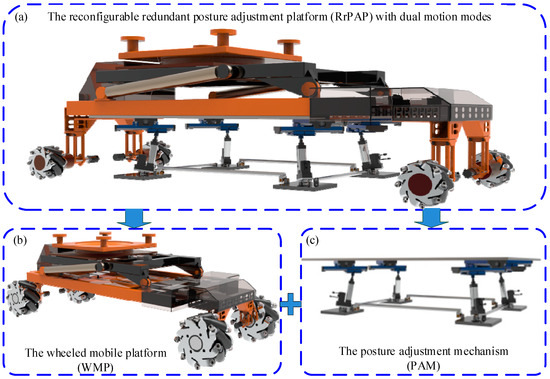
Figure 1.
A movable heavy-load reconfigurable redundant posture adjustment platform (RrPAP) with dual motion modes.
The parallel posture adjustment mechanism consists of a moving platform, a fixed platform, and four limbs connecting the two platforms, as shown in Figure 2. Each of the four limbs is a 6-DOF serial mechanism with SPPP configuration. These limbs are arranged in a rectangular layout and connected to the fixed platform above via spherical joints. Si (where i = 1, 2, 3, 4) denotes the center of the spherical pair connecting the limb to the fixed platform. S1, S2, S3, and S4 form the fixed platform of the mechanism, with O representing the geometric center of the fixed platform and P the geometric center of the adjustment platform. The upper ends of the limbs are modularly designed to connect with the moving platform. In each limb, the second prismatic pair (P2) and the third prismatic pair (P3) move perpendicularly to each other and parallel to the moving platform. The angles between these two prismatic pairs and the first and second primary movement directions are each 45°. In the initial pose, the first prismatic pair (P1) of each limb is not perpendicular to the fixed platform, forming an angle (θ). The value of θ is determined based on the self-locking principle. The four limbs constrain the primary motion characteristics of the mechanism, providing the moving platform with six degrees of freedom: three rotational and three translational. This parallel mechanism offers advantages such as geometric symmetry and modularity. However, the configuration of each limb with three links and four joints results in more parameters compared to chains with two links and three joints, increasing the complexity of parameter optimization.
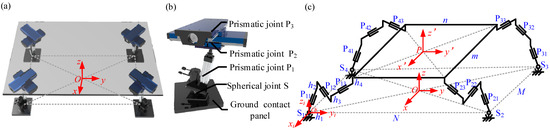
Figure 2.
Kinematical diagrams of 4-SPPP parallel mechanism. (a) 3D diagram of 4-SPPP parallel mechanism; (b) 3D diagram of the limb; (c) Kinematical diagram of 4-SPPP parallel mechanism.
A right-handed orthogonal coordinate system is established as shown in Figure 2. A fixed coordinate system Oxyz is set up on the fixed platform, with the origin at the geometric center O. The x-axis points from S4 to S1 in the initial state, the y-axis points from S1 to S2 (perpendicular to S4S1 in the initial state), and the z-axis is determined by the right-hand rule from the x and y axes. A moving coordinate system Px′y′z′ is established on the moving platform, with the origin at the geometric center P. The x′-axis is perpendicular to one side of the moving platform, the z′-axis points upwards perpendicular to the moving platform, and the y′-axis is determined by the right-hand rule. Each limb has a limb coordinate system Oixiyizi, with the origin Oi at the center of the spherical pair Si and the xiyizi directions aligned with the fixed coordinate system. In the initial state, the z-axis of the moving coordinate system coincides with that of the fixed coordinate system, while the x and y axes are parallel to their respective counterparts.
The mobility analysis and the degrees of freedom of the mechanism have been conducted in our previous work [40], and the degrees of freedom of the mechanism are analyzed as follows:
The method based on screw theory is used to analyze the degrees of freedom of the mechanism.
- (1)
- Whether the mechanism has local degrees of freedom: the mechanism has no local degrees of freedom.
- (2)
- Establish the reference coordinate system and construct the twist screw system of each limb.
Since the four limbs have the same structure, take out limb 1 for analysis, as shown in Figure 3, the coordinate system of limb 1 O1x1y1z1 is shown in the figure, and the center point of the spherical pair at the end of the limb is chosen as the origin of the coordinate system. The x1-axis is parallel to the x-axis of the moving platform, and the y1-axis is parallel to the y-axis of the moving platform.
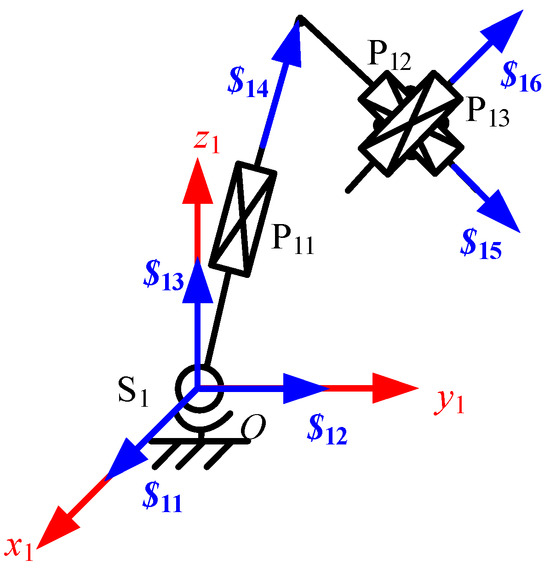
Figure 3.
The twist screw system of limb 1.
The twist screw system of limb 1 is:
where is the i-th twist screw in limb 1, i = 1~6.
- (3)
- According to the reversibility of screws, , the constraint wrench screw system of limb 1 is as follows:
Similarly, the constraint wrench screw system of limbs 2, 3, and 4 is:
- (4)
- The constraint wrench screw system of the moving platform can be obtained according to :
- (5)
- Therefore, the twist screw system of the moving platform can be obtained:
- (6)
- According to the twist screw system of the moving platform, it is known that the degrees of freedom of the mechanism are three rotations and three translations.
- (7)
- Since the geometrical relationship between the kinematic pairs of limbs does not change after the change in the mechanism position, it is known that the degrees of freedom of the mechanism are the real degrees of freedom.
- (8)
- Finally, the correctness of the degree of freedom analysis is verified:
According to the degree of freedom analysis, the number of members of the mechanism is , the number of kinematic pairs is , the total number of constraints is , and the public constraints and redundant constraints are all 0; therefore, the degree of freedom of the mechanism is:
In this paper, the redundant drive is chosen, and the number of driving pairs is 8. As shown in Figure 2, the driving pairs are located on the first and the third Prismatic joint of each limb, i.e., Pi1 and Pi3, i = 1–4.
3. Analysis of the Posture Adjustment Range
For the 4-SPPP parallel mechanism, the displacement of each limb must be maintained within a specific range to ensure the mechanism’s stability and safe operation. Each limb has defined limit positions for its movement. and denote the minimum and maximum lengths of the j-th prismatic pair in the i-th limb, respectively. Similarly, and denote the minimum and maximum angular displacements of the spherical pair in the i-th limb, respectively. Therefore, and should comply with the following constraints:
When and reach their extreme values, the kinematic pairs of the 4-SPPP parallel mechanism attain their geometric limit positions, and the moving platform reaches the boundary of its reachable position/posture workspace. For the position/posture workspace solution of the parallel mechanism, especially the 6-degree-of-freedom parallel mechanism, the analytical method is very difficult. Therefore, a three-dimensional numerical search method using the inverse kinematics solution is used for this purpose.
3.1. Workspace Analysis
The position workspace, i.e., the set reached by the moving platform at different positions in the direction, is solved as shown in Figure 4.
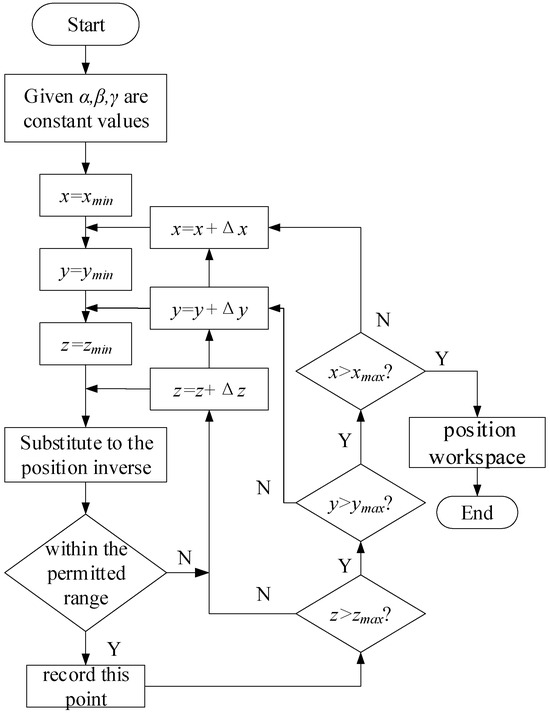
Figure 4.
Flowchart of position workspace solving.
- (1)
- The initial parameters of the center point of the moving platform of the 4-SPPP parallel mechanism are given, i.e., the initial values of are set as . Here represents the posture angle of the moving platform, similar to represents the position of the moving platform.
- (2)
- The maximum range of is given. Perform the search within a certain range, i.e., any boundary search in the direction must satisfy the following constraints: .
- (3)
- are substituted to the position inverse solution to calculate the displacement values of the drive pairs. Judge whether it is within the permitted range; if it is, record this point; if not, continue to search until the whole workspace is covered.
- (4)
- The three-dimensional diagram of is drawn to obtain the position workspace of the mechanism.
For the 4-SPPP mechanism, the travel limits of the linear actuators and the angular constraints of the spherical pairs jointly determine the size and shape of the workspace. Therefore, the relevant structural parameters of the parallel mechanism need to be set first. In this paper, the maximum trajectory of the horizontal prismatic pairs is set to , the minimum trajectory to , the maximum trajectory of the vertical prismatic pairs to , and the minimum trajectory to . Therefore:
The workspace of the 4-SPPP parallel mechanism can be obtained by MATLAB R2021b and the boundary search method.
The posture workspace, i.e., the set reached by the moving platform at different postures in the direction, is solved similarly to the position workspace, and the flowchart is shown in Figure 5.
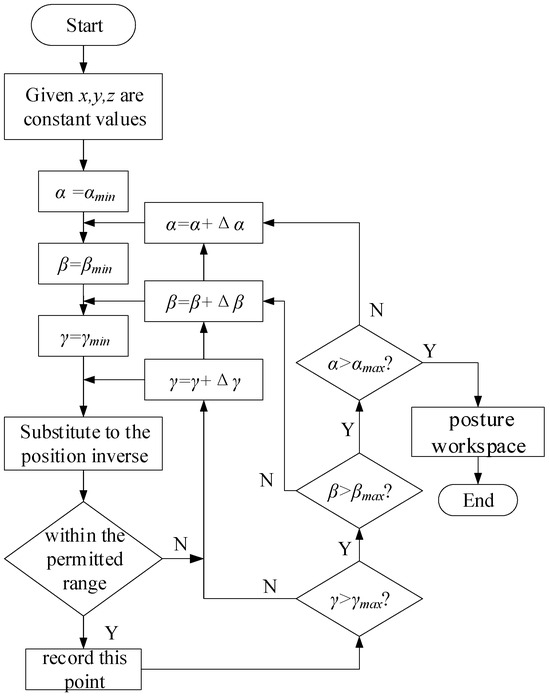
Figure 5.
Flowchart of posture workspace solving.
Thus, the initial position and posture workspace can be obtained as shown in Figure 6.
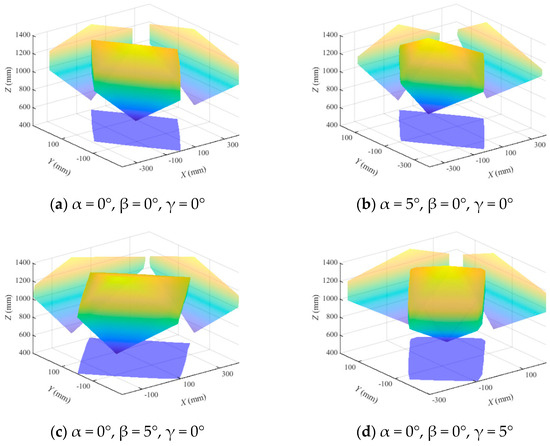
Figure 6.
Workspace.
3.2. Calculation of Workspace Volume
Whenever a workspace boundary point is obtained from a search, the volume of the sub-workspace in which the point is located is obtained.
In order to simplify the writing of the algorithm program, the polar coordinate system is selected instead of the original right-angle coordinate system, as shown in Figure 7. The coordinates of the reference point P under the original coordinate system as are converted to by the polar coordinate coordinates.
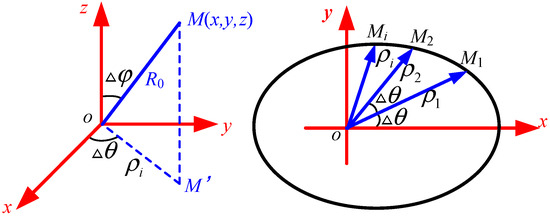
Figure 7.
Conversion relationship between polar and right-angle coordinate systems.
The search range is divided into n equal parts parallel to the xoy plane in steps of .
When the i-th search is carried out in the plane, start from , and gradually increase until ; then, increase until , completing the search in this plane. The volume of its sub-workspace is:
Increase and repeat the above steps to complete the search for all boundary points. The volume of the workspace is the sum of the volumes of all the sub-workspaces.
3.3. Effect of Mechanism Parameters on Posture Adjustment Range
- (1)
- Effect of limb layout on posture adjustment range
The upper and lower endpoints of each limb intersect in the moving and fixed platforms to form two rectangles, as shown in Figure 2. The rectangular length and width of the fixed platform are M and N, and the rectangular length and width of the moving platform are m and n, respectively. The effect on the posture adjustment range is shown in Figure 8. From the figure, it can be seen that with the increase in the length and width of the moving and fixed platforms, the posture adjustment range increases and then decreases.
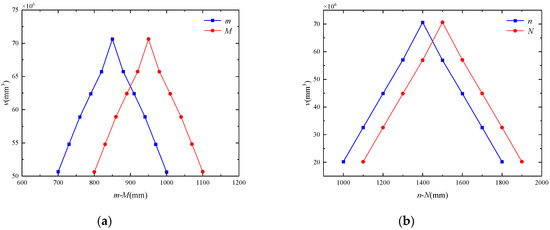
Figure 8.
Effect of limb layout on posture adjustment range. (a) Effect of the width of the moving and fixed platforms on the range of posture adjustment. (b) Effect of the length of the moving and fixed platforms on the range of posture adjustment.
- (2)
- Effect of geometrical relations between the driving pairs axes on posture adjustment range
The geometrical relationship between the driving pairs axes is shown in the positional relationship diagram in Figure 9. is the angle between the plane formed by the second and third driving pairs and the first driving pair. is the angle between the second and third driving pairs. is the angle between the third driving pairs and the long side of moving platform where , and its effect on the posture adjustment range is shown in Figure 10. From Figure 10, it can be seen that with the increase in and , the posture adjustment range increases and then decreases, and with the increase in , the posture adjustment range decreases and then increases.
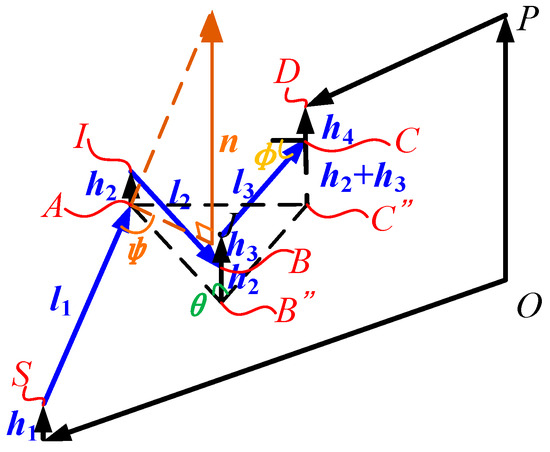
Figure 9.
Positional relationship diagram.
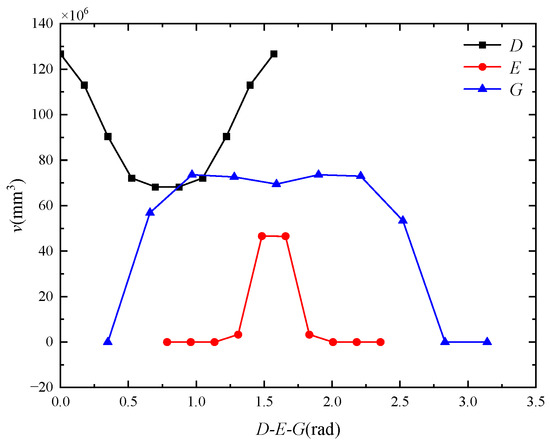
Figure 10.
Effect of geometrical relations between the driving pairs axes on posture adjustment range.
- (3)
- Effect of the limb inclination angle α on posture adjustment range
As shown in Figure 9, the angle between the plane formed by the second and third driving pairs and the first driving pair is ψ, which is related to the limb inclination angle α as follows:
That is, α is complementary to ψ. Therefore, the effect of the limb inclination angle α on the range of posture adjustment is similar to ψ.
- (4)
- Effect of drive trajectory of the driving pair of limb on posture adjustment range
In this paper, only the effect of the active driving pairs (the first and second driving pair) on the posture adjustment range is considered, as shown in Figure 11. From Figure 11, it can be seen that the range of posture adjustment is approximately linearly negatively correlated with the minimum limit of the two active driving pairs, whereas the maximum limit of the two active driving pairs affects the range of posture adjustment differently. The maximum limit of the second active driving pair is approximately linearly positively correlated with the range of posture adjustment, while the maximum limit of the first active driving pair has a smaller impact on the range of posture adjustment.
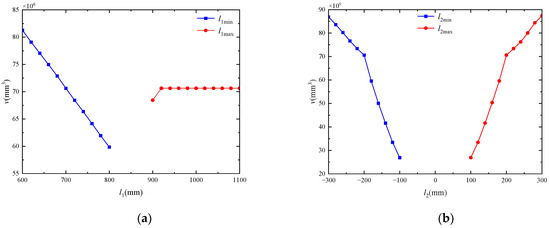
Figure 11.
Effect of drive trajectory of the driving pair of limb on posture adjustment range. (a) Effect of drive trajectory of the first driving pair of limb. (b) Effect of drive trajectory of the second driving pair of limb.
4. Establishment of Performance Indicator
Compared to series mechanisms, parallel mechanisms generally have a smaller workspace. Nevertheless, according to the engineering requirements, the expectation is to obtain a large volume and high-quality orientation workspace. However, the larger workspace means a larger volume of the mechanism; the increase in the volume of the posture adjustment mechanism cannot be ignored in the pursuit of a large posture adjustment range when performing the optimization of the scale of the posture adjustment mechanism. Therefore, this paper comprehensively considers both the workspace volume and the mechanism volume. These two indicators are normalized, and the space occupancy function (volume ratio) is defined as the response value, as expressed in the following equation:
From the above equation, the response value is the ratio of the two volumes; therefore, the response value is a dimensionless response value.
The calculation of the workspace volume has been analyzed in Section 3.2. When calculating the volume of the mechanism, the mechanism is approximated as a cuboid with the fixed platform as the base and the vertical direction of the limb as the height direction, and the mechanism volume can be calculated according to the following formula:
where M is the width of the fixed platform, N is the length of the fixed platform, and H is the height of the limb.
Therefore, the response value can be expressed as:
5. Parameter Optimization
5.1. Response Surface Methodology
Response surface methodology (RSM) is a mathematical approach that combines experimental design and statistical analysis and is widely used in different fields to study the effects of multiple parameters on target parameters. RSM establishes a quadratic response surface regression model by fitting mathematical relationships between multiple influences and response variables to determine the optimal combinations, thus obtaining an optimal response within the planning horizon of the experimental design and with good robustness [41,42]. The flow chart of the response surface methodology optimization is shown in Figure 12.
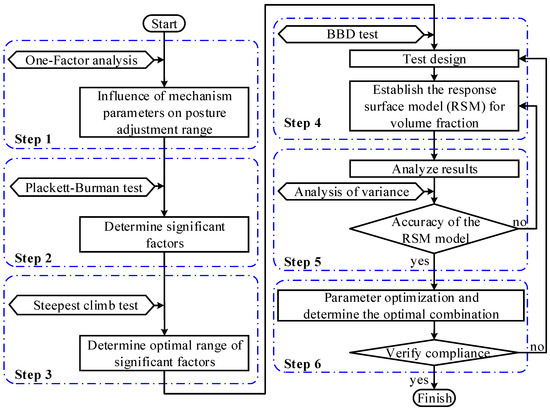
Figure 12.
The flow chart of the response surface methodology optimization.
Box–Behnken Design (BBD) is a widely used RSM for optimizing and modeling the effects of multiple factors on a response variable in an experiment, which was introduced by George E. P. Box and Donald Behnken in 1960. The BBD test is based on the levels of three factors: low (−1), middle (0), and high (+1). The BBD test avoids the potential for experiments to take maximum or minimum values for all factors by arranging the different levels of the factors in a series of experimental points that are concentrated on the middle and edges and excluded from the vertices (i.e., the extreme corners) of the factor space. The center point is repeated in the experiment and is used to estimate the experimental error and the stability of the model. This design can effectively reduce the number of experiments and lower the experimental risk while providing sufficient data for constructing highly accurate quadratic response surface models. With BBD, the main, interaction, and secondary effects of factors can be systematically investigated to optimize the response variables. Figure 13 shows a 3-factor BBD. Because BBD usually have fewer design points, the running cost is lower than that of a central composite design (CCD) with the same number of factors. Therefore, the BBD is proposed to be chosen for the optimized design in this paper.
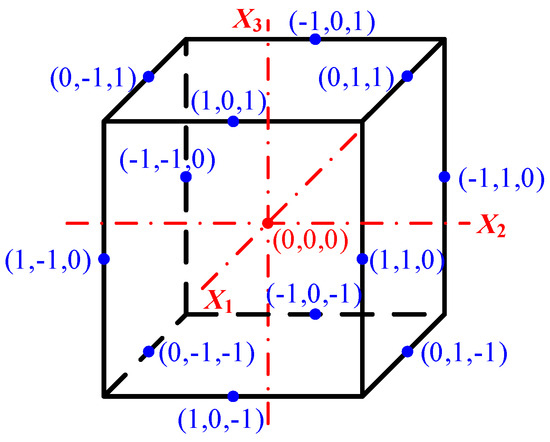
Figure 13.
Distribution of design points of BBD test.
In order to obtain a response surface model between the volume ratio and the mechanism parameters, the order of the response surface model needs to be chosen appropriately. Although the first-order polynomial linear response surface model has a relatively simple model, it can only reflect the linear relationship between the input and the output, and it is difficult to represent the nonlinear relationship. The high-order polynomial response surface model has a higher fitting accuracy, but the model is too complex and it takes a longer time to fit the response surface. Therefore, a multivariate quadratic response surface model is used in this paper, which ensures the accuracy and complete fitting of the nonlinear relationship between the volume ratio and the mechanism parameters while minimizing the complexity of the response surface model. The general equation of the multivariate quadratic response surface model is:
where x and y are the factor variable and response value, respectively, and k is the number of factors. is the constant coefficient, and are the coefficients of the primary and secondary terms of RSM, and is the coefficient of the cross-effect term. The approximation error ε is generally equal to zero when the engineering accuracy requirements are met.
5.2. Plackett–Burman Test
5.2.1. PB Test Design and Results
The purpose of the Plackett–Burman (PB) test is to screen parameters and identify those that significantly affect the volume ratio. As previously mentioned, the main parameters influencing the adjustment range include mechanism parameters (m, n, M, and N); the geometric relationships between the axis of driving pairs (D = φ, E = θ, and G = ψ); and the drive trajectory of the driving pair of the limb (l1min, l1max, l2min, and l2max). In this paper, Design-Expert software is used to design the PB test, and there are 11, 19, etc., parameter tables to choose from. Each parameter takes two levels of high and low, and the values of the two levels should be reasonable: the difference may be too large and may cover the role of other factors or the difference may be too small to reflect the role of the factors; therefore, the ratio of the high level to the low level is set to be between 1.2 and 2 in this paper. In addition, it is necessary to set some dummy variables when designing the PB test and try to distribute the dummy variables as evenly as possible. The purpose of this is to estimate the error and identify the effect of different parameters at the same time.
The PB test was designed using the 19-factor table of Design-Expert 12 software in this paper. Eleven of the main influencing parameters were used as real variables and the other eight variables were used as dummy variables. It is particularly important to determine reasonable parameter levels using single-factor analysis before using response surface optimization. Based on the results of the single-factor analysis, a reasonable range of values for each parameter was selected, as shown in Table 1.

Table 1.
Parameters of PB test.
After determining the high and low levels of the parameters, a PB test was conducted to calculate the volume ratio of the posture adjustment mechanism under different parameter combinations. The design and results of the test are shown in Appendix A.
5.2.2. Analysis of PB Test Results
Design-Expert 12 software was used to analyze the ANOVA of the PB test, and the results can be seen in Table 2. According to the correlation coefficients of the PB test: R2 = 0.999, indicating that 99.9% of the test variance can be explained by the model, with a high degree of fit to the actual data; R2adj = 0.9901, which is close to R2, indicating a good correlation; and CV = 11.57%, which is relatively low, demonstrating high reliability of the results; Adeq Precision measures the signal-to-noise ratio, with a value ideally greater than 4. The precision of this model is 34.0778. In summary, these indicators suggest that the model is highly reliable and can be used to explain the effect of various parameters on the volume ratio of the posture adjustment mechanism.
Table 2.
Analysis of significance parameters in PB test.
As can be seen from Table 2 and Figure 12, the influence ranking of each parameter on the range of posture adjustment is as follows: the drive trajectory of the second driving pair > the parameters of the moving and fixed platforms > the angles between the driving pairs > the drive trajectory of the first driving pair.
As can be seen from Table 2 and Figure 14, the influence ranking of each parameter on the range of posture adjustment is as follows: the drive trajectory of the second driving pair > the parameters of the moving and fixed platforms > the angles between the driving pairs > the drive trajectory of the first driving pair.
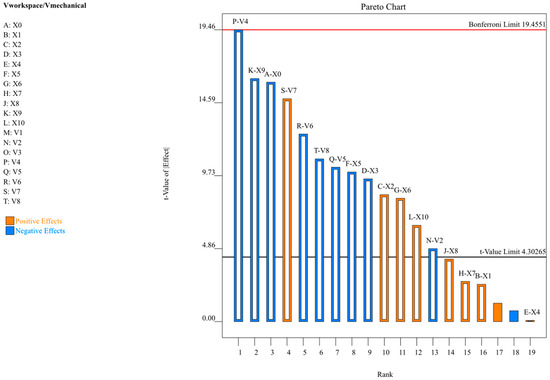
Figure 14.
Pareto chart.
5.3. Steepest Climb Test
To establish a regression model using response surface methodology for determining optimal values, it is crucial that these values fall within the predefined high and low levels of the parameters. The steepest climb test can efficiently identify the interval where the optimal values of the parameters reside. According to the results of the PB test, the parameter effects of the first four significance parameters, i.e., the minimum drive trajectory of the second driving pair of limb l2min, the width of moving platform m, the angle between P3 and P2 axis θ, and the length of fixed platform N, are negative; that of the fifth significance parameter, i.e., the width of the fixed platform M, is positive. Therefore, in this paper, the first four significance parameters are gradually reduced according to the selected step, the fifth significance parameter is gradually increased according to the selected step, and the other parameters are selected to the middle level to carry out the steepest climb test. The test design and results are shown in Table 3.
Table 3.
Design parameters and results of the steepest ascent test.
As can be seen from Table 3, the volume ratio increases and then decreases, and the volume ratio of the third group of tests is the largest. Thus, the optimal interval of the significance parameter is near the level selected in the third group, so the levels selected in the second, third, and fourth groups of tests are chosen for the response surface test.
5.4. Response Surface Analysis
In this paper, BBD (Box–Behnken Design) is applied to establish and optimize the regression model between the posture adjustment range and the mechanism parameters, and the optimal values of the above parameters are obtained by solving with the volume ratio as the objective.
5.4.1. Design and Results of BBD Test
Based on the results of the steepest climb test, the Box–Behnken response surface analysis test was performed. In the test, the middle level was chosen for the non-significance parameter, and three levels were taken for each of the five significance parameters, as shown in Table 4. The regression model of the volume ratio of the posture adjustment mechanism with five parameters was established. Six center points were selected for error estimation; the test design and results are shown in Appendix B. A total of 46 tests were conducted, including six repetitions of the center point.
Table 4.
Factors and levels for Box–Behnken test.
5.4.2. Regression Model Analysis
The quadratic regression equation of the five parameters and the volume ratio of the posture adjustment mechanism were developed by Design-Expert as follows:
The ANOVA of this quadratic regression model is shown in Table 5, and based on the F-value and p-value, the effect of the parameters on the volume ratio of the posture adjustment mechanism is in the order as follows:
Table 5.
ANOVA of BBD quadratic regression model.
The parameter with p < 0.05 has a significant effect on the posture adjustment mechanism volume ratio. This regression model with p < 0.05 shows the validity of the regression model, indicating that the relationship between the posture adjustment mechanism volume ratio and the resulting regression equation is significant. CV = 8.03%, so the reliability of this test is fine; Adeq Precision = 19.7373, so the accuracy of this regression model is fine.
The correlation coefficient of the regression model is a measure of the degree of model fit and is calculated as following equation. Its expression can be described as an equation:
where SSR is the sum of squares of the difference between the predicted and actual values of all observations in the regression model; SST is the sum of squares of the difference between all observations and their mean values. The results of the correlation coefficient of the regression model established in this paper are shown in Table 5, R2 = 0.9436 and R2adj = 0.8985, which indicate the validity of the above regression model, and therefore, the reliability of the obtained regression equation is high.
The quadratic regression model was optimized by removing the terms with insignificant effects. The optimized regression equation is:
The ANOVA of the optimized regression model is shown in Table 6, with CV = 7.05%, R2 = 0.9374, R2adj = 0.9217, and Adeq Precision = 31.7698. Compared to the pre-optimization period, the resultant regression equations show a significant improvement in terms of fit, reliability, and precision.
Table 6.
ANOVA of BBD optimization regression model.
The software Design-Expert 12 was applied to solve the optimized regression equation for optimization with volume ratio as the objective; the optimal values of the five parameters were obtained: X9 = −224.759, X0 = 877.27, X5 = 1.574, X3 = 1498.308, and X2 = 924.974. The values of these five parameters were substituted into Equation (19) to obtain the volume ratio , which increased by 43.82% compared to the pre-optimization ratio, proving the effectiveness of using the volume ratio as the response value for parameter optimization.
Finally, the optimized mechanism parameters were obtained as shown in Table 7.
Table 7.
Parameters of the posture adjustment mechanism.
5.5. Analysis of Interaction Effects
According to the results of the regression analysis, using the established mathematical model, the effects of the interaction of the parameters on the response values can be objectively reflected. Thus, the optimal mechanism parameters and the interactions between the parameters can be discovered, as shown in Figure 15. Among them, the three-dimensional response surface and contour diagram can intuitively reflect the influence of independent variables on the posture adjustment mechanism volume ratio, and the shape of the contour lines can reflect the strength of the interaction effect of the parameters.
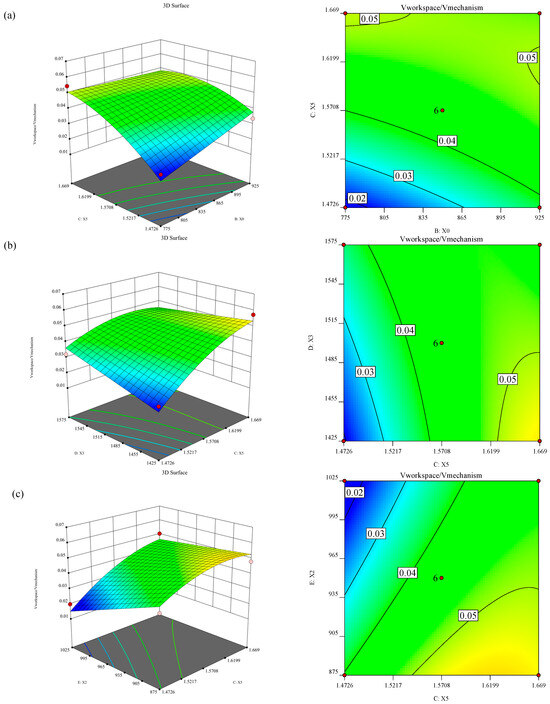
Figure 15.
Three-dimensional response surface and contour diagrams of the interaction between parameters affecting posture adjustment mechanism volume ratio. (a) Interaction between B and C; (b) interaction between C and D; (c) interaction between C and E.
5.6. Validation Experiments
In order to verify the accuracy of the obtained mechanism parameters, this paper substitutes the optimized mechanism parameters into MATLAB R2021b for the calculation of the posture adjustment mechanism volume ratio, which is 0.0626. The relative error with the predicted volume ratio of the posture adjustment mechanism is 2.19%, which is not significant, indicating that the optimal values of the obtained parameters are accurate and reliable. Figure 16 shows the comparison of the attitude range before and after optimization, in which the volume of the posture adjustment mechanism workspace increases from 9.8648 × 10⁷ to 1.11 × 10⁸, an increase of 12.52%. Figure 16a is the projection of the workspace in the XOZ plane before optimization, and Figure 16b is the projection of the workspace in the XOZ plane after optimization.
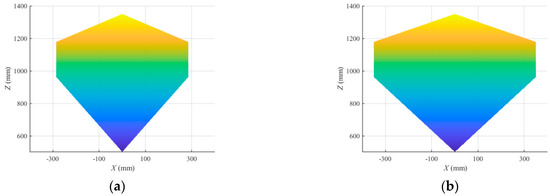
Figure 16.
Comparison of workspace projection in XOZ plane before and after optimization. (a) Workspace projection before optimization. (b) Workspace projection after optimization.
5.7. Prototype Development
Based on the optimized design parameters, a prototype of the 4-SPPP posture mechanism is fabricated. The overall view of the PM and the enlarged view of limb 1 are shown in Figure 17a, and the drive trajectories of the first and second driving pairs are shown in Figure 17b. The moving platform and frame of the mechanism are made of aluminum alloy to reduce the moving mass and movement inertia. AC servo motors used in conjunction with the electric cylinder and slide mechanism, respectively, were used for the linear actuators. A four-Mecanum-wheeled omnidirectional mobile system is used for the structure design of the wheeled mobile platform (WMP) in this paper. The Mecanum wheel selected in this paper has a diameter of 360 mm and a single wheel load of 1100 kg.
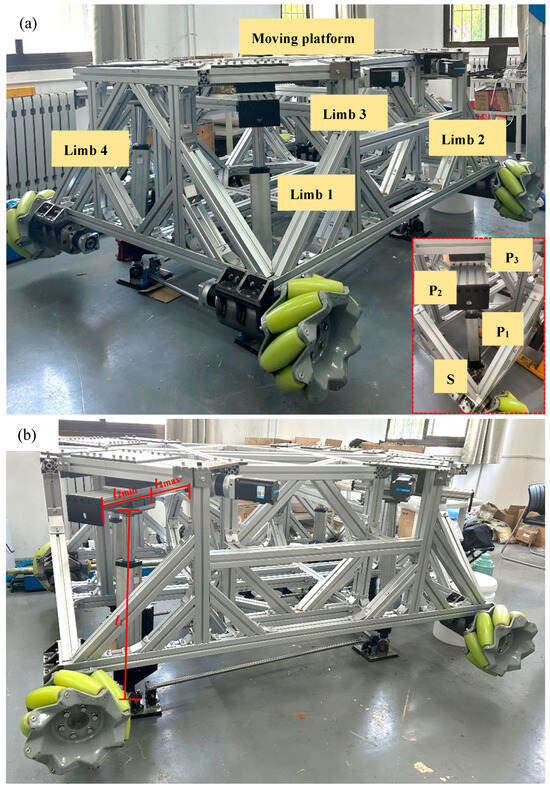
Figure 17.
The prototype of the RrPAP.
6. Conclusions
In order to achieve precise docking between the two flanges during wing satellite assembly, a novel 6-DOF redundant parallel posture adjustment mechanism has been proposed in our early work, which has advantages such as geometric symmetry and modularity. However, the configuration of three links and four joints per limb increases the number of parameters compared to the limb with two links and three joints, which increases the difficulty of parameter optimization. This paper focuses on optimizing the parameters of this mechanism.
- (1)
- Based on the workspace volume, the sensitivity of each parameter of the parallel mechanism to the posture adjustment range is analyzed, and the results are as follows: with the increase in the length and width of the moving and fixed platforms, the posture adjustment range increases and then decreases; with the increase in and , the posture adjustment range increases and then decreases, and with the increase in , the posture adjustment range decreases and then increases; the influence of the limb inclination angle α on the range of posture adjustment is similar to ψ. The range of posture adjustment is approximately linearly negatively correlated with the minimum limit of the two active driving pairs, whereas the maximum limit of the two active driving pairs affects the range of posture adjustment differently. The maximum limit of the second active driving pair is approximately linearly positively correlated with the range of posture adjustment, while the maximum limit of the first active driving pair has a smaller impact on the range of posture adjustment.
- (2)
- The ratio of workspace volume to mechanism volume is defined as the response value in this paper. It can be seen from the PB test that the influence ranking of each parameter on the range of posture adjustment is as follows: the drive trajectory of the second driving pair > the parameters of the moving and fixed platforms > the angles between the driving pairs > the drive trajectory of the first driving pair. The effect of the first four significant parameters is negative, while the effect of the fifth significant parameter is positive.
- (3)
- Solving the optimized regression equation for optimization with volume ratio as the objective, the optimal values of the five parameters were obtained: X9 = −224.759, X0 = 877.27, X5 = 1.574, X3 = 1498.308, and X2 = 924.974. Then, the volume ratio was found to be , which increased by 43.82% compared to the pre-optimization ratio, proving the effectiveness of using the volume ratio as the response value for parameter optimization.
- (4)
- A comparative analysis of the range of posture adjustment before and after optimization showed that the volume increased from 9.8648 × 10⁷ to 1.11 × 10⁸, an increase of 12.52%. Finally, the prototype was developed based on the optimized mechanism parameters.
The limitation of this paper is that only one method, Response Surface Methodology, is used, and the optimization results of this method are not compared with those of the other optimization methods, such as GA or Differential Evolution. The future research will compare and analyze the effect of different optimization methods on the parameter optimization of the parallel mechanism.
In future work, we will analyze the performance of the mechanism and the control strategy for the prototype based on the results of the optimization of the mechanism parameters.
Author Contributions
Conceptualization, R.W.; methodology, X.X.; software, H.L.; validation, R.W.; data curation, H.L.; writing—original draft preparation, R.W.; writing—review and editing, X.X. and J.Z.; visualization, H.L.; supervision, X.X.; project administration, J.Z.; funding ac-quisition, J.Z. All authors have read and agreed to the published version of the manuscript.
Funding
This research was funded by the National Natural Science Foundation of China (Grant No. 51905367).
Institutional Review Board Statement
Not applicable.
Informed Consent Statement
Not applicable.
Data Availability Statement
The data presented in this study are available upon request from the corresponding author. The data are not publicly available.
Acknowledgments
Thanks to each of the authors for their contributions to the manuscript and for the support of the funding project. In addition, I would like to thank Chengwen Bao for his help in completing this manuscript.
Conflicts of Interest
The authors declare no conflicts of interest.
Appendix A
Table A1.
Design and results of Plackett–Burman test.
Table A1.
Design and results of Plackett–Burman test.
| NO. | X0 | X1 | X2 | X3 | X4 | X5 | X6 | X7 | X8 | X9 | X10 | V1 | V2 | V3 | V4 | V5 | V6 | V7 | V8 | |
|---|---|---|---|---|---|---|---|---|---|---|---|---|---|---|---|---|---|---|---|---|
| 1 | 1000 | 1250 | 1100 | 1350 | 3π/16 | 7π/16 | π/3 | 800 | 1100 | −250 | 250 | 1 | −1 | −1 | 1 | 1 | 1 | 1 | −1 | 0.014 |
| 2 | 700 | 1250 | 800 | 1350 | 5π/16 | 9π/16 | π/3 | 800 | 1100 | −250 | 150 | 1 | 1 | 1 | 1 | −1 | 1 | −1 | 1 | 0 |
| 3 | 700 | 1250 | 1100 | 1650 | 5π/16 | 9π/16 | π/3 | 800 | 900 | −150 | 150 | −1 | −1 | −1 | 1 | 1 | −1 | 1 | 1 | 0 |
| 4 | 700 | 1550 | 1100 | 1650 | 5π/16 | 7π/16 | 2π/3 | 600 | 1100 | −250 | 150 | −1 | −1 | 1 | 1 | −1 | 1 | 1 | −1 | 0.0066 |
| 5 | 1000 | 1250 | 800 | 1650 | 5π/16 | 9π/16 | 2π/3 | 600 | 1100 | −250 | 250 | −1 | −1 | −1 | −1 | 1 | 1 | −1 | 1 | 0 |
| 6 | 700 | 1550 | 800 | 1350 | 3π/16 | 7π/16 | 2π/3 | 800 | 900 | −150 | 250 | −1 | −1 | 1 | 1 | 1 | 1 | −1 | 1 | 0 |
| 7 | 1000 | 1250 | 1100 | 1350 | 5π/16 | 7π/16 | π/3 | 600 | 900 | −150 | 250 | −1 | 1 | 1 | −1 | −1 | 1 | 1 | 1 | 0.006 |
| 8 | 1000 | 1550 | 800 | 1650 | 5π/16 | 7π/16 | π/3 | 800 | 1100 | −150 | 250 | −1 | 1 | −1 | 1 | −1 | −1 | −1 | −1 | 0.0154 |
| 9 | 700 | 1250 | 800 | 1650 | 5π/16 | 7π/16 | 2π/3 | 800 | 900 | −250 | 250 | 1 | 1 | 1 | −1 | 1 | −1 | 1 | −1 | 0.0472 |
| 10 | 1000 | 1550 | 1100 | 1650 | 3π/16 | 9π/16 | π/3 | 800 | 900 | −250 | 150 | −1 | 1 | 1 | −1 | 1 | 1 | −1 | −1 | 3.1874 × 10⁻⁴ |
| 11 | 700 | 1550 | 800 | 1650 | 3π/16 | 7π/16 | π/3 | 600 | 1100 | −150 | 150 | 1 | 1 | −1 | −1 | 1 | 1 | 1 | 1 | 0.0017 |
| 12 | 1000 | 1550 | 800 | 1650 | 3π/16 | 9π/16 | π/3 | 600 | 900 | −250 | 250 | 1 | −1 | 1 | 1 | −1 | −1 | 1 | 1 | 0.0026 |
| 13 | 1000 | 1250 | 800 | 1350 | 3π/16 | 9π/16 | 2π/3 | 600 | 1100 | −150 | 150 | −1 | 1 | 1 | 1 | 1 | −1 | 1 | −1 | 0 |
| 14 | 1000 | 1550 | 800 | 1350 | 5π/16 | 9π/16 | 2π/3 | 800 | 900 | −150 | 150 | 1 | −1 | −1 | −1 | −1 | 1 | 1 | −1 | 0.0023 |
| 15 | 1000 | 1550 | 1100 | 1350 | 5π/16 | 7π/16 | 2π/3 | 600 | 900 | −250 | 150 | 1 | 1 | −1 | 1 | 1 | −1 | −1 | 1 | 0.0021 |
| 16 | 700 | 1550 | 1100 | 1350 | 3π/16 | 9π/16 | 2π/3 | 800 | 1100 | −250 | 250 | −1 | 1 | −1 | −1 | −1 | −1 | 1 | 1 | 0.0478 |
| 17 | 700 | 1250 | 1100 | 1650 | 3π/16 | 9π/16 | 2π/3 | 600 | 900 | −150 | 250 | 1 | 1 | −1 | 1 | −1 | 1 | −1 | −1 | 0.0265 |
| 18 | 1000 | 1250 | 1100 | 1650 | 3π/16 | 7π/16 | 2π/3 | 800 | 1100 | −150 | 150 | 1 | −1 | 1 | −1 | −1 | −1 | −1 | 1 | 0.0053 |
| 19 | 700 | 1550 | 1100 | 1350 | 5π/16 | 9π/16 | π/3 | 600 | 1100 | −150 | 250 | 1 | −1 | 1 | −1 | 1 | −1 | −1 | −1 | 0.0275 |
| 20 | 700 | 1250 | 800 | 1350 | 3π/16 | 7π/16 | π/3 | 600 | 900 | −250 | 150 | −1 | −1 | −1 | −1 | −1 | −1 | −1 | −1 | 0.0251 |
Appendix B
Table A2.
Design and results of Box–Behnken test.
Table A2.
Design and results of Box–Behnken test.
| NO. | X9 | X0 | X5 | X3 | X2 | |
|---|---|---|---|---|---|---|
| 1 | −200 | 775 | π/2 | 1425 | 950 | 0.0337 |
| 2 | −175 | 850 | π/2 | 1575 | 950 | 0.0404 |
| 3 | −225 | 925 | π/2 | 1500 | 950 | 0.0584 |
| 4 | −200 | 850 | π/2 | 1500 | 950 | 0.0445 |
| 5 | −200 | 850 | π/2 | 1500 | 950 | 0.0445 |
| 6 | −200 | 850 | 17π/32 | 1500 | 875 | 0.0481 |
| 7 | −225 | 775 | π/2 | 1500 | 950 | 0.0461 |
| 8 | −175 | 850 | 15π/32 | 1500 | 950 | 0.0208 |
| 9 | −200 | 925 | π/2 | 1575 | 950 | 0.0524 |
| 10 | −200 | 850 | π/2 | 1575 | 1025 | 0.0393 |
| 11 | −175 | 925 | π/2 | 1500 | 950 | 0.0424 |
| 12 | −200 | 850 | 15π/32 | 1500 | 875 | 0.0366 |
| 13 | −175 | 850 | π/2 | 1500 | 1025 | 0.0288 |
| 14 | −200 | 850 | 15π/32 | 1575 | 950 | 0.0321 |
| 15 | −200 | 850 | 15π/32 | 1500 | 1025 | 0.0199 |
| 16 | −200 | 850 | 17π/32 | 1575 | 950 | 0.0422 |
| 17 | −200 | 775 | π/2 | 1500 | 1025 | 0.0296 |
| 18 | −200 | 850 | π/2 | 1425 | 875 | 0.0508 |
| 19 | −200 | 850 | 17π/32 | 1425 | 950 | 0.0573 |
| 20 | −200 | 850 | π/2 | 1500 | 950 | 0.0445 |
| 21 | −200 | 925 | 15π/32 | 1500 | 950 | 0.0337 |
| 22 | −200 | 850 | π/2 | 1575 | 875 | 0.0569 |
| 23 | −200 | 925 | π/2 | 1500 | 1025 | 0.0412 |
| 24 | −225 | 850 | π/2 | 1500 | 1025 | 0.0427 |
| 25 | −200 | 850 | π/2 | 1500 | 950 | 0.0445 |
| 26 | −175 | 775 | π/2 | 1500 | 950 | 0.0311 |
| 27 | −225 | 850 | 17π/32 | 1500 | 950 | 0.0525 |
| 28 | −200 | 850 | π/2 | 1425 | 1025 | 0.0312 |
| 29 | −225 | 850 | π/2 | 1500 | 875 | 0.0634 |
| 30 | −175 | 850 | π/2 | 1500 | 875 | 0.046 |
| 31 | −225 | 850 | π/2 | 1425 | 950 | 0.0485 |
| 32 | −200 | 925 | π/2 | 1425 | 950 | 0.0467 |
| 33 | −200 | 850 | 17π/32 | 1500 | 1025 | 0.0505 |
| 34 | −225 | 850 | 15π/32 | 1500 | 950 | 0.0348 |
| 35 | −200 | 850 | π/2 | 1500 | 950 | 0.0445 |
| 36 | −225 | 850 | π/2 | 1575 | 950 | 0.0556 |
| 37 | −175 | 850 | π/2 | 1425 | 950 | 0.0327 |
| 38 | −200 | 775 | 17π/32 | 1500 | 950 | 0.0545 |
| 39 | −175 | 850 | 17π/32 | 1500 | 950 | 0.0477 |
| 40 | −200 | 925 | π/2 | 1500 | 875 | 0.0598 |
| 41 | −200 | 925 | 17π/32 | 1500 | 950 | 0.0443 |
| 42 | −200 | 775 | π/2 | 1500 | 875 | 0.0483 |
| 43 | −200 | 775 | 15π/32 | 1500 | 950 | 0.0215 |
| 44 | −200 | 850 | π/2 | 1500 | 950 | 0.0445 |
| 45 | −200 | 850 | 15π/32 | 1425 | 950 | 0.0226 |
| 46 | −200 | 775 | π/2 | 1575 | 950 | 0.0423 |
References
- Sun, T.; Song, Y.M.; Gao, H.; Yang, Q. Topology synthesis of a 1T3R parallel manipulator with an articulated traveling plate. ASME J. Mech. Robot. 2015, 7, 310151–310159. [Google Scholar] [CrossRef]
- Bi, Z.; Wang, L. Optimization of machining processes from the perspective of energy consumption: A case study. J. Manuf. Syst. 2012, 31, 420–428. [Google Scholar] [CrossRef]
- Michalos, G.; Kaltsoukalas, K.; Aivaliotis, P.; Sipsas, P.; Sardelis, A.; Chryssolouris, G. Design and simulation of assembly systems with mobile robots. CIRP Ann. 2014, 63, 181–184. [Google Scholar] [CrossRef]
- Huo, X.M.; Sun, T.; Song, Y.M. A geometric algebra approach to determine motion/constraint, mobility and singularity of parallel mechanism. Mech. Mach. Theory 2017, 116, 273–293. [Google Scholar] [CrossRef]
- Wang, L.; Xi, F.; Zhang, D. A parallel robotic attachment and its remote manipulation. Robot. Comput.-Integr. Manuf. 2006, 22, 515–525. [Google Scholar] [CrossRef][Green Version]
- Sun, T.; Song, Y.-M.; Yan, K. Kineto-static analysis of a novel high-speed parallel manipulator with rigid-flexible coupled links. J. Central South Univ. 2011, 18, 593–599. [Google Scholar] [CrossRef]
- Liang, D.; Song, Y.; Sun, T.; Dong, G. Optimum design of a novel redundantly actuated parallel manipulator with multiple actuation modes for high kinematic and dynamic performance. Nonlinear Dyn. 2016, 83, 631–658. [Google Scholar] [CrossRef]
- Sun, T.; Song, Y.; Li, Y.; Liu, L. Dimensional synthesis of a 3-DOF parallel manipulator based on dimensionally homogeneous Jacobian matrix. Sci. China Ser. E Technol. Sci. 2010, 53, 168–174. [Google Scholar] [CrossRef]
- Schreiber, L.-T.; Gosselin, C. Kinematically redundant planar parallel mechanisms: Kinematics, workspace and trajectory planning. Mech. Mach. Theory 2018, 119, 91–105. [Google Scholar] [CrossRef]
- Jamshidifar, H.; Khajepour, A.; Fidan, B.; Rushton, M. Kinematically-constrained redundant cable-driven parallel robots: Modeling, redundancy analysis, and stiffness optimization. IEEE/ASME Trans. Mechatron. 2016, 22, 921–930. [Google Scholar] [CrossRef]
- Wang, S.J.; Feng, W.; Li, T.J.; Zhang, J.J.; Yang, D.; Liu, J.Y. Kinematic performance analysis of spatial 2-DOF redundantly actuated parallel manipulator. J. Mech. Eng. 2022, 58, 18–27. [Google Scholar]
- Altuzarra, O.; Pinto, C.; Sandru, B.; Hernandez, A. Optimal dimensioning for parallel manipulators: Workspace, dexterity, and energy. J. Mech. Des. 2011, 133, 041007. [Google Scholar] [CrossRef]
- Herrero, S.; Mannheim, T.; Prause, I.; Pinto, C.; Corves, B.; Altuzarra, O. Enhancing the useful workspace of a reconfigurable parallel manipulator by grasp point optimization. Robot. Comput. Integr. Manuf. 2015, 31, 51–60. [Google Scholar] [CrossRef]
- Shin, H.; Lee, S.; In, W.; Jeong, J.I.; Kim, J. Kinematic optimization of a redundantly actuated parallel mechanism for maximizing stiffness and workspace using Taguchi method. J. Comput. Nonlinear Dyn. 2010, 6, 011017. [Google Scholar] [CrossRef]
- Wu, J.; Chen, X.; Wang, L. Design and Dynamics of a Novel Solar Tracker with Parallel Mechanism. IEEE/ASME Trans. Mechatron. 2016, 21, 88–97. [Google Scholar] [CrossRef]
- Isaksson, M. Kinematically Redundant Planar Parallel Mechanisms for Optimal Singularity Avoidance. ASME J. Mech. Des. 2017, 139, 042302. [Google Scholar] [CrossRef]
- Gao, Z.; Zhang, D. Performance analysis, mapping and multiobjective optimization of a hybrid robotic machine tool. IEEE Trans. Int. Electron. 2015, 62, 423–433. [Google Scholar] [CrossRef]
- Qi, Y.; Sun, T.; Song, Y. Multi-objective optimization of parallel tracking mechanism considering parameter uncertainty. J. Mech. Robot. 2018, 10, 041006. [Google Scholar] [CrossRef]
- Flocker, F.W.; Bravo, R.H. On Global Convergence in Design Optimization Using the Particle Swarm Optimization Technique. ASME J. Mech. Des. 2016, 138, 081402. [Google Scholar] [CrossRef]
- Wang, L.; Ng, A.H.C.; Deb, K. Multi-Objective Evolutionary Optimisation for Product Design and Manufacturing; Springer: London, UK, 2011; ISBN 978-0-85729617-7. [Google Scholar]
- Sun, T.; Xiang, X.; Su, W.; Wu, H.; Song, Y. A transformable wheel-legged mobile robot: Design, analysis and experiment. Robot. Auton. Syst. 2017, 98, 30–41. [Google Scholar] [CrossRef]
- Stan, S.-D.; Balan, R.; Maties, V. Multi-objective design optimization of mini parallel robots using genetic algorithms. In Proceedings of the 2007 IEEE International Symposium on Industrial Electronics, Vigo, Spain, 4–7 June 2007; pp. 2173–2178. [Google Scholar]
- Liang, D.; Song, Y.; Sun, T.; Jin, X. Rigid-flexible coupling dynamic modeling and investigation of a redundantly actuated parallel manipulator with multiple actuation modes. J. Sound Vib. 2017, 403, 129–151. [Google Scholar] [CrossRef]
- Zhao, J.; Wu, C.; Yang, G.; Chen, C.-Y.; Chen, S.; Xiong, C.; Zhang, C. Kinematics analysis and workspace optimization for a 4-DOF 3T1R parallel manipulator. Mech. Mach. Theory 2022, 167, 104484. [Google Scholar] [CrossRef]
- Fu, J.; Gao, F. Optimal design of a 3-leg 6-DOF parallel manipulator for a specific workspace. Chin. J. Mech. Eng. 2016, 29, 659–668. [Google Scholar] [CrossRef]
- Karimi, A.; Masouleh, M.T.; Cardou, P. Singularity-free workspace analysis of general 6-UPS parallel mechanisms via convex optimization. Mech. Mach. Theory 2014, 80, 17–34. [Google Scholar] [CrossRef]
- Kaloorazi, M.-H.F.; Masouleh, M.T.; Caro, S. Determination of the maximal singularity-free workspace of 3-DOF parallel mechanisms with a constructive geometric approach. Mech. Mach. Theory 2015, 84, 25–36. [Google Scholar] [CrossRef]
- Huang, T.; Li, Z.; Li, M.; Chetwynd, D.G.; Gosselin, C.M. Conceptual design and dimensional synthesis of a novel 2-DOF translational parallel robot for pick-and-place operations. J. Mech. Des. 2004, 126, 449–455. [Google Scholar] [CrossRef]
- Xu, Q.; Li, Y. Design and analysis of a new singularity-free three-prismatic-revolute-cylindrical translational parallel manipulator. Proc. Inst. Mech. Eng. Part C J. Mech. Eng. Sci. 2007, 221, 565–576. [Google Scholar] [CrossRef]
- Liu, X.-J.; Li, J.; Zhou, Y. Kinematic optimal design of a 2-degree-of-freedom 3-parallelogram planar parallel manipulator. Mech. Mach. Theory 2015, 87, 1–17. [Google Scholar] [CrossRef]
- Liu, X.-J.; Wang, J.; Pritschow, G. Performance Atlases and Optimum Design of Planar 5R Symmetrical Parallel Mechanisms. Mech. Mach. Theory 2006, 41, 119–144. [Google Scholar] [CrossRef]
- McDaid, A.J. Design, Analysis, and Multicriteria Optimization of an Overground Pediatric Robotic Gait Trainer. IEEE/ASME Trans. Mechatron. 2017, 22, 1674–1684. [Google Scholar] [CrossRef]
- Hao, F.; Merlet, J.-P. Multi-criteria optimal design of parallel manipulators based on interval analysis. Mech. Mach. Theory 2004, 40, 157–171. [Google Scholar] [CrossRef]
- Cheng, S.; Zhou, J.; Li, M. A New Hybrid Algorithm for Multi-Objective Robust Optimization with Interval Uncertainty. ASME J. Mech. Des. 2015, 137, 021401. [Google Scholar] [CrossRef]
- Kucuk, S. Maximal Dexterous Trajectory Generation and Cubic Spline Optimization for Fully Planar Parallel Manipulators. Comput. Electr. Eng. 2016, 56, 634–647. [Google Scholar] [CrossRef]
- Toz, M.; Kucuk, S. Dimensional Optimization of 6-DOF 3-CCC Type Asymmetric Parallel Manipulator. Adv. Robot. 2014, 28, 625–637. [Google Scholar] [CrossRef]
- Smail, M.; Bouchekara, H.; Pichon, L.; Boudjefdjouf, H.; Mehasni, R. Diagnosis of Wiring Networks Using Particle Swarm Optimization and Genetic Algorithms. Comput. Electr. Eng. 2014, 40, 2236–2245. [Google Scholar] [CrossRef]
- Box, G.E.P.; Wilson, K.B. On the Experimental Attainment of Optimum Conditions; Springer: New York, NY, USA, 1992. [Google Scholar]
- Tao, Z.; Yaoyao, S.; Xiaojun, L.; Tianran, H. Optimization of abrasive flow polishing process parameters for static blade ring based on response surface methodology. J. Mech. Sci. Technol. 2016, 30, 1085–1093. [Google Scholar] [CrossRef]
- Wang, R.; Xiong, X.; Zhang, J.; Yuan, R. Configuration Design of Movable Heavy—Duty Reconfigurable Posture Adjustment Platform with Dual Motion Modes. Robotica 2024, 1–29. [Google Scholar] [CrossRef]
- Goswami, S.; Ghosh, S.; Chakraborty, S. Reliability analysis of structures by iterative improved response surface method. Struct. Saf. 2016, 60, 56–66. [Google Scholar] [CrossRef]
- Neşeli, S.; Yaldız, S.; Türkeş, E. Optimization of tool geometry parameters for turning operations based on the response surface methodology. Measurement 2011, 44, 580–587. [Google Scholar] [CrossRef]


Disclaimer/Publisher’s Note: The statements, opinions and data contained in all publications are solely those of the individual author(s) and contributor(s) and not of MDPI and/or the editor(s). MDPI and/or the editor(s) disclaim responsibility for any injury to people or property resulting from any ideas, methods, instructions or products referred to in the content. |
© 2024 by the authors. Licensee MDPI, Basel, Switzerland. This article is an open access article distributed under the terms and conditions of the Creative Commons Attribution (CC BY) license (https://creativecommons.org/licenses/by/4.0/).