Article

Permeability Characteristics of Improved Loess and Prediction Method for Permeability Coefficient

by
Guoliang Ran
1,2,
Yanpeng Zhu
1,3,4,
Xiaohui Yang
1,3,4,*,
Anping Huang
5 and
Dong Chen
1,3,4
1
School of Civil Engineering, Lanzhou University of Technology, Lanzhou 730050, China
2
School of Safety Engineering, Lanzhou Resources & Environment Voc-Tech University, Lanzhou 730021, China
3
Western Engineering Research Center of Disaster Mitigation in Civil Engineering of Ministry of Education, Lanzhou University of Technology, Lanzhou 730050, China
4
Key Laboratory of Disaster Prevention and Mitigation in Civil Engineering of Gansu, Lanzhou University of Technology, Lanzhou 730050, China
5
School of Environment and Urban Construction, Lanzhou City University, Lanzhou 730070, China
*
Author to whom correspondence should be addressed.
Appl. Sci. 2024, 14(17), 8072; https://doi.org/10.3390/app14178072
Submission received: 2 July 2024 / Revised: 1 August 2024 / Accepted: 7 August 2024 / Published: 9 September 2024

Abstract

:
Due to its unique geotechnical properties, loess presents itself as a cost-effective and energy-efficient material for engineering construction, aiding in cost reduction and environmental sustainability. However, to meet engineering specifications, loess often requires enhancement. Evaluating its permeability properties holds significant importance for employing improved loess for construction materials in landfills and artificial water bodies. This study investigates the influence of dry densities, grain size characteristics, grain size distribution, and admixture contents and types on the permeability of improved loess, focusing on the Malan and Lishi loess. The falling head permeability test was conducted to analyze how each factor affects the permeability of the improved loess. The findings indicate that the permeability coefficient decreases with increased dry density and admixture content. Conversely, it demonstrates a linear increase with the average grain size (d50), restricted grain size (d60), and the product of the coefficient of uniformity and coefficient of curvature (Cu × Cc). The primary influencing factor is the type of admixture, followed by Cc and d60. Furthermore, this study developed a predictive model for permeability using a support vector machine (SVM), surpassing the predictive accuracy of linear regression and neural network models. The model provides a robust prediction for the permeability of superior loess material.

1. Introduction

Loess, a material extensively employed in engineering applications, finds wide usage in various projects such as the construction of cement–soil waterproof curtains, artificial water-impermeable layers, and landfills. Among the crucial engineering properties of loess, permeability holds particular significance, directly influencing the practical implementation of engineering projects [1].
While research on improved loess has primarily focused on its mechanical properties, the exploration of its permeability necessitates further development. The permeability coefficient, a key indicator assessing loess permeability, predominantly signifies the soil’s capacity to permit water passage and transmission, constituting a vital parameter in hydrogeology. This coefficient is notably affected by initial water content [2], dry density [3], void ratio [4], compaction [5], pressure [6], and the temperature [7] of the soil.
An analysis of these elements’ impact on the permeability coefficient of loess can significantly enhance its suitability for engineering purposes. Loess, categorized as a distinctive type of porous medium and water-sensitive soil, exhibits noteworthy mechanical characteristics, including a rapid decline in strength and increased deformation under infiltration or humidification [8]. Consequently, the mechanical and permeability properties of loess are commonly improved through compaction techniques and the incorporation of additives such as cement, fly ash, and lime [9], utilizing compaction methods and physicochemical reactions induced by the additives [10].
In a comprehensive study by Wang Hui [11], it was established that the permeability coefficient of loess exhibited a nonlinear relationship with the void ratio. This relationship, intricately tied to soil properties, was elucidated through saturated permeability tests on both intact and remolded loess subjected to varying conditions. Wang Tiehang [12] et al. studied the influencing factors of the permeability coefficient of unsaturated loess by adjusting the dry density of compacted loess samples, and the test results showed that the permeability coefficient increased monotonically and accelerated with the increase in volumetric water content, so the dry density is an important factor affecting the permeability coefficient of compacted loess. Yan Geng-sheng’s research [13] introduced cement, lime, and fly ash as improvement materials to typical loess soils, analyzing their effects on soil grading and permeability. The findings highlighted a gradual reduction in permeability for the improved soils as the hydration reaction of cement, lime, and fly ash progressed. However, their study did not consider the influence of dry density and loess grading properties on permeability. Zhao Qian [14] took the losses of Xi’an, Yan’an, and Mili as research objects and found that the coarse grain mass ratio gradually increased and the grain size distribution curve transitioned from “double peak” to “single peak” through indoor tests. As the mass percentage of clay particles increased, the permeability coefficient decreased, resulting in a more significant disparity in permeability between the longitudinal and transverse directions. The equation for predicting the permeability coefficient was developed using test results and took into account grading parameters, grain size parameters, and porosity. However, it was found that this equation was not able to accurately forecast the permeability of loess material that had been affected with admixtures.
The soil permeability coefficient (k) is a critical parameter in the design of civil engineering structures. Estimating “k” using empirical formulas related to other soil engineering parameters may not be accurate [15,16]. Recently, machine learning (ML) algorithms have been widely applied in scientific research and engineering practices across various fields of civil engineering [17,18]. Researchers have proposed models using artificial neural networks (ANN) [19] and Gaussian process regression (GPR) [20] to predict the soil permeability coefficient, achieving promising results. In general, computing-based models are excellent techniques for predicting soil permeability coefficients, and related research outcomes can provide more accurate and scientific methods for predicting the permeability coefficient of artificially improved loess.
In summary, it can be seen that the current methods of improvement for loess materials work mainly through the compaction and using admixtures. Methods of improvement of grain size and gradation for excavation to obtain on-site soil materials are relatively rare. Furthermore, the research on the law of the change of the permeability of improved loess and the method of prediction of the permeability coefficient mainly focused on the individual effect of a certain influencing factor; the research on the law of the change of permeability performance under the combined effect of multiple factors, the contributing degree of each influencing factor, and the prediction model of the permeability coefficient under the influence of multiple factors is still relatively lacking. Therefore, in this paper, indoor infiltration tests of improved loess materials were conducted to study the relationship between each influencing factor and the infiltration coefficient, and the degree of influence of each factor on the infiltration coefficient was evaluated by gray correlation analysis, with Malan loess as the research object. Finally, the SVM regression algorithm was used to establish the prediction model of the saturated permeability coefficient of improved loess. Then, the permeability of improved loess materials was evaluated. The research results are of guiding significance for engineering construction in loess areas, especially for developing artificial water-impermeable materials.

2. Materials and Methods

2.1. Test Materials

The loess material excavated at the construction site is poorly graded, and the fine particles in the pores of the large particles will be lost with the seepage of water, leaving pores between the large particles because of the lack of fine particles filling, which is conducive to the seepage of water. In the absence of compaction and admixtures to improve its water sensitivity, the in situ, it is challenging for untreated loess to meet the requirements for the permeability of impermeable materials in engineering construction. It is not suitable for direct use as an impermeable material. Therefore, in the research process of this paper, the loess is improved by three methods. First, the four kinds of soils obtained from excavation on site are mixed in different proportions to improve the grain size and grading characteristics of the soils. Secondly, the compaction of the mixed soil was carried out to improve the dry density of the soil. Thirdly, lime and cement were added as admixtures for improvement. Through the test, the permeability characteristics of the loess modified by these three methods were evaluated.
The materials used in this test were taken from Gaolan County, Lanzhou City, Gansu Province. Some measured index properties of the soil are summarized in Table 1, through the sieve test, hydrometer analyses, proctor test, and consolidated liquid–plastic limit test. All the tests followed the Chinese National Standards (CNS) GB/T50123-2019 [21] and the test apparatus used is shown in Figure 1.
When loess is used as artificially improved material, its large particles and structure in its natural state will be destroyed during the construction process on site. Therefore, in order to be able to approximate the degree of particle crushing of the improved material at the construction site, the soil particle was crushed and passed through a 5 mm sieve for use in the process of conducting the test.

2.1.1. Malan Loess

The Malan loess used in this paper has a homogeneous texture, relatively developed pore structure, and a brownish-yellow color. It has low dry strength and low toughness in its natural state. The basic physical properties of Malan loess are listed in Table 1. The grain size distribution curve is shown in Figure 2. The average grain size (the grain size that corresponds to 50% of the total soil mass being finer than that size on the grain size distribution curve) d50 = 0.39 mm, the restricted grain size (the grain size that corresponds to 60% of the total soil mass being finer than that size on the grain size distribution curve) d60 = 0.5 mm, the effective grain size (the grain size that corresponds to 10% of the total soil mass being finer than that size on the grain size distribution curve) d10 = 0.09, the median grain size (the grain size that corresponds to 30% of the total soil mass being finer than that size on the grain size distribution curve) d30 = 0.2935 mm. The coefficient of uniformity (defined as C u = d 60 d 10 ) Cu = 2.11 < 5, and the coefficient of curvature (defined as C c = d 30 2 d 10 d 60 ) Cc = 2.11 > 1 and <3. The poor particle gradation of Malan loess is evident.

2.1.2. Lishi Loess

For Lishi loess, its texture is relatively homogeneous, with less pore developed and medium dry strength. The basic physical properties are listed in Table 1. The grain size distribution curve is shown in Figure 2. The average grain size d50 = 1.34 mm, restricted grain size d60 = 1.8 mm, effective grain size d10 = 0.16 mm, and the median grain size d30 = 0.72 mm. The coefficient of uniformity Cu = 13.17 > 5, and the coefficient of curvature Cc = 1.86 > 1 and less than 3. Therefore, it is evident that the particle gradation of Lishi loess has favorable characteristics.

2.1.3. Argillaceous Sandstone

The argillaceous sandstone used in this paper is strongly weathered, displaying a brick-red hue and a partially consolidated structure. The mineral composition is dominated by quartz and feldspar, with a few dark minerals and mud calcareous cementation. The rocks have a massively thick laminated structure. The rocks are clastic in structure and blocky, with microfractures and weathering fractures, which are easily softened and disintegrated by water. Figure 2 displays its grain size distribution curve. The average grain size d50 = 0.17 mm, restricted grain size d60 = 0.21 mm, effective grain size d10 = 0.08 mm, and the median grain size d30 = 0.12 mm. The coefficient of uniformity Cu = 2.48 < 5, and the coefficient of curvature Cc = 0.825 < 1. The grain gradation of argillaceous sandstone is poor.

2.1.4. Loess-like Silt

The loess-like silt observed in this paper has uneven soil quality, containing silt particles, with more developed pores and wormholes. The shaking response is moderate, with no luster response. This type of soil has low strength and toughness in a dry state, and is slightly wet. The fundamental physical property indexes of clay loess are listed in Table 2. The grain size distribution curve is shown in Figure 2. The average grain size d50 = 0.24 mm, restricted grain size d60 = 0.33 mm, effective grain size d10 = 0.085 mm, and the median grain size d30 = 0.14 mm. The coefficient of uniformity Cu = 3.86 < 5, and the coefficient of curvature Cc = 0.71 < 1. The grain gradation of loess-like powder soil is poor.

2.2. Falling Head Permeability Test Method and Test Scheme

Initially, soil samples acquired from on-site excavations were combined, employing either Malan loess or loess-like silt as the foundational material. For preliminary enhancement, a proportion of Lishi loess or argillaceous sandstone was introduced. Subsequently, the permeability coefficient of the preliminarily improved loess material was assessed. Soil samples, each with distinct dry densities, were meticulously prepared for permeability tests through controlled adjustments in the compaction process. Finally, an analysis was conducted to determine the influence of admixtures, specifically cement or lime, on the improved loess. For specimens containing admixtures, the test was conducted after a one-day curing period post sample preparation, without considering the influence of curing time on the permeability coefficient. The sample preparation process and the test apparatus are illustrated in Figure 3.
The penetration ring, measuring 61.8 mm in diameter and 40 mm in height, was utilized. Post preparation, the reshaped ring was saturated through a controlled pumping process prior to undergoing the penetration test. Lime, in the form of chemically pure Ca(OH)2, and ordinary silicate cement (P. O42.5) were employed as admixtures.
The permeameter which contained the prepared specimen was connected to the water head apparatus. Distilled water was introduced into the variable head tube using a supply bottle, raising the water level to a predetermined height. Once the water level stabilized, the water supply was cut off and the inlet clamp was opened to allow water to permeate through the soil sample. When water started to overflow from the outlet, the initial water head height and the initial time in the variable head tube were recorded. Subsequently, the water head and time were recorded at 1800 s intervals, and the water temperature at the outlet was measured. This process was repeated twice consecutively. The test was repeated five times using different initial water heads. The test concluded when the permeability coefficient error value fell within the acceptable range. Comprehensive details regarding the test scheme and corresponding results are tabulated in Table 2.

3. Results and Analysis

3.1. Test Results and Analysis of Improved Loess with Single Index

3.1.1. Influence of Admixture on Permeability Coefficient

Figure 4 and Figure 5 illustrate the relationship between varying cement admixture content and the permeability coefficient, keeping particle properties, grading parameters, and dry density constant. The permeability coefficients of all three groups of soil samples decreased with increasing cement content. A substantial decline in permeability coefficients was observed in tests PL18, PL19, PL20, PL21, PL22, and PL23 when the cement content exceeded 9%. In contrast, tests PL27, PL28, PL29, and PL30 displayed curves with a more gradual slope, indicating a consistent and incremental decrease in permeability without distinct turning points. Notably, the effect of the cement admixture on the permeability coefficient was more significant for specimens with larger grain sizes and smaller Cu values.
Furthermore, the permeability coefficient of the improved loess material, composed of a blend of Malan loess and Lishi loess with added cement, stabilized within the typical range of cement admixture ratios used in general engineering applications. For example, the cement admixture ratio commonly employed for constructing impermeable curtains using cement piles, typically ranging from 12% to 15%, resulted in a permeability coefficient of 7.6 × 10⁻⁸ cm/s, based on this study. Conversely, a mass ratio of 6:4 of Malan loess and Lishi loess (PL15) yielded a permeability coefficient of 7.12 × 10⁻⁷ cm/s at the same dry density, representing a 9.37-times higher value. Furthermore, an increase in lime content led to a decrease in the permeability coefficient, with a reduction factor of 1.3 observed as the lime content increased from 6% to 12%.
The reason for such a change is that the soil used in the test has fewer particle clusters of clay particles. Therefore, the permeability coefficient of the cement soil exhibits a significant decrease as the cement admixture ratio increases. This decrease occurs due to the challenge faced by cement hydrate in fully filling all the pores within the fine particles initially. However, once the cement admixture ratio reaches a level where most of the pores in the fine particles are filled, further increases in the cement admixture ratio do not effectively reduce the permeability coefficient of the cement soil. This also explains the slight change in permeability coefficient after adding more than 12% of cement in Figure 4. It shows that the permeability coefficient of the improved loess is related to the pore space of the soil. Therefore, reducing the improved loess’s void ratio and increasing the cemented soil’s dry density can reduce the cemented soil’s permeability coefficient more effectively with the same cement incorporation ratio.

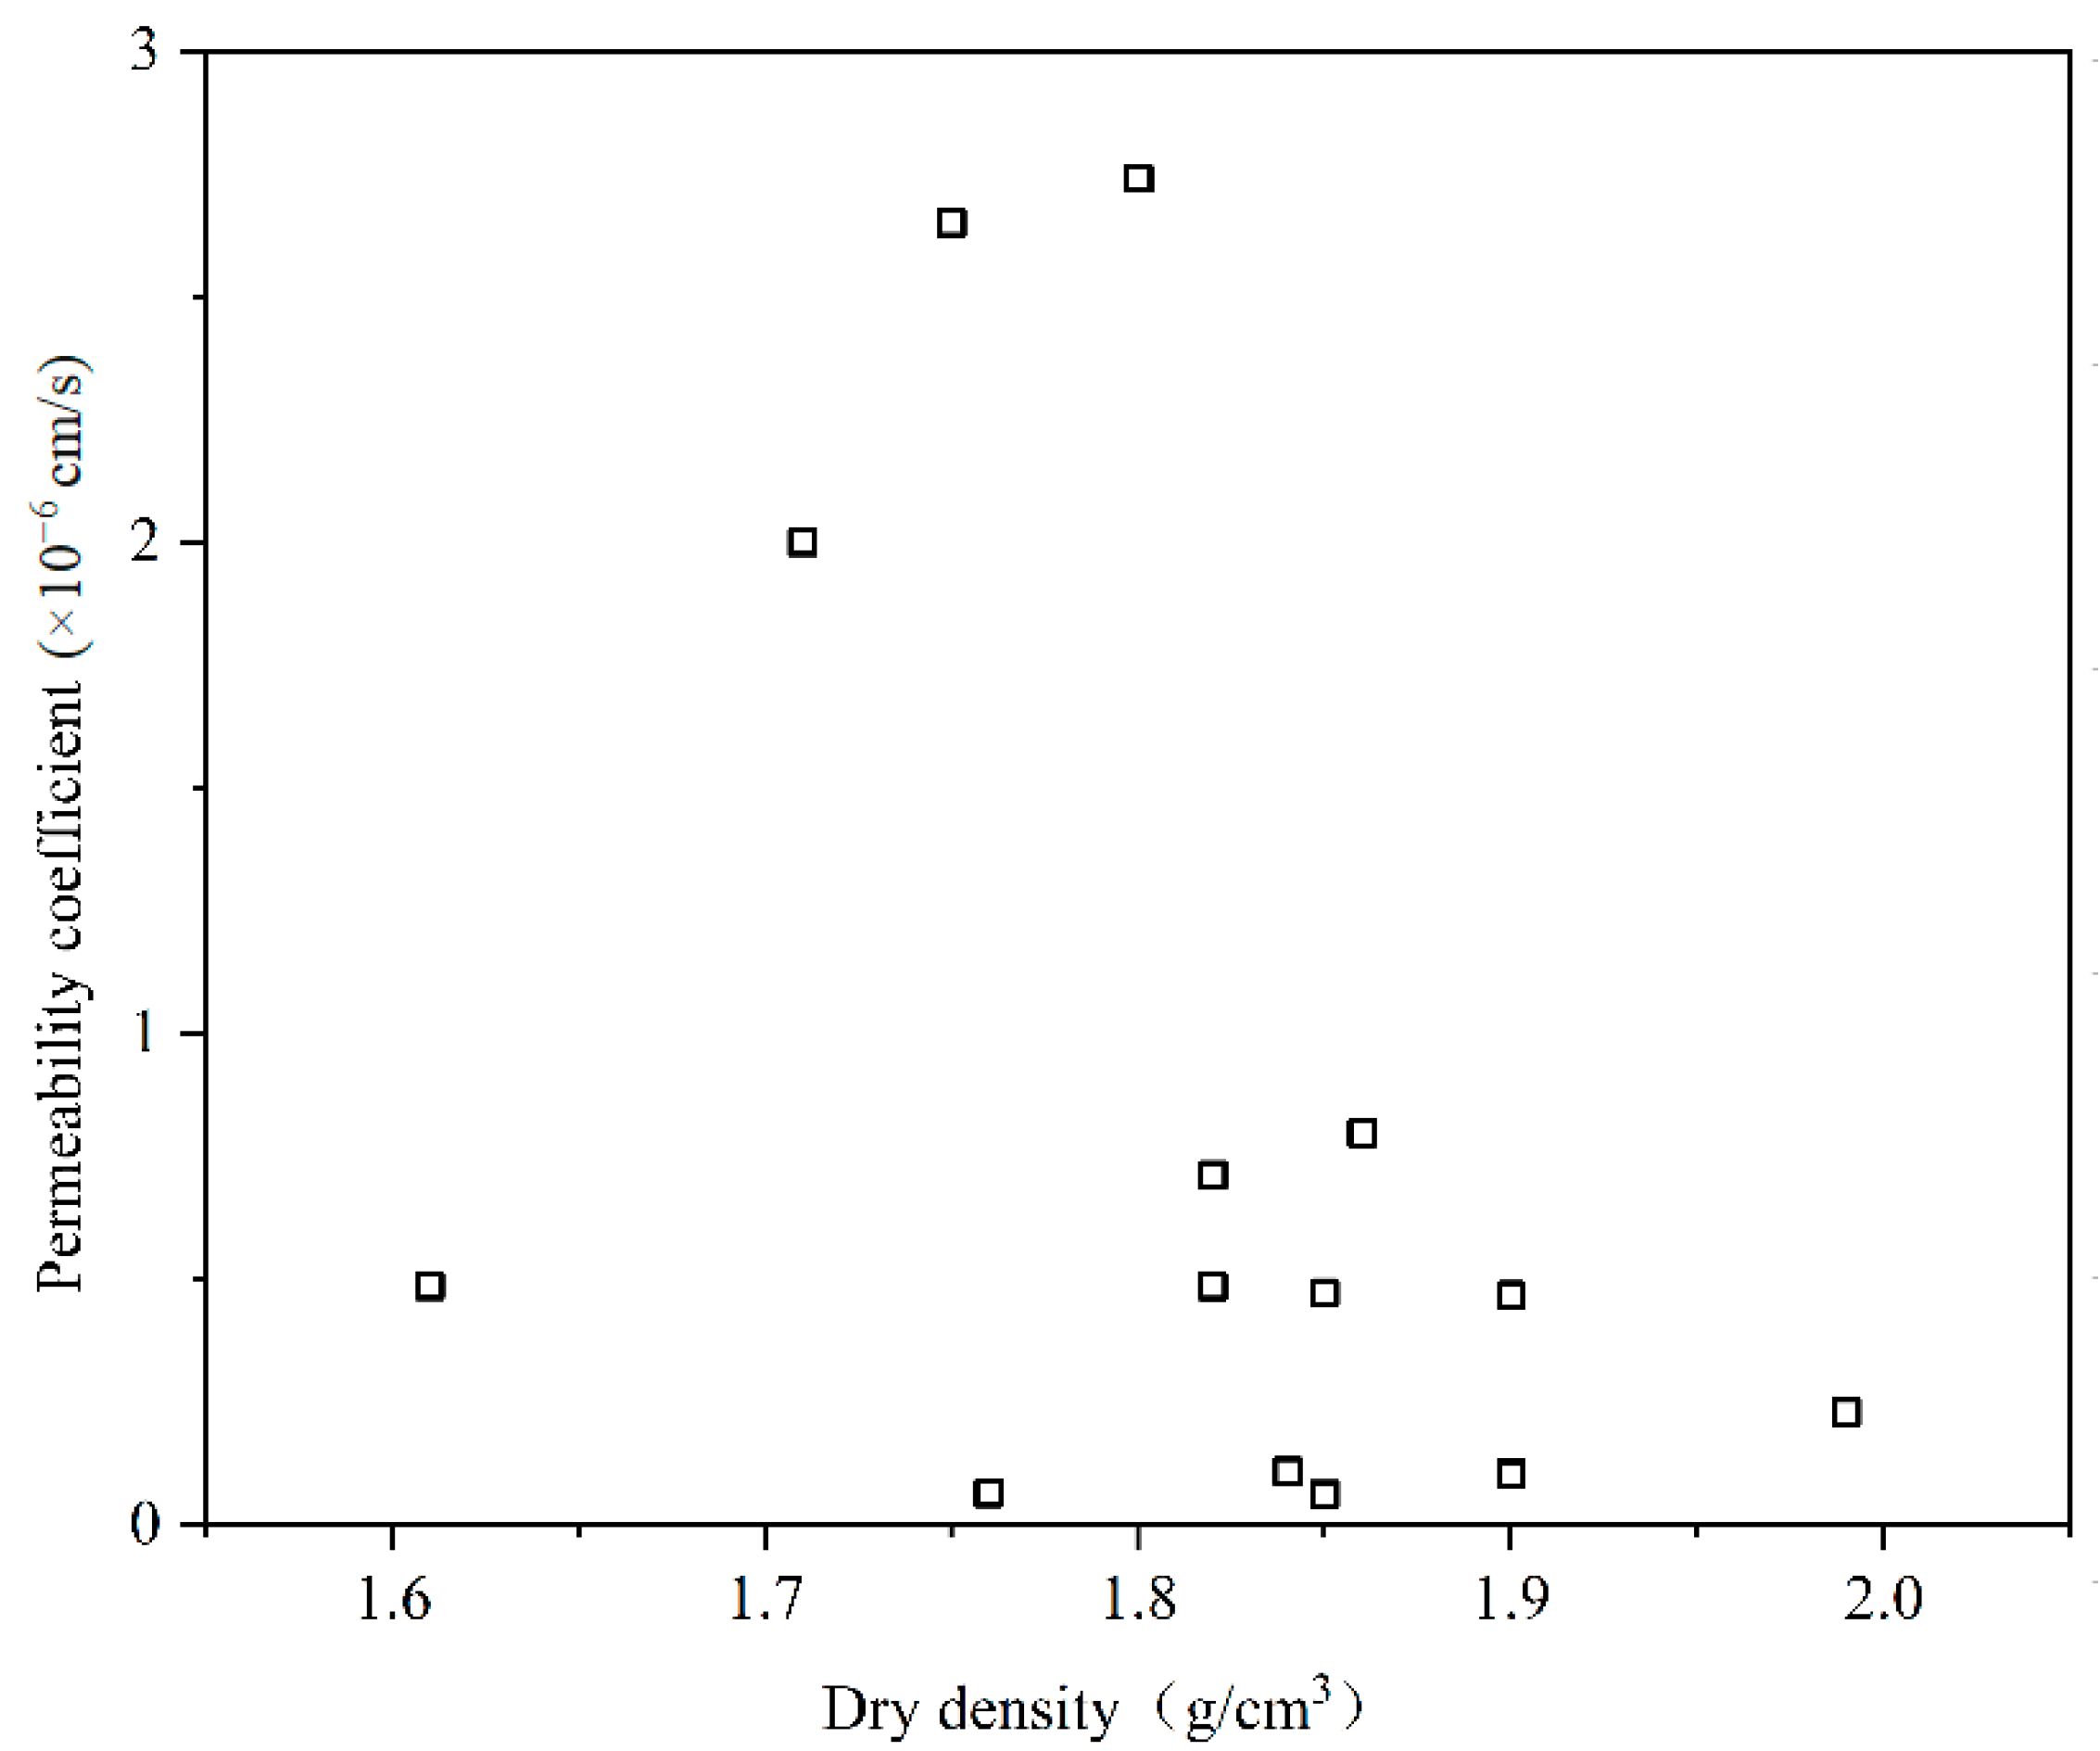
3.1.2. Influence of Dry Density on Permeability Coefficient

Figure 6 shows the relationship between the dry density and permeability coefficient without considering the effect of admixture. In general, the permeability coefficient of the specimen becomes smaller as the dry density increases continuously. However, affected by the soil sample’s particle characteristics and grading properties, it does not show a good correlation, and the dispersion of the data is significant. Figure 7 shows the test results of improved loess without cement addition (PL14, PL15, PL16, PL17) and improved loess with 15% cement addition (PL31, PL34, PL35, and PL36) at different dry densities, with the same particle and grading characteristics of soil samples. In each data set, only the dry densities are different. The permeability coefficients of the two set samples showed a negative correlation with the dry density, i.e., the permeability coefficient decreased with the increase in the dry density. The curves in PL14, PL15, PL16, and PL17 exhibited a distinct turning point at a density of ρd = 1.65 g/cm3. In PL31, PL34, PL35, and PL36, the turning point was ρd = 1.82 g/cm3. After the turning point, the permeability coefficient decreases slightly when the dry density increases.
The coefficient of permeability of the improved loess with the addition of cement is smaller than that of the specimen without admixture at a similar dry density. This is because the cement undergoes a hydration reaction among the improved soil, and the hydration products generated between soil particles on the surface area of soil particles gradually fill the large pores between soil particles. Due to the hydration reaction, the cement soil can make part of the free water form crystalline water during the hardening process, making the structure more compact. It makes the permeability coefficient decrease. It is worth noticing that, during the experiment, it was found that with the increase in cement content, the dry density of the improved loess decreases compared with that without cement. Because the optimal water content range of cement is much larger than that of the general fine-grained soil, the fine particles cannot mix well with the soil and are not easily compacted. Therefore, the contribution of these two factors to the reduction in the permeability coefficient needs to be analyzed in depth.

3.1.3. Influence of Grain Size Characteristics on Permeability Coefficient

In this paper, PL2, PL7, PL9, PL10, PL13, and PL15 specimens did not have admixture, and the dry density varied from 1.82 g/cm3 to 1.86 g/cm3. The range of dry density variation is small, and it can be assumed that the dry density does not affect the permeability coefficient.
Unlike sandy soils, which are composed of sand grains and have a bulk soil structure, loess is mainly an agglomerate (loess-like) or condensed structure based on gravitational force. Therefore, the improved loess material’s permeability coefficient did not correlate with the effective grain size d10 as with the results of the sandy soil study.
The average grain size d50 as a whole reflects the grain size of the soil. With a certain void ratio and particle gradation, the total pore volume of the soil is decided, and its average pore size increases with the increase in the average grain size. The correlation between d50 and the permeability coefficient was studied in the experiment by mixing different kinds of soils to change it. As can be seen from Figure 8, the permeability coefficient is nearly linearly and positively correlated with d50, with a goodness of fit R2 = 0.8561. The increase in the average grain size makes the inter-particle pore diameter larger. The increase in the pore cross-sectional area makes the water head loss of flow through the pore smaller and the water velocity greater. According to v = ki (v is the seepage velocity and i is the hydraulic gradient), the permeability coefficient k becomes larger when v becomes larger and i becomes smaller.
The grain size between d10 and d60 is decisive in constituting the soil skeleton action. As can be seen from Figure 9, the permeability coefficient and the restricted grain size d60 are close to a linear positive correlation; the goodness of fit R2 = 0.7915. Its maximum difference in the change in permeability coefficient is a factor of 6.65.

3.1.4. Influence of Grading Characteristics on Permeability Coefficient

Through various combinations of the grading parameters, it was found that the product of the coefficient of uniformity and coefficient of curvature showed a linear positive correlation with the permeability coefficient, i.e., k∝Cu*Cc, and the goodness of fit R2 = 0.8464. The relationship between the permeability coefficient and the grading parameters is shown in Figure 10.

3.2. Gray Correlation Analysis of Factors Affecting Permeability Coefficient

The factors affecting the permeability coefficient are very complex. The interaction mechanism of various influencing factors is complex and unclear for improved loess materials, so it is difficult to determine a reasonable prediction model by analytical methods. Empirical formulas have certain limitations and cannot thoroughly consider various influencing factors. Therefore, this paper uses gray correlation analysis to determine the degree of influence of each factor on the permeability coefficient.
In the gray correlation analysis, the permeability coefficient of the improved loess obtained from the test is used as the reference sequence (i.e., parent factor sequence). Its corresponding Cc, d10, dry density, d50, d60, Cu, admixture type, and admixture content are used as the comparison sequence (i.e., sub-factor sequence). Figure 11 and Figure 12 display the correlation coefficients and degree of association according to the grain size characteristics, gradation characteristics, dry density, admixture type, and admixture content with the permeability coefficient of improved loess materials.
The gray degree of association between the permeability coefficient and the type of admixture is the largest, as seen in Figure 11. This suggests that the addition of admixture is the primary factor contributing to the decrease in the permeability of the improved loess material. Therefore, it can be considered as the optimal influencing factor for the permeability coefficient of the improved loess material under the given condition. The correlation between the admixture content and the permeability coefficient is the smallest, 0.774. In this paper, the admixture types are cement and lime, and the designed admixture contents are 5%, 9%, 12%, and 15% for cement, and 6%, 9%, and 12% for lime. This indicates that the addition of admixture in the improved loess material can reduce the permeability coefficient to a large extent. The content of the admixture should be controlled in the interval of 6–15%, beyond which it is not significant for the reduction in the permeability coefficient. The degree of association of Cc and the permeability coefficient is only 0.001 smaller than the type of admixture, which becomes the second-best influencing factor. Combined with the contents of Section 3.1.4 of this paper, reducing Cc*Cu can significantly reduce the permeability. The type of admixture and Cc have the most significant effect on the permeability coefficient of the improved loess material. This is mainly because reasonable grading characteristics can improve the compaction performance of the improved loess, and the pores are smaller under the same compaction work, and because of the cementing effect formed by the admixture in the pores, which further blocks the pore channels and blocks the seepage path, thus reducing the permeability coefficient.

3.3. SVM-Based Prediction Model of Improved Loess Permeability

From the above analysis, it can be seen that many factors affect the permeability of improved loess, and it is not easy to establish a predictive model in the form of a mathematical analysis because of a complex nonlinear mapping relationship between these influencing factors and the permeability coefficient. For this reason, this paper establishes a prediction model based on support vector machine (SVM) regression directly from the experimental data. It transforms the analysis of permeability coefficients influenced by multiple factors into the problem of regression model parameter identification.

3.3.1. Construction of the Model

Support vector machine regression SVR is an application of Support Vector Machines in the field of function regression, which is a further extension of using a support vector machine SVM (Support Vector Machine) to solve the regression fitting problem. First, by analyzing several soil parameters, the indicators which are more closely related to the predicted quantity (i.e., the permeability coefficient) are selected. In this paper, they are admixture type, Cc, d60, and dry density; then, the selected multiple indicators are used as the input of the SVR model, and the predicted quantity is used as the output of the SVR model. An SVR prediction model with a multivariate input and univariate output is established. The specific establishment process is as follows:
Suppose the number of training samples is l. Then, the set of training data is (xi, yi), xi = x1, x2, l}, where xi is the input vector of the ith training sample. x i = x i 1 , x i 2 , , x i N T represents the N training parameters of the ith training sample, and yi is the penetration coefficient of the ith training sample. Based on the mapping from the low-dimensional space to the high-dimensional feature space, the following linear regression function is considered [22]:
f(x) = (x) + b
where the following hold: w—high-dimensional feature space weight vector; Φ(x)—nonlinear mapping function; b—threshold value.
To represent the effectiveness of the regression, the ε linear insensitive loss function is introduced, as shown in the following equation:
L ( f ( x ) , y , ε ) = 0 y f ( x ) ε y f ( x ) ε y f ( x ) > ε
where the following hold: f(x)—the predicted value of the improved loess permeability coefficient returned by the regression function; y—the corresponding true value of the improved loess permeability coefficient.
If the difference between f(x) and y is less than or equal to ε, the loss value is equal to 0.
Next, the optimization problem is constructed and solved by selecting the appropriate kernel function k (x, x′) and the appropriate penalty parameter c:
max Q α = i = 1 l α i 1 2 i = 1 l j = 1 l α i α i y i y j K x i , x j s . t . i = 1 l α i y i = 0 , i = 1 , 2 , l 0 α i c
where c is the penalty factor. A larger value of c indicates a greater penalty for training errors exceeding ε. ε specifies the error requirement of the regression function, and a smaller ε means the smaller the error of the regression function. Figure 13 graphically depicts a typical SVR. A “spacing band” is created on both sides of the linear function, and the spacing of this “spacing band” is ε. The data points in the “spacing band” are penalized.
By introducing the Lagrange function and transforming it into its dual form, α and α* can be found. Assuming that the optimal solutions of α and α* are α = [ α 1 , α 2 , , α i ] , α * = [ α 1 * , α 2 * , , α i * ] , respectively, the weight vector and threshold can be further derived. Thus, the regression function is as in Equation (4).
f ( x ) = w Φ ( x ) + b = i = 1 ( α i α i * ) Φ ( x i ) Φ ( x ) + b = i = 1 i ( α i α i * ) K ( x i , x ) + b
where f(x) is the permeability coefficient of the improved loess, and x is the associated soil parameters input.

3.3.2. Selection of Parameters

The SVM regression algorithm can be implemented with a dedicated toolbox, and a large number of research results have shown [23,24,25] that Radial Basis Function (RBF) kernel functions have better applicability because, in most cases, SVR will be able to produce more accurate fitting results when using RBF kernel functions; therefore, in this paper, the RBF kernel function is used.
Before training the data, the best c and gamma parameters are found by the cross-validation method. c can be understood as the weight of preference of two indicators (interval size, classification accuracy) in regulating the optimization direction, i.e., error tolerance. The higher the c is, the more intolerant the error is, and the easier it is to overfit. The smaller the c is, the easier it is to underfit. The generalization ability becomes poor when c is too large or too small. gamma is a parameter that comes with the RBF function after choosing it as the kernel. It implicitly determines the distribution of the data after mapping to the new feature space. The larger the gamma is, the fewer support vectors there are; the smaller the gamma is, the more support vectors there are. The number of support vectors affects the speed of training and prediction. The best c = 1 and the best gamma = 8 for this training.

3.3.3. Model Prediction Results

In this study, the experimental results of samples PL1–PL32 were selected as training data, while the experimental results of samples PL33–PL36 were used as prediction data. The results of this fitting are shown in Table 3. This fitting effect is good. It can predict the permeability coefficient of the improved loess material with high accuracy. The results can provide a reference basis for the future permeability prediction.

3.3.4. Comparison of Permeability Prediction Models

Comparative prediction experiments were conducted using multiple linear regression, neural network regression, and SVM prediction models for the data sets in Table 1. The experimental results and error analysis are shown in Figure 14 and Figure 15. Table 4 presents the results and error analysis for predictions made using various models. The error characteristics of the three models were compared using the Taylor diagram by measuring the difference between each model and the points labeled as ‘observed’ (see Figure 15). A Taylor diagram can display the normalized standard deviation (SD), centered root mean square (RMS) error, and correlation coefficient of a model. The scatter points represent different models, the horizontal axis represents the standard deviation, the radial lines represent the correlation coefficient, and the dashed lines represent the RMS error.
It can be seen that the SVM predictions are closest to the ‘actual’ points, with higher correlation coefficients and lower RMSE values, indicating that the SVM has a better prediction capability. In the poorer-performing models, the multiple linear regression has a more significant standard deviation and a lower correlation coefficient, resulting in a larger root mean square error in the prediction. This shows that the SVM model has the highest prediction accuracy and is the closest to the measured values. Multiple linear regression and neural network regression predictions deviated from the measured values by a large margin.

4. Discussion

From the results of the tests in this paper, the methods of improving the loess can be generally divided into the following: the first is through the addition of other soils to improve their own grain size and gradation characteristics, and it will often be used in filled ground, landfill capping layers, and the upper layers of an artificial water body. The second method is achieved by means of additives such as cement and lime and is often used in situations where very low permeability coefficients are required. The third method combines both the first two methods by adding admixtures to the loess initially by improving the grain size and gradation characteristics. In this way, the requirements for impermeability can be met, and the requirements for green, low-carbon building materials can be better achieved at a cost saving.
In the absence of admixtures, the permeability coefficient of the loess material [26] decreases with permeation time in the presence of backfiltration protection, and the permeability coefficient is a power function of time. In the absence of backfiltration protection, the material undergoes a continuous seepage deterioration process of particle transport, the leaching of binder, and particle re-transport under the effect of long-term infiltration. The deterioration process leads to a slow decay of the permeability coefficient due to the loss of calcium carbonate and other binders in the later stages of infiltration, which may result in a continuous loss of intergranular cohesion and a continuous separation of small particles from larger ones, further causing slow particle transport and the blocking of the pores.
The effect of age on the improved loess material was insignificant when lime was the admixture. In the tests of Zhu Min [27], the permeability coefficients of the three ratios of lime/loess at different ages did not generally vary significantly, fluctuating by less than two at the same order of magnitude. Except for the 3:7 lime/loess ratio, which decreases nearly linearly with age, the trend in the remaining two ratios of lime/loess is not apparent. When the cement was the admixture, the effect of age was relatively significant, with the coefficient of permeability decreasing at a greater rate up to the age of 14 d and then at a slower rate after that. When improved loess materials are used as impermeable layers in landfills and artificial water-impermeable layers, the part of the permeability coefficient that is reduced by the deterioration mechanism or by the increase in the age of curing is usually used as a safety reserve in order to prevent leakage and further engineering accidents. Therefore, this paper does not consider the effect of age in the test design, and the permeability test is carried out after the sample has been prepared for one day of curing. Further experimental research is therefore required to rationalize the effect of age and to reflect it in the prediction model.

5. Conclusions

(1)
Without considering the effects of admixtures, grain size, and grading characteristics, the coefficient of permeability of the improved loess tends to decrease with increasing dry density, and there is an obvious turning point in the relationship curve.
(2)
Under the same grain size, grading characteristics, and dry density, the permeability coefficient of the improved loess decreases with the increase in admixture (cement and lime) content, and the cement admixture has a more significant effect on the permeability coefficient of specimens with a larger grain size and smaller Cu.
(3)
The improved loess’s grain size and grading parameters influence the permeability coefficient. There exists a positive linear correlation between the permeability coefficient and three parameters, namely the average grain size, restricted grain size, and the product of the coefficient of curvature and coefficient of uniformity (Cu*Cc).
(4)
Gray correlation analysis was conducted on the permeability coefficient of improved loess material and its influencing factors, and it was concluded that the optimal influencing factor of the permeability coefficient was the type of admixture, and Cc and d60 were the secondary influencing factors. According to the importance of the influencing factors, a support vector machine-based prediction model for the permeability of improved loess materials was proposed. The actual prediction results show that the SVM model prediction results are significantly better than the linear regression and the neural network prediction models, and the prediction errors are more diminutive.

Author Contributions

Conceptualization, D.C.; Writing—original draft, G.R.; Writing—review & editing, A.H. and D.C.; Supervision, Y.Z.; Project administration, X.Y. All authors have read and agreed to the published version of the manuscript.

Funding

This work was supported National Natural Science Foundation of China (Project No. 52368049), Gansu Province Science and Technology Major Project (Project No. 23ZDFA007), Lanzhou Youth Science and Technology Talent Innovation Project (Project No. 2023-QN-27) and National Natural Science Foundation of China (No. 51978321).

Data Availability Statement

The original contributions presented in the study are included in the article, further inquiries can be directed to the corresponding author.

Conflicts of Interest

The authors declare no conflicts of interest.

References

  1. Shan, B.; Wang, C.; Dong, Q.; Tang, L.; Zhang, G.; Wei, J. Experimental study on improving collapsible loess with cement. Glob. Geol. (Engl. Version) 2010, 13, 79–84. [Google Scholar] [CrossRef]
  2. Gao, Y.; Qian, H.; Yang, J.; Feng, J.; Huo, C. Indoor experimental study on permeability characteristics of remolded Malan Loess. South-to-North Water Transf. Water Sci. Technol. 2016, 14, 130–136. [Google Scholar] [CrossRef]
  3. Li, Z.Q.; Cui, Z.D.; Wang, Y.P.; Wang, L.C.; Zhong, D. Experimental Study on the Engineering Characteristics of Improved Soil. Adv. Mater. Res. 2011, 168, 1426–1431. [Google Scholar] [CrossRef]
  4. Xu, P.; Zhang, Q.; Qian, H.; Li, M.; Yang, F. An investigation into the relationship between saturated permeability and microstr-ucture of remolded loess: A case study from Chinese Loess Plateau. Geoderma 2021, 382, 114774. [Google Scholar] [CrossRef]
  5. Li, P.; Pan, Z.; Xiao, T.; Wang, J. Effects of molding water content and compaction degree on the microstructure and permeability of compacted loess. Acta Geotech. 2023, 18, 921–936. [Google Scholar] [CrossRef]
  6. Li, X.; Liu, J.; Guo, Z.; Zhang, K.; Meng, J. Study on relationship between pore structure parameters and permeability of Malan Loess. J. Eng. Geol. 2018, 26, 1415–1423. [Google Scholar] [CrossRef]
  7. Zhao, Z.; Wang, T.; Jin, X.; Zhang, L.; Zhu, X.; Ruan, J. A new model of temperature-dependent permeability coefficient and simulating of pipe leakage produced immersion of loess foundation. Bull. Eng. Geol. Environ. 2023, 82, 23. [Google Scholar] [CrossRef]
  8. Li, P.; Vanapalli, S.; Li, T. Review of collapse triggering mechanism of collapsible soils due to wetting. J. Rock Mech. Geotech. Eng. 2016, 8, 256–274. [Google Scholar] [CrossRef]
  9. Krishnan, J.; Shukla, S. Review of chemical stabilizing agents for improving the physical and mechanical properties of loess. Bull. Eng. Geol. Environ. 2019, 78, 3995–4017. [Google Scholar] [CrossRef]
  10. Yuan, Y.; Jiang, L.; Cai, J.; Fan, J.; Deng, C.; Xue, J. Influencing Factors and Prediction Model for the Antierosion Performance of Cement-Improved Loess Compacted Using Different Compaction Methods. Adv. Mater. Sci. Eng. 2021, 2021, 1788526. [Google Scholar] [CrossRef]
  11. Wang, H.; Yue, Z.; Ye, C. Experimental Investigation of Permeability Characteristics of Intact and Reshaped Loess. J. Shijiazhuang Tiedao Univ. (Nat. Sci. Ed.) 2009, 22, 20–22. [Google Scholar] [CrossRef]
  12. Wang, T.; Lu, J.; Zhang, J. Experimental Study on Permeability Coefficient of Artificially Compacted Unsaturated Loess Considering Influence of Density. Chin. J. Rock Mech. Eng. 2006, 25, 2364–2368. [Google Scholar]
  13. Yan, G.; Zhang, H.; Li, H. Research on Permeability Experiment of Modified Loess. Coal Ash 2013, 6, 1–5. [Google Scholar]
  14. Zhao, Q.; Su, L.; Liu, H.; He, J.; Yang, J. Experimental study on influence of particle size composition on permeability coefficient anisotropy of loess. J. Cent. South Univ. (Sci. Technol.) 2020, 51, 1615–1626. [Google Scholar]
  15. Olson, R.E. Effective stress theory of soil compaction. J. Soil Mech. Found. Div. 1963, 89, 27–45. [Google Scholar] [CrossRef]
  16. Garcia-Bengochea, I.; Altschaeffl, A.G.; Lovell, C.W. Pore distribution and permeability of silty clays. J. Geotech. Eng. Div. 1979, 105, 839–856. [Google Scholar] [CrossRef]
  17. Mashmood, A.; Tang, X.-W.; Qiu, J.-N.; Gu, W.-J.; Feezan, A. A hybrid approach for evaluating CPT-based seismic soil liquefaction potential using Bayesian belief networks. J. Cent. South Univ. 2020, 27, 500–516. [Google Scholar] [CrossRef]
  18. Mashmood, A.; Tang, X.-W.; Qiu, J.-N.; Feezan, A. Evaluating seismic soil liquefaction potential using Bayesian belief network and C4.5 decision tree approaches. Appl. Sci. 2019, 9, 4226. [Google Scholar] [CrossRef]
  19. Wrzesiński, G.; Markiewicz, A. Prediction of permeability coefficient k in sandy soils using ANN. Sustainability 2022, 14, 6736. [Google Scholar] [CrossRef]
  20. Ahmad, M.; Keawsawasvong, S.; Ibrahim, M.R.B.; Waseem, M.; Kashyzadeh, K.R.; Sabri, M.M.S. Novel approach to predicting soil permeability coefficient using Gaussian process regression. Sustainability 2022, 14, 8781. [Google Scholar] [CrossRef]
  21. GB/T 50123-2019; Standard for Soil Test Methods. China Planning Press: Beijing, China, 2019.
  22. Suykens, J.A.K.; Van Gestel, T.; Brabanter, J.; De Moor, B.; Vandewalle, J. Least Squares Support Vector Machines; World Scientific: Singapore, 2002. [Google Scholar]
  23. Sun, J.; Zhang, J.; Gu, Y.; Huang, Y.; Sun, Y.; Ma, G. Prediction of permeability and unconfined compressive strength of pervious concrete using evolved support vector regression. Constr. Build. Mater. 2019, 207, 440–449. [Google Scholar] [CrossRef]
  24. Ma, G.; Chao, Z.; He, K. Predictive Models for Permeability of Cracked Rock Masses Based on Support Vector Machine Techniques. Geotech. Geol. Eng. 2021, 39, 1023–1031. [Google Scholar] [CrossRef]
  25. Moosavi, N.; Bagheri, M.; Nabi-Bidhendi, M.; Heidari, R. Fuzzy support vector regression for permeability estimation of petroleum reservoir using well logs. Acta Geophys. 2022, 70, 161–172. [Google Scholar] [CrossRef]
  26. Zhu, M. Research on Physical Mechanics Properties and Road Usage of Improved Loess. Ph.D. Dissertation, Chang’an University, Xi’an, China, 2021. [Google Scholar] [CrossRef]
  27. Zhu, M.; Ni, W.; Yuan, K.; Li, L.; Li, X.; Wang, H. Improvement and optimization of permeability and strength properties of loess. Coal Geol. Explor. 2020, 48, 195–200. [Google Scholar]
Figure 1. Test apparatus for soil’s properties.
Applsci 14 08072 g001
Figure 2. Grain-size analysis curve.
Applsci 14 08072 g002
Figure 3. Preparation process and falling head permeability test apparatus.
Applsci 14 08072 g003
Figure 4. Relationship between cement content and permeability coefficient.
Applsci 14 08072 g004
Figure 5. Relationship between lime content and permeability coefficient.
Applsci 14 08072 g005
Figure 6. Effect of dry density on permeability coefficient without admixture.
Applsci 14 08072 g006
Figure 7. Effect of dry density on permeability coefficient.
Applsci 14 08072 g007
Figure 8. d50 and permeability coefficient relationship curve.
Applsci 14 08072 g008
Figure 9. d60 and permeability coefficient relationship curve.
Applsci 14 08072 g009
Figure 10. Cu × Cc versus permeability coefficient curve.
Applsci 14 08072 g010
Figure 11. Correlation coefficient of each specimen.
Applsci 14 08072 g011
Figure 12. Degree of association of each influence factor.
Applsci 14 08072 g012
Figure 13. Illustration of estimated function f(x) using SVR.
Applsci 14 08072 g013
Figure 14. Comparison of predicted and measured values.
Applsci 14 08072 g014
Figure 15. Taylor diagrams of different models for permeability coefficient.
Applsci 14 08072 g015
Table 1. Basic physical properties.
NameNatural
Density
(g/cm3)
Dry
Density
(g/cm3)
Maximum Dry
Density
(g/cm3)
Natural
Water
Content (%)
Optimum
Moisture
Content (%)
Specific Weight (Gs)Liquid
Limit (%)
Plastic
Limit (%)
Plasticity
Index
Void
Ratio
Loess-like silt1.491.361.809.711.72.7526.118.97.20.995
Malan loess1.521.421.886.913.22.7326.519.17.40.901
Lishi loess1.801.611.8011.914.02.4628.019.88.20.676
Argillaceo-us
sandstone
2.091.94/7.8/////0.364
Table 2. Test scheme and results.
Sample NameContent of Admixture
(%)
Type of Admixtured10
(mm)
d50
(mm)
d60
(mm)
CuCcDry Density
(g/cm3)
Permeability Coefficient
(cm/s)
PL10None0.0828 0.32 0.46 5.58 0.671.75 2.65 × 10⁻⁶
PL20None0.0807 0.30 0.43 5.31 0.71 1.86 7.97 × 10⁻⁷
PL30None0.0828 0.26 0.37 4.41 0.70 1.80 2.74 × 10⁻⁶
PL40None0.0828 0.24 0.33 4.03 0.73 1.71 2.00 × 10⁻⁶
PL50None0.0828 0.23 0.30 3.68 0.72 1.99 2.29 × 10⁻⁷
PL60None0.0828 0.21 0.28 3.35 0.75 1.76 6.44 × 10⁻⁸
PL70None0.0987 0.44 0.62 6.33 0.80 1.85 6.16 × 10⁻⁸
PL80None0.1037 0.49 0.69 6.64 0.91 1.88 1.07 × 10⁻⁵
PL90None0.1032 0.44 0.61 5.89 0.89 1.85 4.72 × 10⁻⁷
PL100None0.0828 0.36 0.54 6.57 0.66 1.84 1.09 × 10⁻⁷
PL110None0.0828 0.36 0.54 6.57 0.66 1.61 4.86 × 10⁻⁷
PL120None0.0848 0.42 0.65 7.68 0.65 1.90 4.67 × 10⁻⁷
PL130None0.0848 0.42 0.65 7.68 0.65 1.82 4.85 × 10⁻⁷
PL140None0.0848 0.49 0.78 9.20 0.65 1.90 1.04 × 10⁻⁷
PL150None0.0848 0.49 0.78 9.20 0.65 1.82 7.12 × 10⁻⁷
PL160None0.0848 0.49 0.78 9.20 0.65 1.77 5.12 × 10⁻⁶
PL170None0.0848 0.49 0.78 9.20 0.65 1.69 9.12 × 10⁻⁶
PL189Cement0.091 0.50 0.76 8.30 0.65 1.62 2.14 × 10⁻⁶
PL1912Cement0.091 0.50 0.76 8.30 0.65 1.62 7.09 × 10⁻⁷
PL2015Cement0.091 0.50 0.76 8.30 0.65 1.63 2.78 × 10⁻⁷
PL219Cement0.091 0.42 0.64 7.03 0.64 1.64 2.02 × 10⁻⁷
PL2212Cement0.091 0.42 0.64 7.03 0.64 1.62 3.85 × 10⁻⁶
PL2315Cement0.091 0.42 0.64 7.03 0.64 1.65 1.78 × 10⁻⁷
PL246Lime0.085 0.49 0.78 9.20 0.65 1.78 8.07 × 10⁻⁷
PL259Lime0.085 0.49 0.78 9.20 0.65 1.81 6.93 × 10⁻⁷
PL2612Lime0.085 0.49 0.78 9.20 0.65 1.81 6.23 × 10⁻⁷
PL275Cement0.085 0.49 0.78 9.20 0.65 1.81 3.59 × 10⁻⁷
PL289Cement0.085 0.49 0.78 9.20 0.65 1.80 2.58 × 10⁻⁷
PL299Cement0.085 0.49 0.78 9.20 0.65 1.48 6.29 × 10⁻⁸
PL3012Cement0.085 0.49 0.78 9.20 0.65 1.62 7.09 × 10⁻⁷
PL3115Cement0.085 0.49 0.78 9.20 0.65 1.63 5.23 × 10⁻⁶
PL325Cement0.083 0.36 0.54 6.57 0.65 1.81 3.72 × 10⁻⁷
PL335Cement0.085 0.42 0.65 7.68 0.65 1.82 3.64 × 10⁻⁷
PL3415Cement0.085 0.49 0.78 9.20 0.65 1.65 8.47 × 10⁻⁷
PL3515Cement0.085 0.49 0.78 9.20 0.65 1.74 5.00 × 10⁻⁷
PL3615Cement0.085 0.49 0.78 9.20 0.65 1.80 7.60 × 10⁻⁸
Table 3. SVM model predicted and measured values.
Sample NameMeasured ValuesPredicted Values
PL333.64 × 10−74.16 × 10⁻⁷
PL348.47 × 10−78.09 × 10⁻⁷
PL355.00 × 10−75.73 × 10⁻⁷
PL367.60 × 10−79.19 × 10⁻⁷
Table 4. Comparison of error in calculation results of different models.
Prediction ModelsSVM RegressionMultiple Linear RegressionNeural Network Regression
RMSE1.30 × 10−72.11 × 10−61.07 × 10−6
R20.4940.8980.982
Disclaimer/Publisher’s Note: The statements, opinions and data contained in all publications are solely those of the individual author(s) and contributor(s) and not of MDPI and/or the editor(s). MDPI and/or the editor(s) disclaim responsibility for any injury to people or property resulting from any ideas, methods, instructions or products referred to in the content.

