
Sensory Perception Systems and Machine Learning Methods for Pesticide Detection in Fruits

 ,
, 

Abstract
:1. Introduction
2. Materials and Methods
2.1. Selection and Collection of Fruit and Pesticide Samples
2.2. Sample Preparation
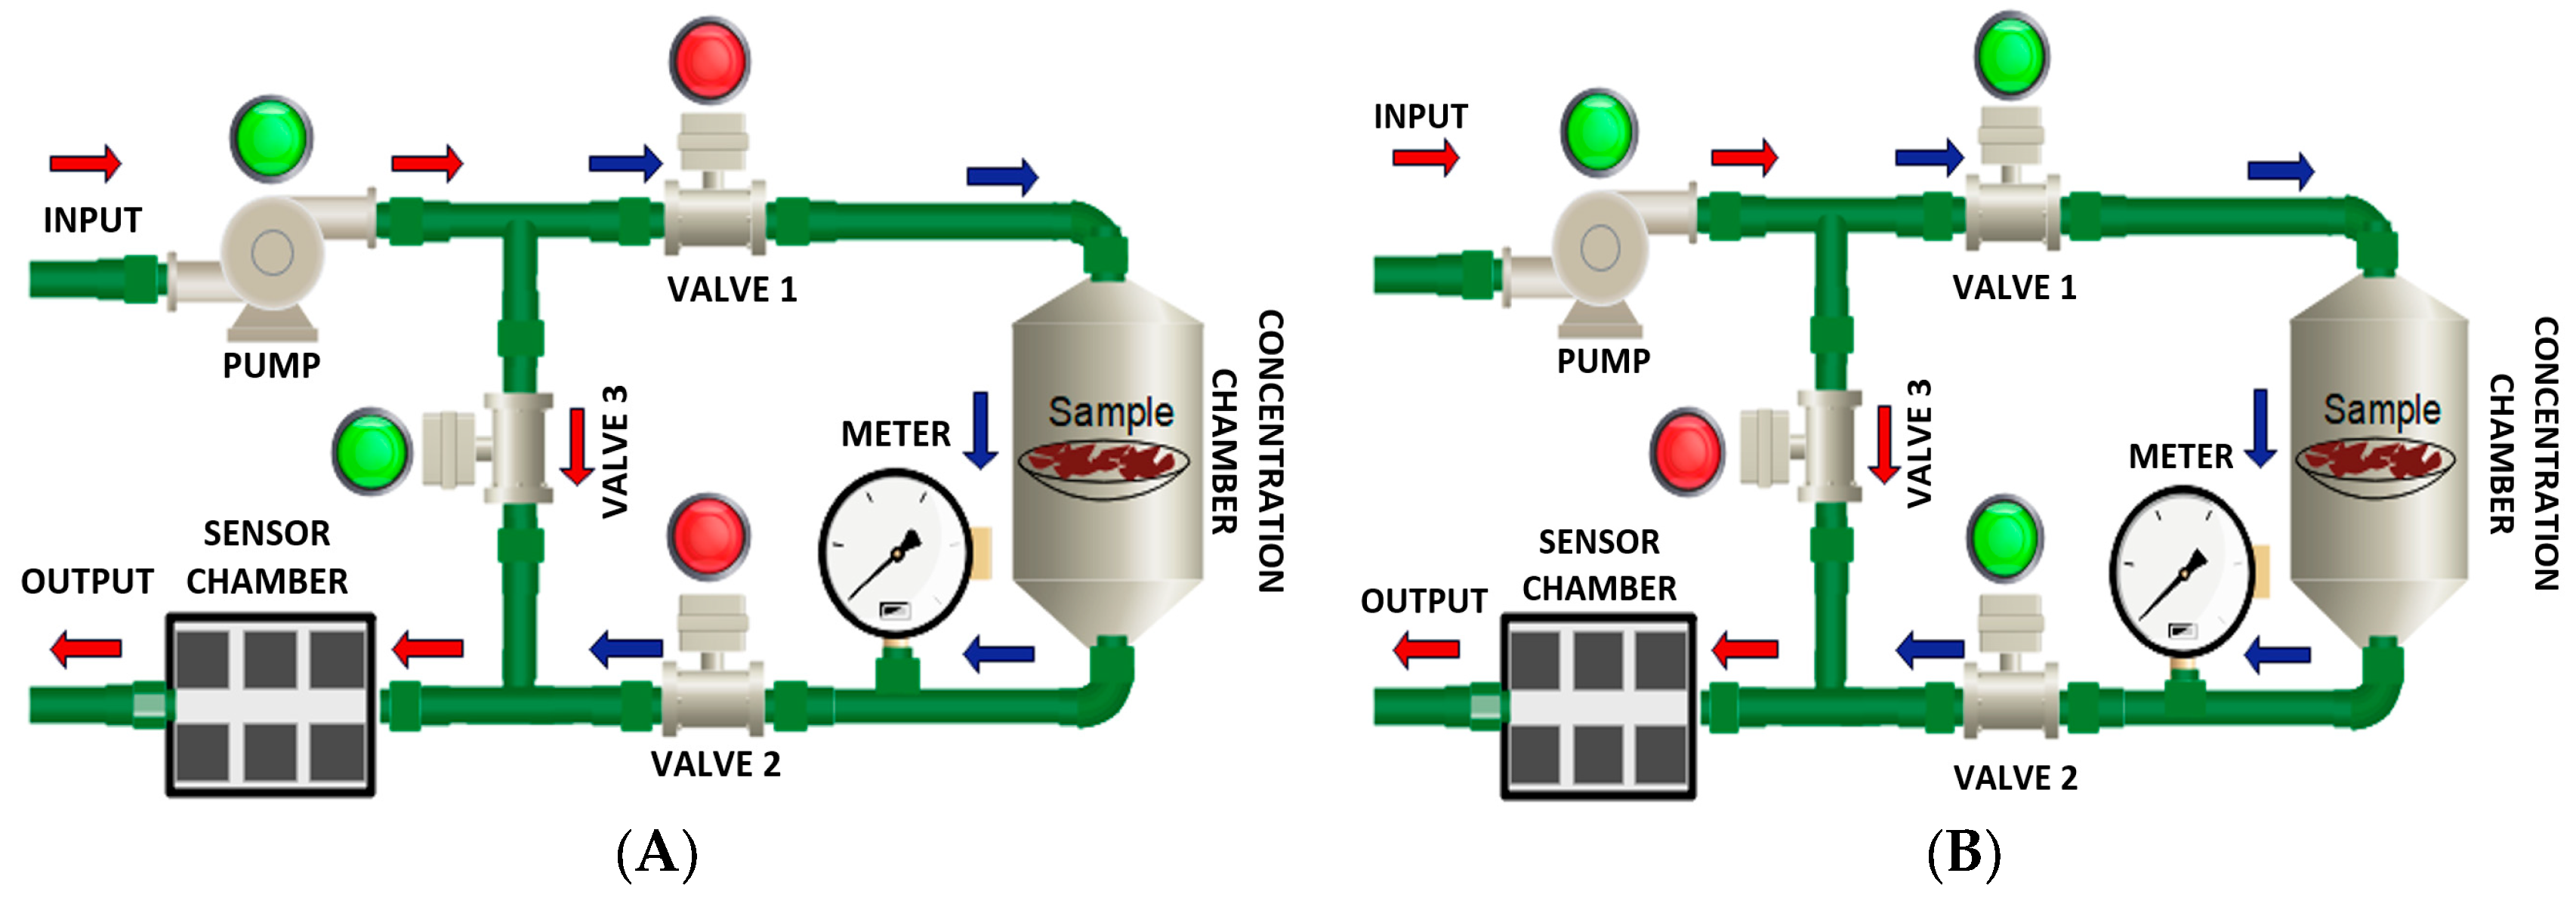
2.3. E-Nose
2.4. E-Tongue
2.5. Data Processing
- Principal Component Analysis (PCA): A supervised and unsupervised learning method in which observations or data are reordered by decreasing the correlation of all data and choosing new orthogonal axes for each component [60].
- Linear Discriminant Analysis (LDA): A supervised multivariate method developed to obtain good class separability. It is based on the calculation of maximization of the factors concerning the homogeneity in the covariance matrix of each group, and it is decided whether it fits the linear model or the quadratic model [61].
- Naïve Bayes: A probabilistic learning algorithm that bases its mathematical operation on the Bayes theorem. The algorithm calculates the probability of an event “A” given the occurrence of an event B, for it is necessary to have a group of established data, thus making the naïve Bayes method a supervised method [62].
- Support Vector Machines (SVMs): A support vector machine establishes its operation by finding a hyperplane with the best possible separation between a dataset. To do so, it takes the closest data of each class of data and establishes margins; the above serves as a reference point to define said hyperplane and determine the support vector that shows the distance between the margins [63].
- K-Nearest Neighbor (K-NN): This is a regression method based on assumptions of similarity or low dispersion between data. It is also used as a classifier learning method; for this, each group of measurements regarding a number K of nearby data must be compared with its category, which can classify them according to their similarity [64].
- Decision Trees: This method operates on hierarchical classification. Its structure consists of two elements: nodes and branches. In the nodes, each possible result is assessed and weighted against the input values assigned to the group [65].
3. Results
3.1. Data Analysis with Different Pesticides in Fruits
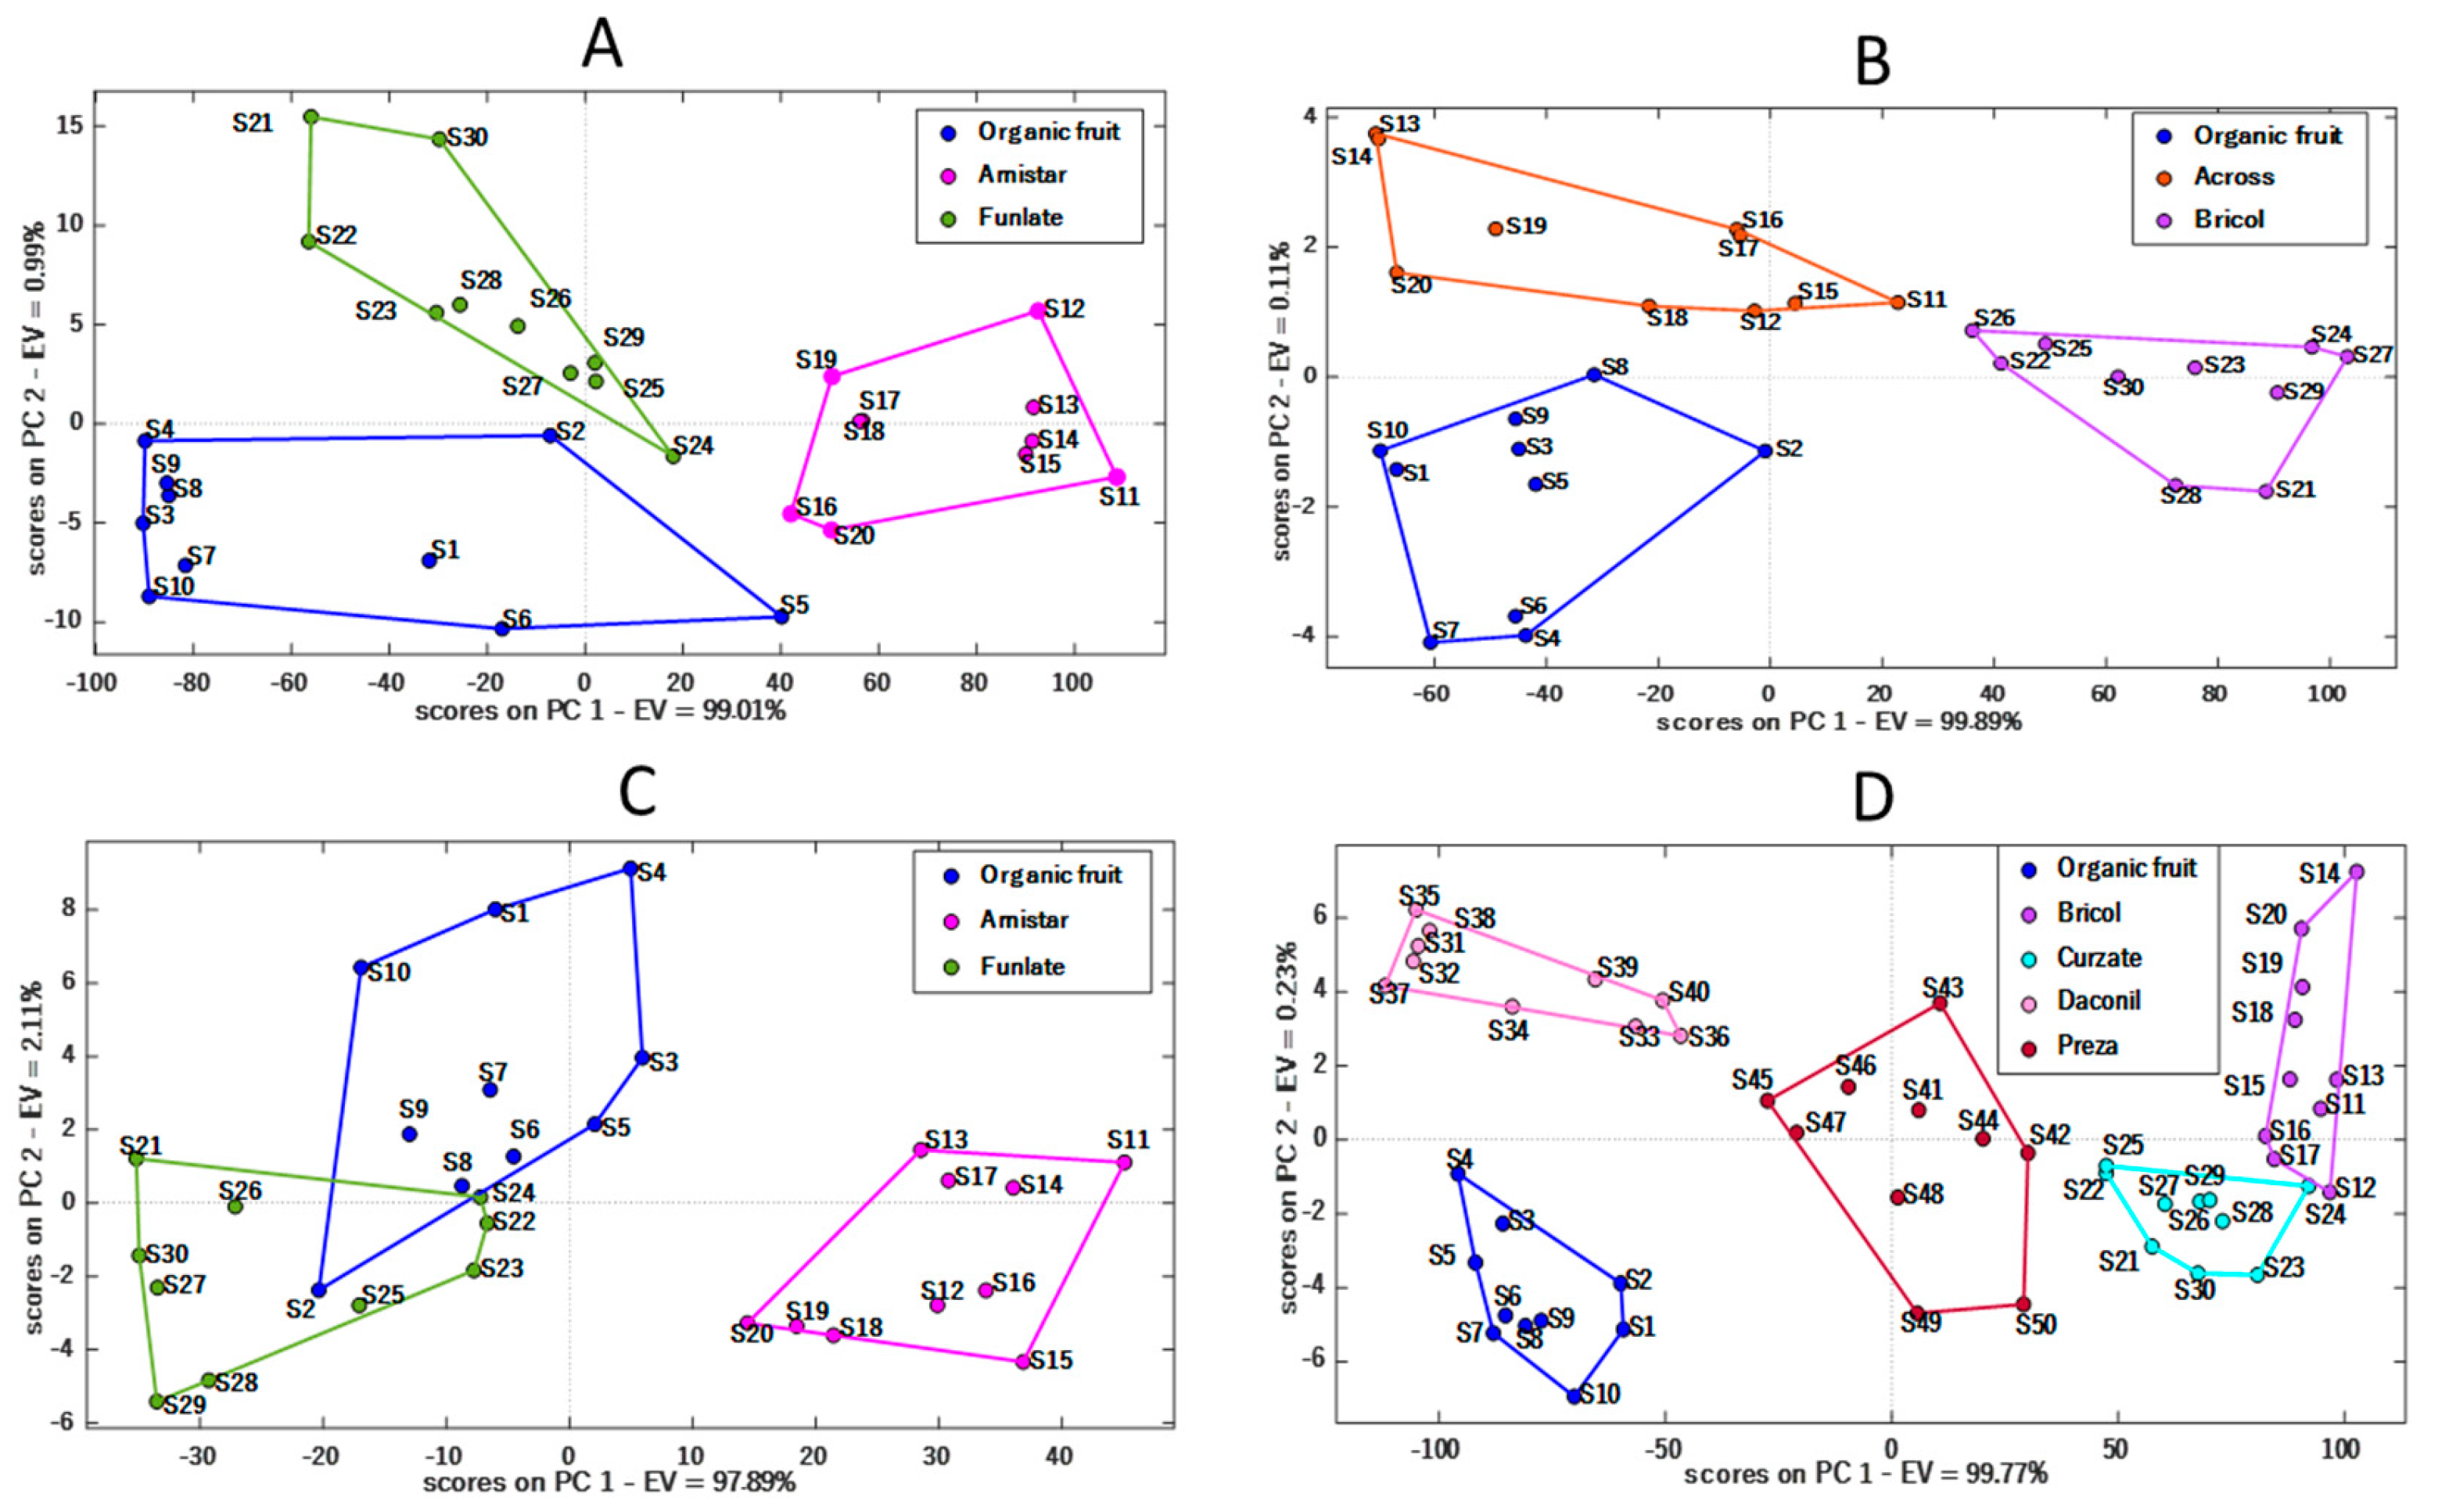
3.1.1. E-Nose
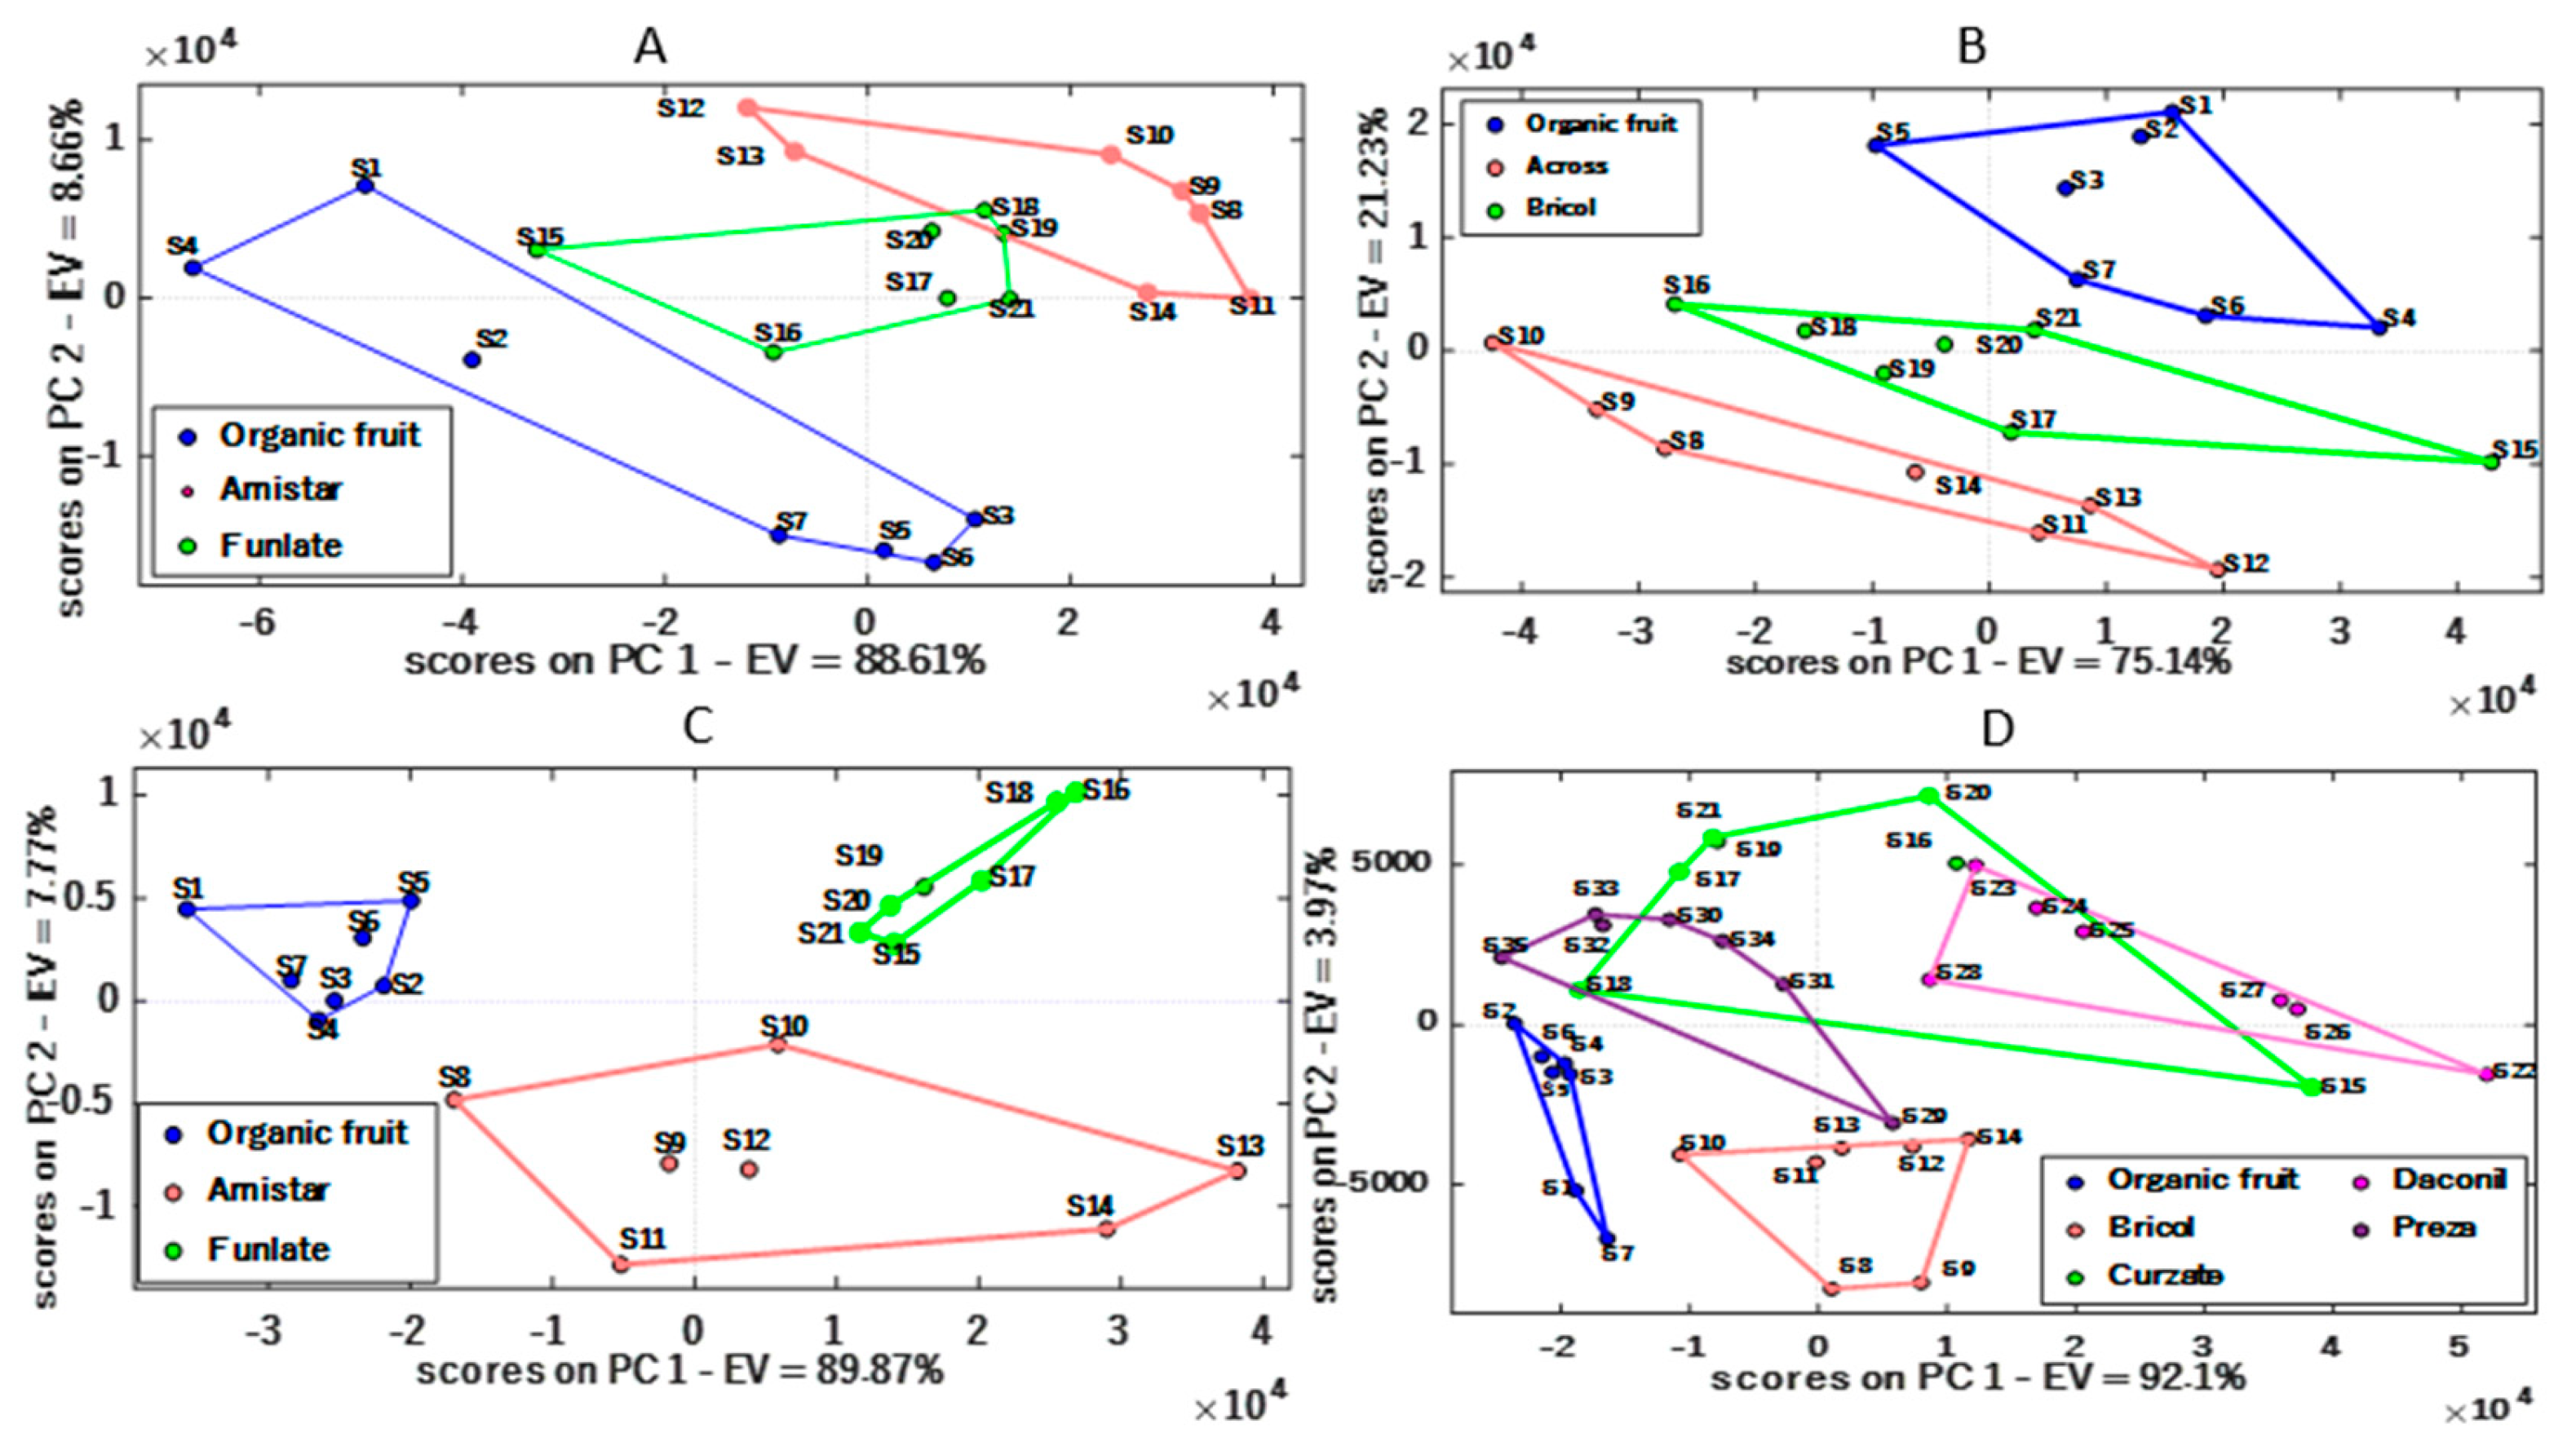
3.1.2. E-Tongue
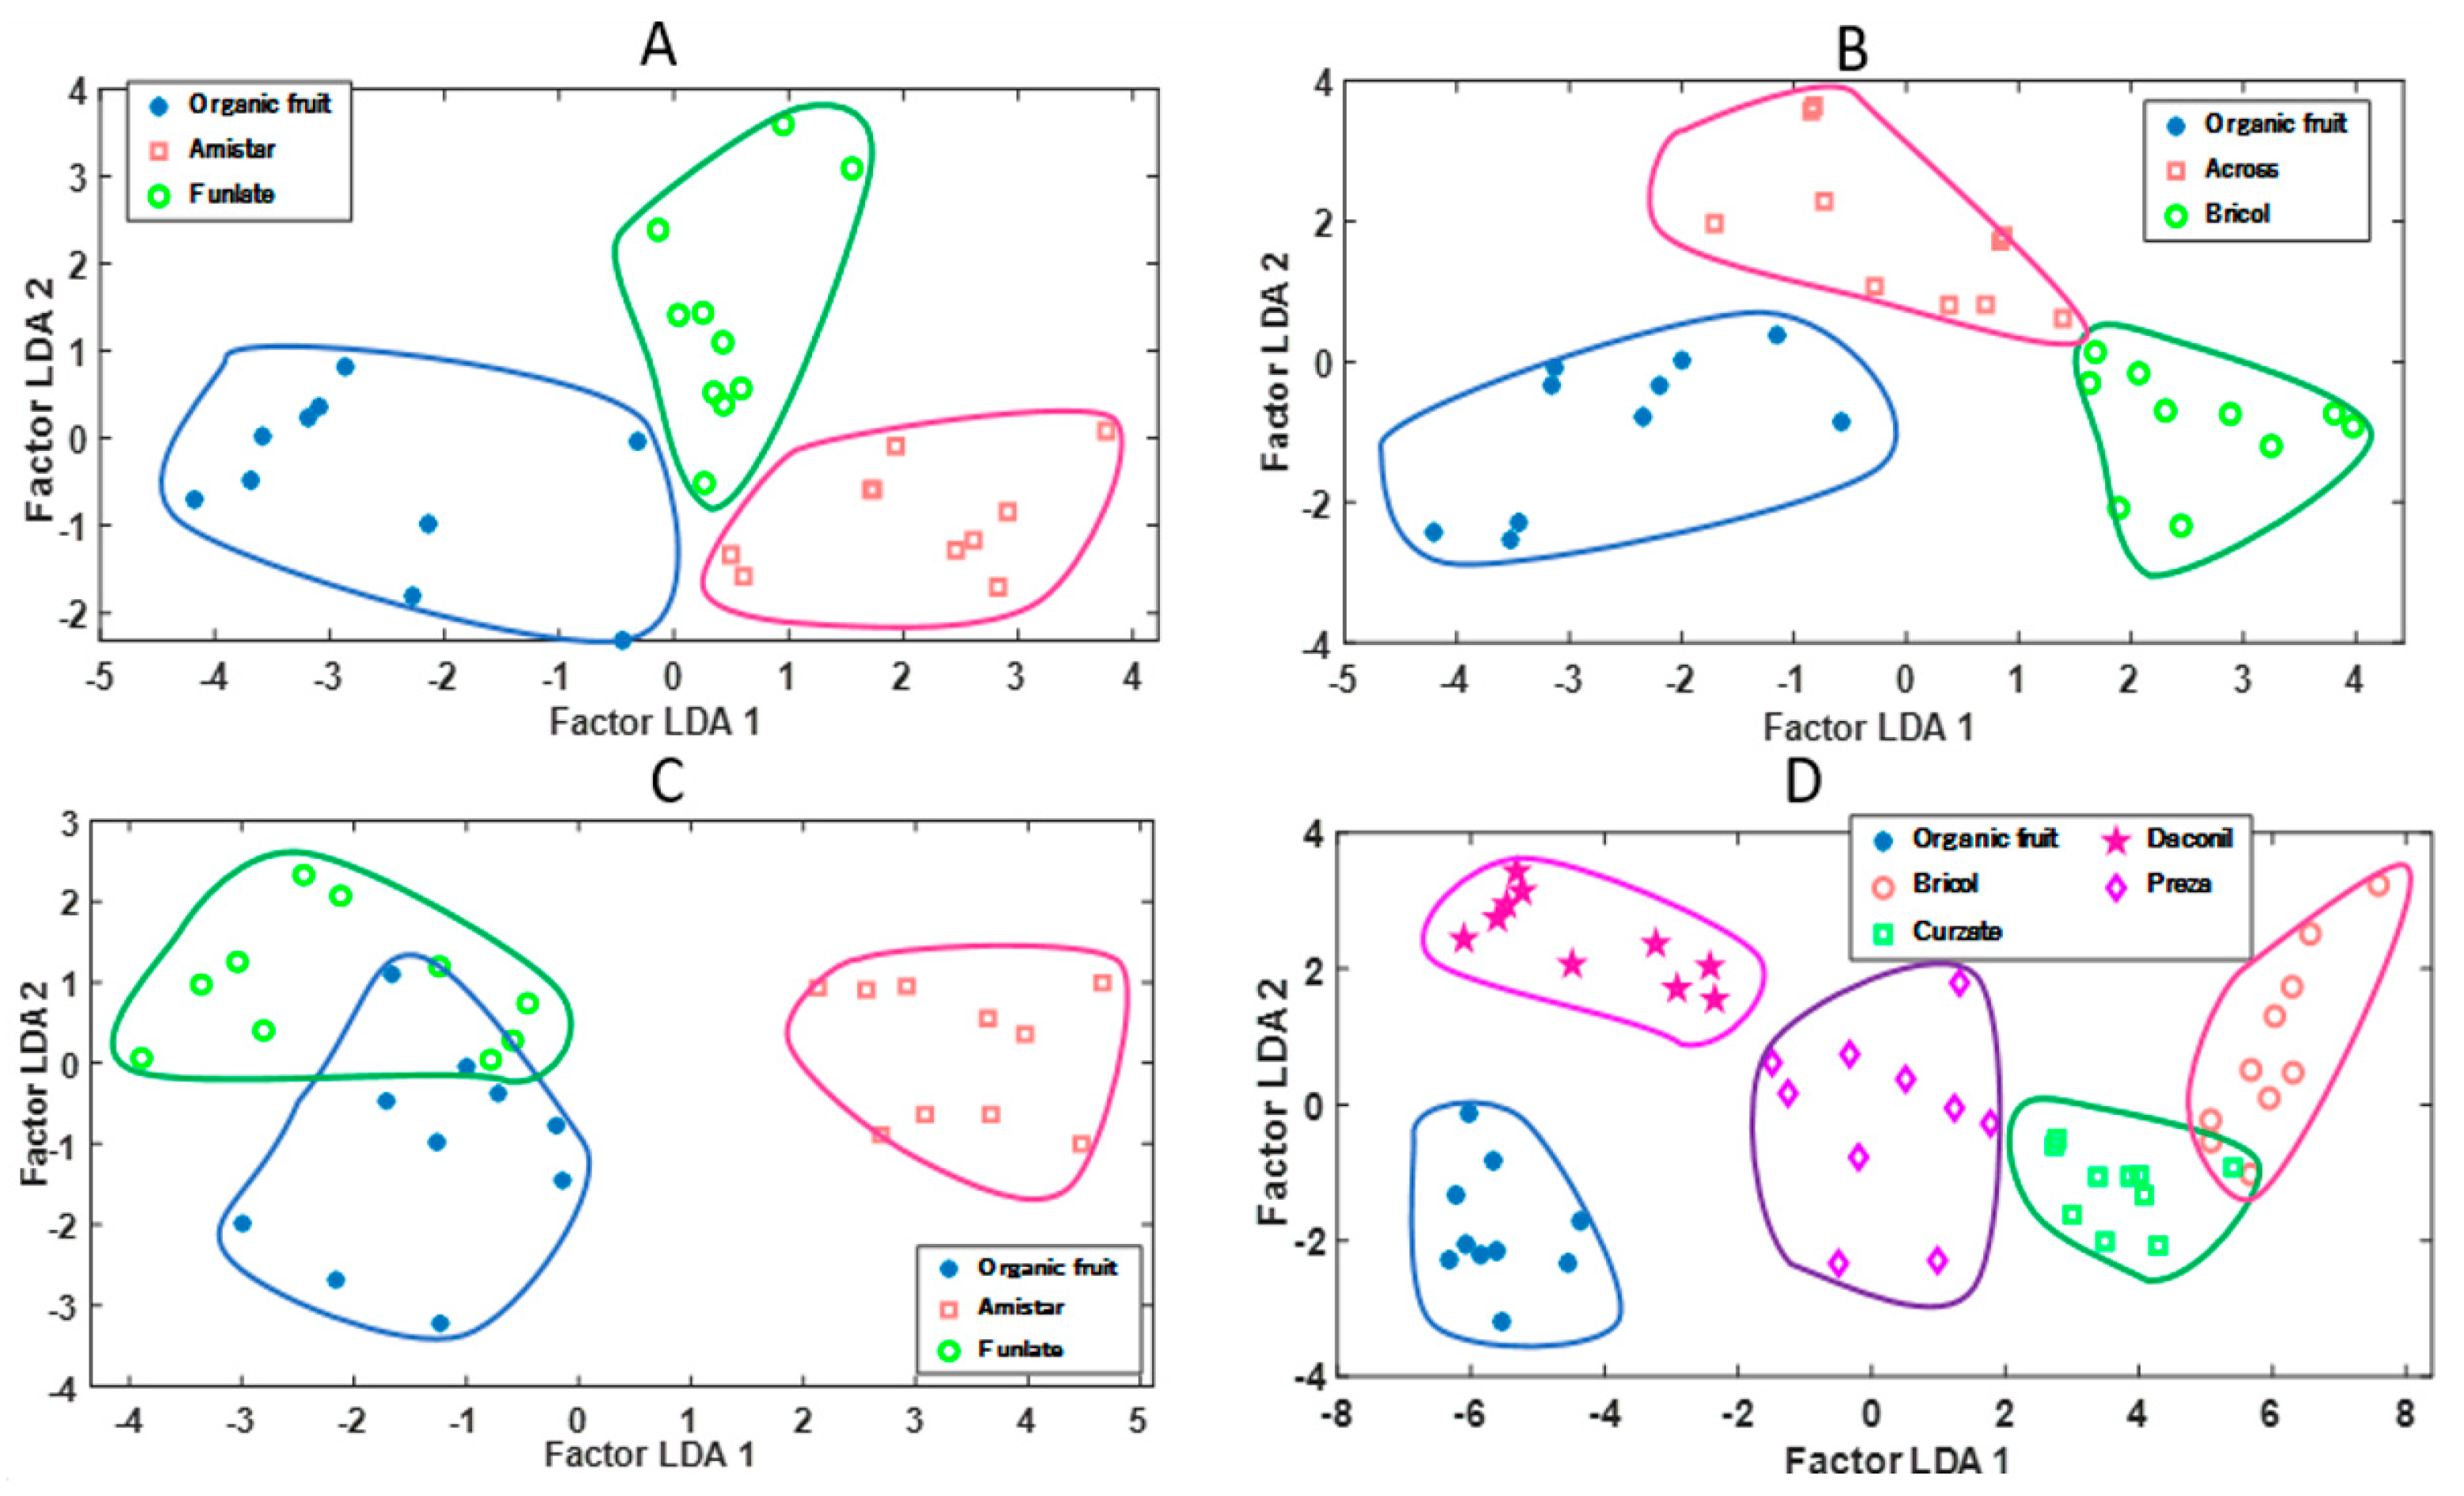
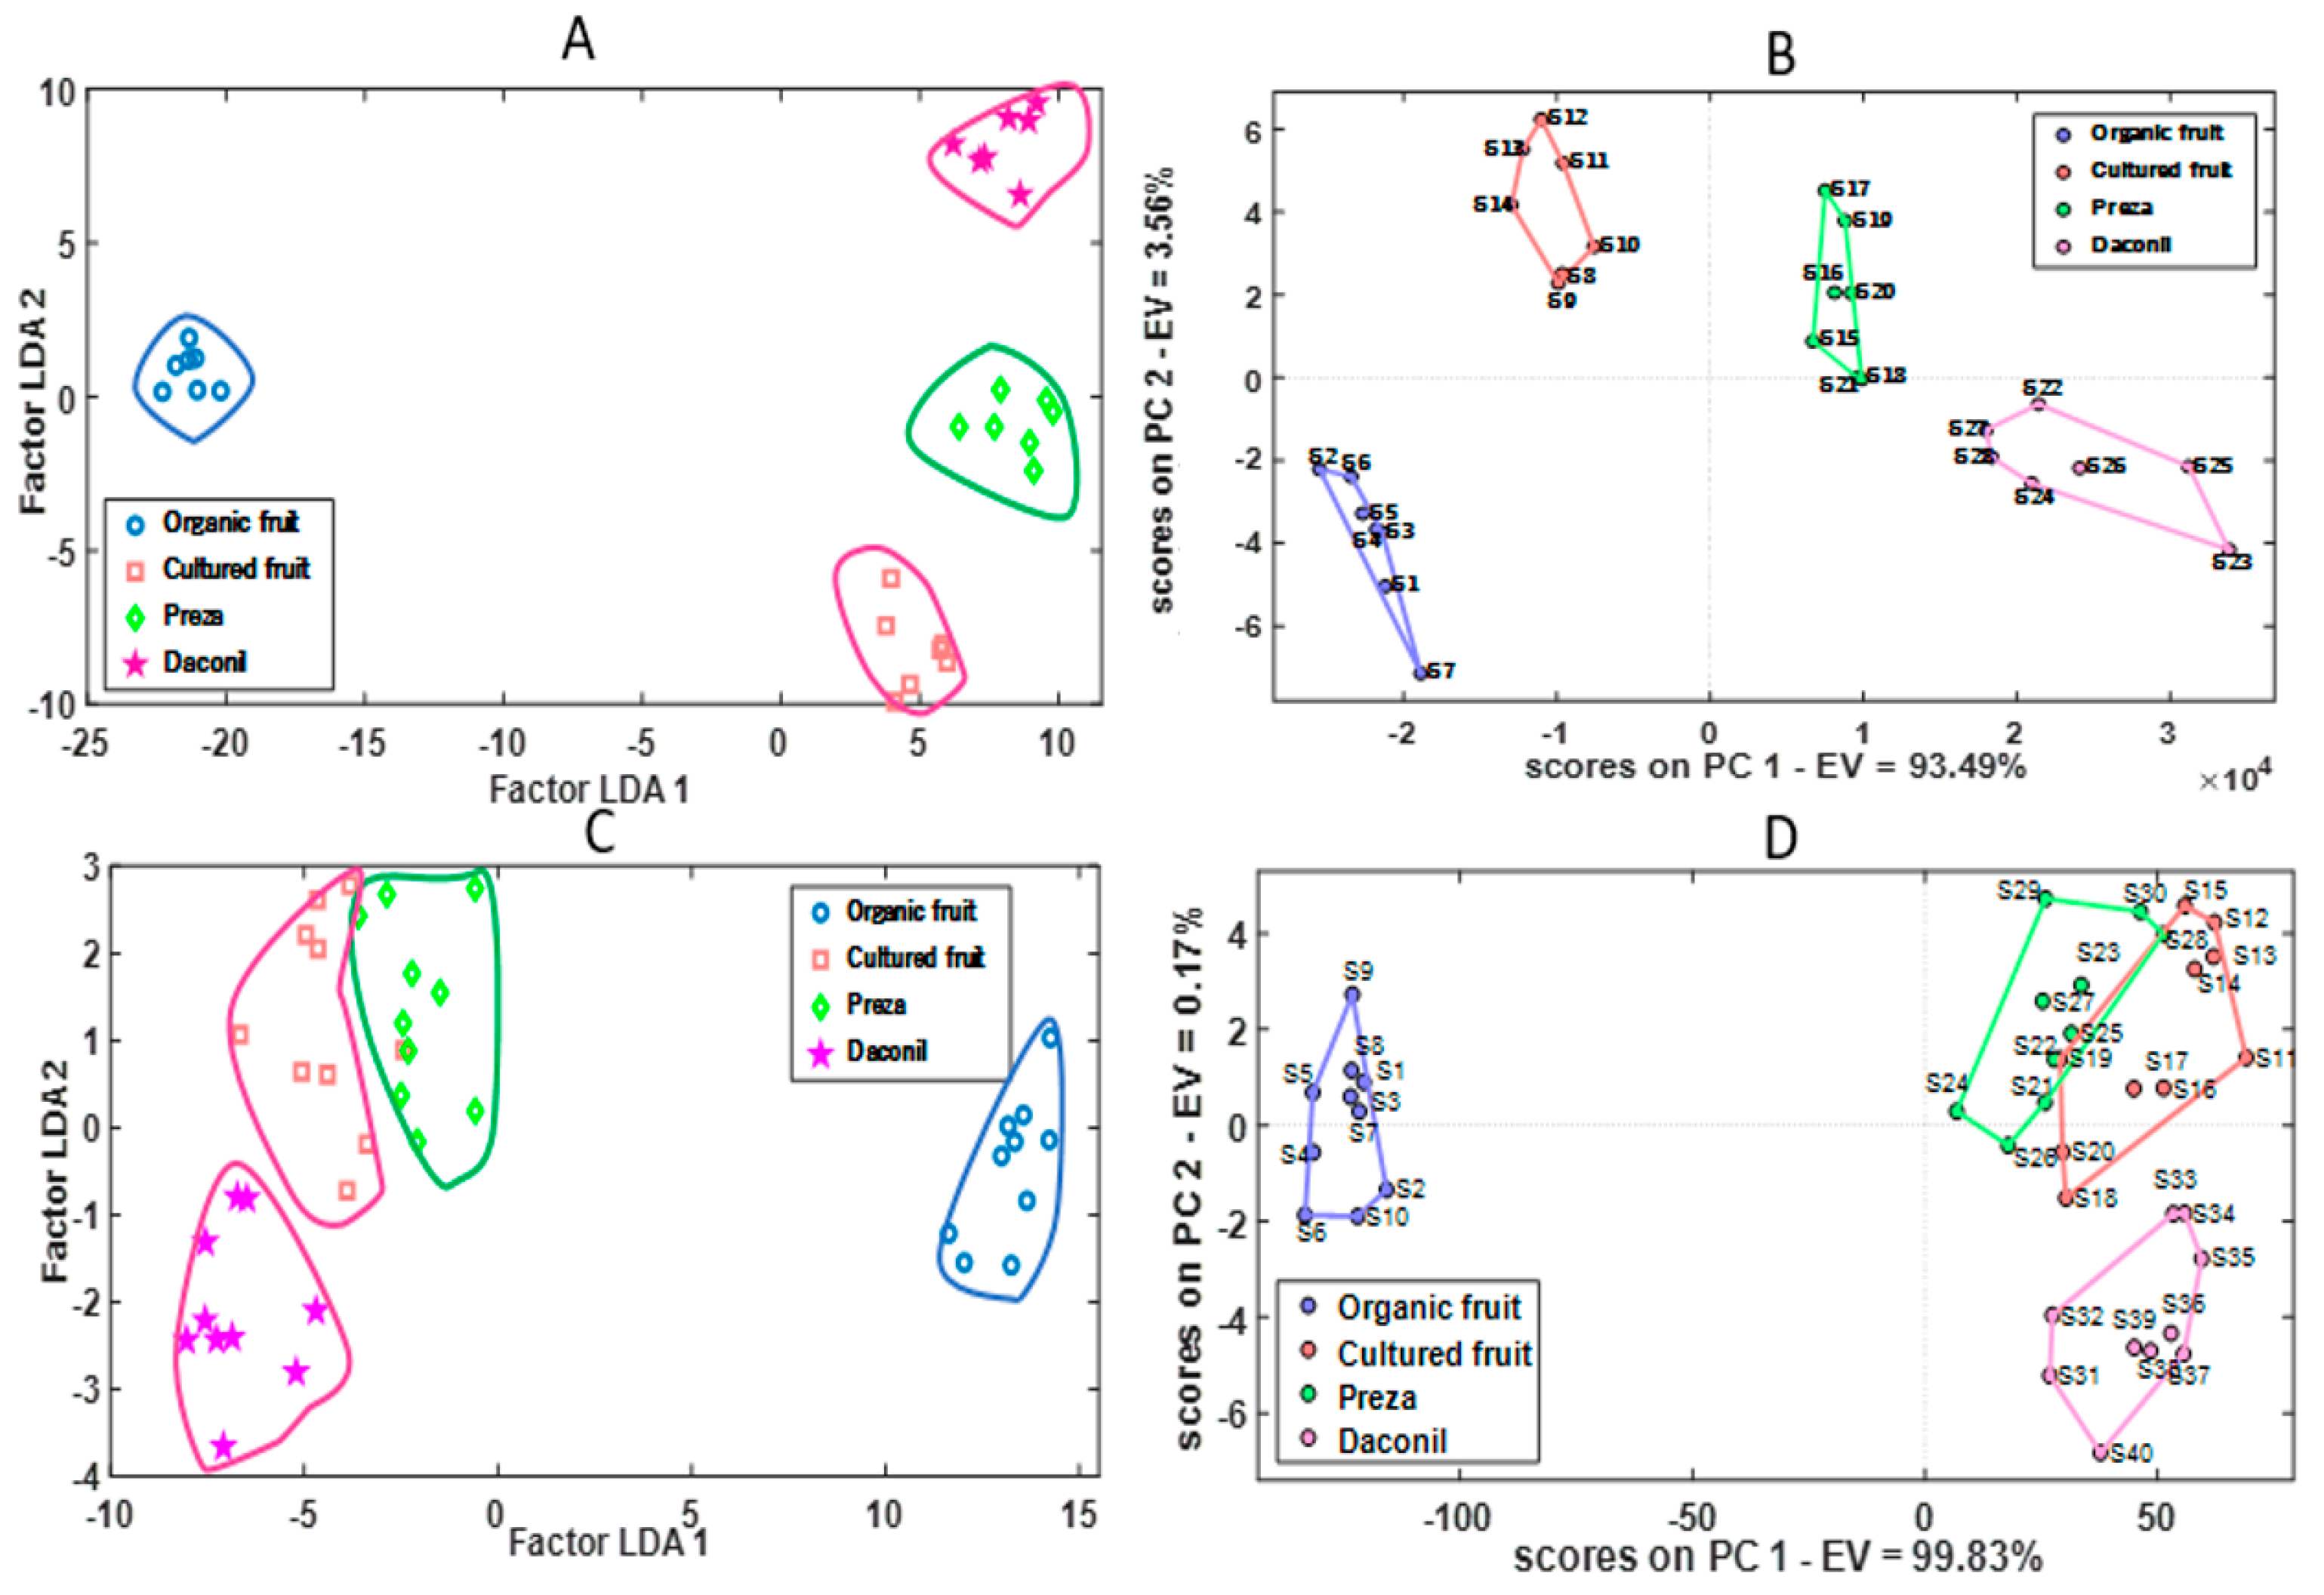
3.2. Classification of Pesticides in Fruits with Statistical Methods
3.3. Classification of Pesticide Concentrations in Fruits with Multivariate Analysis Methods
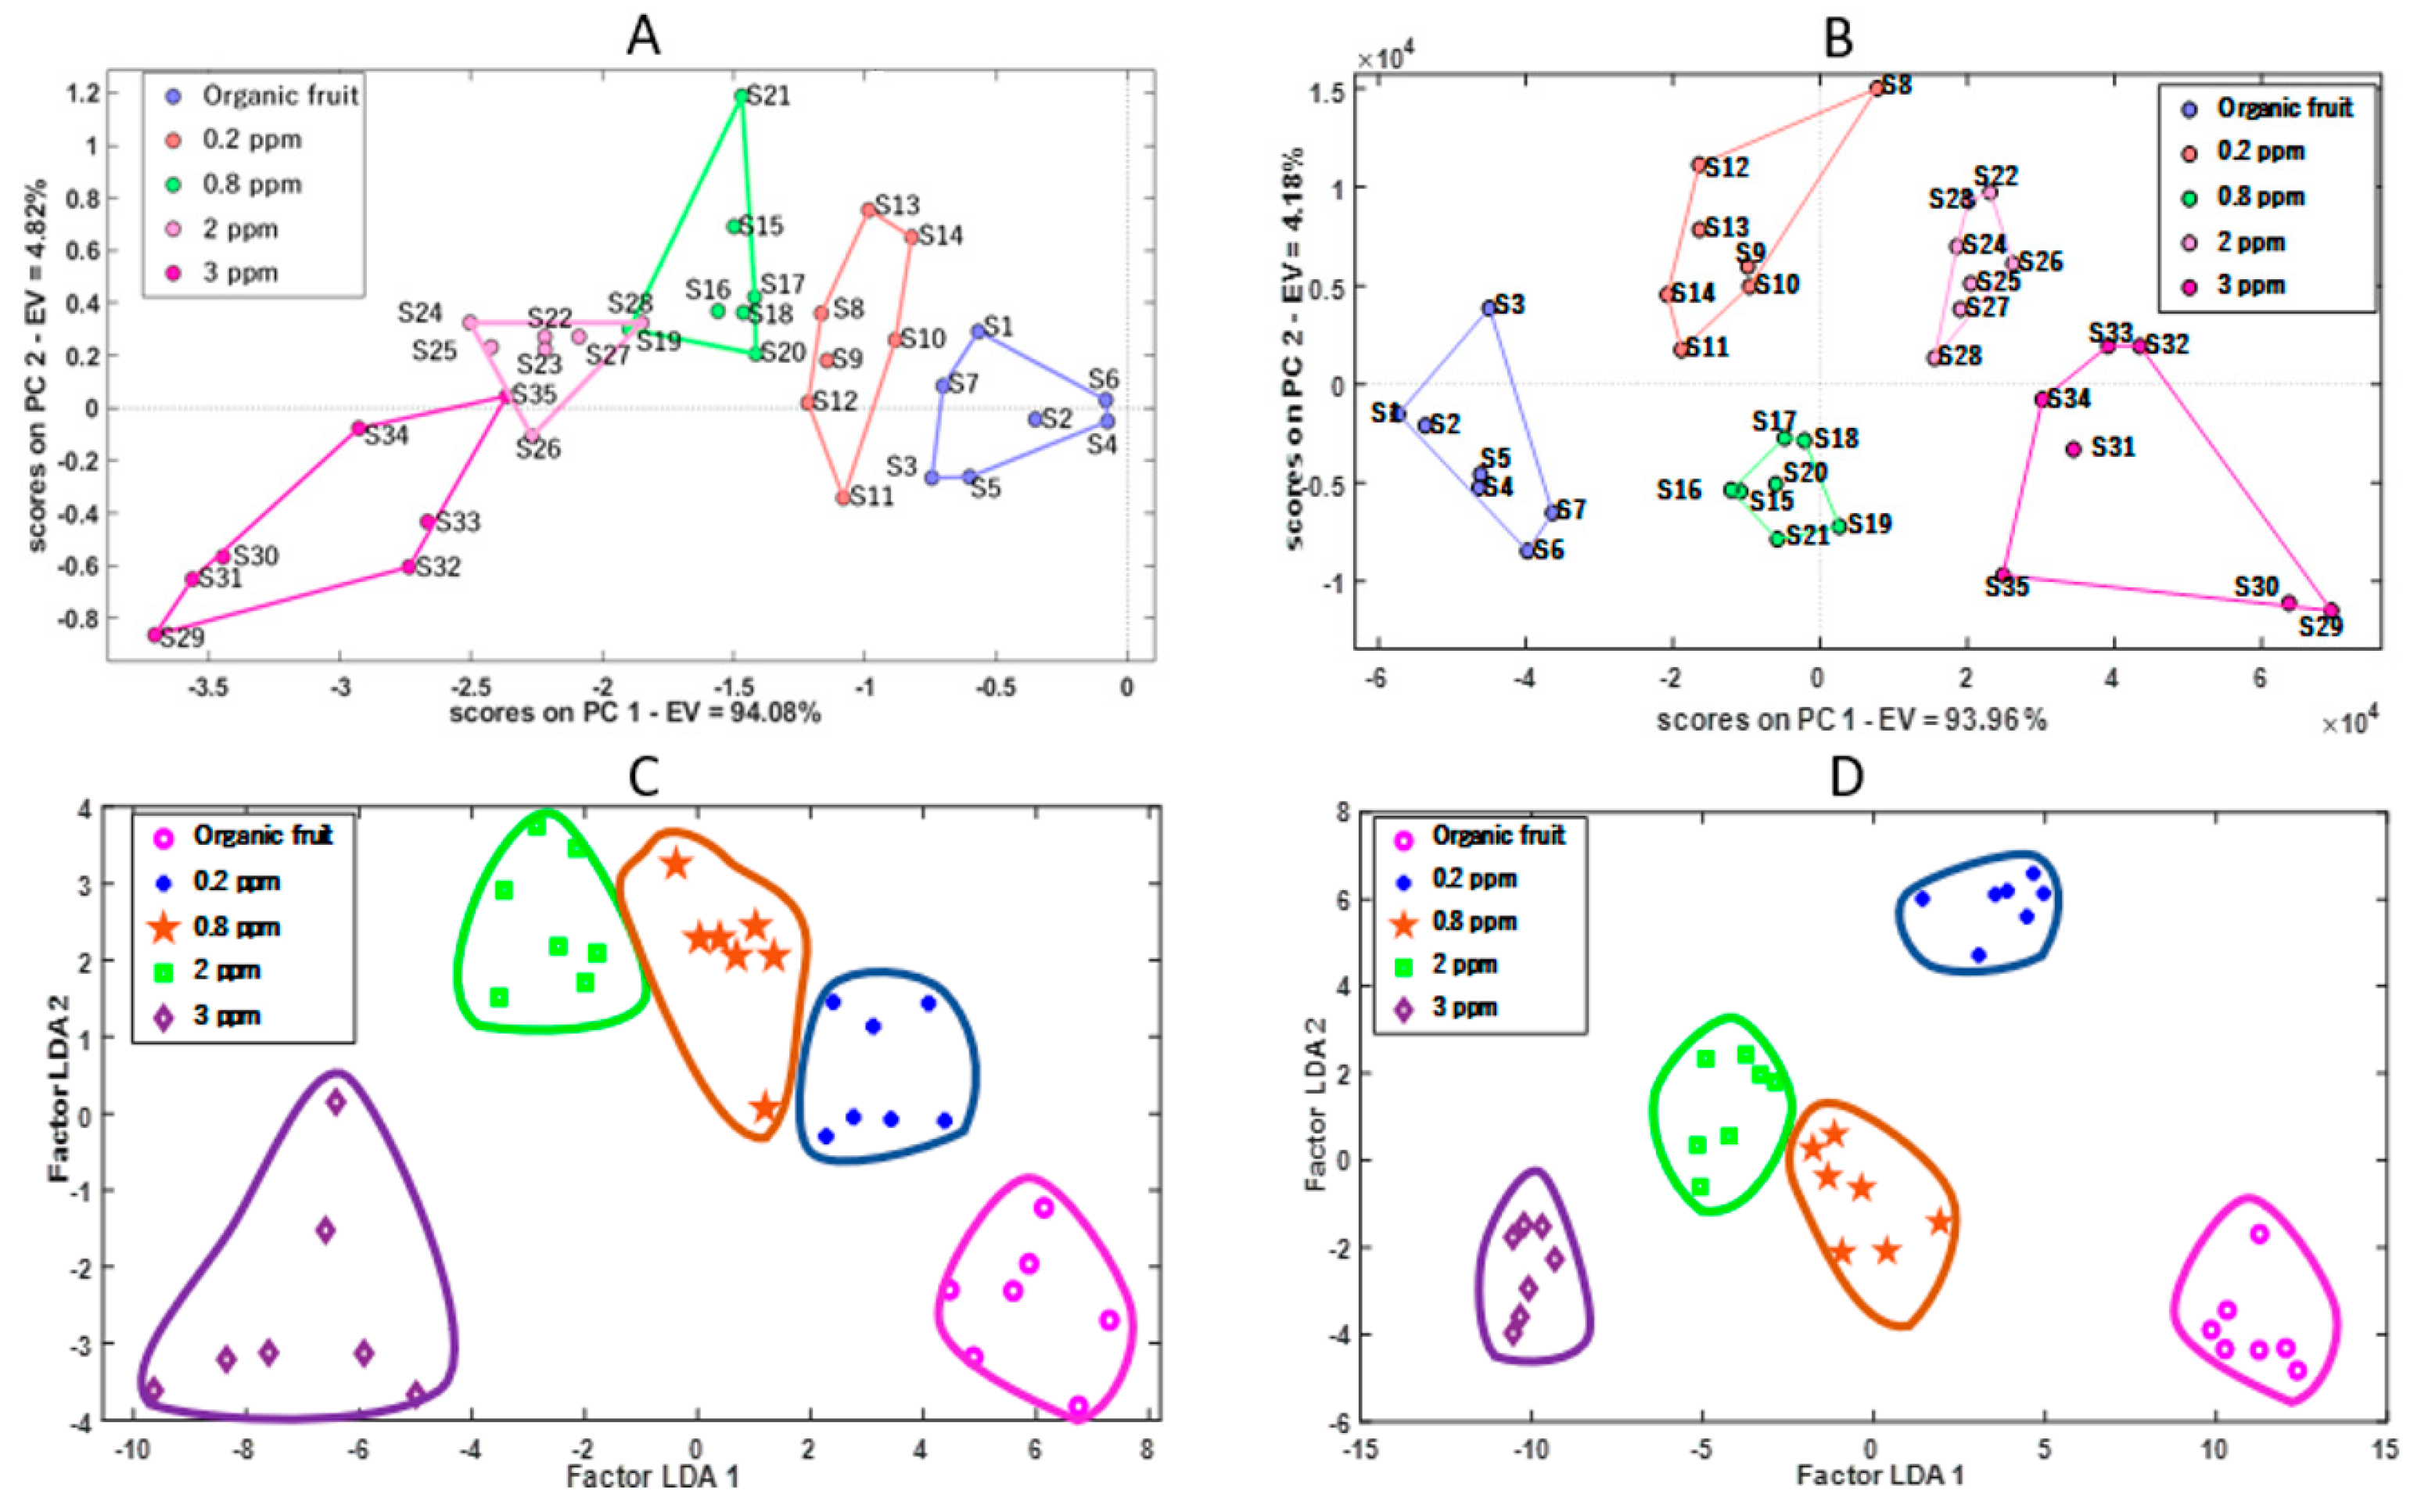
3.3.1. Plum
3.3.2. Strawberry
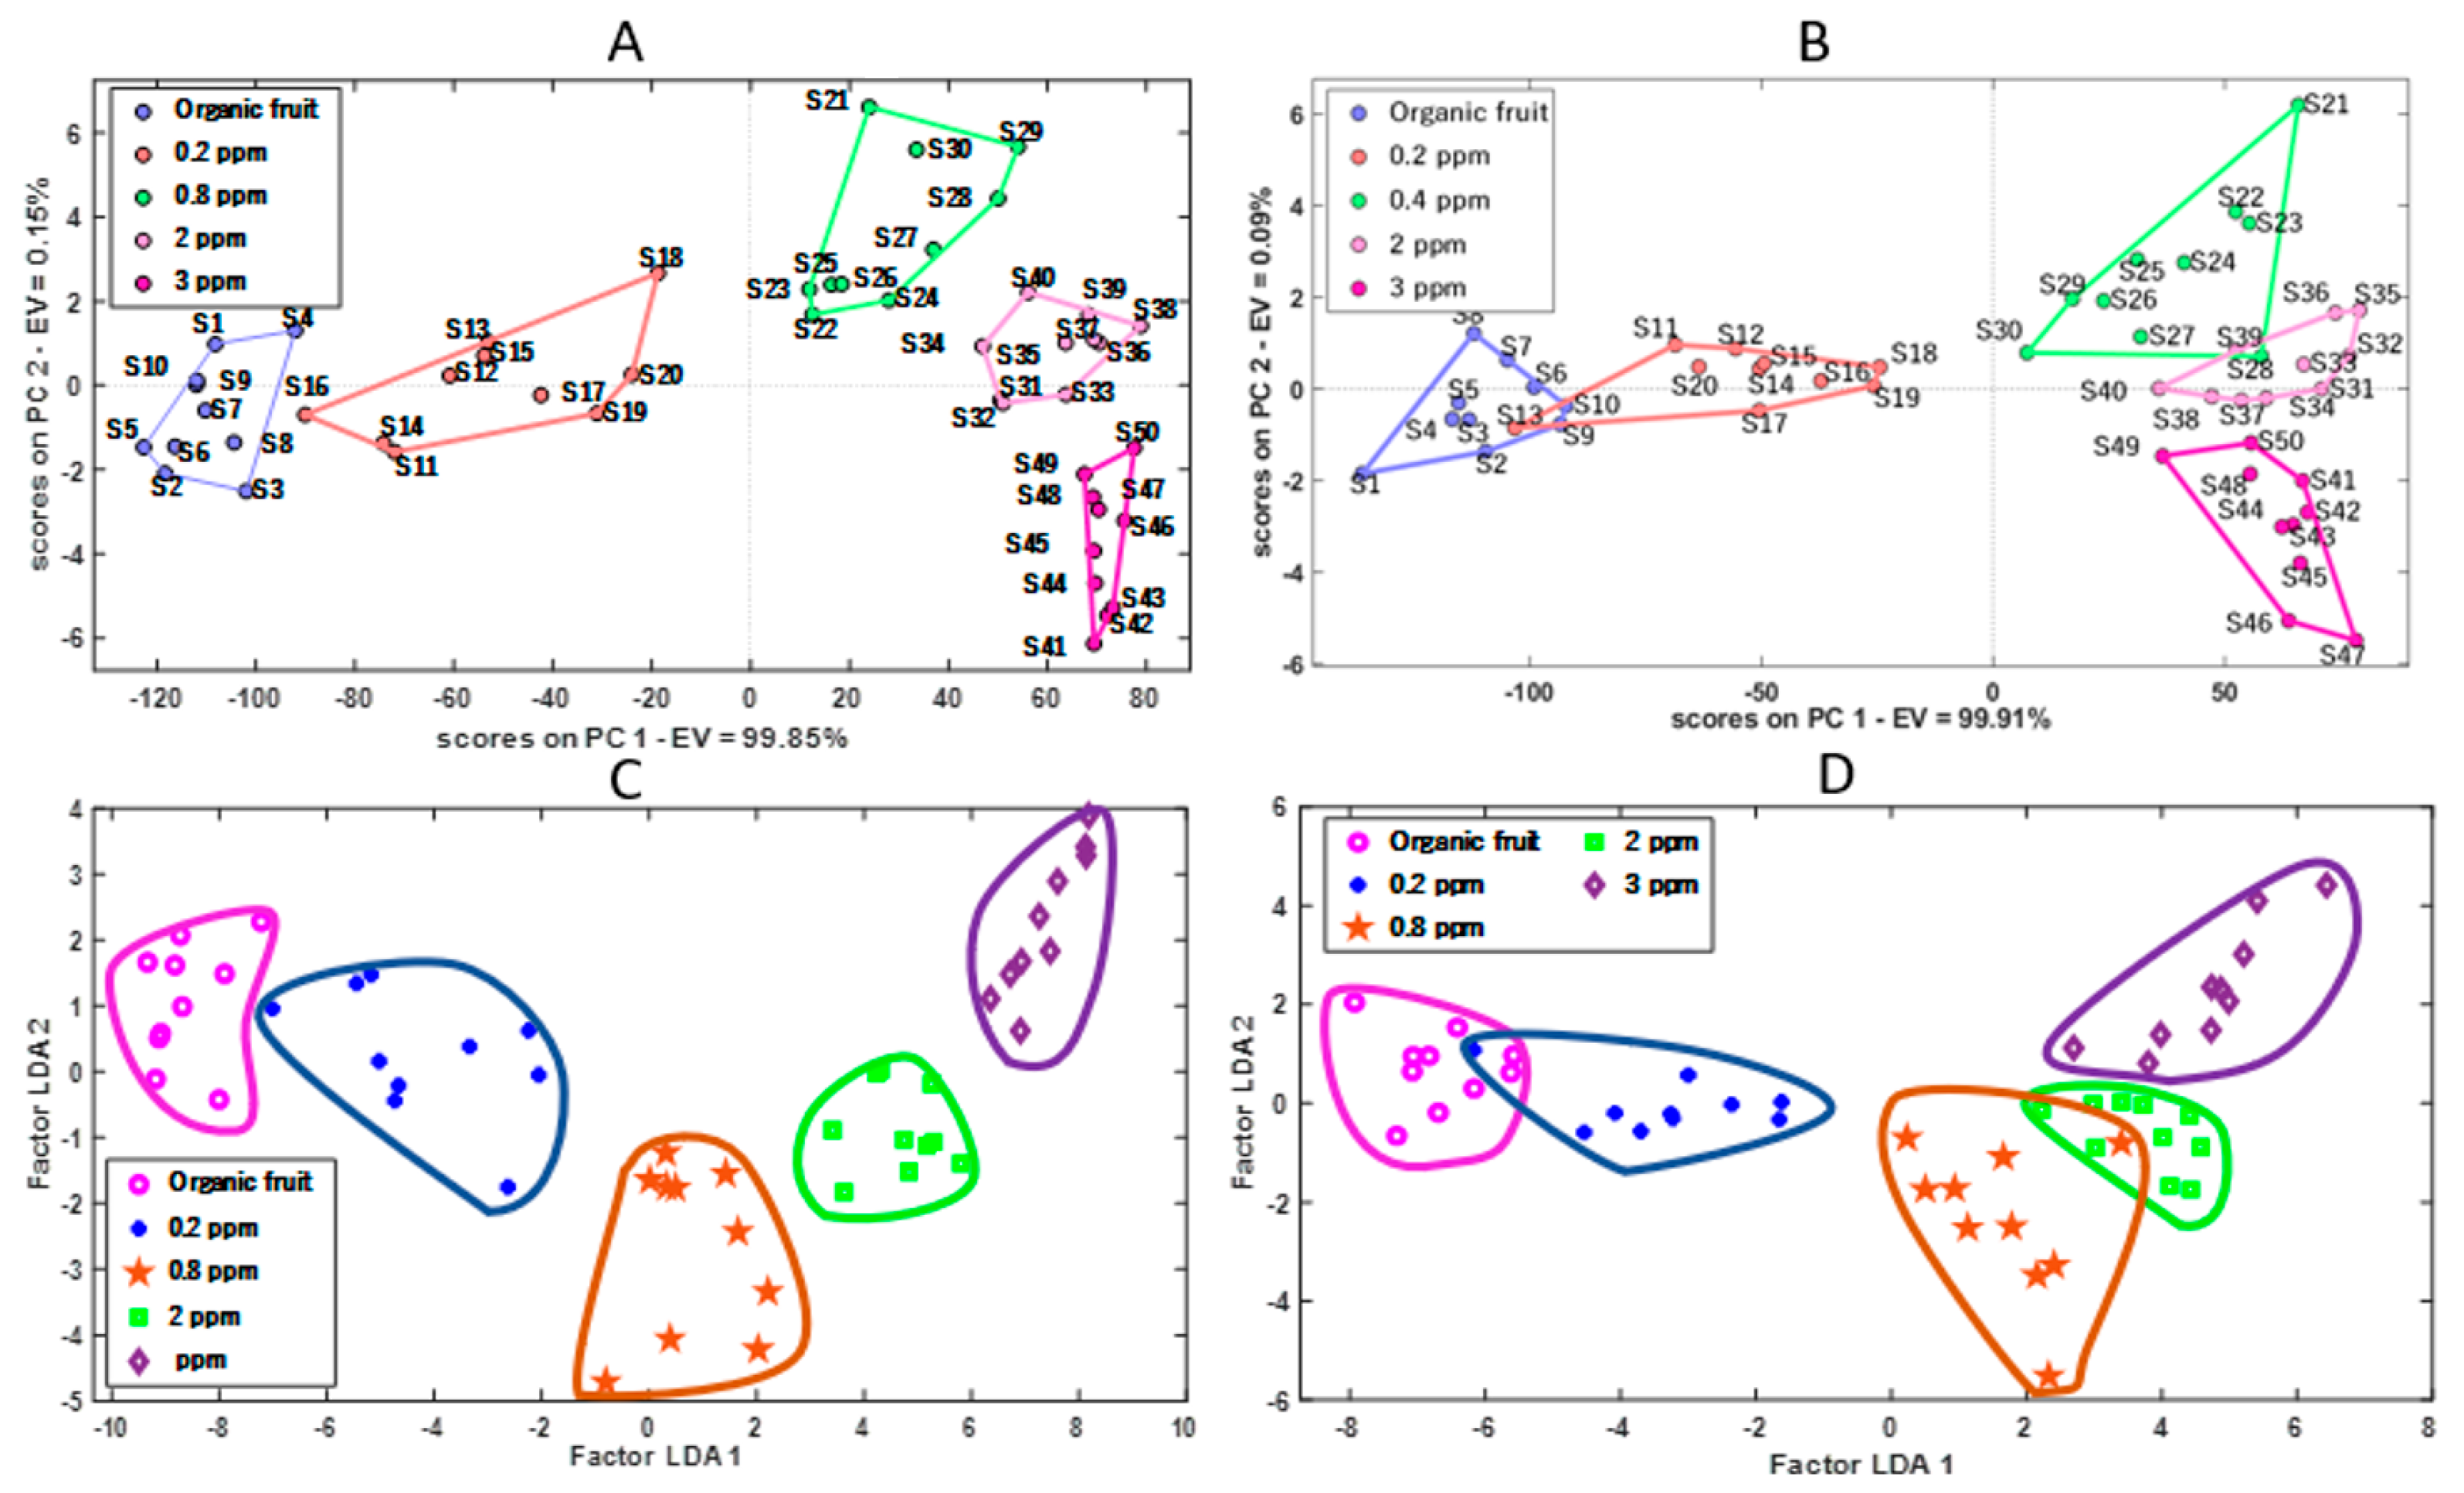
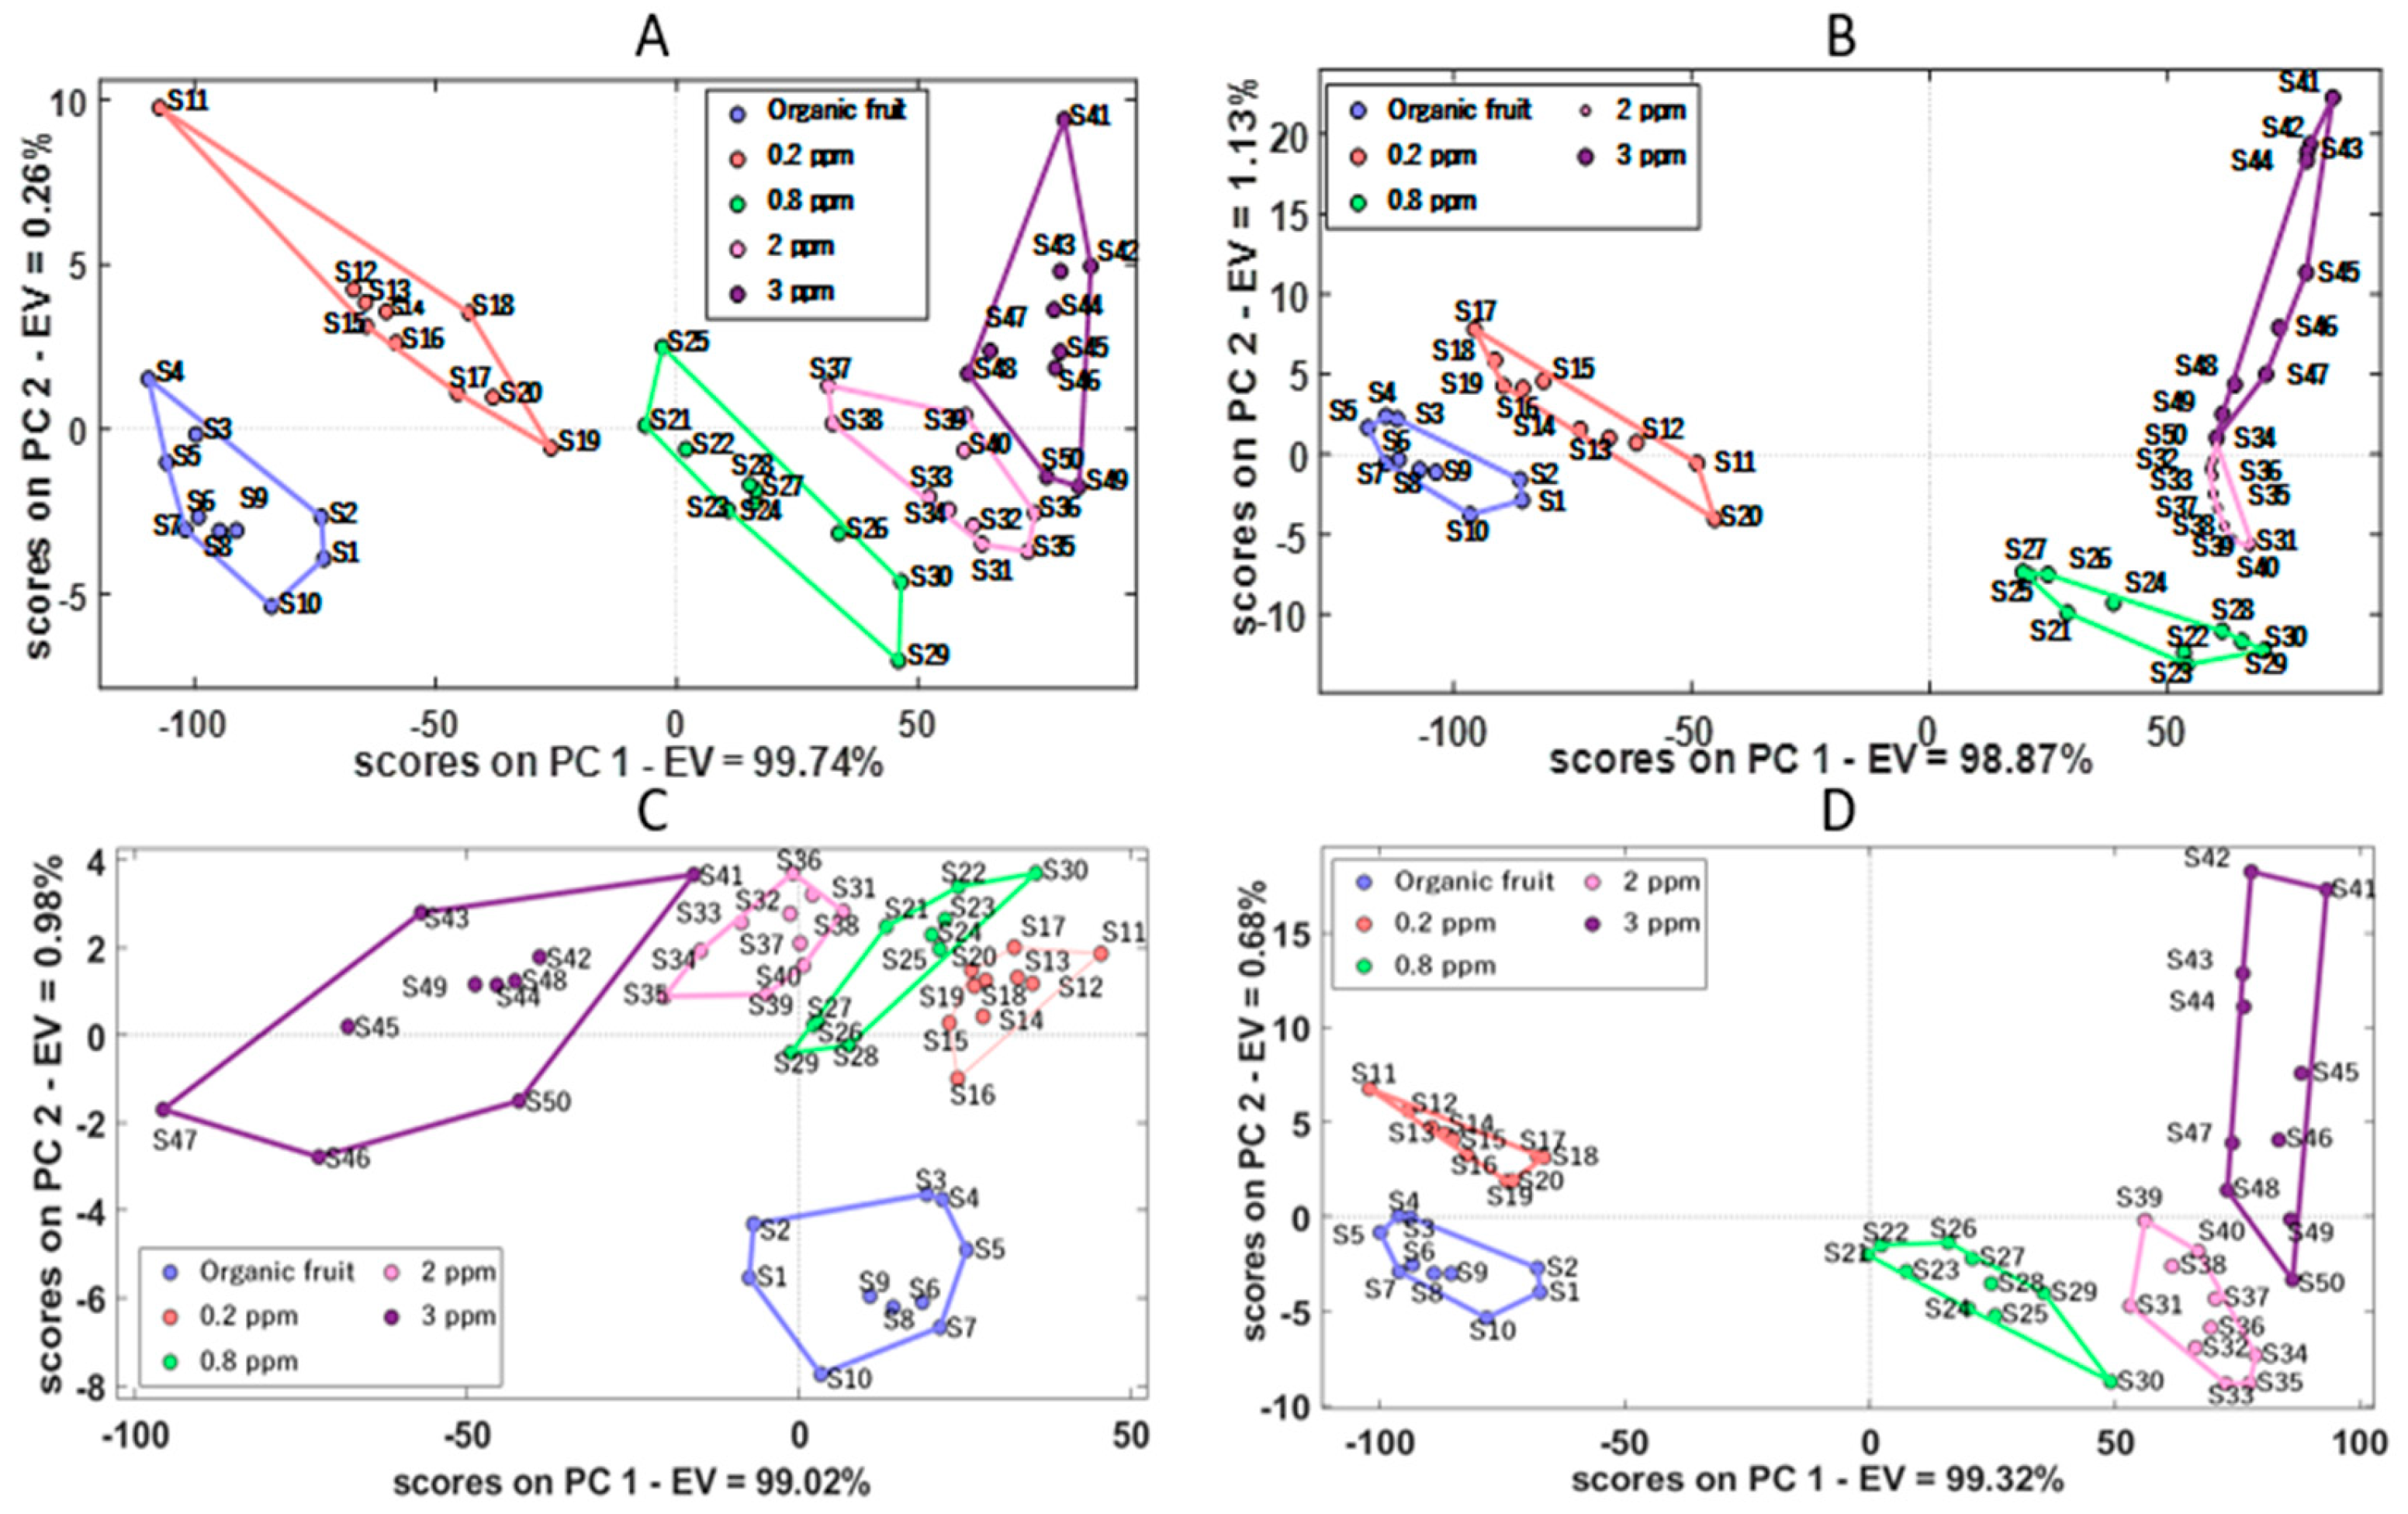
3.3.3. Apple
3.3.4. Cape Gooseberry
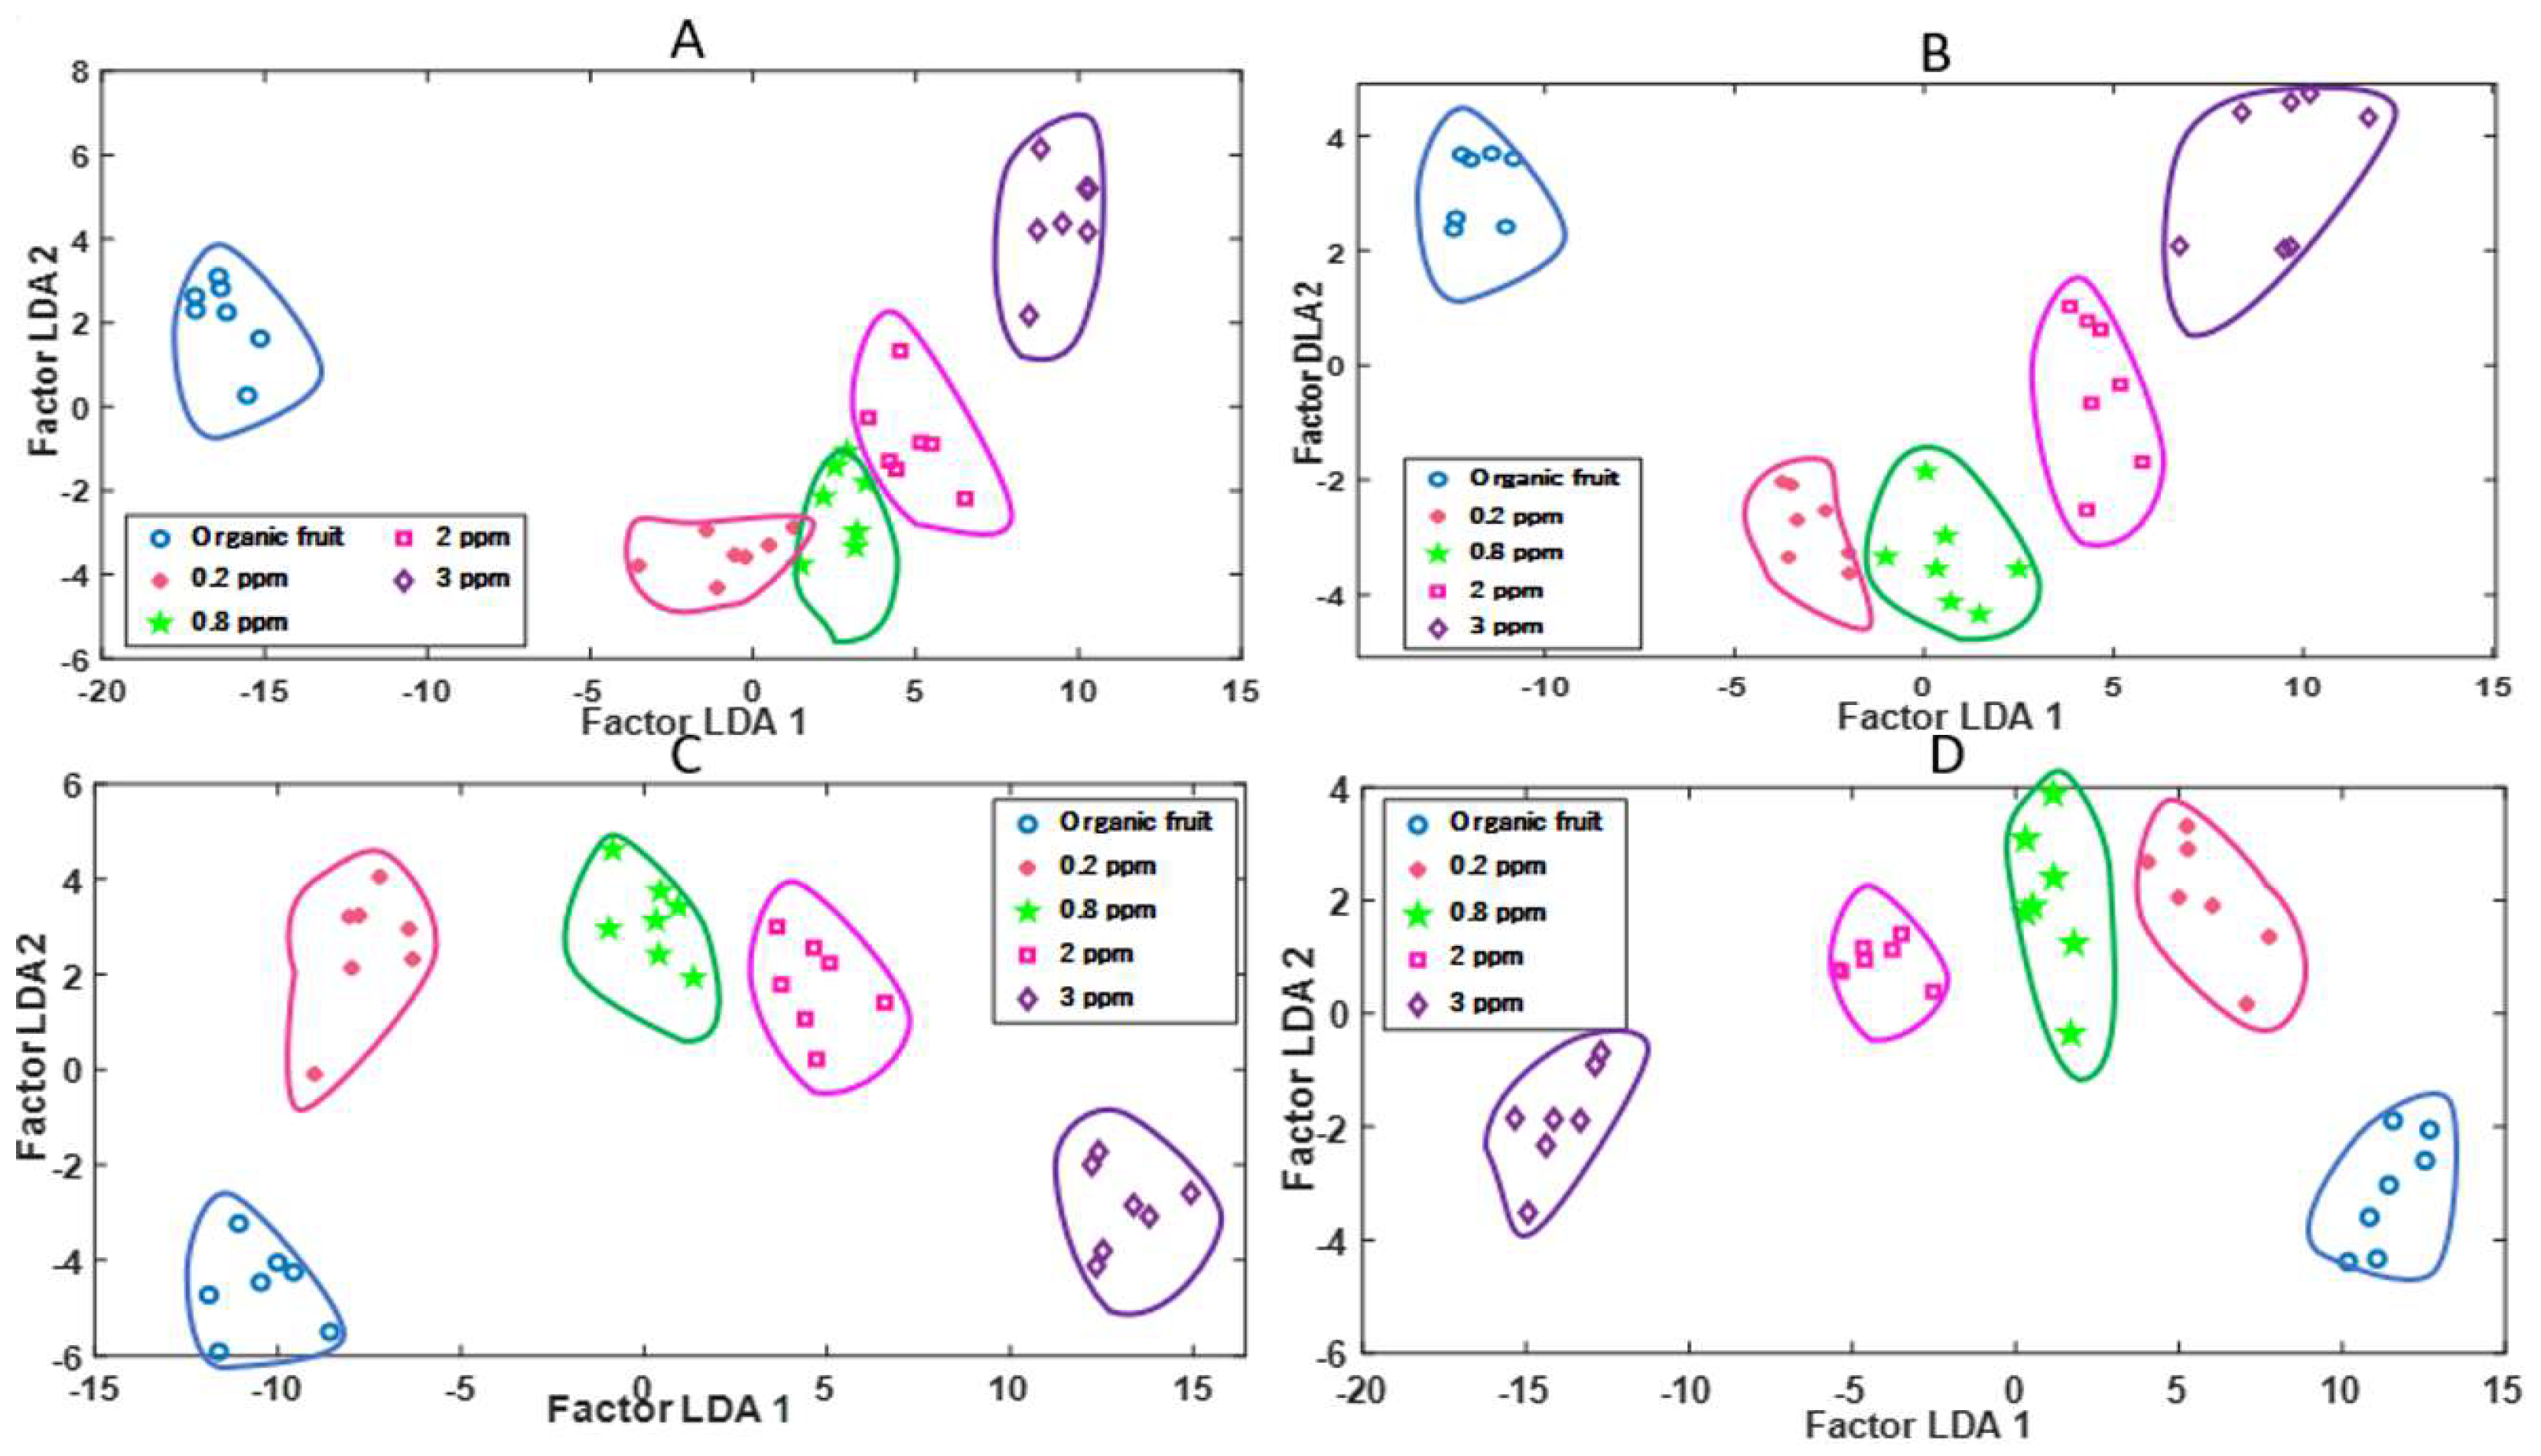
3.4. Classification of Pesticide Concentrations in Fruits with Machine Learning Methods
3.5. Results with Sensory Perception Systems Using Test Data
3.5.1. Plum
3.5.2. Strawberry
3.5.3. Apple
3.5.4. Cape Gooseberry
4. Discussion
5. Conclusions
Author Contributions
Funding
Institutional Review Board Statement
Informed Consent Statement
Data Availability Statement
Acknowledgments
Conflicts of Interest
References
- Skendžić, S.; Zovko, M.; Živković, I.P.; Lešić, V.; Lemić, D. The impact of climate change on agricultural insect pests. Insects 2021, 12, 440. [Google Scholar] [CrossRef] [PubMed]
- Mosier, S.; Córdova, S.C.; Robertson, G.P. Restoring Soil Fertility on Degraded Lands to Meet Food, Fuel, and Climate Security Needs via Perennialization. Front. Sustain. Food Syst. 2021, 5, 706142. [Google Scholar] [CrossRef]
- Viana, C.M.; Freire, D.; Abrantes, P.; Rocha, J.; Pereira, P. Agricultural land systems importance for supporting food security and sustainable development goals: A systematic review. Sci. Total Environ. 2022, 806, 150718. [Google Scholar] [CrossRef] [PubMed]
- United Nations, UN/DESA Policy Brief #102: Population, Food Security, Nutrition and Sustainable Development|Department of Economic and Social Affairs, United Nations. 2021. Available online: https://www.un.org/development/desa/dpad/publication/un-desa-policy-brief-102-population-food-security-nutrition-and-sustainable-development/ (accessed on 18 June 2024).
- UNFPA, Objetivos y Metas de Desarrollo Sostenible—Desarrollo Sostenible, Web Page. (2017) 1. Available online: https://www.un.org/sustainabledevelopment/es/objetivos-de-desarrollo-sostenible/ (accessed on 18 June 2024).
- Giller, K.E.; Delaune, T.; Silva, J.V.; Descheemaeker, K.; Van de Ven, G.; Schut, A.G.T.; Van Wijk, M.; Hammond, J.; Hochman, Z.; Taulya, G.; et al. The future of farming: Who will produce our food? Food Secur. 2021, 13, 1073–1099. [Google Scholar] [CrossRef]
- Van Dijk, M.; Morley, T.; Rau, M.L.; Saghai, Y. A meta-analysis of projected global food demand and population at risk of hunger for the period 2010–2050. Nat. Food 2021, 2, 494–501. [Google Scholar] [CrossRef]
- Aghili Nategh, N.; Anvar, A.; Dalvand, M.J. Detection of Acetamiprid residue in sour cherry in different degrees of maturity using an E-nose. Agric. Eng. 2020, 43, 235–254. [Google Scholar] [CrossRef]
- FAO. FAO Publications Catalogue 2022—October; FAO: Rome, Italy, 2022. [Google Scholar] [CrossRef]
- Popp, J.; Pető, K.; Nagy, J. Pesticide productivity and food security. A review. Agron. Sustain. Dev. 2013, 33, 243–255. [Google Scholar] [CrossRef]
- Sharma, A.; Kumar, V.; Shahzad, B.; Tanveer, M.; Sidhu, G.P.S.; Handa, N.; Kohli, S.K.; Yadav, P.; Bali, A.S.; Parihar, R.D.; et al. Worldwide pesticide usage and its impacts on ecosystem. SN Appl. Sci. 2019, 1, 1446. [Google Scholar] [CrossRef]
- Aktar, W.; Sengupta, D.; Chowdhury, A. Impact of pesticides use in agriculture: Their benefits and hazards. Interdiscip. Toxicol. 2009, 2, 1–12. [Google Scholar] [CrossRef]
- Alavanja, M.C.R. Introduction: Pesticides use and exposure extensive worldwide. Rev. Environ. Health 2009, 24, 303–309. [Google Scholar] [CrossRef]
- Tudi, M.; Ruan, H.D.; Wang, L.; Lyu, J.; Sadler, R.; Connell, D.; Chu, C.; Phung, D.T. Agriculture development, pesticide application and its impact on the environment. Int. J. Environ. Res. Public Health 2021, 18, 1112. [Google Scholar] [CrossRef] [PubMed]
- Pathak, V.M.; Verma, V.K.; Rawat, B.S.; Kaur, B.; Babu, N.; Sharma, A.; Dewali, S.; Yadav, M.; Kumari, R.; Singh, S.; et al. Current status of pesticide effects on environment, human health and it’s eco-friendly management as bioremediation: A comprehensive review. Front. Microbiol. 2022, 13, 962619. [Google Scholar] [CrossRef] [PubMed]
- Bernardes, M.F.F.; Pazin, M.; Pereira, L.C.; Dorta, D.J. Impact of Pesticides on Environmental and Human Health. In Toxicology Studies—Cells, Drugs and Environment; IntechOpen: London, UK, 2015. [Google Scholar] [CrossRef]
- Rather, I.A.; Koh, W.Y.; Paek, W.K.; Lim, J. The sources of chemical contaminants in food and their health implications. Front. Pharmacol. 2017, 8, 830. [Google Scholar] [CrossRef]
- Tudi, M.; Li, H.; Li, H.; Wang, L.; Lyu, J.; Yang, L.; Tong, S.; Yu, Q.J.; Ruan, H.D.; Atabila, A.; et al. Exposure Routes and Health Risks Associated with Pesticide Application. Toxics 2022, 10, 335. [Google Scholar] [CrossRef] [PubMed]
- Calaf, G.M. Role of organophosphorous pesticides and acetylcholine in breast carcinogenesis. Semin. Cancer Biol. 2021, 76, 206–217. [Google Scholar] [CrossRef]
- Ordoñez-Zarama, Y.A.; Jurado-Fajardo, D.; Paredes-Panesso, M.C.; Rosero-Bello, D.A.; Montenegro-Coral, F.A.; Risueño-Blanco, J.A.; Portillo-Miño, J.D. Sociodemographic and clinical characteristics related to the final condition of patients intoxicated by Paraquat in a hospital in Southwestern Colombia. Biomedica 2022, 42, 479–491. [Google Scholar] [CrossRef] [PubMed]
- Mew, E.J.; Padmanathan, P.; Konradsen, F.; Eddleston, M.; Sen Chang, S.; Phillips, M.R.; Gunnell, D. The global burden of fatal self-poisoning with pesticides 2006-15. Systematic review. J. Affect. Disord. 2017, 219, 93–104. [Google Scholar] [CrossRef]
- Buendía, J.A.; Chavarriaga, G.J.R.; Zuluaga, A.F. Burden of paraquat poisoning in the department of Antioquia, Colombia. BMC Pharmacol. Toxicol. 2019, 20, 11. [Google Scholar] [CrossRef]
- Sánchez-Bayo, F. Indirect effect of pesticides on insects and other arthropods. Toxics 2021, 9, 177. [Google Scholar] [CrossRef]
- Bempah, C.K.; Agyekum, A.A.; Akuamoa, F.; Frimpong, S.; Buah-Kwofie, A. Dietary exposure to chlorinated pesticide residues in fruits and vegetables from Ghanaian markets. J. Food Compos. Anal. 2016, 46, 103–113. [Google Scholar] [CrossRef]
- Macieira, A.; Barbosa, J.; Teixeira, P. Food Safety in Local Farming of Fruits and Vegetables. Int. J. Environ. Res. Public Health 2021, 18, 9733. [Google Scholar] [CrossRef] [PubMed]
- Jankowska, M.; Łozowicka, B.; Kaczyński, P. Comprehensive toxicological study over 160 processing factors of pesticides in selected fruit and vegetables after water, mechanical and thermal processing treatments and their application to human health risk assessment. Sci. Total Environ. 2019, 625, 1156–1167. [Google Scholar] [CrossRef]
- EWG’s 2023 Shopper’s Guide to Pesticides in Produce|Summary. Available online: https://www.ewg.org/foodnews/summary.php (accessed on 19 September 2023).
- Nguyen, T.T.; Rosello, C.; Bélanger, R.; Ratti, C. Fate of Residual Pesticides in Fruit and Vegetable Waste (FVW) Processing. Foods 2020, 9, 1468. [Google Scholar] [CrossRef]
- Zikankuba, V.L.; Mwanyika, G.; Ntwenya, J.E.; James, A. Pesticide regulations and their malpractice implications on food and environment safety. Cogent Food Agric. 2019, 5, 1601544. [Google Scholar] [CrossRef]
- Ministerio de Salud y Protección Social. Available online: https://www.minsalud.gov.co/Portada2021/index.html (accessed on 19 September 2023).
- Syrgabek, Y.; Alimzhanova, M. Modern Analytical Methods for the Analysis of Pesticides in Grapes: A Review. Foods 2022, 11, 1623. [Google Scholar] [CrossRef]
- Narenderan, S.T.; Meyyanathan, S.N.; Babu, B. Review of pesticide residue analysis in fruits and vegetables. Pre-treatment, extraction and detection techniques. Food Res. Int. 2020, 133, 109141. [Google Scholar] [CrossRef] [PubMed]
- Li, Z.; Askim, J.R.; Suslick, K.S. The OptoE-nose: Colorimetric and Fluorometric Sensor Arrays. Chem. Rev. 2019, 119, 231–292. [Google Scholar] [CrossRef] [PubMed]
- Askim, J.R.; Mahmoudi, M.; Suslick, K.S. Optical sensor arrays for chemical sensing: The optoE-nose. Chem. Soc. Rev. 2013, 42, 8649–8682. [Google Scholar] [CrossRef]
- Munekata, P.E.S.; Finardi, S.; de Souza, C.K.; Meinert, C.; Pateiro, M.; Hoffmann, T.G.; Domínguez, R.; Bertoli, S.L.; Kumar, M.; Lorenzo, J.M. Applications of E-nose, Electronic Eye and E-Tongue in Quality, Safety and Shelf Life of Meat and Meat Products: A Review. Sensors 2023, 23, 672. [Google Scholar] [CrossRef]
- Gliszczyńska-Świgło, A.; Chmielewski, J. E-nose as a Tool for Monitoring the Authenticity of Food. A Review. Food Anal. Methods 2017, 10, 1800–1816. [Google Scholar] [CrossRef]
- Carrillo-Gómez, J.K.; Durán Acevedo, C.M.; García-Rico, R.O. Detection of the bacteria concentration level in pasteurized milk by using two different artificial multisensory methods. Sens. Bio-Sens. Res. 2021, 33, 100428. [Google Scholar] [CrossRef]
- Rodríguez-Méndez, M.L.; De Saja, J.A.; González-Antón, R.; García-Hernández, C.; Medina-Plaza, C.; García-Cabezón, C.; Martín-Pedrosa, F. E-noses and tongues in wine industry. Front. Bioeng. Biotechnol. 2016, 4, 212083. [Google Scholar] [CrossRef]
- Tan, J.; Xu, J. Applications of E-nose (e-nose) and E-Tongue (e-tongue) in food quality-related properties determination: A review. Artif. Intell. Agric. 2020, 4, 104–115. [Google Scholar] [CrossRef]
- Baldwin, E.A.; Bai, J.; Plotto, A.; Dea, S. E-noses and tongues: Applications for the food and pharmaceutical industries. Sensors 2011, 11, 4744–4766. [Google Scholar] [CrossRef]
- Seesaard, T.; Wongchoosuk, C. Recent Progress in E-noses for Fermented Foods and Beverages Applications. Fermentation 2022, 8, 302. [Google Scholar] [CrossRef]
- Baietto, M.; Wilson, A.D. Electronic-nose applications for fruit identification, ripeness and quality grading. Sensors 2015, 15, 899–931. [Google Scholar] [CrossRef] [PubMed]
- Nategh, N.A.; Dalvand, M.J.; Anvar, A. Detection of toxic and non-toxic sweet cherries at different degrees of maturity using an E-nose. J. Food Meas. Charact. 2021, 15, 1213–1224. [Google Scholar] [CrossRef]
- Tang, Y.; Xu, K.; Zhao, B.; Zhang, M.; Gong, C.; Wan, H.; Wang, Y.; Yang, Z. A novel E-nose for the detection and classification of pesticide residue on apples. RSC Adv. 2021, 11, 20874–20883. [Google Scholar] [CrossRef]
- Marco, F.L.; Sabino, C.; Tuti, S.; Luisetto, I.; Petritoli, E.; Pecora, A.; Maiolo, L.; Durovic-Pejcev, R.; Dordevic, T.; Tomasevic, A.; et al. E-nose for pesticides detection: A first realization. In Proceedings of the 2017 IEEE International Workshop on Metrology for AeroSpace (MetroAeroSpace), Padua, Italy, 21–23 June 2017; pp. 403–407. [Google Scholar] [CrossRef]
- Rivera-Guerrero, M.A.; Gualdrón-Guerrero, O.E.; Torres-Chávez, I. Detección de pesticidas en el durazno (prunus pérsica) mediante una nariz electrónica. Rev. Investig. Desarro. Innovación 2020, 10, 359–365. [Google Scholar] [CrossRef]
- Tsagkaris, A.S.; Pulkrabova, J.; Hajslova, J. Optical screening methods for pesticide residue detection in food matrices: Advances and emerging analytical trends. Foods 2021, 10, 88. [Google Scholar] [CrossRef]
- Talan, A.; Mishra, A.; Eremin, S.A.; Narang, J.; Kumar, A.; Gandhi, S. Ultrasensitive electrochemical immuno-sensing platform based on gold nanoparticles triggering chlorpyrifos detection in fruits and vegetables. Biosens. Bioelectron. 2018, 105, 14–21. [Google Scholar] [CrossRef]
- Bala, R.; Kumar, M.; Bansal, K.; Sharma, R.K.; Wangoo, N. Ultrasensitive aptamer biosensor for malathion detection based on cationic polymer and gold nanoparticles. Biosens. Bioelectron. 2016, 85, 445–449. [Google Scholar] [CrossRef]
- Malvano, F.; Albanese, D.; Pilloton, R.; Di Matteo, M.; Crescitelli, A. A New Label-Free Impedimetric Affinity Sensor Based on Cholinesterases for Detection of Organophosphorous and Carbamic Pesticides in Food Samples: Impedimetric Versus Amperometric Detection. Food Bioprocess Technol. 2017, 10, 1834–1843. [Google Scholar] [CrossRef]
- Rhouati, A.; Majdinasab, M.; Hayat, A. A perspective on non-enzymatic electrochemical nanosensors for direct detection of pesticides. Curr. Opin. Electrochem. 2018, 11, 12–18. [Google Scholar] [CrossRef]
- Aprea, M.C. Environmental and biological monitoring in the estimation of absorbed doses of pesticides. Toxicol. Lett. 2012, 210, 110–118. [Google Scholar] [CrossRef]
- Duwest, Preza. Available online: https://duwest.com/wp-content/uploads/2021/03/HT_Preza10OD.pdf (accessed on 19 September 2023).
- Daconil. 2022, pp. 3–7. Available online: https://www.syngenta.com.co/sites/g/files/kgtney501/files/media/document/2022/08/05/daconil_720_sc_ficha_tecnica_10abril_2022.pdf (accessed on 19 September 2023).
- Curzare. 2018, pp. 1–5. Available online: https://www.corteva.co/content/dam/dpagco/corteva/la/mesoandean/co/es/files/etiquetas-web2021/CURZATE%20M-8%20-%20COL%20-%20ETIQUETA%20WEB%20-%20SEP%2021%202021.pdf (accessed on 19 September 2023).
- Fungicida Bricol 500 SC-DVA. Available online: https://agroquimicos-organicosplm.com/colombia/bricol_500_sc_dva/203/1/8536/58/3 (accessed on 19 September 2023).
- Tecnoquimicas, Across® 25 ec. (2010) 1. Available online: http://www.ghcia.com.co/plm/source/productos/9736_11_332.htm (accessed on 19 September 2023).
- Agrodac, AMISTAR® 50 WG. Available online: http://www.ghcia.com.co/plm/source/productos/2461_131_169.htm (accessed on 19 September 2023).
- Agroser, FUNLATE 50 WP—Agroser. Available online: https://www.agroserag.com/site/shop/proteccion/fungicidas/funlate-50-wp/ (accessed on 19 September 2023).
- RPubs—Análisis de componentes principales (PCA). Available online: https://rpubs.com/Cristina_Gil/PCA (accessed on 19 September 2023).
- Hazer-Rau, D.; Zhang, L.; Traue, H.C. Performance Evaluation of Various Emotion Classification Approaches from Physiological Signals. Int. J. Artif. Intell. Appl. 2018, 9, 31–41. [Google Scholar] [CrossRef]
- Vishwakarma, M.; Kesswani, N. A new two-phase intrusion detection system with Naïve Bayes machine learning for data classification and elliptic envelop method for anomaly detection. Decis. Anal. J. 2023, 7, 100233. [Google Scholar] [CrossRef]
- Lipo, W. Support Vector Machines: Theory and Applications; Springer Science+Business Media: Berlin, Germany, 2005; Volume 177, pp. 1–47. Available online: https://books.google.com.co/books?hl=es&lr=&id=uTzMPJjVjsMC&oi=fnd&pg=PA1&dq=support+vector+machine+algorithm&ots=GFHI7r2Hhc&sig=_gnMu0xHEmbS80SK9QE2wGqvJqE#v=onepage&q=supportvectormachinealgorithm&f=false (accessed on 19 September 2023).
- Fayed, H.A.; Atiya, A.F. A novel template reduction approach for the K-nearest neighbor method. IEEE Trans. Neural Netw. 2009, 20, 890–896. [Google Scholar] [CrossRef] [PubMed]
- Song, Y.Y.; Lu, Y. Decision trees methods: Applications for classification and prediction, Shanghai Arch. Psychiatry 2015, 27, 130–135. [Google Scholar] [CrossRef]
- Holopainen, J.K.; Gershenzon, J. Multiple stress factors and the emission of plant VOCs. Trends Plant Sci. 2010, 15, 176–184. [Google Scholar] [CrossRef]
- Li, J.; Di, T.; Bai, J. Distribution of Volatile Compounds in Different Fruit Structures in Four Tomato Cultivars. Molecules 2019, 24, 2594. [Google Scholar] [CrossRef] [PubMed]
- He, D.C.; Li, F.H.; Wu, M.; Luo, H.L.; Qiu, L.Q.; Ma, X.R.; Lu, J.-W.; Liu, W.-R.; Ying, G.-G. Emission of volatile organic compounds (VOCs) from application of commercial pesticides in China. J. Environ. Manag. 2022, 314, 115069. [Google Scholar] [CrossRef]
- Bicchi, C.; Cordero, C.; Liberto, E.; Sgorbini, B.; Rubiolo, P. Headspace sampling of the volatile fraction of vegetable matrices. J. Chromatogr. A 2008, 1184, 220–233. [Google Scholar] [CrossRef]
- Han, B. Electronic Detection of Pesticide Residueson Cherry Fruits. Int. J. Comput. Exp. Sci. Eng. 2024, 10, 364–370. [Google Scholar] [CrossRef]
- Murilo, H.; Mercante, L.; Mattoso, L.; Correa, D. Detection of trace levels of organophosphate pesticides using an electronic tongue based on graphene hybrid nanocomposites. Talanta 2017, 167, 59–66. [Google Scholar] [CrossRef]
- Wesoły, M.; Przewodowski, W.; Ciosek-Skibińska, P. Electronic noses and electronic tongues for the agricultural purposes. TrAC Trends Anal. Chem. 2023, 164, 117082. [Google Scholar] [CrossRef]
- Garefalaki, V.; Manco, G.; Porzio, E. Use of biosensors for rapid and sensitive detection of pesticides in food samples for food safety chemical risk assessment. EFSA J. 2022, 20, e200922. [Google Scholar] [CrossRef]
- Nieto, Y.; Cárdenas, D.; Carrillo, J.; Duran, C. Detection of Pesticides in Fruits such as Strawberry plum, Apple, and Cape gooseberry using an E-Tongue and Nose. In Proceedings of the LACCEI International Multi-Conference for Engineering, Education and Technology, Buenos Aires, Argentina, 19–21 July 2023. [Google Scholar] [CrossRef]


| Fruit | Location | Pesticide | Active Substance | Classification | Reference |
|---|---|---|---|---|---|
| Cape Gooseberry | Cerrito (Santander) | Preza | Cyantraniliprole | Insecticide | [53] |
| Daconil | Clorotalonil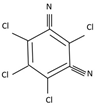 | Fungicide | [54] | ||
| Santa Rosa de Viterbo (Boyacá) | Curzate | Mancozeb | Fungicide | [55] | |
Cymoxamil | |||||
| Bricol | Carbendazim | Fungicide | [56] | ||
Flutriafol | |||||
| Strawberry | Tuta (Boyacá) | Accros | Difenoconazole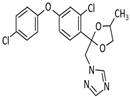 | Fungicide | [57] |
| Bricol | Carbendazim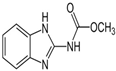 | Fungicide | [56] | ||
Flutriafol | |||||
| Plum Apple | Amistar | Azoxistrobina | Fungicide | [58] | |
| Funlate | Benomyl | Fungicide | [59] |
| Channel | Sensor Type | Gas Target | Detection Limit |
|---|---|---|---|
| S1 | TGS 826 | Ammonia and amines | 30 ppm |
| S2 | TGS 831 | R-22 (monochlorodifluoromethane) | 10 ppm |
| S3 | TGS 821 | Hydrogen | 50 ppm |
| S4 | TGS 826 | Ammonia and amines | 30 ppm |
| S5 | TGS 842 | Methane and natural gas | 350 ppm |
| S6 | TGS 880 | Volatile gases, water vapor in food | 500 pm |
| S7 | TGS 825 | Hydrogen sulfide | 1 ppm |
| S8 | TGS 830 | R-22 (monochlorodifluoromethane) | 10 ppm |
| S9 | TGS 800 | Carbon monoxide, methane, iso-butane, hydrogen, ethanol. | 50 ppm |
| S10 | TGS 880 | Volatile gases, water vapor in food | 10 ppm |
| S11 | TGS 822 | Alcohol and organic solvents | 50 ppm |
| S12 | TGS 821 | Hydrogen | 50 ppm |
| S13 | TGS 832 | R-134ª (tetrafluoroethane) | 10 ppm |
| S14 | TGS 842 | Methane and natural gas | 500 ppm |
| S15 | TGS 831 | R-22 (monochlorodifluoromethane) | 10 ppm |
| S16 | TGS 813 | Hydrocarbons in general | 500 ppm |
| z | Assigned Value |
|---|---|
| Econd [V] | 0 |
| Edep [V] | 0 |
| Tcond [s] | 0 |
| Tdep [s] | 0 |
| Tequil [s] | 0.3 |
| Ebegin [V] | 0 |
| Evtx1 [V] | −1 |
| Evtx2 [V] | 1 |
| Estep [V] | 0.01 |
| Srate [V/s] | 0.05 |
| Nscans | 1 |
| Method | Accuracy | |||||||
|---|---|---|---|---|---|---|---|---|
| E-Nose | E-Tongue | |||||||
| Plum | Strawberry | Apple | Cape Gooseberry | Plum | Strawberry | Apple | Cape Gooseberry | |
| Decision trees | 76.2% | 52.4% | 90.5% | 65.7% | 86.7% | 86.7% | 83.3% | 96% |
| Linear discrimination | 95.2% | 81% | 90.5% | 85.7% | 90% | 93.3% | 93.3% | 94% |
| Naïve Bayes | 66.7% | 47.6% | 90.5% | 62.9% | 93.3% | 93.3% | 93.3% | 98% |
| SVM (quadratic) | 85.7% | 76.2% | 90.5% | 74.3% | 93.3% | 93.3% | 90% | 94% |
| SVM (cubic) | 81% | 71.4% | 90.5% | 65.7% | 93.3% | 93.3% | 86.7% | 96% |
| K-NN (fine) | 85.7% | 52.4% | 90.5% | 60% | 90% | 93.3% | 86.7% | 96% |
| Metrics | Plum L. Discrimination | Strawberry L. Discrimination | Apple L. Discrimination | Gooseberry L. Discrimination | ||||||||||
|---|---|---|---|---|---|---|---|---|---|---|---|---|---|---|
| Org | Am | Fu | Org | Ac | Br | Org | Am | Fu | Org | Br | Cu | Da | Pr | |
| Precision | 100% | 100% | 87.5% | 83.3% | 75% | 85.7% | 85.7% | 100% | 87.5% | 87.5% | 100% | 83.3% | 83.3% | 75% |
| Sensitivity | 85.7% | 100% | 100% | 71.4% | 85.7% | 85.7% | 85.7% | 85.7% | 100% | 100% | 100% | 71.4% | 71.4% | 85.7% |
| Specificity | 100% | 100% | 92.9% | 92.9% | 85.7% | 92.9% | 92.9% | 100% | 92.9% | 96.4% | 100% | 96.4% | 96.4% | 92.9% |
| Accuracy | 95.3% | 95.3% | 95.3% | 81% | 81% | 81% | 90.5% | 90.5% | 90.5% | 85.7% | 85.7% | 85.7% | 85.7% | 85.7% |
| F1 score | 92.3% | 100% | 93.3% | 76.9% | 80.% | 85.7% | 85.7% | 92.3% | 93.3% | 93.3% | 100% | 76.9% | 76.9% | 80% |
| NPV | 93.3% | 100.% | 100% | 86.7% | 92.3% | 92.9% | 92.9% | 93.3% | 100% | 100% | 100% | 93.1% | 93.1% | 96.3% |
| Metrics | Plum SVM (Quadratic) | Strawberry L. Discrimination | Apple L. Discrimination | Gooseberry Naive Bayes | ||||||||||
|---|---|---|---|---|---|---|---|---|---|---|---|---|---|---|
| Org | Am | Fu | Org | Ac | Br | Org | Am | Fu | Org | Br | Cu | Da | Pr | |
| Precision | 100% | 90.9% | 90.9% | 100% | 90% | 90.9% | 90% | 100% | 90.0% | 100% | 100% | 90.9% | 100% | 100% |
| Sensitivity | 80% | 100% | 100% | 90% | 90% | 100% | 90% | 100% | 90% | 100% | 90.0% | 100% | 100% | 100% |
| Specificity | 100% | 95% | 95% | 100% | 95% | 95% | 95% | 100% | 95% | 100% | 100% | 97.5% | 100% | 100% |
| Accuracy | 93.3% | 93.3% | 93.3% | 93.3% | 93.3% | 93.3% | 93.3% | 93.3% | 93.3% | 98% | 98% | 98% | 98% | 98% |
| F1 score | 88.9% | 95.2% | 95.2% | 94.7% | 90% | 95.2% | 90% | 100% | 90% | 100% | 94.7% | 95.2% | 100% | 100% |
| NPV | 90.9% | 100% | 100% | 95.2% | 95% | 100% | 95% | 100% | 95% | 100% | 97.6% | 100% | 100% | 100% |
| Method | Accuracy Percentage (%) | |||||||||||||||||||
|---|---|---|---|---|---|---|---|---|---|---|---|---|---|---|---|---|---|---|---|---|
| E-Nose | E-Tongue | |||||||||||||||||||
| Plum | Strawberry | Apple | Cape Gooseberry | Plum | Strawberry | Apple | Cape Gooseberry | |||||||||||||
| Am | Fu | Ac | Br | Am | Fu | Br | Cu | Da | Pr | Am | Fu | Ac | Br | Am | Fu | Br | Cu | Da | Pr | |
| Decision Trees | 77.1 | 85.7 | 88.6 | 85.7 | 71.4 | 82.9 | 80.0 | 80.0 | 71.4 | 82.9 | 96.0 | 64.0 | 96.0 | 92.0 | 82.0 | 82.0 | 90.0 | 96.0 | 80.0 | 96.0 |
| LDA | 82.9 | 71.4 | 71.4 | 85.7 | 77.1 | 82.9 | 65.7 | 80.0 | 82.9 | 60.0 | 92.0 | 92.0 | 98.0 | 92.0 | 96.0 | 96.0 | 98.0 | 90.0 | 96.0 | 92.0 |
| Naïve Bayes | 91.4 | 88.6 | 77.1 | 97.1 | 85.7 | 97.1 | 91.4 | 88.6 | 94.3 | 82.9 | 98.0 | 80.0 | 94.0 | 92.0 | 80.0 | 84.0 | 94.0 | 98.0 | 92.0 | 100 |
| SVM (quadratic) | 97.1 | 80.0 | 71.1 | 91.4 | 91.4 | 88.6 | 88.6 | 88.6 | 97.1 | 85.7 | 96.0 | 84.0 | 96.0 | 92.0 | 84.0 | 90.0 | 94.0 | 94.0 | 96.0 | 98.0 |
| SVM (cubic) | 97.1 | 85.7 | 74.3 | 94.3 | 94.3 | 88.6 | 88.6 | 88.6 | 94.3 | 88.6 | 96.0 | 86.0 | 94.0 | 94.0 | 94.0 | 88.0 | 90.0 | 96.0 | 98.0 | 100 |
| K-NN (fine) | 97.1 | 94.3 | 82.9 | 100 | 88.6 | 97.1 | 82.9 | 94.3 | 80.0 | 80.0 | 92.0 | 90.0 | 96.0 | 90.0 | 94.0 | 92.0 | 96.0 | 96.0 | 96.0 | 100 |
Disclaimer/Publisher’s Note: The statements, opinions and data contained in all publications are solely those of the individual author(s) and contributor(s) and not of MDPI and/or the editor(s). MDPI and/or the editor(s) disclaim responsibility for any injury to people or property resulting from any ideas, methods, instructions or products referred to in the content. |
© 2024 by the authors. Licensee MDPI, Basel, Switzerland. This article is an open access article distributed under the terms and conditions of the Creative Commons Attribution (CC BY) license (https://creativecommons.org/licenses/by/4.0/).
Share and Cite
Durán Acevedo, C.M.; Cárdenas Niño, D.D.; Carrillo Gómez, J.K. Sensory Perception Systems and Machine Learning Methods for Pesticide Detection in Fruits. Appl. Sci. 2024, 14, 8074. https://doi.org/10.3390/app14178074
Durán Acevedo CM, Cárdenas Niño DD, Carrillo Gómez JK. Sensory Perception Systems and Machine Learning Methods for Pesticide Detection in Fruits. Applied Sciences. 2024; 14(17):8074. https://doi.org/10.3390/app14178074
Chicago/Turabian StyleDurán Acevedo, Cristhian Manuel, Dayan Diomedes Cárdenas Niño, and Jeniffer Katerine Carrillo Gómez. 2024. "Sensory Perception Systems and Machine Learning Methods for Pesticide Detection in Fruits" Applied Sciences 14, no. 17: 8074. https://doi.org/10.3390/app14178074