Article

3D X-ray Tomography Analysis of Mg–Si–Zn Alloys for Biomedical Applications: Elucidating the Morphology of the MgZn Phase

by
Guilherme Lisboa de Gouveia
1,
Eshan Ganju
2,
Danusa Moura
1,
Swapnil K. Morankar
2,
José Eduardo Spinelli
1 and
Nikhilesh Chawla
2,*
1
Department of Materials Engineering, UFSCar—Federal University of São Carlos, São Carlos 13565-905, SP, Brazil
2
School of Materials Engineering, Purdue University, West Lafayette, IN 47907, USA
*
Author to whom correspondence should be addressed.
Appl. Sci. 2024, 14(17), 8081; https://doi.org/10.3390/app14178081
Submission received: 9 August 2024 / Revised: 30 August 2024 / Accepted: 2 September 2024 / Published: 9 September 2024

Abstract

:
Temporary metal implants, made from materials like titanium (Ti) or stainless steel, can cause metabolic issues, raise toxicity levels within the body, and negatively impact the patient’s long-term health. This necessitates a subsequent operation to extract these implants once the healing process is complete or when they are outgrown by the patient. In contrast, medical devices fabricated from absorbable alloys have the advantage of being biodegradable, allowing them to be naturally absorbed by the body once they have fulfilled their role in facilitating tissue healing. Among the various absorbable alloy systems studied, magnesium (Mg) alloys stand out due to their biocompatibility, mechanical properties, and corrosion behavior. The existing literature on absorbable Mg alloys highlights the effectiveness of silicon (Si) and zinc (Zn) additions in improving mechanical properties and controlling corrosion susceptibility; however, there is a lack of comprehensive quantitative morphological analysis of the intermetallic phases within these alloy systems. The quantification of the complex morphology of intermetallic particles is a challenging task and has significant implications for the micromechanical properties of the alloys. This study, therefore, aims to introduce a robust set of morphometric parameters for evaluating the morphology of intermetallic phases within two as-cast Mg alloys with Si and Zn additions. X-ray Computed Tomography (XCT) was used to capture the 3D tomographic data of the alloys, and a novel pair of morphological parameters (ratio of convex hull to particle volume and convex hull sphericity) was applied to the 3D tomographic data to assess the MgZn phase formed in the two alloys. In addition to the impact of composition, the effect of solidification rate on the morphological parameters was also studied. Furthermore, Scanning Electron Microscopy (SEM) and Energy-Dispersive Spectroscopy (EDS) were employed to gather detailed 2D microstructural and compositional information on the intermetallics. The comprehensive characterization reveals that the morphological complexity and size distribution of the MgZn phase are influenced by both compositional changes and the solidification rate. However, the change in MgZn intermetallic particle morphology with size was found to follow a predictable trend, which was relatively agnostic of the chosen casting conditions.

1. Introduction

Absorbable alloys are emerging as a promising solution for use in biomedical implants due to their compatibility with the tissue healing process. These alloys are designed to degrade gradually in the body, thus eliminating the need for surgical removal that is typically required with non-absorbable materials. Significant research has been devoted to the development of various absorbable, or biodegradable, metallic alloys, which are engineered to support the healing process while eventually being absorbed by the body [1,2,3,4].
When choosing alloy compositions, it is important to consider biocompatibility requirements. Only those metals whose ions are non-toxic, essential to the organism, or beneficial in the recovery of damaged tissue should be considered for bio implants. Another crucial factor to consider is the body’s ability to absorb and excrete ions that result from the corrosion of the alloy’s constituent elements. These considerations are vital to minimize any adverse toxicological or pathophysiological effects [1,2,3]. As Hermawan [2] suggests, one of the key research objectives in the field of biomedical devices is to enhance the mechanical properties of these alloys while staying within the biocompatibility constraints. These biocompatibility constraints dictate that the alloys must be designed considering the constituent alloying elements, as well as the insertion rate of their ions into the organism due to the slow corrosion process. An element considered a nutrient, e.g., Fe, can cause harmful effects when it exists in excess in the body. For example, excess iron in the blood can lead to Hemochromatosis, which can cause damage to critical organs such as liver, heart and lungs [5]. In contrast, an element traditionally not considered a nutrient and with known toxicity can be incorporated into alloys used for bioimplants if its release rate in the body is low enough so as not to cause major damage to the patient’s health. For example, Ti alloys are well known for their use in bioimplants due to their corrosion resistance; however, studies have indicated that excess levels of Ti can impact organ functionality in humans [6]. Alloys within these constrains can be developed through the adoption of novel alloy compositions as well as by the effective design of the microstructure achieved via careful control of the solidification process [1,2,3,4,7,8,9].
Within the body, alloys undergo corrosion. Therefore, understanding the absorption and elimination capabilities of the body for the different alloy elements is crucial. This knowledge allows us to determine a safe range for ion release from the alloys, ensuring it does not inflict harm on the body [1,2,3,4,7,8,9]. Magnesium (Mg) alloys are attractive in this case due to the body’s higher absorption capacity, as evidenced by the relatively high recommended daily Mg dose for an adult (420 mg/day), which is significantly higher than the recommended daily doses for other alloy systems such as iron (Fe, 18 mg/day) and zinc (Zn, 15 mg/day) [7,10,11]. Moreover, the relatively low density of Mg alloys, combined with their suitable strength and a Young’s modulus that is in the range of that of human bone (40 to 45 GPa), as well as excellent biocompatibility, has made these alloys prime candidates for biomedical applications [10,12].
Among the elements used for alloying with magnesium (Mg), silicon (Si) is notable for its ability to enhance the mechanical properties of the alloy. Gu et al. [13] found that among the Mg-1 wt.% X alloys (where X represents Si, Al, Ag, In, Sn, Y, and Zr), the addition of 1 wt.% Si was the most effective in increasing yield strength, ultimate tensile strength, and fracture strain in the as-cast condition. This enhancement in mechanical properties was attributed to the formation of fine and evenly distributed Mg2Si precipitates [3,14,15,16]. Furthermore, biologically, Si is known to be a trace element that plays a critical role in several physiological processes, particularly in the growth and maintenance of bone tissue [17,18,19,20,21]. Despite these benefits, the brittle nature of the Mg2Si phase within the alloy can decrease ductility, and the formation of larger particles can increase stress concentration points and crack initiation sites [15,16]. One strategy to enhance the mechanical properties of Mg alloys with Si additions is the insertion of a third element, with zinc (Zn) being a notable option [22].
Biologically, Zn plays a crucial role in connective tissue metabolism, bone mineralization, and collagen structure development [23,24], and is involved in over 300 enzymatic reactions [7,25], making it a suitable element for consideration in the development of biocompatible alloys. From a performance standpoint, Zn addition also has several mechanical and corrosion-related benefits. Zhang et al. [26] conducted a study on Mg-0.6 wt. Si-x wt.% Zn alloys (where x = 0, 0.5, 1.3, 1.5, and 1.6) and they observed that the addition of 0.5 wt.% Zn was sufficient to modify the morphology of the Mg2Si phase. This modification led to a more refined Mg2Si particle distribution. When the Zn content was increased to values greater than or equal to 1.5 wt.%, it resulted in the morphological transformation of the eutectic Mg2Si into a Chinese Script-like structure, and the formation of a small amount of MgZn in the Mg matrix [26]. Zn tends to enhance the mechanical strength of the Mg matrix through solid solution and precipitation mechanisms, as well as through the refinement of Mg2Si [25]. Zhang et al. [26] reported an improvement in the tensile properties of the alloy with Zn content up to 1.5 wt.%.
Furthermore, Zhang, et al. [27] also investigated Mg-x wt.% Zn alloys (where x = 1, 2, 3, 4, 5, and 6) that were cast and solidified, and observed improvements in mechanical properties, such as tensile strength, yield strength, and ductility, with increasing Zn content up to 4 wt.%. Beyond 4 wt.% of Zn, the occurrence of MgZn precipitates was noted in the microstructure. With the increase in Zn above 4 wt.%, the morphology of the phase changed to a coarse structure along the grain boundaries.
Another study by Zhang et al. [28] found that the presence of 1.5 wt.% Zn led to improved corrosion resistance of the alloy. This improvement was attributed to the increased corrosion resistance of the Mg matrix when in solution with Zn, and to the refinement of the Mg2Si phase. This refinement helped mitigate the impact of localized corrosion at the interface between the Mg matrix and the Mg2Si phase. Although the addition of Zn generally improves corrosion resistance compared to pure Mg [25], Cai et al. [29] noted a deterioration in corrosion resistance due to the interconnected MgZn phase at higher Zn wt.% (~5%). This interconnected MgZn phase acts as a cathode, accelerating localized galvanic corrosion and reducing overall corrosion resistance due to the distinct electrochemical properties of the Mg matrix and MgZn phase [27]. Therefore, based on considerations of mechanical properties and corrosion resistance, a review of the literature suggests that the Zn content in Mg–Zn alloys should not exceed an optimal compositional range of around 2 to 3 wt.%.
The potential applications of absorbable alloys in the Mg–Si–Zn system will be strongly affected by the microstructural characteristics of the alloys. 2D microstructural characterization using traditional microscopy-based techniques is often inadequate in capturing the complex shapes of the intermetallic phases within the Mg–Si–Zn family of alloys. While some microstructural investigations in the literature have utilized 3D X-ray Computed Tomography (XCT) to capture the complex morphology of the intermetallics, these investigations have predominantly relied on relatively simple parameters such as particle volume, equivalent diameter, sphericity, aspect ratio, and Feret diameter [30,31,32,33,34,35,36,37,38,39,40,41] to quantify the complex intermetallic particle morphology and the emergent microstructure. While useful, these traditional morphological parameters often fall short in capturing the complex spatial distribution of interconnected intermetallic particles in 3D. Furthermore, even though the literature indicates that the MgZn phase enhances cathodic efficiency when present in an interconnected structure, the literature lacks detailed information on the spatial distribution and morphological changes the MgZn phase undergoes in response to compositional variations and solidification conditions. Therefore, in this work, we study the impact of the composition and solidification conditions on the microstructure of Mg–Zn–Si alloys. We propose a pair of novel morphological parameters that are extremely well-suited to the quantitative characterization of the MgZn phase, thereby addressing significant gaps in the literature in the design of biocompatible alloys. The 3D morphological investigation is complemented with compositional data obtained from SEM-EDS analysis on four distinct samples of Mg–Si–Zn alloys, each with different compositions and cooling rates.

2. Materials and Methods

In this section, we discuss the composition and casting of the Mg alloys, the X-ray Computed Tomography (XCT) technique used to capture the 3D microstructure of the alloys, as well as the computational image analyses techniques used to quantify the morphology of the MgZn phase within the alloys under different compositional and solidification conditions.

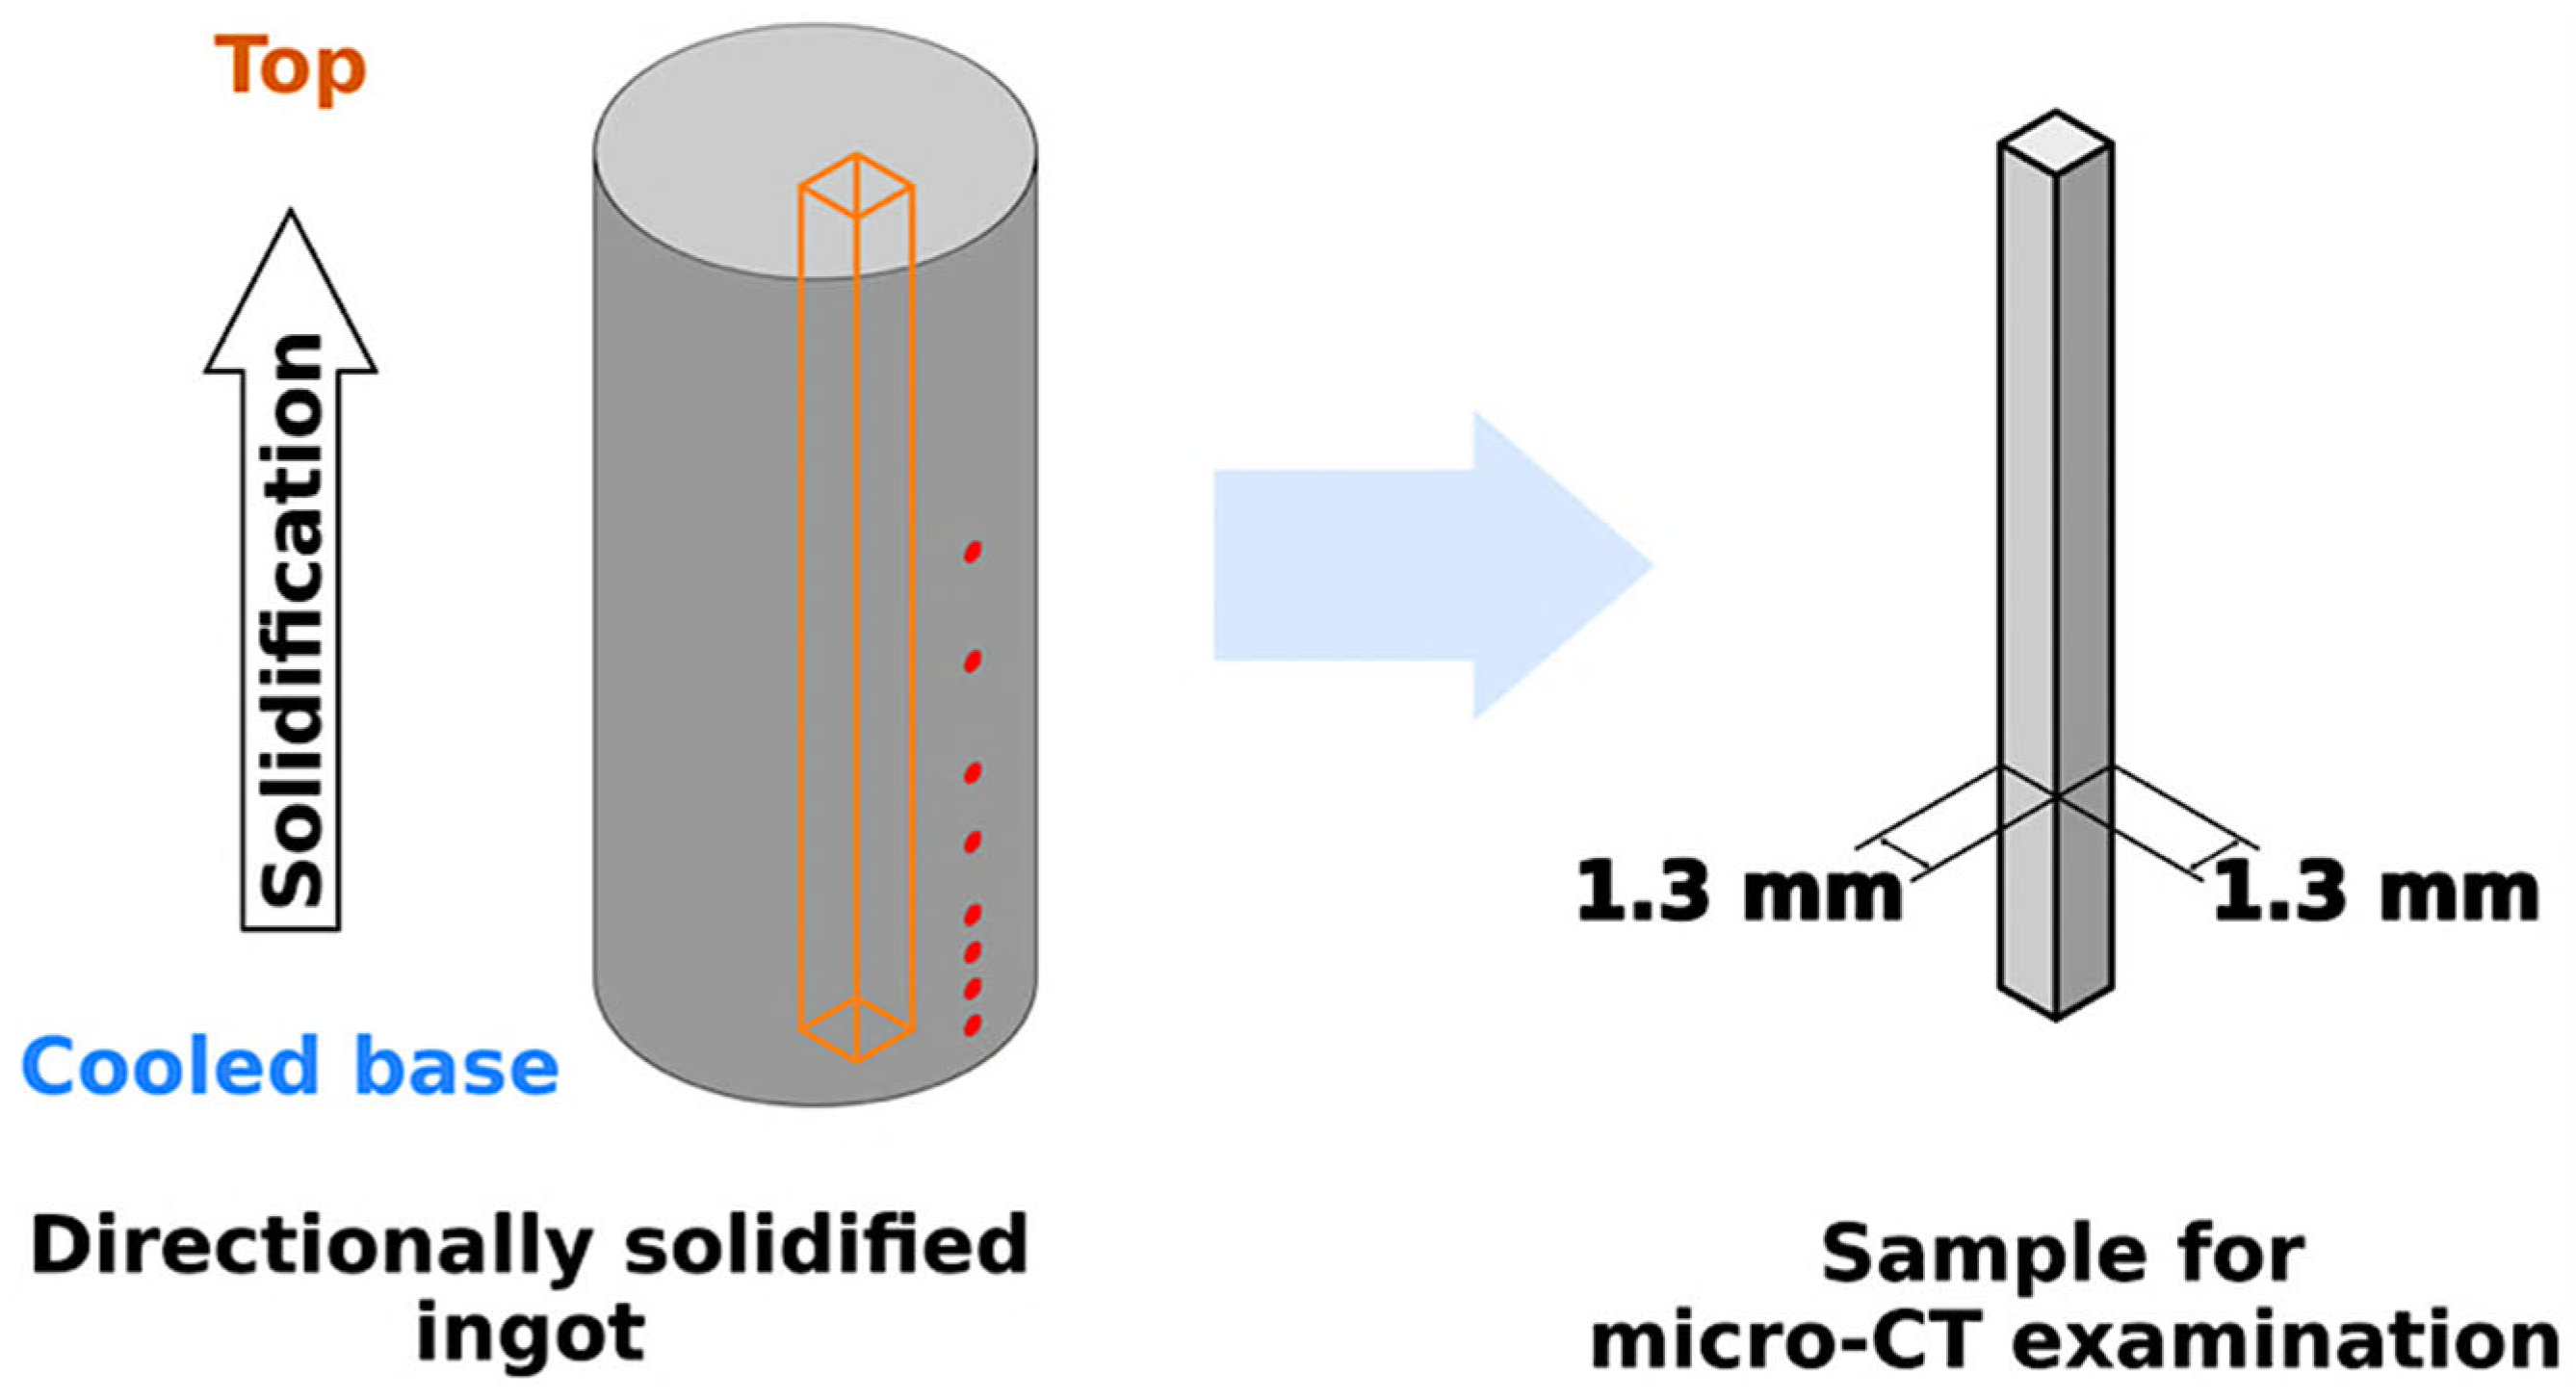
2.1. Casting of Mg Alloys

Two Mg-based alloys (with 2 wt.% and 3 wt.% of Zn, and 0.6 wt.% Si) were produced using the directional solidification technique with raw materials of commercial purity. The mechanical properties of these alloys have been discussed in previous work by de Gouveia et al. [42]. The Mg used in this research was obtained from Rima Industrial (Distrito Industrial, Brazil), while Al, Ca, Fe, Cu, Zn and Si were obtained from Ted Importação, Comércio e Representação de Me-tais Ltd. (São Caetano do Sul, Brazil). In the directional solidification method, a cylindrical ingot mold made of 316 L stainless steel, and a base made of 1020 steel, were utilized. The inner wall of the cylindrical region of the ingot mold was coated with a graphite-based layer to facilitate demolding of the ingot. Additionally, on this cylindrical side, eight K-type thermocouples were arranged longitudinally to enable temperature measurements at various distances from the base.
The metallic alloys of interest were produced, cast, and solidified in ingot molds using a Vacuum Induction Melting (VIM) system from GCA Vacuum Industries, in an atmosphere rich in Argon. The ingot molds, filled with the solidified alloys of interest, were then attached to the directional solidification system. A layer of salt, composed of 50% magnesium chloride and 50% potassium chloride, was deposited on the solidified material. Within the directional solidification system, the ingot molds were heated until complete melting of the alloys was achieved. During this heating process, the salt layer melted, thereby generating a layer of protection for the Mg alloys from the surrounding atmosphere.
Once the metallic alloy had melted, it was cooled until it reached a temperature equal to about 1% of the alloy’s liquidus temperature at the thermocouple closest to the base of the ingot mold. Cooling was started when the temperature recorded by the first thermocouple was 5% above the liquidus temperature. At this point, a flow of water was activated against the outer surface of the ingot mold, forcing upward solidification (bottom up). During the solidification process, temperature readings were captured for each of the eight thermocouples at a frequency of 5 Hz. These measurements were utilized to calculate the thermal parameters of solidification at different positions within the ingot. This approach facilitated the creation of gradients of solidification parameters (cooling rate) for each alloy of interest. Figure 1 illustrates the experimental process utilized in the fabrication of directionally solidified Mg-0.6Si-2Zn (0.6 wt.% Si and 2 wt.% Zn) and Mg-0.6Si-3Zn (0.6 wt.% Si and 3 wt.% Zn) ingots.
Table 1 shows a summary of the samples used in the current study and presents details of the corresponding cooling rates for each sample. An amount of 0.6 wt.% of Si was chosen based on the optimum concentration for ideal mechanical properties of the alloy, as well as due to its use in previous studies on Mg–Si–Zn alloys in as-cast conditions [16,26,28]. Further, as previously mentioned, the 2–3 wt.% Zn range chosen represents the optimal limits for Zn concentration in Mg–Zn alloys [25,26,27,28,29]. And finally, the cooling rate selected allowed the growth of the Zn-rich intermetallic particles (hereafter referred to as MgZn particles) such that these could be observed using the lab-scale X-ray Computed Tomography (XCT) technique—thereby enabling the assessment of the morphological evolution of the phase at the initial stages of its formation. In tandem with the solidification experiments, thermodynamic calculations of the solidification paths for the alloys were conducted with the assistance of the Pandat software v2021a, from CompuTherm (CompuTherm LLC, Middleton, WI, USA). The Mg–Si–Zn–Ca database was used to provide insights into the potential phases formed.
After solidification, the samples were extracted from directionally solidified cylindrical ingots. The extracted samples had a square section and a thickness of approximately 1.3 mm, spanning the length of the ingots (see Figure 2). This allowed us to access all the different cooling rates achieved in the directionally solidified ingot. The cuboidal sample was shaped by sanding with 600 and 1200 grit SiC. Samples produced in this manner were scanned in the XCT system to derive a 3D microstructure, and scanned using electron microscopy (EM) as well as Energy-Dispersive Spectroscopy (EDS) systems to acquire their 2D microstructural and compositional data. The composition of the alloys was verified using the energy-dispersive X-ray fluorescence spectrometry (XRF) technique (Shimadzu EDX-720, Shimadzu, Kyoto, Japan).

2.2. Microstructural and Compositional Analyses

The samples extracted from the ingots were analyzed using scanning electron microscopy (SEM). The FEI Quanta 3D FEG (FEI Company, Hillsboro, OR, USA) was used for SEM imaging and EDS characterization, in conjunction with an Oxford INCA Xstream-2 with an Xmax80 detector (Oxford Instruments, Peabody, MA, USA). The backscattered electron (BSE) detector was employed to capture the 2D morphology of the MgZn particles, leveraging the high contrast with the matrix. EDS characterization was conducted at an accelerating voltage of 10 kV to discern compositional differences between the MgZn particles and the matrix.

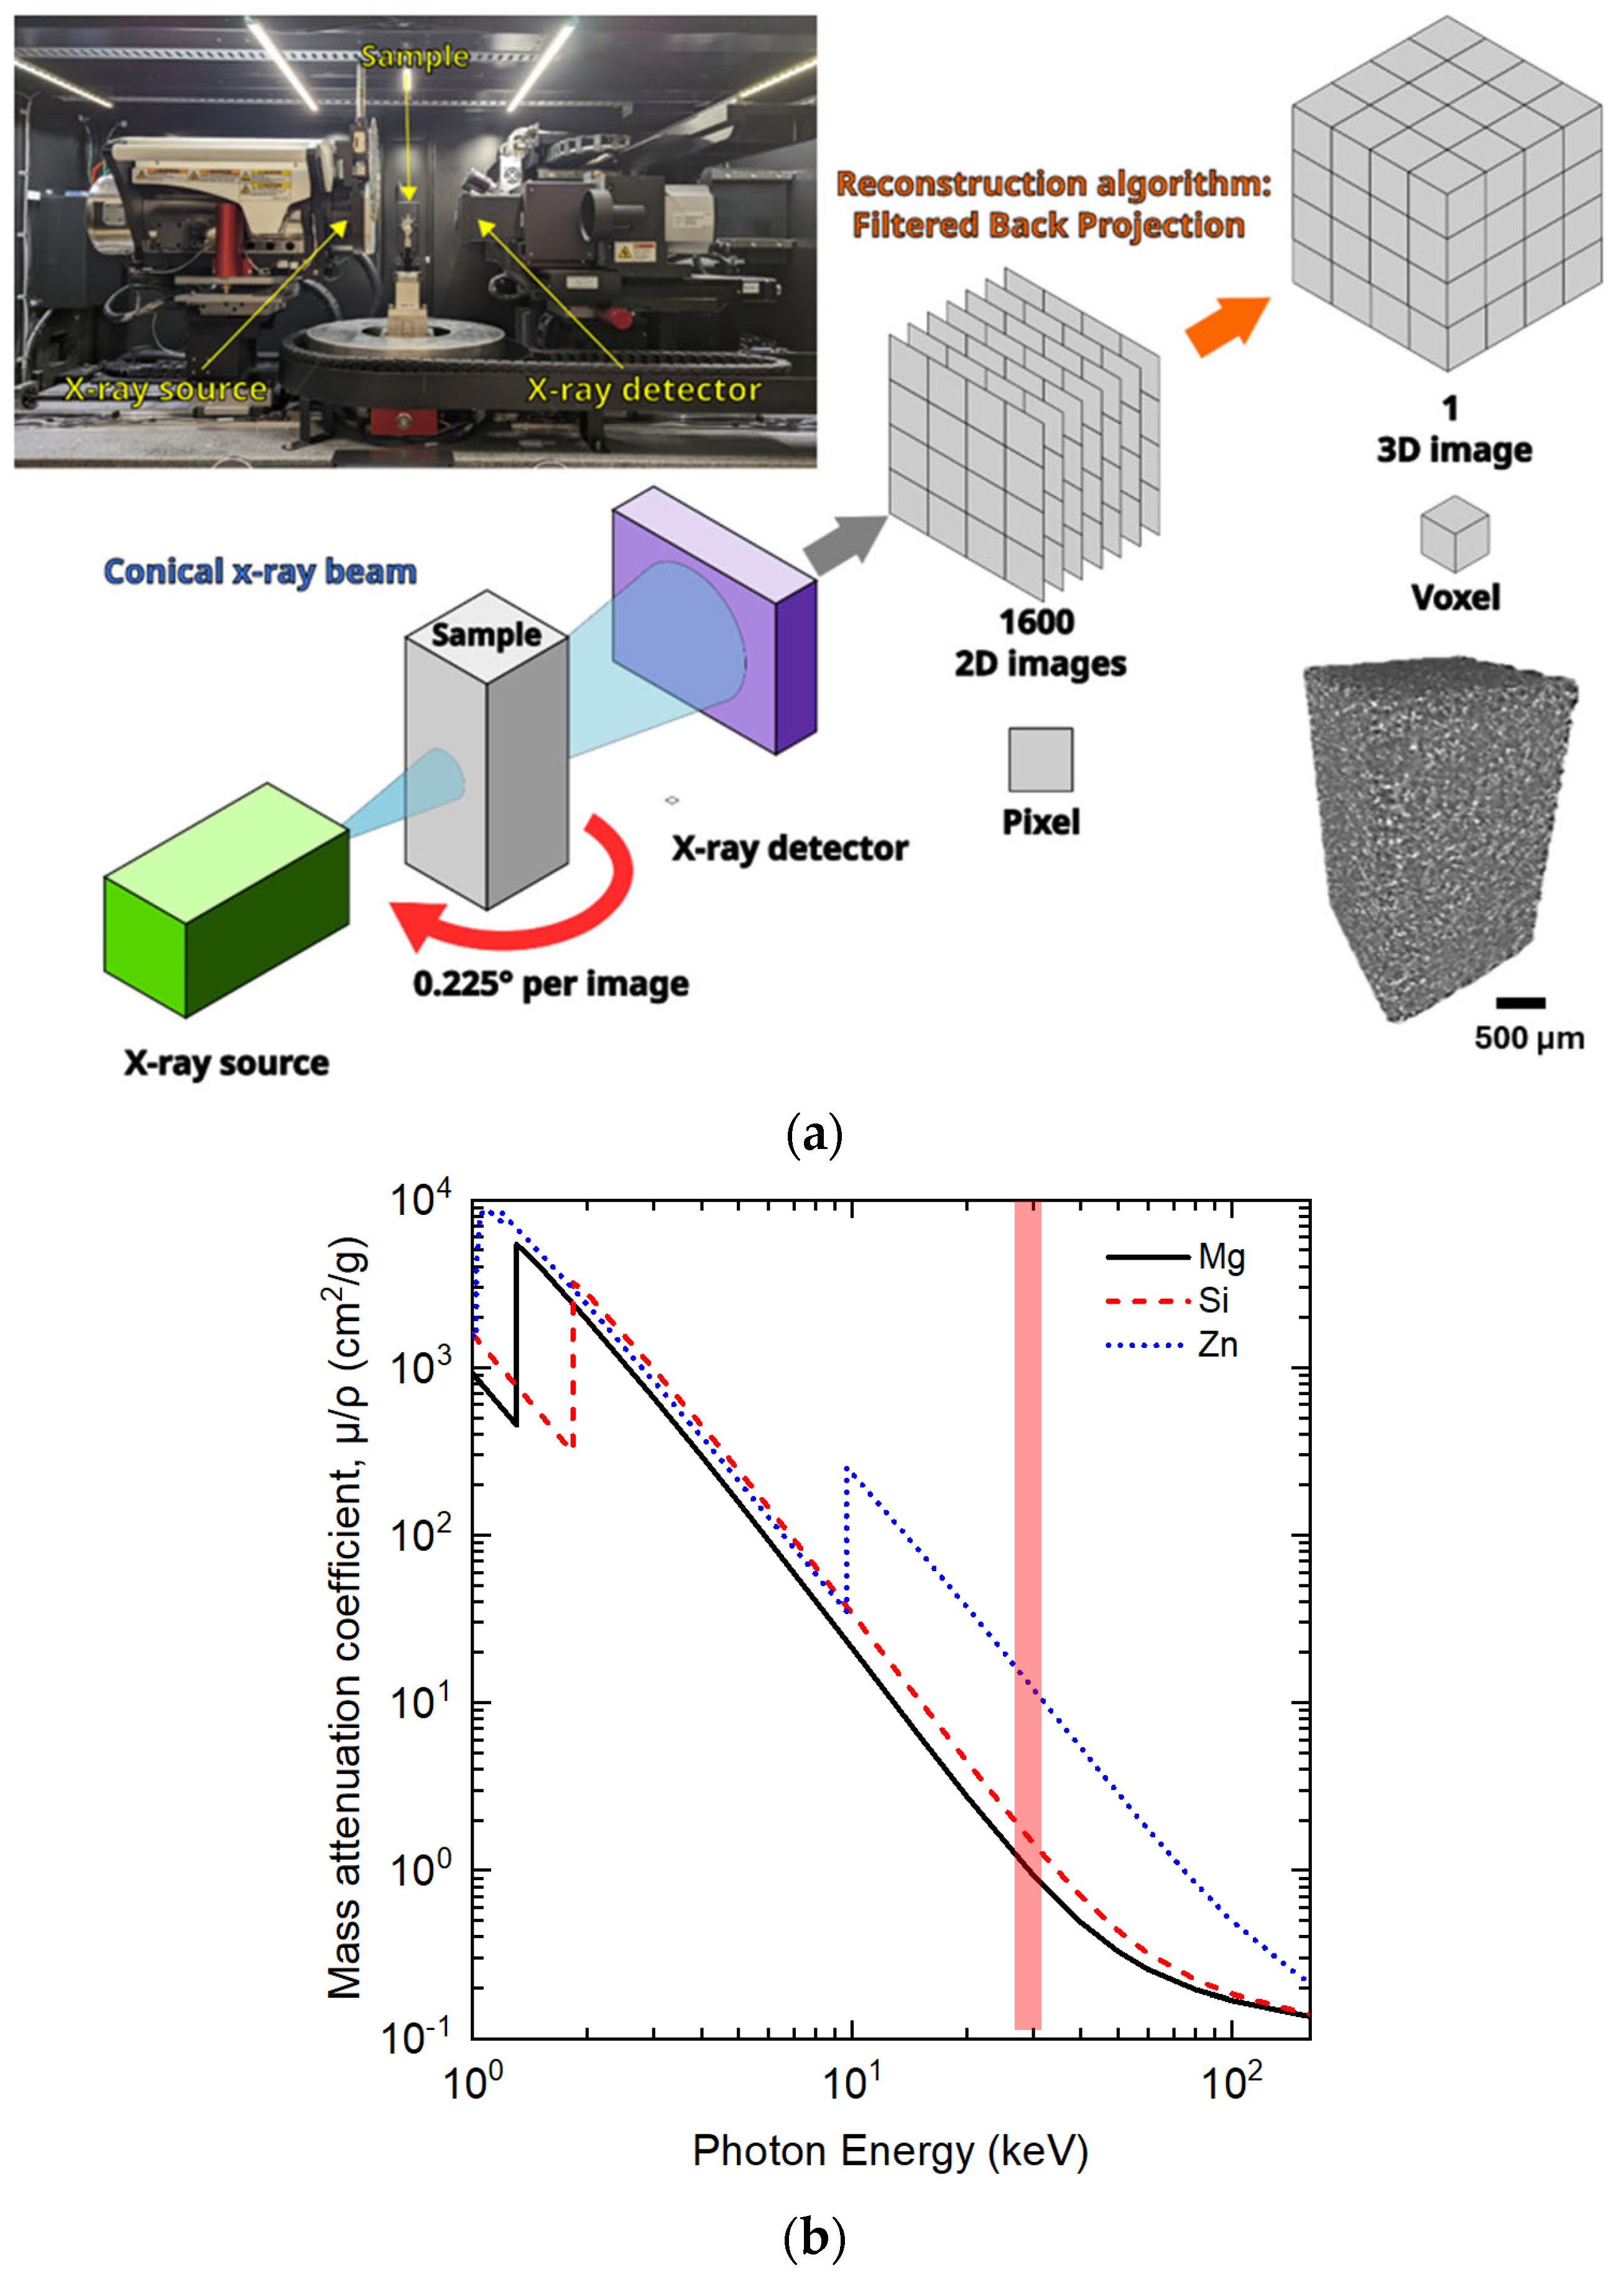
2.3. 3D Microstructural Analyses via X-ray Computed Tomography

The cuboidal samples extracted from the ingots (see Figure 2) were scanned in a lab-scale Zeiss Versa 620 (Zeiss Microscopy, Dublin, CA, USA) X-ray Microscope (XRM). The XRM was used to capture 1600 radiographic projections of the samples as it was rotated about a fixed axis of rotation (see Figure 3a). The 1600 projections were then used to obtain a 3D reconstruction of the microstructure using a filtered back projection algorithm [38]. The four samples outlined in Table 1 were scanned using an average incident photon energy of 30 keV (accelerating voltage 60 kV, and power of 10 W) to ensure maximal difference in X-ray absorptivity of the three main elements in the microstructure (see Figure 3b). Furthermore, the scans were carried out at a resolution of 0.6 µm/voxel. This ensured a high contrast between the MgZn intermetallic phase and Mg matrix. The XCT analysis of metals is a very well-established technique used to capture the 3D morphology of microstructural features non-destructively [32,35,43]. To further ensure repeatability of the particle analyses, only those particles that were larger than 200 µm3 were used in the analyses. This ensured that we had a minimum of at least 5 voxels (3D pixel) across each particle to accurately capture the morphology [43,44]. Further, note that due to the relatively small difference in the X-ray absorptivity between Mg and Si elements at 30 keV, the Mg2Si phase could not be distinguished from the matrix.

3. Results and Discussion

In this section, we first describe the expected and measured composition obtained for the alloys derived from thermodynamic simulations and XRF experiments. Subsequently, we present a thorough compositional analysis of the different phases of the material based on SEM and EDS data. Then, we present 2D information from SEM/EDS, which were used to inform the 3D XCT-based analyses of Mg–Zn intermetallic particles within the microstructure. Finally, we present a novel particle to convex hull parameter to assess the differences in the morphologies of the MgZn particles within the alloys.

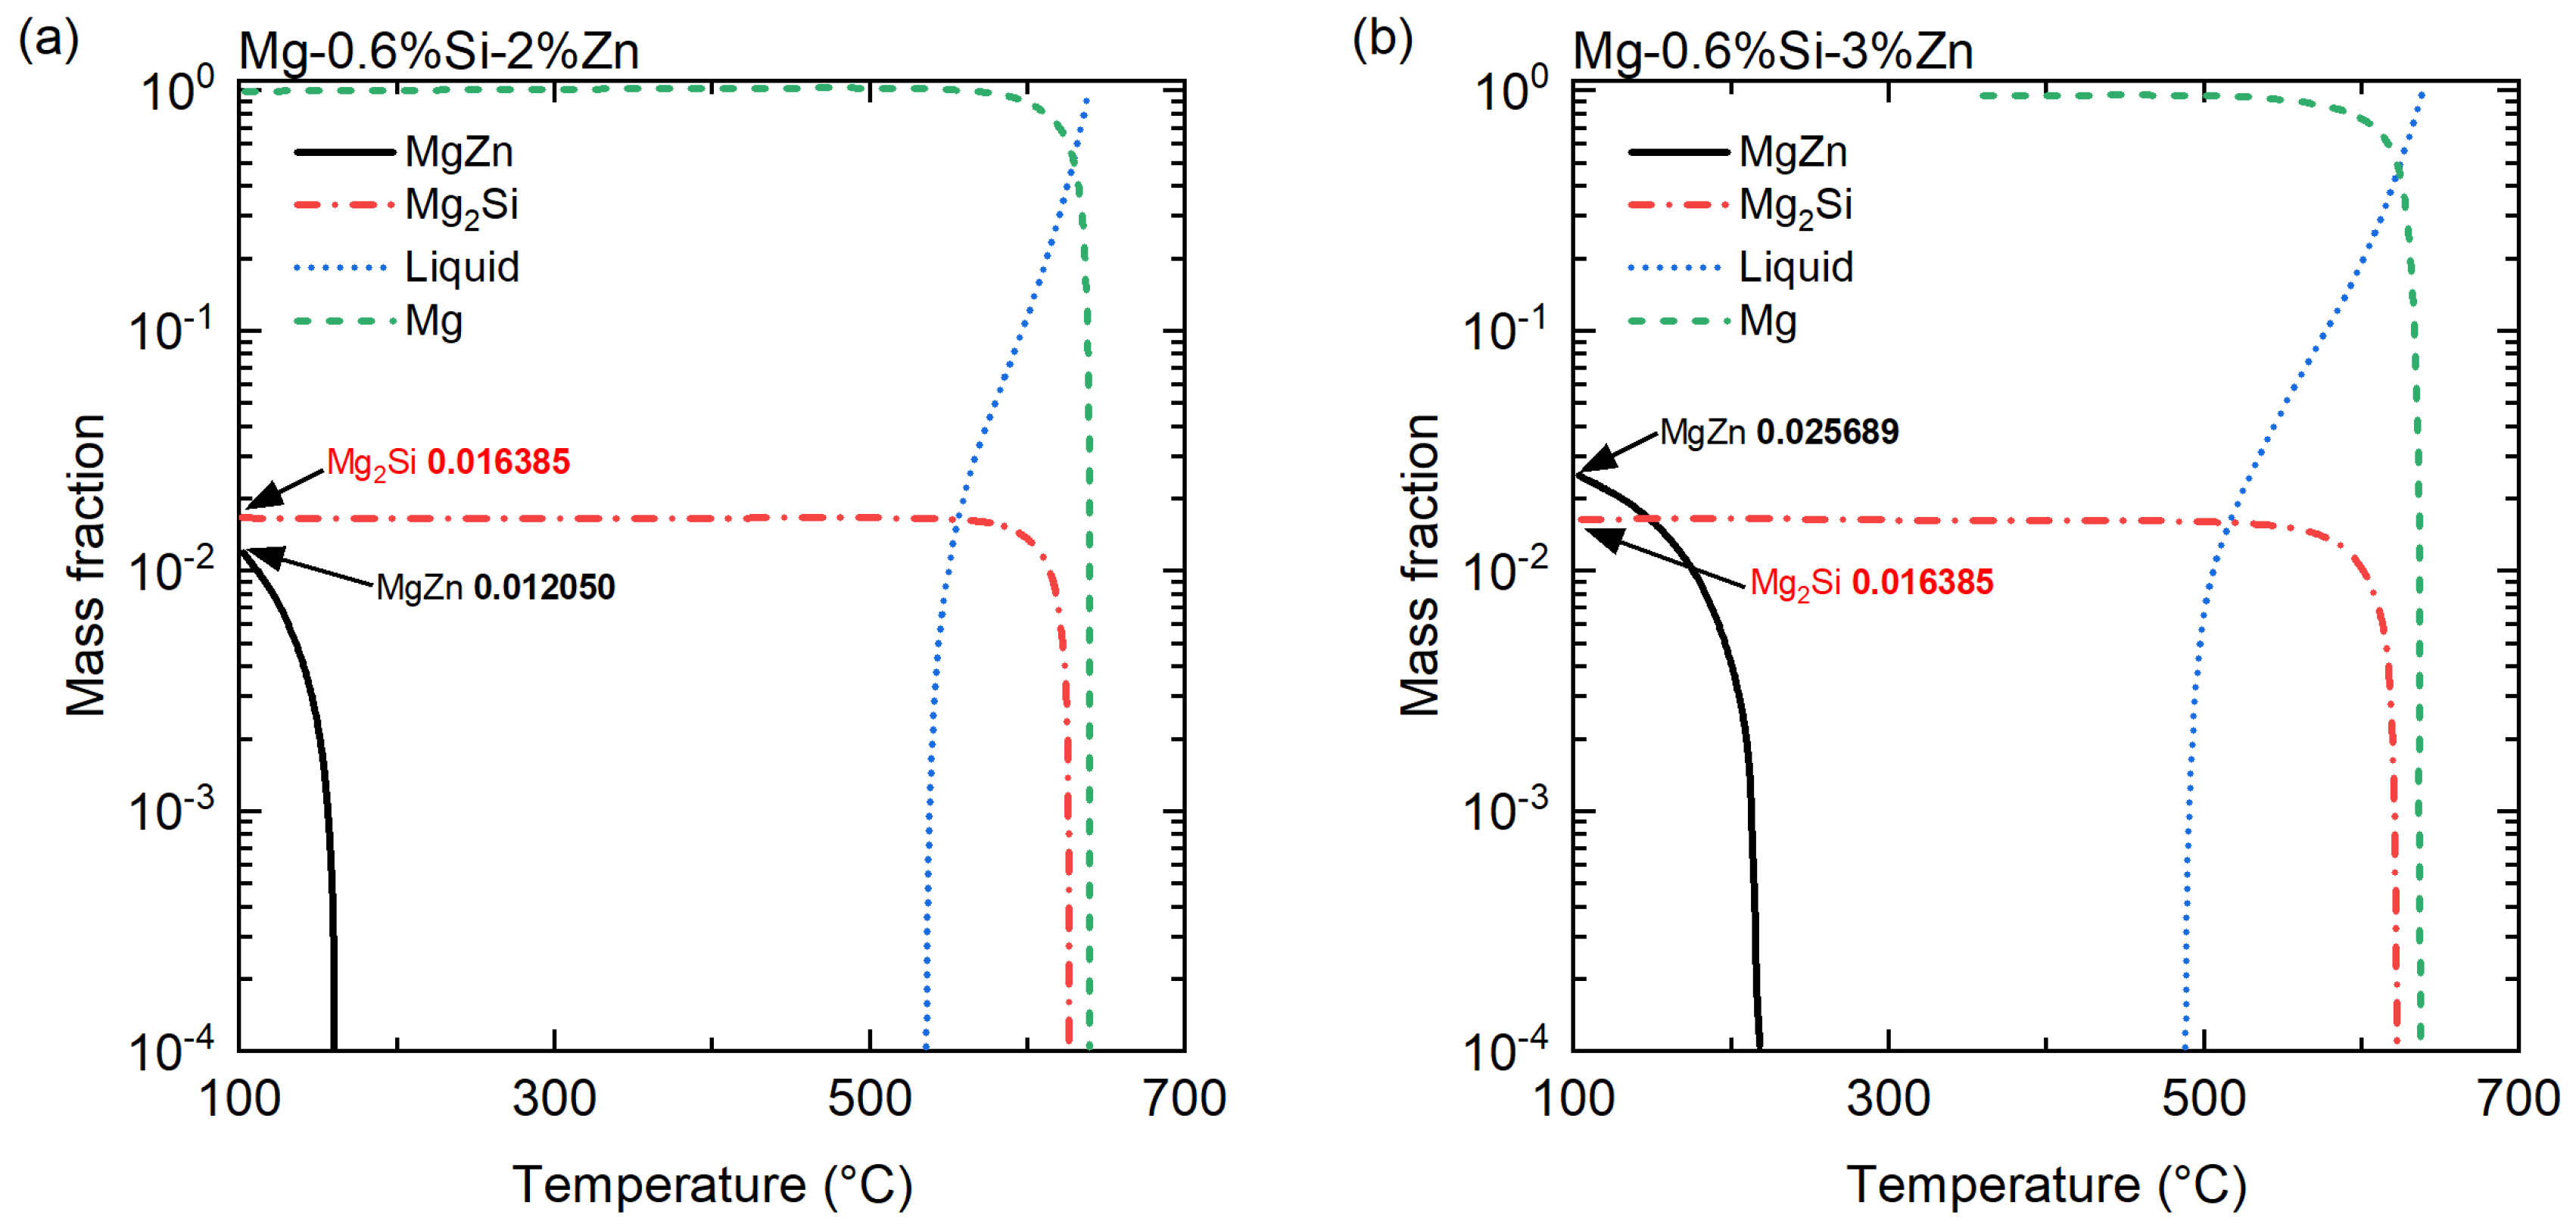
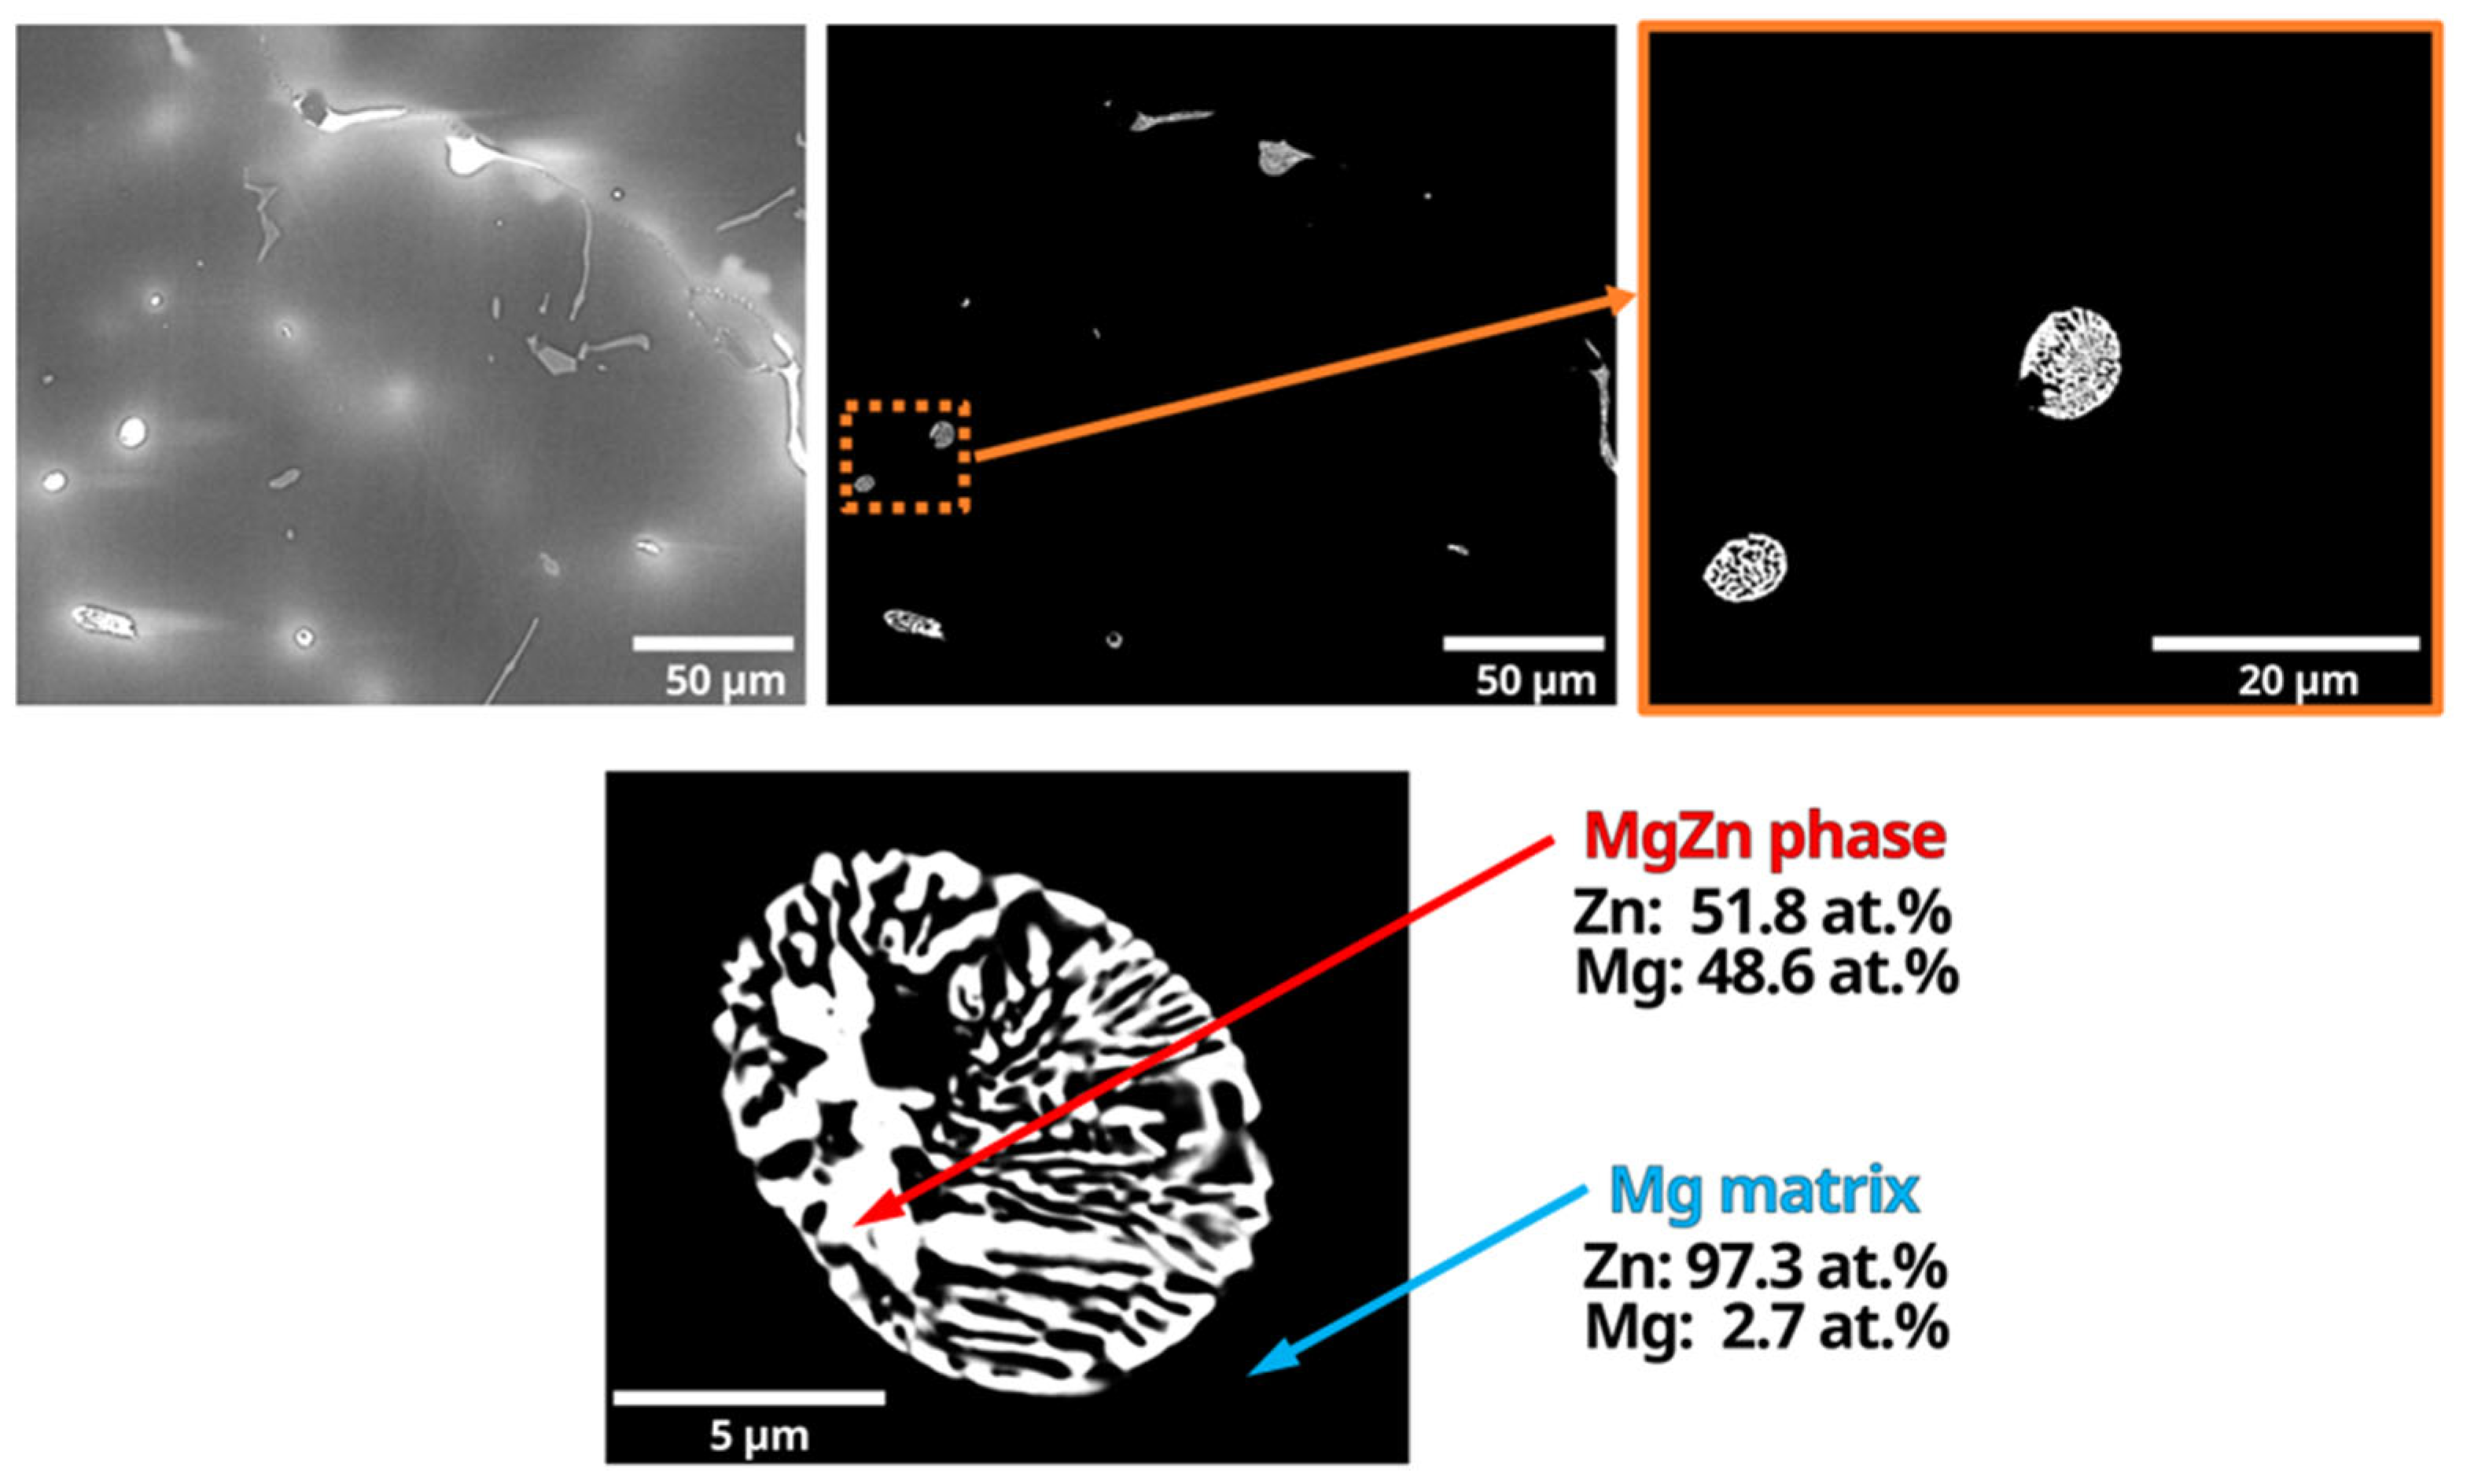
3.1. Compositional Analyses

Table 2 shows the results obtained from the XRF analysis of the samples. The composition of the samples is in good agreement with the nominal compositions, with the Zn being around 2 and 3 wt.% for the two alloys and the Si being in the 0.58–0.65 wt.% range. Additionally, Figure 4 shows results for the thermodynamic simulations of the solidification processes in the equilibrium state of the two alloy compositions. The simulation results suggest the formation of three distinct phases. As the alloy cools from the liquid state, the primary solidification of Mg is anticipated, which forms the matrix of the alloy. This is followed by the solidification of the eutectic microconstituent Mg + Mg2Si. In the final stage, the MgZn phase forms in the solid state.
Furthermore, note that while three phases (Mg, Mg2Si, and MgZn) are expected in the microstructure, we can observe the Mg2Si phase only in the SEM/EDS data, and due to limitations on the contrast between Mg and Si phases at the available X-ray photon energy, the Mg2Si phase is not clearly visible in the XCT data.
In addition to the thermodynamic simulations, SEM and EDS analyses of the alloys were also carried out. Figure 5a shows the microstructure obtained from the BSE imaging mode in the SEM with the bright regions representing the high density (Zn rich) phases (green arrow) of the microstructure and the light and dark grey regions representing the Mg2Si (blue arrow) and Mg phases, respectively. The elemental dot maps for Si, Mg, and Zn obtained from the EDS analyses are shown in Figure 5b–d, respectively, and clearly highlight the compositions of the three different phases (as predicted in the thermodynamic simulations).
Note that due to the high solubility of Zn in Mg and the low solidification temperature of the MgZn phase, under equilibrium conditions, the formation of MgZn is expected via precipitation in the solid-state Mg matrix, rather than the formation of a eutectic structure [27]; however, under non-equilibrium conditions, the MgZn phase tends to appear in its eutectic form (as seen in Figure 6). In the binary Mg–Zn system, under non-equilibrium conditions, we can expect to observe a partition coefficient (K) (ratio of concentration of Zn in the solid state to the concentration of Zn in liquid state) smaller than 1, indicating that a significantly higher concentration of Zn exists in the liquid phase compared to the solidified Mg phase, ahead of the solid/liquid interface [45,46,47]. In the final stages of solidification, the concentration of Zn can increase to near eutectic composition (51.3 wt.% Zn), leading to the formation of a eutectic microconstituent in the last regions of liquid remaining within the material. This can explain why we see the eutectic form of MgZn in these Zn-rich phases of the microstructure. For simplicity of nomenclature, we refer to these Zn-rich eutectic particles as MgZn particles throughout the manuscript.
Higher-magnification images, shown in Figure 6, also clearly reveal the eutectic nature of the MgZn particles. Furthermore, point-EDS analyses clearly show that the MgZn particles have a MgZn phase with islands of Mg in between. While compositionally interesting, the overall morphology of these MgZn particles is not studied to a great depth in the literature, especially in 3D. What appears as a simple collection of particles in a 2D SEM image may be a part of a larger network of MgZn particles. Therefore, to better understand the morphology of such particles, it is imperative to capture the particle morphology in 3D. In the subsequent sections, we discuss the morphology of the intermetallic particles obtained using XCT and propose a pair of novel particle morphology parameters to quantify their shape in 3D.

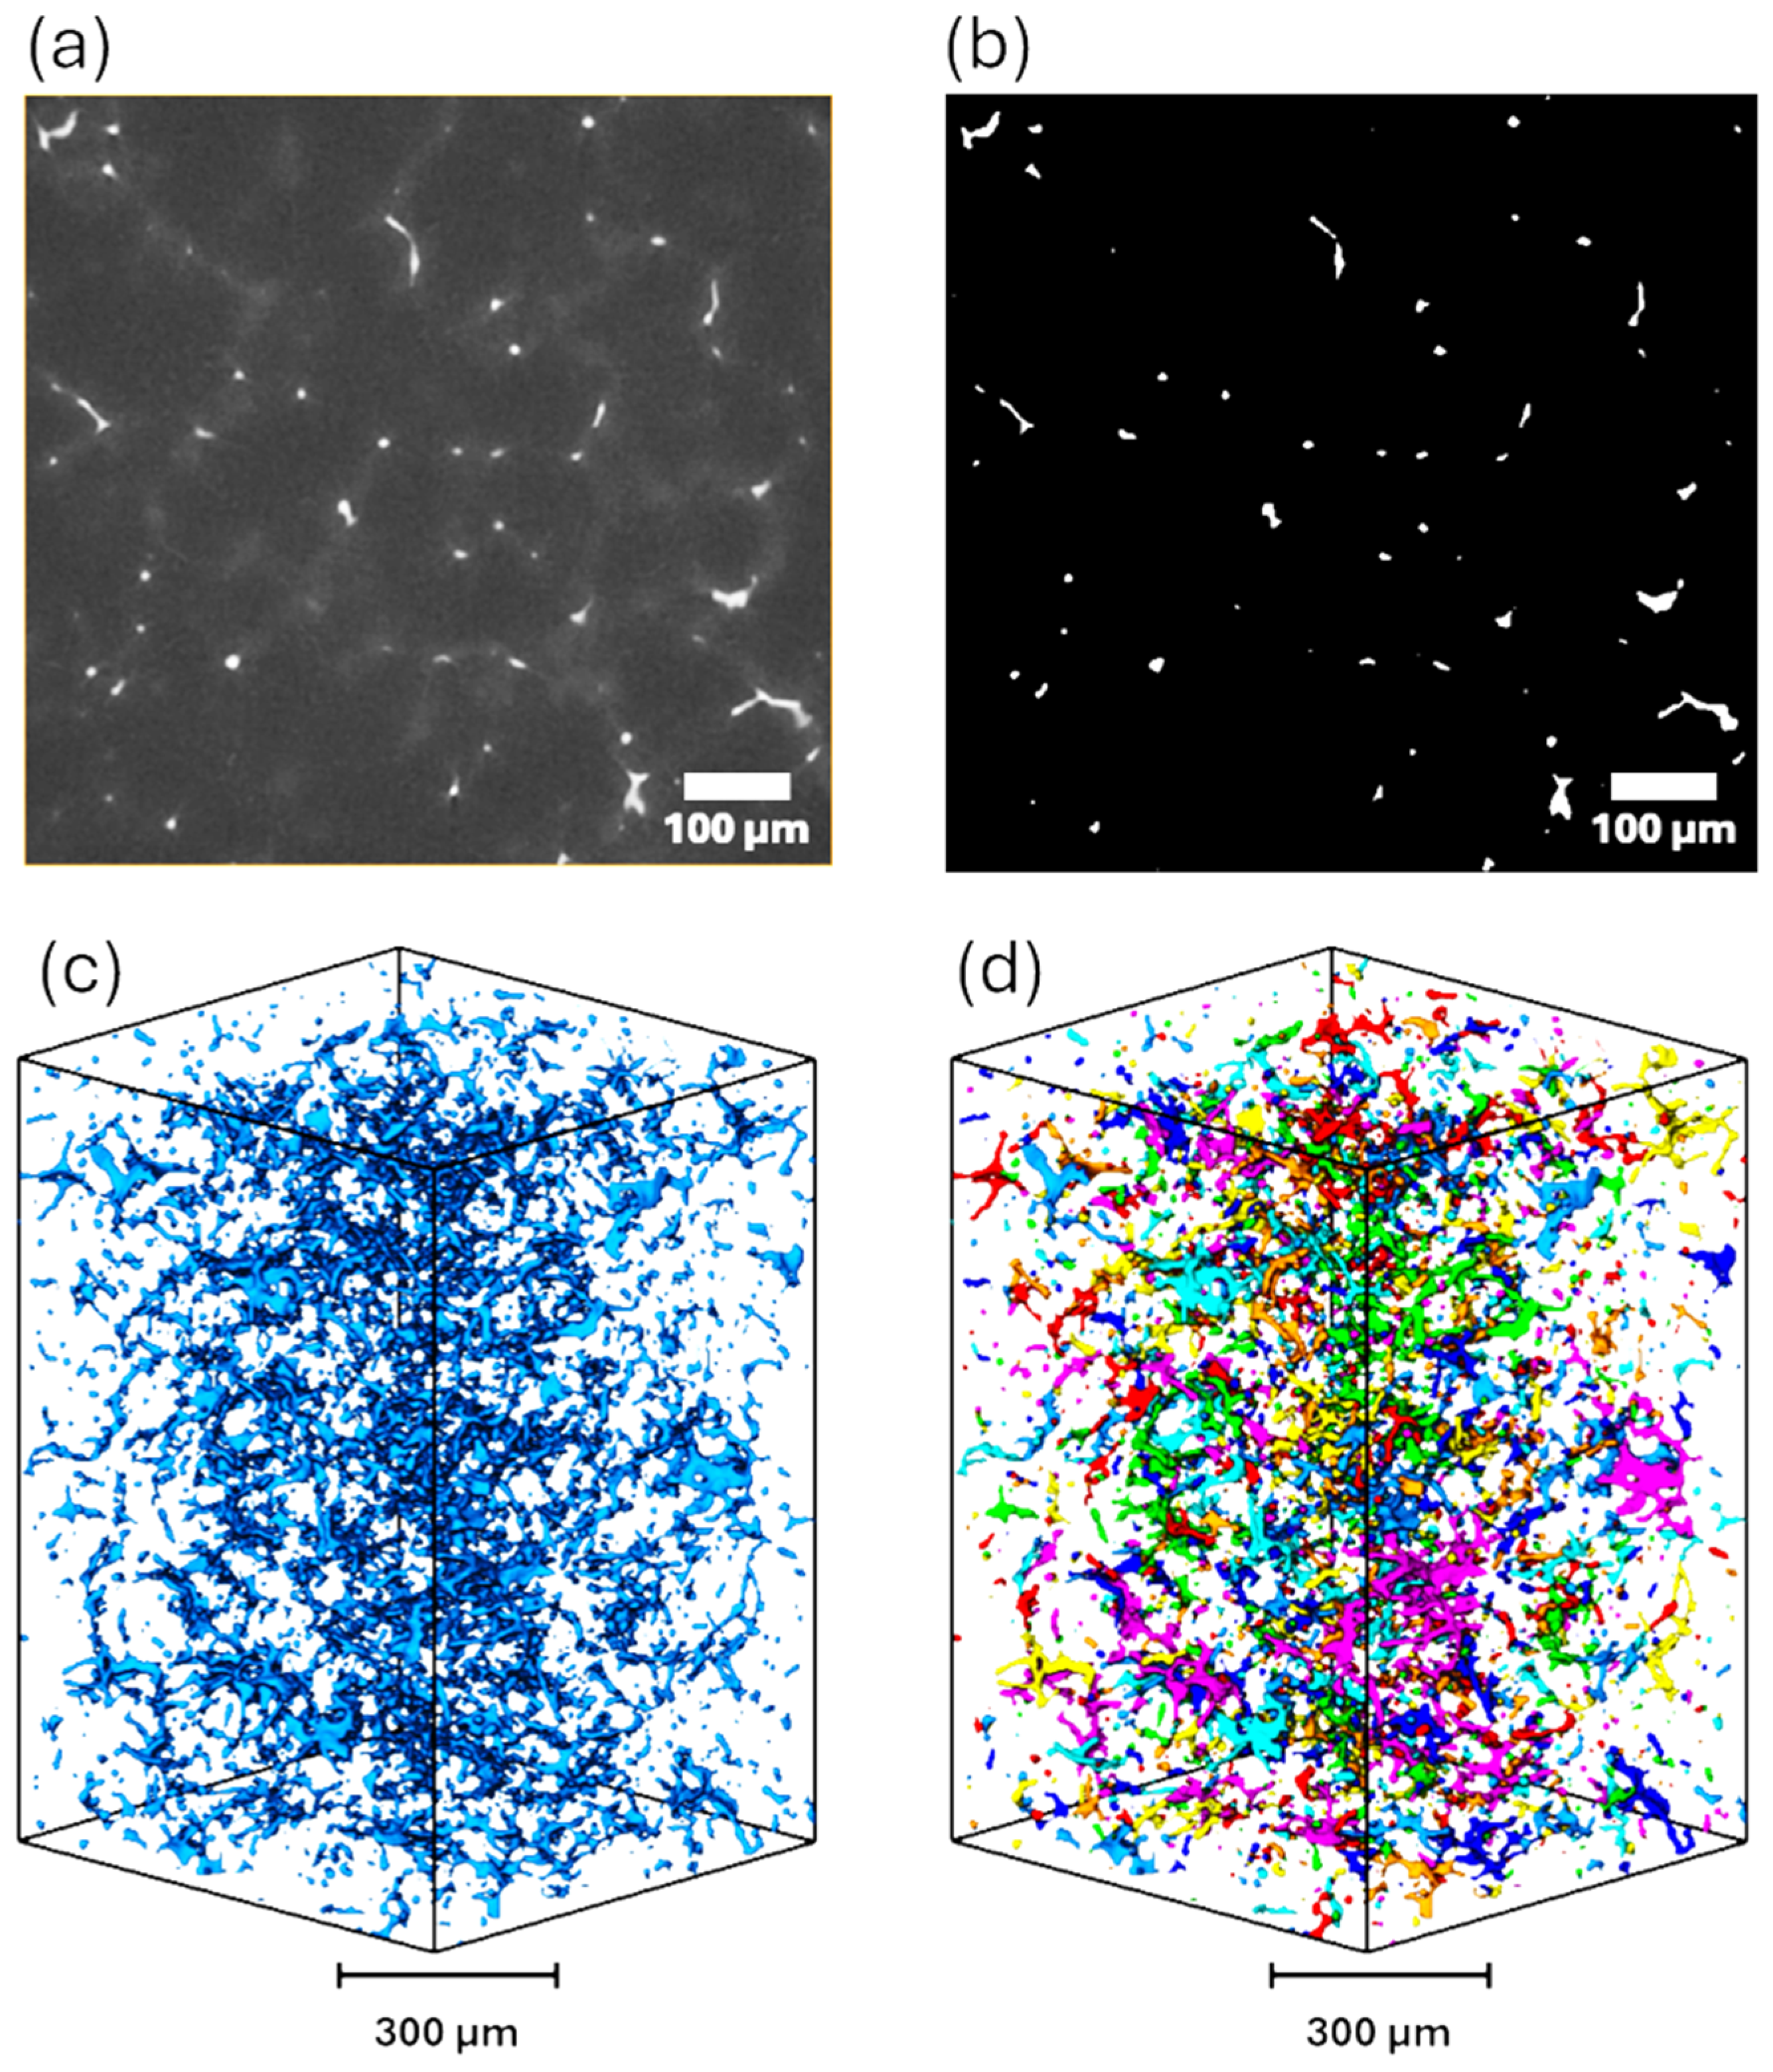
3.2. Microstructural Analyses Using X-ray Computed Tomography (XCT)

A cross-sectional view of the 3D tomography data is shown in Figure 7a, where the brighter regions represent the MgZn phases, while the darker regions represent the Mg matrix (and the Mg2Si intermetallics). As in the SEM image, the XCT data clearly show the MgZn phase; however, unlike the SEM data, the XCT technique provides important 3D tomographic data for the MgZn phase.
Once the 3D tomographic data were captured using the XRM, they were further analyzed to separate the MgZn intermetallics from the matrix using a simple grey-scale thresholding technique to make a binary (black and white) image, as shown in Figure 7b. The binary image shows the MgZn intermetallics in white and the Mg matrix and Mg2Si phase in black. Figure 7c shows a 3D rendering of the MgZn particles in blue; in the 3D rendering, we can clearly see the complex interconnected networks of MgZn intermetallic particles that dominate the microstructure of the alloy. After the binarization, a watershed-based segmentation process [43,44,48] followed to obtain individual MgZn particles in the scanned samples in 3D, as shown in Figure 7d. These individual particles appear as large, separated networks of MgZn intermetallics within the alloy. The different colors in Figure 7d are only used to represent the individual MgZn intermetallic particles. These individual particles were then further analyzed to obtain the novel morphological parameters discussed in the subsequent sections.
When seen individually, the MgZn eutectic intermetallic particles show a wide range of particle morphologies. Figure 8 shows extreme examples of the MgZn particles that are found in the samples. Smaller MgZn intermetallic particles exist in the form of spherical particles ~5–20 µm in diameter, while larger particles exist in the form of a complex 3D network of nodes and branches. When casting these alloys, the morphology of these intermetallics becomes quite important [43]. Consider a large particle, such as the one shown in Figure 8b. Such a complex particle can influence a large region in the matrix—volumetrically much larger than the particle itself. Furthermore, consider, for example, the effect of a large versus a small particle on the corrosion resistance of the alloy. The acceleration of galvanic corrosion occurs near the interface between the Mg and MgZn phases. This can lead to increased local corrosion and reduced corrosion resistance if these interfaces are abundant and interconnected throughout the material. For smaller particles, such as the one shown in Figure 8a, local interfacial corrosion is expected, which may result in the separation of the intermetallic from the Mg matrix without significant damage to the matrix. However, as the complexity of MgZn particles increases, a larger interconnected interfacial area comes in contact with the matrix. This interconnection enhances localized corrosion in regions where these more complex phase morphologies occur [7,22,27,28,29,49,50].
Therefore, to quantify the spread of the MgZn intermetallic particles, and their complex morphology, a suitable parameter is needed. While there are many 3D particle shape parameters available in the literature [30,31,32,33,34,35,36,37,38,39,40,41], these often fall short in capturing the complex morphology and spread of the particles. For example, parameters such as the equivalent spherical diameter (diameter of a sphere with the same volume as that of the particle), the bounding box (smallest cuboidal that encompasses the entire particle) volume, and Feret diameter (distance between two parallel planes bounding the particles) can capture the size of the particle; however, the complex network-like morphology is elusive to these parameters [30,31,32,33,34,35,36,37,38,39,40,41,43].
To better capture the shape and morphology of the particles, consider the concept of a convex hull. For a set of points on a plane, the convex hull is the smallest polygon that completely encompasses the points [51]. For a 3D particle, the convex hull is defined as the smallest convex polyhedron (all interior angles are less than 180°) that encloses the entire particle. In the context of the complex particle shown in Figure 8b, it represents the “volume of influence” of the particle to an extent. Furthermore, unlike the bounding box, the convex hull can more accurately capture the volume of the matrix that the particle influences (either mechanically or chemically). For a simple particle such as a sphere or an ellipse, similar to the particle shown in Figure 9a, the convex hull is very similar to the outer surface of the particle. In contrast, for the complex particle shown in Figure 9b, the convex hull takes the form of a large surface that encompasses a volume much larger than that of the particle itself.
Therefore, an elegant approach to distinguishing the smaller particle, with the more simple morphology, from the larger particle, with the more complex morphology, would be to take the ratio (p) of the particle volume to the volume encompassed by the convex hull [43]. The larger particles with the more complex morphology will have a small value of p, whereas the smaller particle with a simpler morphology will have a large (close to 1) value of p.
Furthermore, if we consider the shape of the convex hull—as quantified by the sphericity of the convex hull (s)—we can also derive an indication of the anisotropy of the shape of the complex particles. Sphericity is a measure of how closely the shape of an object resembles the shape of a sphere. It is defined as the ratio of the surface area of a sphere with the same volume as the object to the surface area of the object [52]. Note that for particles with simple shapes, the s value will be very close to the sphericity of the particle itself. In contrast, for particles with more complex morphology, a high s value will indicate mostly an isotropic formation mechanism, while a particle with a low s value will indicate a particle that has developed with some directionality. When compared to the volume of the particles, p and s can give an indication of the complexity of the particle’s morphology as well as the anisotropy of the solidification of the particles, respectively.
Therefore, these two parameters—particle of convex hull ratio (p) and convex hull sphericity (s)—can be used to capture the variation in particle morphology within the samples. In the next two sections we quantify how these two parameters can be used to capture the morphology of MgZn particles for the compositions studied in this work, as well as quantifying the impact of cooling rate using these particle parameters.

3.2.1. Impact of Composition

Figure 10a shows the correlation between the particle-to-convex hull volume and the particle volumes for the two alloy compositions studied in this paper. The cooling rate for the two compositions is kept the same (0.44–0.48 °C/s) to enable a fair comparison. From the plot in Figure 10a, we can see that for very small particle volumes (<1000 µm3), the particle-to-convex hull volume ratio (p) is quite high. This is indicative of very simple particle morphologies (ellipsoidal or spherical), like the one shown in Figure 10a. However, as we consider particles with volume in the range of 1000 to 10,000 µm3 we see a gradual drop in the p ratio—indicating that the particles are becoming more complex and the volume of influence of the particle is becoming much larger than the volume of the particle itself. Furthermore, note that despite the difference in the composition of the particles, the range in which the p drops, as well as the range to which the p drops, is comparable for the two compositions. The alloy with 3 wt.% Zn has larger particles, which is expected due to the larger weight fraction of Zn.
The different morphologies of particles corresponding to the different size ranges for the 2 wt.% and 3 wt.% Zn alloys are shown in Figure 10b,c. As hypothesized, the smaller particles in the distribution (~1000 µm3) are mostly simple in shape and exist as ellipsoids or spheres. In the transition zone (1000 to 10,000 µm3), we see that the particles show an increased affinity for branching and a general increase in complexity of the network. Finally, for larger particles (>10,000 µm3), we see a stabilization of the p ratio to 0.05–0.1 with the particles forming very complex networks, as indicated by the examples in Figure 10b,c.
The trend of decrease in p clearly indicates that larger MgZn particles in the alloy form more complex morphologies than simpler ones (spheres and ellipses). This trend can be explained as a direct outcome of the solidification path of the alloys studied in this research. Solidification in this case begins with the crystallization of Mg in the form of dendrites. This is followed by the segregation of Zn and Si into the liquid phase. Subsequently, the eutectic microconstituents (Mg + Mg2Si) form in the interdendritic regions, starting from the Mg dendrites that serve as substrates for the onset of solidification. Finally, the last portions of the liquid phase reach the eutectic composition (Mg-Zn + Mg), leading to the formation of MgZn eutectic particles. Therefore, the complex morphology of the MgZn eutectic particles is influenced by the previously solidified dendritic structures of Mg and the eutectic components formed in the interdendritic regions.
In contrast to the p values, which give information about the complexity of the particle morphology, if we consider the sphericity of the convex hull around the particle, we can get insights into the spatial distribution of the complex network of the MgZn particles. For example, if the sphericity of the convex hull is low (<0.5), it may indicate that the MgZn particle had developed in an anisotropic manner (i.e., in the present case, the liquid phase in between the Mg dendrites was more anisotropically distributed). However, if the sphericity of the convex hull is high (>0.5), it may indicate that the particle had developed in a more isotropic manner—either because the particle was small or because the liquid phase in between the Mg dendrites was more isotopically distributed. Consider the schematic shown in Figure 9. The particle shown in Figure 9a has a high sphericity of convex hull compared to the particle shown in Figure 9b. In the case of the particle in Figure 9a, we can see that the particle has developed in a more isotropic manner, while in the other case, we can see that the particle with the complex morphology has developed in a more anisotropic manner. Furthermore, note that complex particles can also have a more isotropic spatial distribution, as shown in Figure 9c. Given that the shape of the MgZn particles is dependent on the solidified shape of the Mg matrix, it can be expected that smaller particles will have more spherical isotropic shapes, while larger particles will approach an anisotropic shape upon solidification as nearby MgZn liquid phases coalesce with each other as they solidify. However, for very larger particles, the overall s value can be expected to depend on the inherent anisotropy of the liquid phase in between the solidified Mg dendrites.
Figure 11a shows the variation in the convex hull sphericity as a function of particle volume in the 2 wt.% and 3 wt.% Zn alloys. As expected, the smaller particles have a higher convex hull sphericity (s), while the larger particles have a lower s value. This may indicate that as the particles become larger, they undergo more anisotropic growth (see Figure 11b,c). However, for the very large particles in the 3 wt.% Zn alloy, we see an increase in the s with the increase in size larger than 10,000 µm3, suggesting that as the particles reach a certain threshold, the growth tends to become more isotropic. This trend seems to be clearer in the 3 wt.% Zn alloy, which has larger MgZn particles. The initial conditions for the occurrence of this phase suggest that reductions in the cooling rate and/or increases in the percentage of Zn will lead to an interconnected isotropic network of Mg–Zn microconstituents [27,29].

3.2.2. Impact of Cooling Rate

Figure 12 and Figure 13 show, respectively, the impact of the cooling rate on the distribution of the p ratio and the convex hull sphericity (s) as a function of particle sizes. From the plots we can see that the trends observed for the different compositions (Figure 10 and Figure 11) hold true for the different cooling rate samples as well. With a faster cooling rate, the size of the largest particle size decreases, but the trends of the decrease in p ratio and s in the 1000–10,000 µm3 size range still hold true. As previously discussed, the shape and structure of regions rich in Zn are significantly influenced by the dendritic structures of Mg and the eutectic components that form within the already solidified regions between the Mg dendrites. When there is a small volume of liquid present with a eutectic composition, it tends to take on a more spherical shape, as indicated by the data (see Figure 10). However, as the local volume of the Zn-rich liquid increases, the morphology becomes more complex. This complexity reflects the earlier stages of the solidification process, where the shape of the liquid is molded by the surrounding Mg structures that have already solidified. The similar trends observed in particle morphology at different cooling rates are attributed to the similarity of dendritic structures within the cooling rate range of 0.44 °C/s to 1.44 °C/s, as indicated by the minimal variation in dendritic spacing reported by Gouveia et al. [42].
Further, looking closely at the dependency of the value of p on composition as well as the cooling rate, the data seem to have a tri-linear trend. Based on the results shown in Figure 9a and Figure 11a, after the initial plateau in p at 0.68 that lasts until a particle volume of 1000 µm3, the p value starts to drop with increases in particle volume. This drop in p with increases in particle volume is arrested as the particle becomes larger than 10,000 µm3 in volume. For particles larger than 10,000 µm3 in volume, the p ratio becomes relatively stable at around 0.05, with a slight tendency to decrease with increases in particle volume. A simple regression of the data between 1000 and 10,000 µm3 particle volumes shows that this linear part of the semi log graph can be approximated by the equation
p = −0.63 log10 (v) + 2.57
where v is the volume of the particle in µm3, and p is the particle-to-hull volume ratio in decimal units. While these values seem to be consistent between the alloys and solidification conditions followed in this research, they may change as the developed morphometric parameters are applied to other compositions and solidification conditions.

4. Summary and Conclusions

In this paper, we have presented a comprehensive study of the Mg–Zn–Si alloys’ microstructure in 3D using X-ray Computed Tomography, electron microscopy, and computational image analyses. The quantification of the complex morphology of intermetallic particles is a challenging task and has significant implications for the micromechanical properties of the alloys. However, 2D characterization techniques and simple 3D morphometric parameters based on 3D particle volume and aspect ratios often fall short in capturing the complex 3D morphology of these intermetallics. Therefore, with a focus on the quantification of morphologies of the MgZn intermetallic particles in 3D, we presented two 3D particle morphology parameters—particle-to-convex hull volume ratio and convex hull sphericity—to quantify the complex morphology of the MgZn intermetallic particles in the biocompatible Mg–Zn–Si alloys. Furthermore, we have presented data on the correlation between particle morphology and particle size, using these new parameters, and showed that both cooling rate and Zn content only slightly influence particle morphology distribution within the analyzed parameters. The main findings of the study are as follows:
(1)
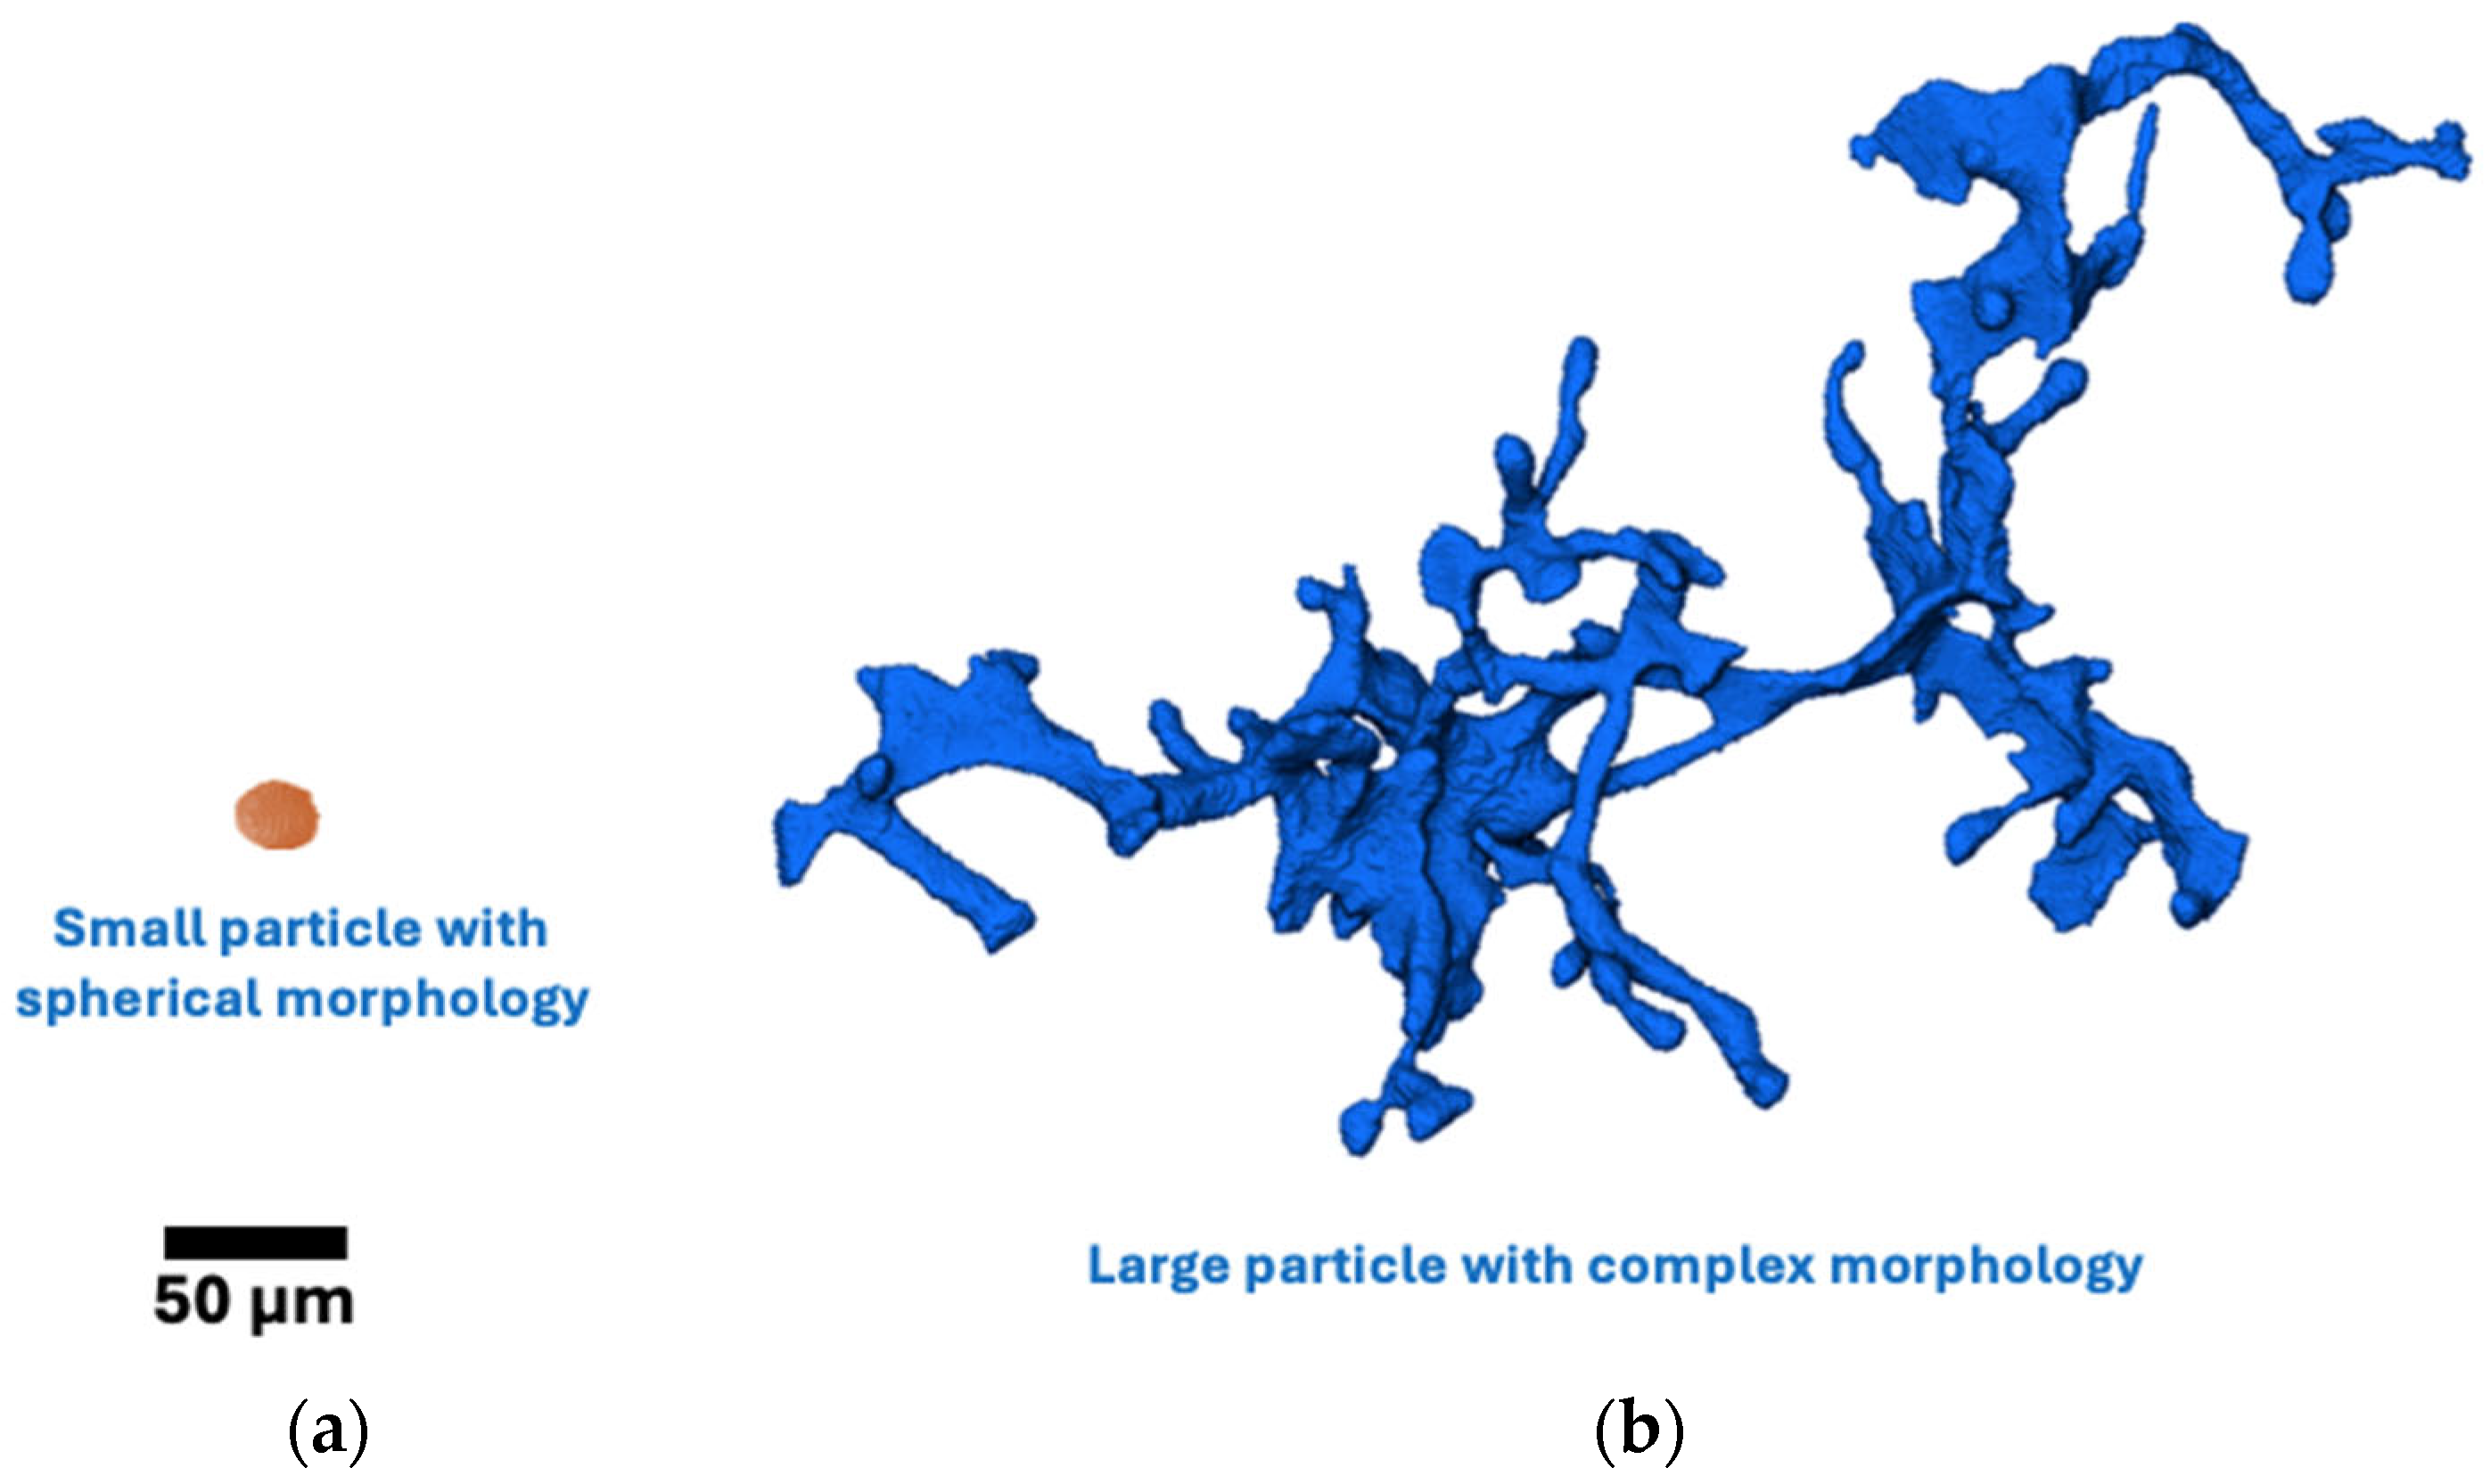
The results demonstrate a tendency for the formation of a greater number of large particles with complex interconnected morphologies as the cooling rate decreased and Zn content increased. Cooling rate and Zn content very slightly influence the particle morphology distribution of MgZn eutectic particles within the analyzed parameters;
(2)
SEM and EDS analysis also revealed that these MgZn particles consist of the eutectic microconstituent Mg-MgZn, rather than solely MgZn as previously reported in the literature. This discovery offers a new perspective on the composition of MgZn particles in these alloys;
(3)
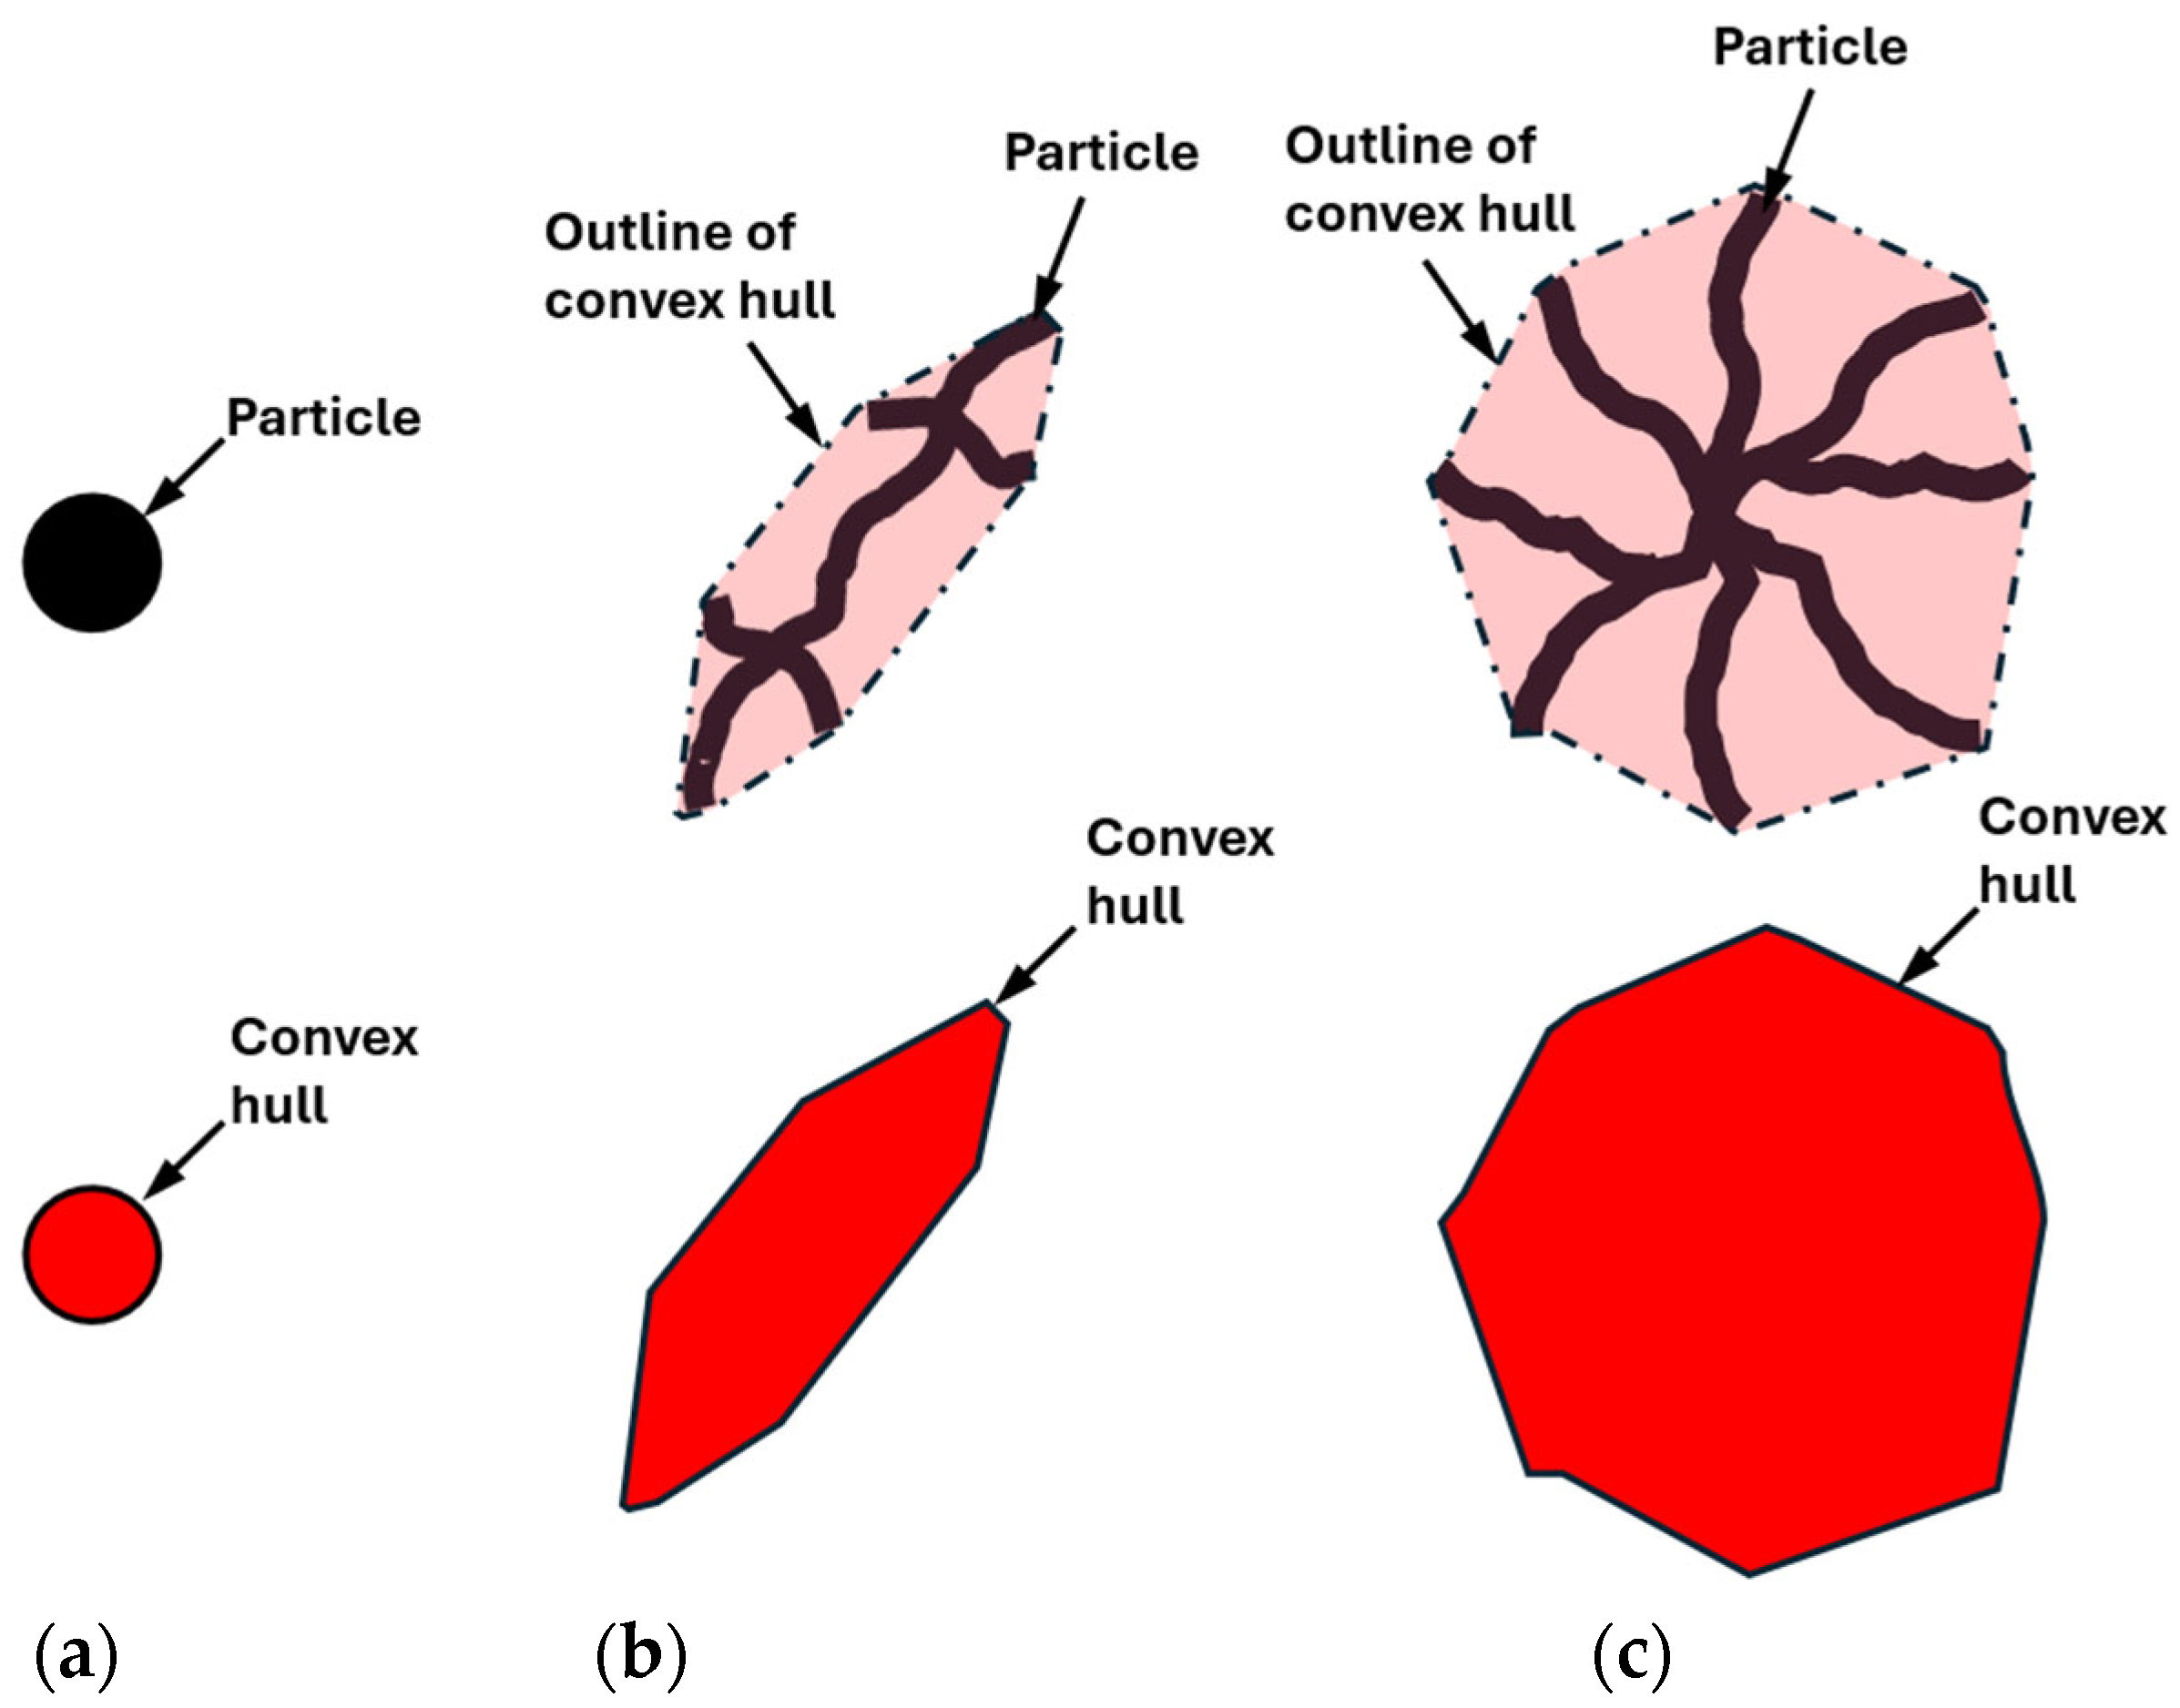
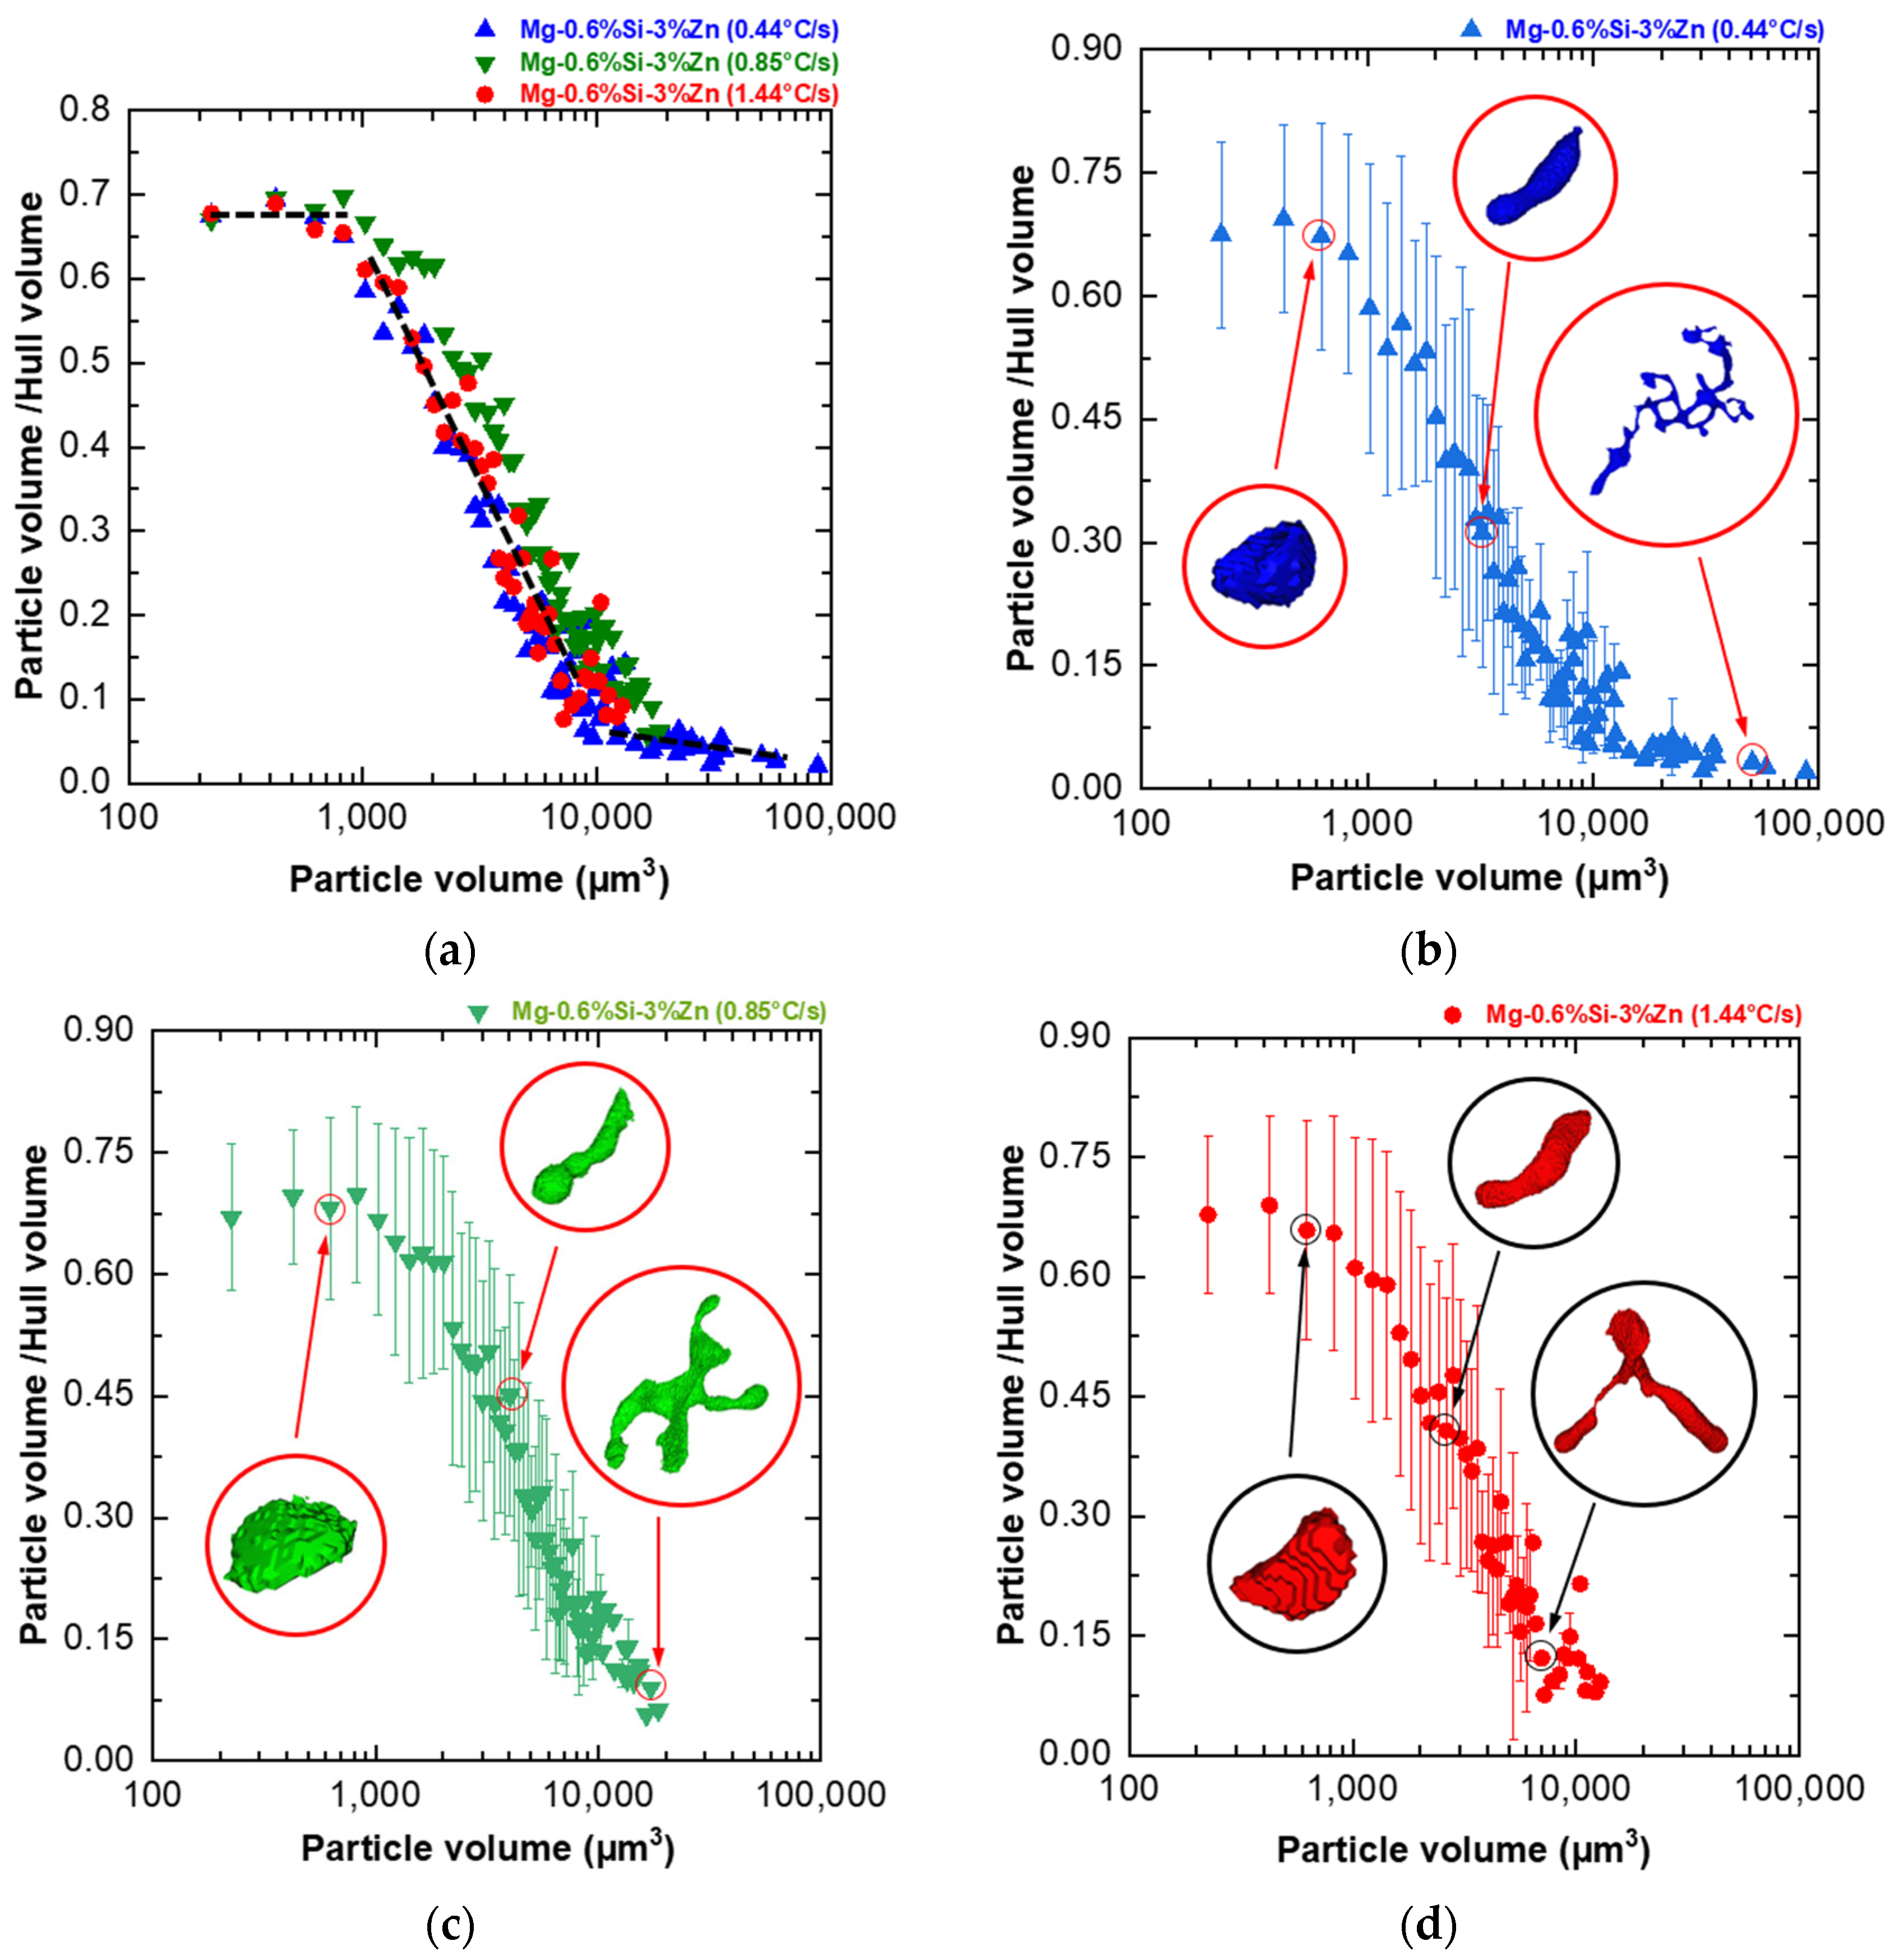
A novel particle-to-convex hull ratio (p) was used to quantify the morphology of the different MgZn eutectic particles captured. Smaller particles were found to have simpler morphologies (high p value), while larger particles were found to have more complex morphologies (low p values). Furthermore, it was found that the drop in the p value for the alloys studied in this paper always occurred in the 1000–10,000 µm3 volume range;
(4)
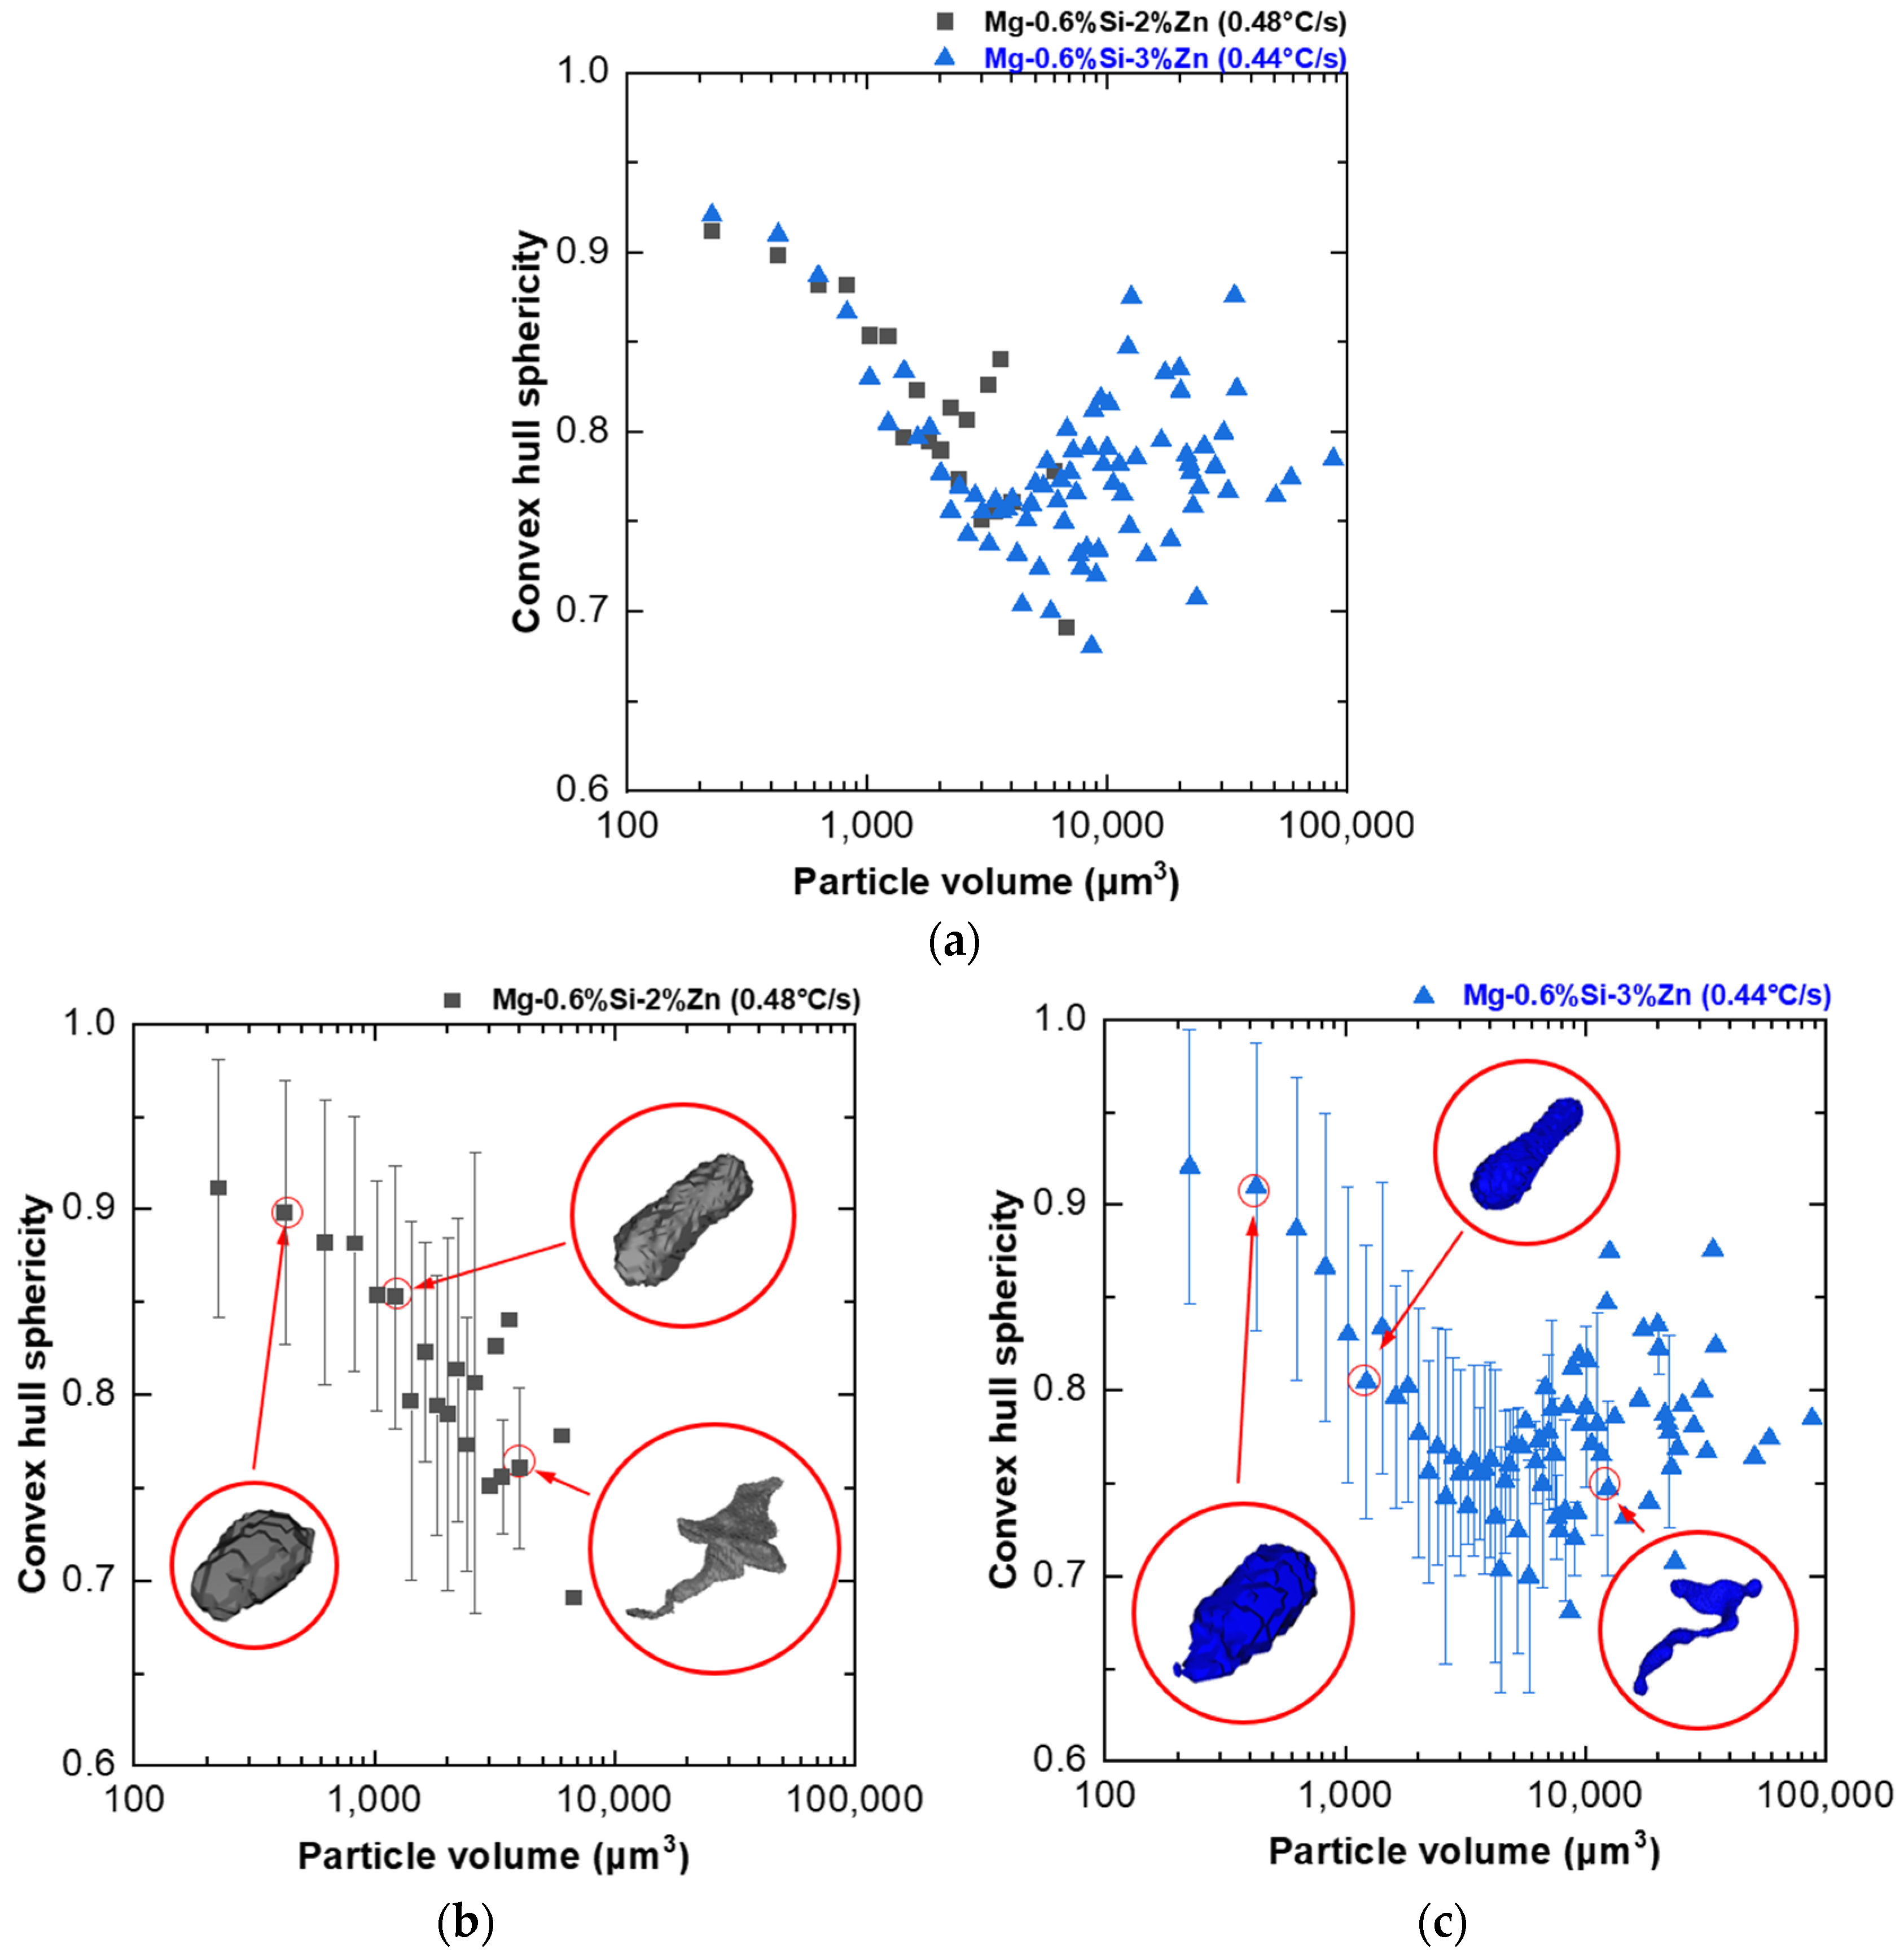
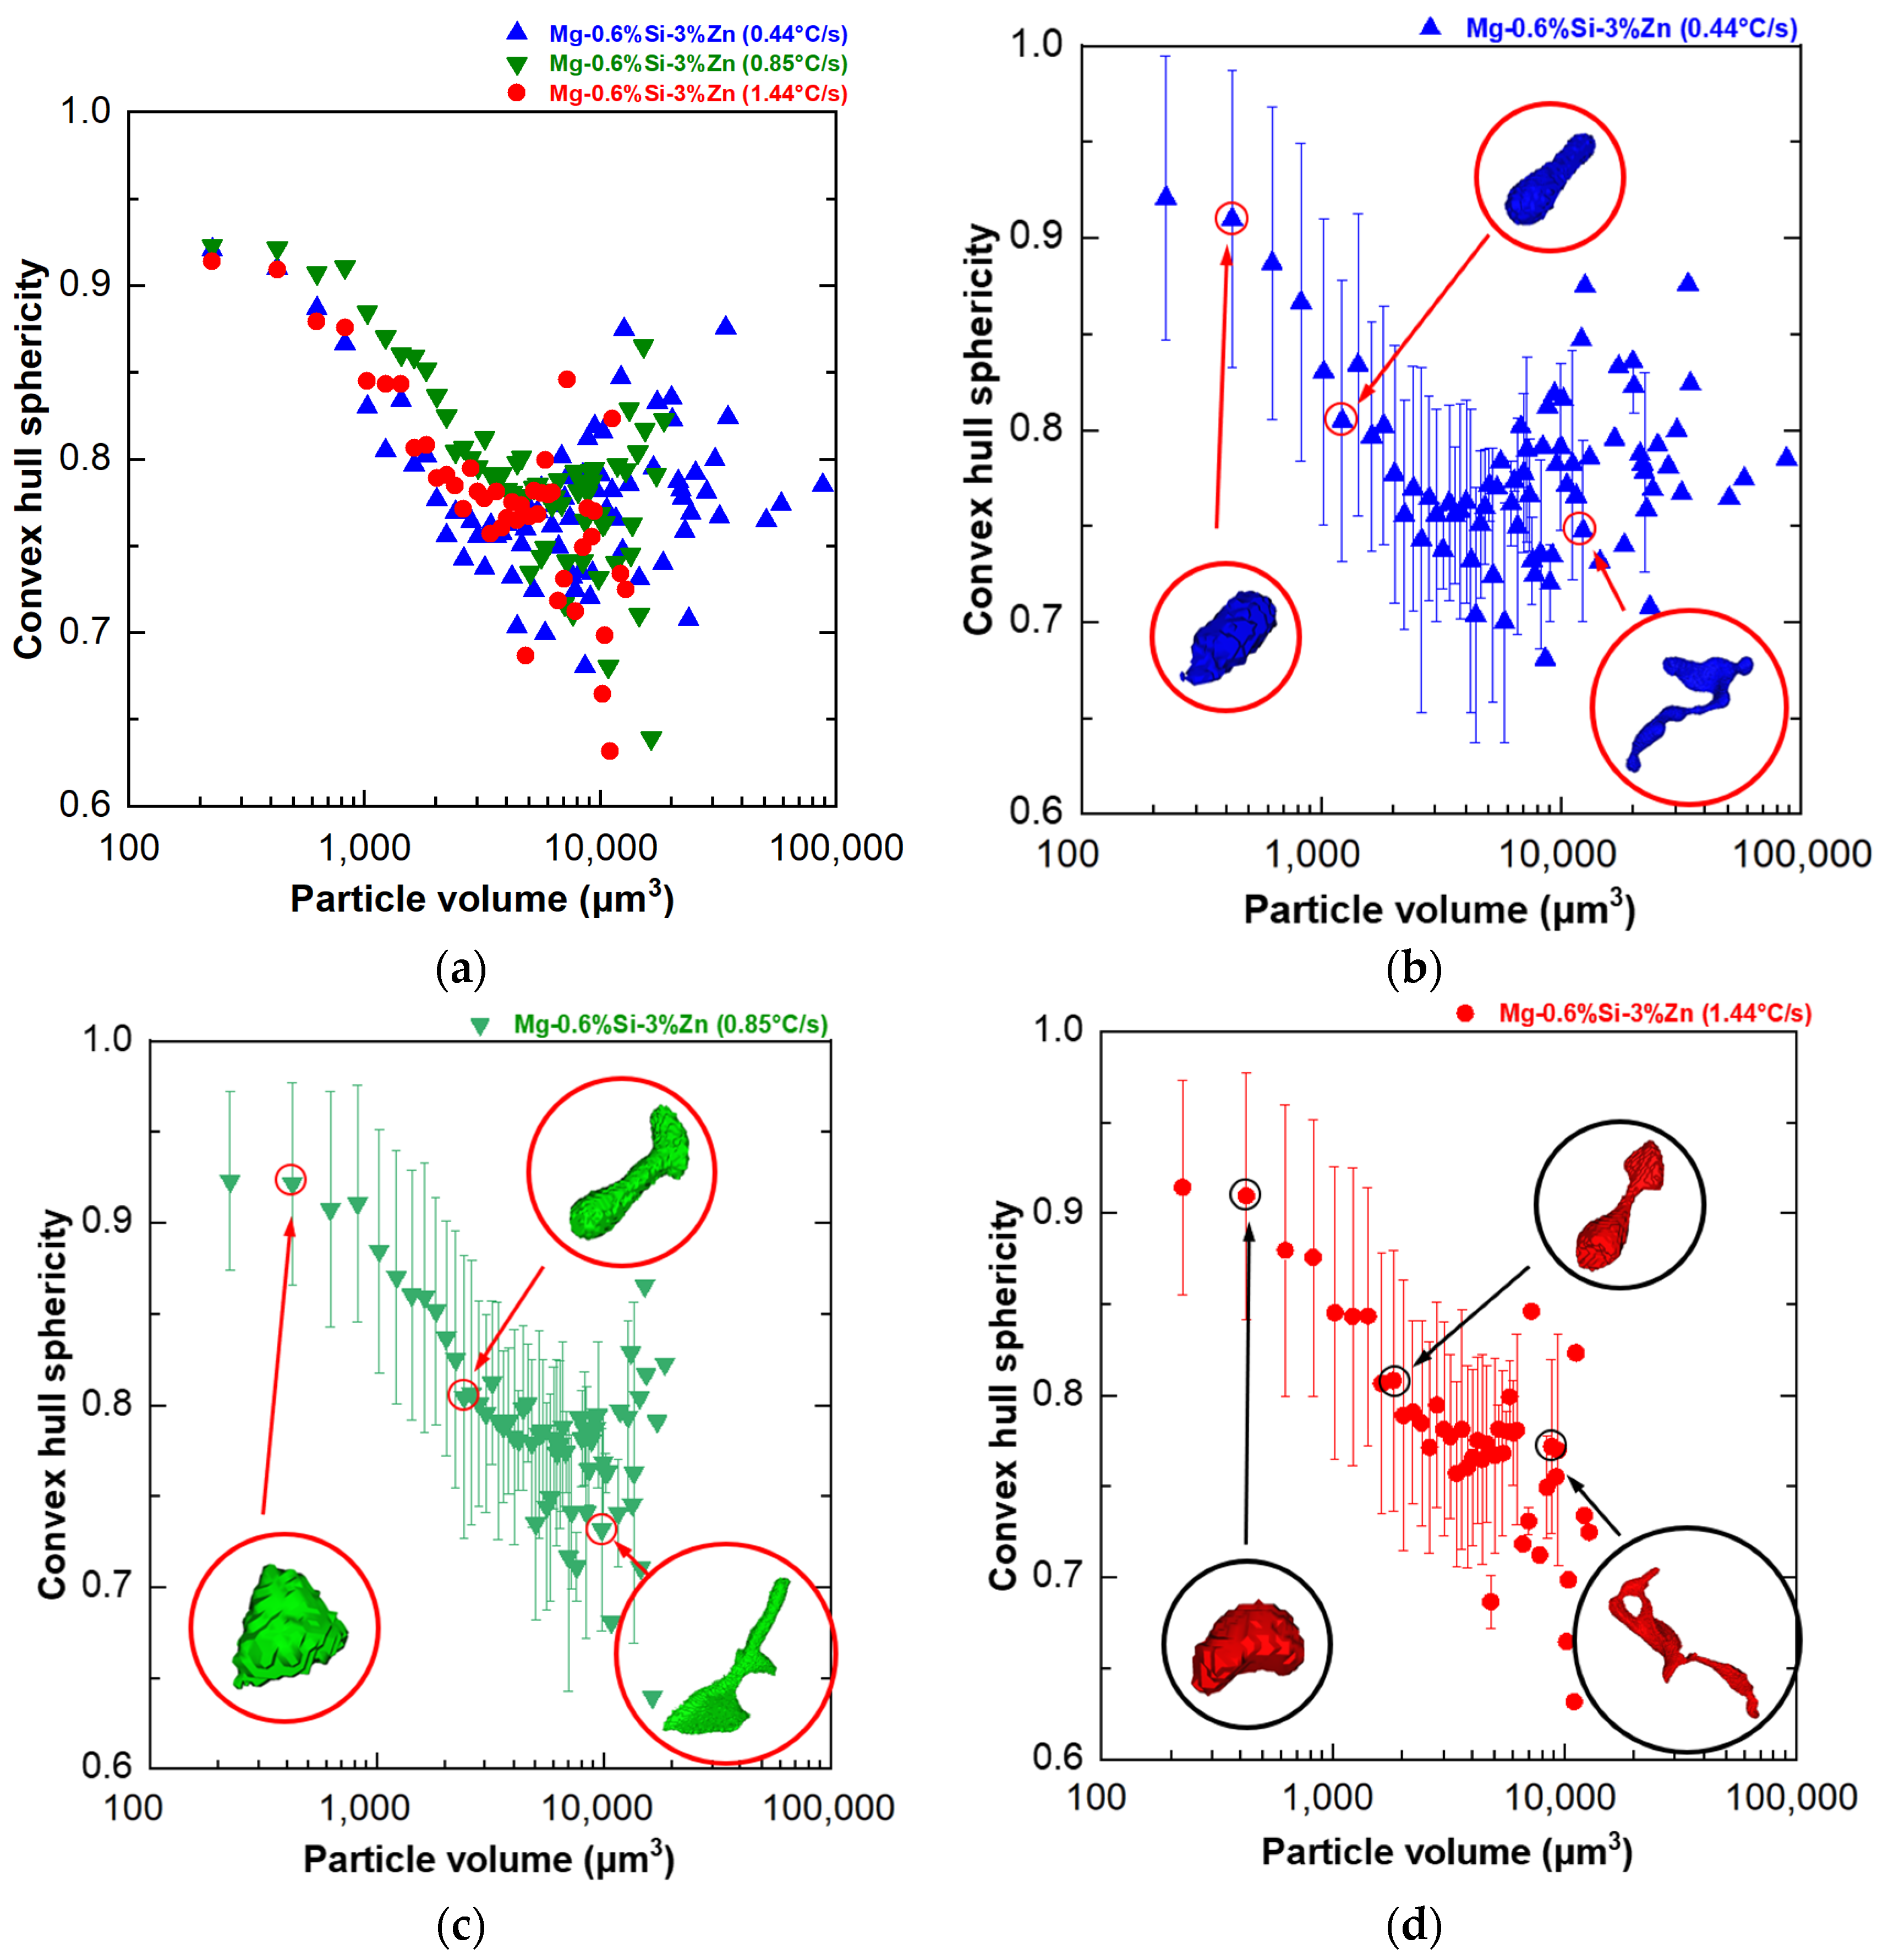
In addition to p, the sphericity of the convex hull(s) of the particles was also quantified to understand the overall shape anisotropy of the network of MgZn particles in the microstructure. A trend of decrease in the sphericity of the convex hull of particles(s) was observed in the 1000–10,000 µm3 particle volume range with an increase (decrease in anisotropy) observed for particles larger than 10,000 µm3;
(5)
The branching behavior of MgZn particles and their spatial distribution during the early stages of particle formation demonstrated that increasing the Zn content and maintaining low cooling rates facilitate branching. This branching behavior initiates the interconnected network observed in the literature through particle interconnection, underscoring the critical role of particle morphology in network formation.
(6)
Similar trends for p and s versus particle size were observed in particle morphology at different cooling rates and could be attributed to the similarity of dendritic structures within the cooling rate range of 0.44 °C/s to 1.44 °C/s, as indicated by the minimal variation in dendritic spacing.
The findings presented here open further avenues of research into the 3D microstructure of cast alloys. The findings and tools developed for this study can be applied to other alloy systems, beyond the biocompatible alloys presented in this paper, to understand the complex 3D microstructure of alloys and the impact of microstructure on the mechanical properties.

Author Contributions

Conceptualization, N.C., J.E.S., E.G. and G.L.d.G.; methodology, G.L.d.G., E.G. and N.C.; writing—original draft preparation, E.G. and G.L.d.G.; writing—review and editing, N.C., J.E.S., G.L.d.G. and E.G., visualization, E.G., G.L.d.G., S.K.M. and D.M.; supervision, N.C., J.E.S.; funding acquisition, J.E.S. All authors have read and agreed to the published version of the manuscript.

Funding

This research was partially funded by FAPESP (grants 2023/06107-3, 2022/01895-0 and 2019/01432-8) and Coordenação de Aperfeiçoamento de Pessoal de Nível Superior-Brasil (CAPES)-Finance Code 001.

Data Availability Statement

All data and analyses codes are available through the corresponding author upon reasonable request.

Acknowledgments

G.L.d.G. and J.E.S. acknowledge CNPq for the opportunity to conduct research in the School of Materials Engineering at Purdue University, USA and RIMA Industrial (Bocaiúva, Brazil) for providing the materials used in this study.

Conflicts of Interest

The authors declare no conflicts of interest.

References

  1. Ding, Y.; Wen, C.; Hodgson, P.; Li, Y. Effects of alloying elements on the corrosion behavior and biocompatibility of biodegradable magnesium alloys: A review. J. Mater. Chem. B 2014, 2, 1912–1933. [Google Scholar] [CrossRef] [PubMed]
  2. Hermawan, H. Updates on the research and development of absorbable metals for biomedical applications. Prog. Biomater. 2018, 7, 93–110. [Google Scholar] [CrossRef] [PubMed]
  3. Zheng, Y.F.; Gu, X.N.; Witte, F. Biodegradable metals. Mater. Sci. Eng. R Rep. 2014, 77, 1–34. [Google Scholar] [CrossRef]
  4. Merson, D.; Brilevsky, A.; Myagkikh, P.; Tarkova, A.; Prokhorikhin, A.; Kretov, E.; Frolova, T.; Vinogradov, A. The Functional Properties of Mg–Zn–X Biodegradable Magnesium Alloys. Materials 2020, 13, 544. [Google Scholar] [CrossRef] [PubMed]
  5. Ude, C.C.; Esdaille, C.J.; Ogueri, K.S.; Kan, H.-M.; Laurencin, S.J.; Nair, L.S.; Laurencin, C.T. The Mechanism of Metallosis After Total Hip Arthroplasty. Regen. Eng. Transl. Med. 2021, 7, 247–261. [Google Scholar] [CrossRef]
  6. Kim, K.T.; Eo, M.Y.; Nguyen, T.T.H.; Kim, S.M. General review of titanium toxicity. Int. J. Implant. Dent. 2019, 5, 10. [Google Scholar] [CrossRef]
  7. Riaz, U.; Shabib, I.; Haider, W. The current trends of Mg alloys in biomedical applications-A review. J. Biomed. Mater. Res. B Appl. Biomater. 2019, 107, 1970–1996. [Google Scholar] [CrossRef]
  8. Bigham-Sadegh, A.; Oryan, A. Basic concepts regarding fracture healing and the current options and future directions in managing bone fractures. Int. Wound J. 2015, 12, 238–247. [Google Scholar] [CrossRef]
  9. Burlingame, B. Editorial: What is a nutrient? J. Food Compos. Anal. 2001, 14, 1. [Google Scholar] [CrossRef]
  10. Chen, Y.; Xu, Z.; Smith, C.; Sankar, J. Recent advances on the development of magnesium alloys for biodegradable implants. Acta Biomater. 2014, 10, 4561–4573. [Google Scholar] [CrossRef]
  11. Vormann, J. Magnesium: Nutrition and metabolism. Mol. Asp. Med. 2003, 24, 27–37. [Google Scholar] [CrossRef] [PubMed]
  12. Staiger, M.P.; Pietak, A.M.; Huadmai, J.; Dias, G. Magnesium and its alloys as orthopedic biomaterials: A review. Biomaterials 2006, 27, 1728–1734. [Google Scholar] [CrossRef] [PubMed]
  13. Gu, X.; Zheng, Y.; Cheng, Y.; Zhong, S.; Xi, T. In vitro corrosion and biocompatibility of binary magnesium alloys. Biomaterials 2009, 30, 484–498. [Google Scholar] [CrossRef] [PubMed]
  14. Haynes, W.M. CRC Handbook of Chemistry and Physics; CRC Press: Boca Raton, FL, USA, 2014. [Google Scholar] [CrossRef]
  15. Mabuchi, M.; Kubota, K.; Higashi, K. Tensile strength, ductility and fracture of magnesium-silicon alloys. J. Mater. Sci. 1996, 31, 1529–1535. [Google Scholar] [CrossRef]
  16. Hu, X.S.; Wu, K.; Zheng, M.Y.; Gan, W.M.; Wang, X.J. Low frequency damping capacities and mechanical properties of Mg–Si alloys. Mater. Sci. Eng. A 2007, 452–453, 374–379. [Google Scholar] [CrossRef]
  17. Carlisle, E.M. Silicon. Nutr. Rev. 1975, 33, 257–261. [Google Scholar] [CrossRef]
  18. Henstock, J.R.; Canham, L.T.; Anderson, S.I. Silicon: The evolution of its use in biomaterials. Acta Biomater. 2015, 11, 17–26. [Google Scholar] [CrossRef]
  19. Carlisle, E.M. The nutritional essentiality of silicon. Nutr. Rev. 1982, 40, 193–198. [Google Scholar] [CrossRef]
  20. Nielsen, F.H. Update on the possible nutritional importance of silicon. J. Trace Elem. Med. Biol. 2014, 28, 379–382. [Google Scholar] [CrossRef]
  21. Martin, K.R. Silicon: The health benefits of a metalloid. Met. Ions Life Sci. 2013, 13, 451–473. [Google Scholar] [CrossRef]
  22. Wang, W.; Gao, M.; Huang, Y.; Tan, L.; Yang, K.; Hort, N. Microstructures, Corrosion and Mechanical Properties of Mg–Si Alloys as Biodegradable Implant Materials; Springer: Berlin, Germany, 2019. [Google Scholar] [CrossRef]
  23. Tapiero, H.; Tew, K.D. Trace elements in human physiology and pathology: Zinc and metallothioneins. Biomed. Pharmacother. 2003, 57, 399–411. [Google Scholar] [CrossRef] [PubMed]
  24. Ilich, J.Z.; Kerstetter, J.E. Nutrition in bone health revisited: A story beyond calcium. J. Am. Coll. Nutr. 2000, 19, 715–737. [Google Scholar] [CrossRef]
  25. Zhang, S.; Zhang, X.; Zhao, C.; Li, J.; Song, Y.; Xie, C.; Tao, H.; Zhang, Y.; He, Y.; Jiang, Y.; et al. Research on an Mg-Zn alloy as a degradable biomaterial. Acta Biomater. 2010, 6, 626–640. [Google Scholar] [CrossRef] [PubMed]
  26. Zhang, E.; Wei, X.; Yang, L.; Xu, J.; Song, C. Effect of Zn on the microstructure and mechanical properties of Mg–Si alloy. Mater. Sci. Eng. A 2010, 527, 3195–3199. [Google Scholar] [CrossRef]
  27. Zhang, B.P.; Wang, Y.; Geng, L. Research on Mg-Zn-Ca Alloy as Degradable Biomaterials—Physics and Chemistry; InTech: Rijeka, Croatia, 2011. [Google Scholar] [CrossRef]
  28. Zhang, E.; Yang, L.; Xu, J.; Chen, H. Microstructure, mechanical properties and bio-corrosion properties of Mg-Si(-Ca, Zn) alloy for biomedical application. Acta Biomater. 2010, 6, 1756–1762. [Google Scholar] [CrossRef]
  29. Cai, S.; Lei, T.; Li, N.; Feng, F. Effects of Zn on microstructure, mechanical properties and corrosion behavior of Mg–Zn alloys. Mater. Sci. Eng. C 2012, 32, 2570–2577. [Google Scholar] [CrossRef]
  30. Azghandi, S.H.M.; Weiss, M.; Arhatari, B.D.; Adrien, J.; Maire, E.; Barnett, M.R. A rationale for the influence of grain size on failure of magnesium alloy AZ31: An in situ X-ray microtomography study. Acta Mater. 2020, 200, 619–631. [Google Scholar] [CrossRef]
  31. Wang, Y.; Shuai, S.; Huang, C.; Jing, T.; Chen, C.; Hu, T.; Wang, J.; Ren, Z. Revealing the Diversity of Dendritic Morphology Evolution during Solidification of Magnesium Alloys using Synchrotron X-ray Imaging: A Review. Acta Metall. Sin. Engl. Lett. 2021, 35, 177–200. [Google Scholar] [CrossRef]
  32. Singh, S.S.; Schwartzstein, C.; Williams, J.J.; Xiao, X.; De Carlo, F.; Chawla, N. 3D microstructural characterization and mechanical properties of constituent particles in Al 7075 alloys using X-ray synchrotron tomography and nanoindentation. J. Alloys Compd. 2014, 602, 163–174. [Google Scholar] [CrossRef]
  33. Zhao, Y.; Du, W.; Koe, B.; Connolley, T.; Irvine, S.; Allan, P.K.; Schlepütz, C.M.; Zhang, W.; Wang, F.; Eskin, D.G.; et al. 3D characterisation of the Fe-rich intermetallic phases in recycled Al alloys by synchrotron X-ray microtomography and skeletonisation. Scr. Mater. 2018, 146, 321–326. [Google Scholar] [CrossRef]
  34. Sarvesha, R.; Alam, W.; Gokhale, A.; Guruprasad, T.S.; Bhagavath, S.; Karagadde, S.; Jain, J.; Singh, S.S. Quantitative assessment of second phase particles characteristics and its role on the deformation response of a Mg-8Al-0.5Zn alloy. Mater. Sci. Eng. A 2019, 759, 368–379. [Google Scholar] [CrossRef]
  35. Wang, M.Y.; Williams, J.J.; Jiang, L.; De Carlo, F.; Jing, T.; Chawla, N. Three Dimensional (3D) Microstructural Characterization and Quantitative Analysis of Solidified Microstructures in Magnesium-Based Alloys. Metallogr. Microstruct. Anal. 2012, 1, 7–13. [Google Scholar] [CrossRef]
  36. Bandi, B.; Santillana, B.; Tiekink, W.; Koura, N.; Williams, M.; Srirangam, P. 2D automated SEM and 3D X-ray computed tomography study on inclusion analysis of steels. Ironmak. Steelmak. 2019, 47, 47–50. [Google Scholar] [CrossRef]
  37. Li, Z.; Limodin, N.; Tandjaoui, A.; Quaegebeur, P.; Balloy, D. Effects of duration of solution heat treatment on the evolution of 3D microstructure in AlSi7Cu3 alloy: A quantitative X-ray tomography study. Mater. Charact. 2021, 173, 110919. [Google Scholar] [CrossRef]
  38. Wang, J.; Guo, Z.; Song, J.L.; Hu, W.X.; Li, J.C.; Xiong, S.M. Morphology transition of the primary silicon particles in a hypereutectic A390 alloy in high pressure die casting. Sci. Rep. 2017, 7, 14994. [Google Scholar] [CrossRef]
  39. Ma, Z.; Yang, Z.; Guo, Y.; Tao, D.; Li, J.; Wang, S. 3D morphology characterization of graphite and its effect on the thermal conductivity of vermicular graphite iron. Int. J. Mater. Res. 2019, 110, 591–599. [Google Scholar] [CrossRef]
  40. Díaz, F.V.; Peralta, M.E.; Fernandino, D.O. Study of Sphericity and Compactness Parameters in Spheroidal Graphite Iron Using X-ray Micro-computed Tomography and Image Processing. J. Nondestruct. Eval. 2021, 40, 11. [Google Scholar] [CrossRef]
  41. Subroto, T.; Mendis, C.; D’Elia, F.; Szakács, G.; Fife, J.; Hort, N.; Kainer, K.; Tolnai, D. 3D microstructural evolution on solidifying Mg–5Nd–5Zn alloy observed via in situ synchrotron tomography. Miner. Met. Mater. 2017, F8, 605–612. [Google Scholar] [CrossRef]
  42. de Gouveia, G.L.; Garcia, A.; Spinelli, J.E. Towards a morphological control of Mg2Si and superior tensile properties of high-Zn Mg-0.6Si (-Zn) alloys. Mater. Lett. 2021, 299, 130084. [Google Scholar] [CrossRef]
  43. Patnaik, S.; Ganju, E.; Yu, X.; Kang, M.; Park, J.; Kang, D.; Kamat, R.; Carsley, J.; Chawla, N. Advancing Sustainable Aluminum Alloy Development via Comprehensive 3D Morphological and Compositional Characterization of Fe-Rich Intermetallic Particles. Metall. Mater. Trans. A, 2024; in review. [Google Scholar]
  44. Ganju, E.; Kilic, M.; Prezzi, M.; Salgado, R.; Parab, N.; Chen, W.N. Effect of particle characteristics on the evolution of particle size, particle morphology, and fabric of sands loaded under uniaxial compression. Acta Geotech. 2021, 16, 3489–3516. [Google Scholar] [CrossRef]
  45. Stefanescu, D.M. Science and Engineering of Casting Solidification; Springer: Berlin/Heidelberg, Germany, 2015. [Google Scholar] [CrossRef]
  46. Kurz, W.; Fisher, D.J. Fundamentals of Solidification, 3rd ed.; Trans Tech Publications Ltd.: Bäch, Switzerland, 1992. [Google Scholar]
  47. Kapinos, D.; Augustyn, B.; Szymanek, M. Methods of Introducing Alloying Elements into Liquid Magnesium. Metall. Foundry Eng. 2014, 40, 141. [Google Scholar] [CrossRef]
  48. Beucher, S.; Lantueoul, C. Use of watershed in contour detection. In Proceedings of the International Workshop of Image Detection: Real Time Edge and Motion Detection, Rennes, France, 17–21 September 1979. [Google Scholar]
  49. Chen, S.; Tu, J.; Hu, Q.; Xiong, X.; Wu, J.; Zou, J.; Zeng, X. Corrosion resistance and in vitro bioactivity of Si-containing coating prepared on a biodegradable Mg-Zn-Ca bulk metallic glass by micro-arc oxidation. J. Non-Cryst. Solids 2017, 456, 125–131. [Google Scholar] [CrossRef]
  50. Ben-Hamu, G.; Eliezer, D.; Shin, K.S. The role of Mg2Si on the corrosion behavior of wrought Mg–Zn–Mn alloy. Intermetallics 2008, 16, 860–867. [Google Scholar] [CrossRef]
  51. Barber, C.B.; Dobkin, D.P.; Huhdanpaa, H. The quickhull algorithm for convex hulls. ACM Trans. Math. Softw. 1996, 22, 469–483. [Google Scholar] [CrossRef]
  52. Wadell, H. Volume, Shape, and Roundness of Quartz Particles. J. Geol. 1935, 43, 250–280. [Google Scholar] [CrossRef]
Figure 1. The experimental approach employed in the fabrication of directionally solidified alloys allows the production of Mg–Zn–Si alloys with compositional control and differential solidification rates within ingots.
Applsci 14 08081 g001
Figure 2. After casting, coupons of the cast alloys are extracted and prepared for X-ray Computed Tomography: extracted samples from the center of the cylindrical ingot were cuboidal in shape with a square cross-section and had an approximately 1.3 mm edge length. The samples were derived from multiple locations corresponding to different cooling rates within the ingots.
Applsci 14 08081 g002
Figure 3. Lab–scale X-ray Computed Tomography (XCT): (a) XCT carried out with a lab-scale X-ray Microscope (XRM) capturing 1600 radiographic projections of the samples at multiple orientations along a fixed axis of rotation and then processed using a filtered back projection algorithm to convert the projection space data to 3D tomographic data. (b) For the data acquisitions performed to enable maximum contrast between the different phases within the sample, a 30 keV average photon energy (highlighted in red) was chosen during X-ray scanning—allowing us to capture differences in X-ray absorptivity between matrix and Zn-rich phases within samples.
Applsci 14 08081 g003
Figure 4. Thermodynamic calculations of solidification processes of (a) Mg-0.6Si-2Zn and (b) Mg-0.6Si-3Zn alloys considering the equilibrium state.
Applsci 14 08081 g004
Figure 5. Energy-Dispersive Spectroscopy (EDS)-based elemental mapping of Mg-0.6Si-3Zn (at a cooling rate of 0.44 °C/s) shows the different intermetallic particles: (a) BSE image showing matrix (dark grey), high-density intermetallics (white, green arrow) and low-density intermetallics (lite grey, blue arrow); EDS data reveal that the low-density intermetallics have (b) high Si contents—suggesting Mg2Si, and (c) high Mg contents, while the high-density intermetallics are regions with (d) high Zn content, suggesting MgZn (stoichiometry quantified using point measurement of atomic fractions shown in next figure).
Applsci 14 08081 g005
Figure 6. Detailed image of the MgZn microconstituent observed through SEM-BSE in sample Mg-0.6Si-3Zn (at a cooling rate of 0.44 °C/s) showing the eutectic shape of the MgZn particles and the composition of the MgZn particle and surrounding matrix.
Applsci 14 08081 g006
Figure 7. After the acquisition of XCT data, it was critical to separate the Zn-rich phases from the rest of the microstructure of the alloys: (a) after initial filtration using non-local means filtration, the Zn-rich phase was segmented using a (b) simple greyscale thresholding technique, following which the individual Zn-rich intermetallic particles were (c) visualized in 3D and then individually separate following a (d) 3D watershed-based analyses, and then the separated particles were further analyzed to derive size and shape parameters (different colors in (d) are only used to represent the individual MgZn intermetallic particles following the watershed analyses).
Applsci 14 08081 g007
Figure 8. Particle morphologies within the alloys: after watershed analyses, the different particles within the alloys were extracted and it was observed that there were two extremes of particle morphologies present in the microstructure; (a) highly spherical particles tend to be smaller in size, while (b) larger particles tend to have a complex 3D network morphology.
Applsci 14 08081 g008
Figure 9. The convex hull (shown in red) as a function of the anisotropy of the spread of particles (shown in black): (a) spherical particles have a convex hull very close to the outer surface of the particles, hence the convex hull sphericity (s) is a close approximation of the sphericity of the particle itself; in contrast, for the case of (b), a particle with complex morphology with a more anisotropic spatial distribution will have a lower sphericity of convex hull (s); further, (c) a complex particle with more isotropic spatial distribution will have a higher sphericity of convex hull.
Applsci 14 08081 g009
Figure 10. Correlation of the ratio between particle volume and convex hull volume as a function of particle volume with composition variation: (a) the combined plot of p ratio for the Mg-0.6Si-2Zn and Mg-0.6Si-3Zn alloys as a function of particle volume shows that as the particle volumes increase, we see a drop in the p ratio, an indication of the particles becoming a complex network; (b) shows typical particle morphologies at the different size ranges for the Mg-0.6Si-2Zn, while (c) shows the typical particle morphologies at the different size ranges for the Mg-0.6Si-3Zn.
Applsci 14 08081 g010
Figure 11. Correlation of the convex hull sphericity with particle volume for different compositions: (a) the combined plot convex hull sphericity s for the Mg-0.6Si-2Zn and Mg-0.6Si-3Zn alloys as a function of particle volume shows that as the particle volumes increase, we see a drop in the s, indicating that the particles are becoming a complex network; (b) shows typical particle morphologies at the different size ranges for the Mg-0.6Si-2Zn, while (c) shows the typical particle morphologies at the different size ranges for the Mg-0.6Si-3Zn—the slight increases in the s value at very large particles indicate that the particles are growing in a more equiaxed manner as they get bigger.
Applsci 14 08081 g011
Figure 12. Correlation of the ratio between particle volume and convex hull volume as a function of particle volume with cooling rate variation: (a) the combined plot of p ratio for the Mg-0.6Si-3Zn alloy at three different cooling rates as a function of particle volume shows that as the particle volumes increase, we see a drop in the p ratio indicating the particles becoming a complex network; (b) shows typical particle morphologies at the different size ranges for the 0.44 °C/s rate, while (c) shows the typical particle morphologies at the different size ranges for 0.85 °C/s, and (d) shows the typical particle morphologies at the different size ranges for 1.44 °C/s.
Applsci 14 08081 g012
Figure 13. Convex hull sphericity as a function of particle volume with cooling rate variation: (a) the combined plot of convex hull sphericity for the Mg-0.6Si-3Zn alloy at three different cooling rates as a function of particle volume shows that as the particle volumes increase, we see a drop in the p ratio, indicating the particles become a complex network with an increase at larger particle volumes eventually; (b) shows typical particle morphologies at the different size ranges for the 0.44 °C/s rate, while (c) shows the typical particle morphologies at the different size ranges for 0.85 °C/s, and (d) shows the typical particle morphologies at the different size ranges for 1.44 °C/s.
Applsci 14 08081 g013
Table 1. Samples characterized to understand the impact of compositional cooling rate variance in the Mg–Si–Zn alloys include two different compositions (with different Zn wt.%) and three different cooling rates (°C/s).
Sample IDSi
(wt.%)
Zn
(wt.%)
Cooling Rate
(°C/s)
Mg-0.6Si-2Zn-0.480.620.48
Mg-0.6Si-3Zn-0.440.630.44
Mg-0.6Si-3Zn-0.850.630.85
Mg-0.6Si-3Zn-1.440.631.44
Table 2. X-ray fluorescence-based compositional analyses of the two ally compositions used in this study to assess the impacts of change in composition and change in cooling rate on the morphology of intermetallic particles within the alloys.
AlloyMgSiZnAlCaFeCu
Mg-0.6Si-2Zn97.4130.5801.9530.0410.0010.0070.002
Mg-0.6Si-3Zn96.3040.6542.9760.0530.0010.0080.001
Disclaimer/Publisher’s Note: The statements, opinions and data contained in all publications are solely those of the individual author(s) and contributor(s) and not of MDPI and/or the editor(s). MDPI and/or the editor(s) disclaim responsibility for any injury to people or property resulting from any ideas, methods, instructions or products referred to in the content.

